magnumold.magnum.co.in/magazinepdf/may 2009.pdf · d e c e m b e r may 2009 magnum d e c e m b e r...
TRANSCRIPT

D e c e m b e r May 2009
Magnum
D e c e m b e r May 2009
Magnum
PB 1
Magnum ConnectIssue No. IX May 2009
Monthly Magazine
Subscription :-Cover Price: Rs 30/-Annual Subscription (12 issues) : India Rs 300/-Overseas (Airmail) US$ 150(Cheque/D.D. drawn on Mumbai in favour of
Magnum Wealth Management Pvt. Ltd.Regd. Office :Mr. Piyush K. Upadhyay (Correspondent)Magnum ConnectD-13, Empire Mahal, 806, Dr. B. A. Road,Khodadad Circle, Dadar T.T.,Mumbai – 400 014.For General Enquiries Contact :+91-22-2415 8686E-mail : [email protected] : www.magnum.co.inPrinted at : HariOM Printers, Mumbai.
Dear Friends,Another good month for the market has passed, we would like to see the markets swaying in the same direction for some more time, but the turbulent phase cannot be avoided just by doing your part. Lots of things depend upon the external factors that are beyond our control and one such factor, which we are currently facing, is the ongoing general elections in the country. We are half-way through the mega event and still everything seems blurred with no clear conviction or clear consensus of any single party or group appearing on the forefront to form the government. Our today’s requirement is a stable government that can lead us to the path of growth amid this slowdown and guide the nation to stability.Friends, in the passing month India’s central bank – Reserve Bank of India – announced its annual review of monetary policy where the bank cut the repo and reverse repo rates by 25 basis points each, as a means to give signal to the markets that the apex bank will continue the aggressive stand. However, the apex bank left the cash reserve ratio (CRR) unchanged at 5%. While the banks considered it as meager, it has further given strength to the interest sensitive sectors like reality and auto .Though the rate cuts were more or less in line with market expectations, the most striking points that came from the policy was that the apex bank has pegged the GDP forecast for the FY10 at about 6%. This estimate though was on the optimistic side but has represented the fact that the current slowdown has seriously affected developing nations like, India, too. The results season is on, though the trends so far has been mixed with no any major setbacks barring few and further announcements will show how good or bad the final quarter was and the just-concluded fiscal for different companies. In this month, all the election formalities will get completed and the picture will get clear as to who will form the government at the Centre. A fractured mandate and a fragile government will definitely mar the sentiments of the market and can give a serious setback in coming months, on the same side if the mandate comes for a stable government, it will boost the sentiments.
VIJAY B. SHAH(Director)
Magnum Group
This document has been prepared by M/s Magnum Wealth Management Pvt Ltd and is being distributed in India byM/s. Magnum Wealth Management Pvt Ltd a registered broker dealer. The information in the document has been compiled by the research department.
Due care has been taken in preparing the above document. However, this document is not, and should not be construed, as an offer to sell or solicitation to buy anysecurities. Any act of buying, selling or otherwise dealing in any securities referred to in this document shall be at investor’s sole risk and responsibility.
This document may not be reproduced, distributed or published, in whole or in part, without prior permission from the CompanyM/s. Magnum Wealth Management Pvt Ltd
Subject only to Mumbai jurisdiction
IndexCover Story Cement ............................................................. 2Equity
Company Research........................................... 5 Stock Update..................................................... 7Corporate News................................................. 8Market Snapshot............................................... 10
EconomyQuick Review of Economy................................ 12Economy News................................................. 16
StatisticsScorecard : Banking......................................... 18 Dividend Yield..................................................20Sales............................................................... 21High PE ........................................................... 22Low PE ............................................................ 23 Price Trend...................................................... 24
Mutual FundSectoral Mutual Fund Analysis......................... 25MF Scorecard................................................... 26
StudyCurrency Futures............................................... 31FII Trends .......................................................... 33
InsuranceSystematics Investment Plan............................ 35ICICI Lombard - Car Insurance ........................ 36

D e c e m b e r May 2009
Magnum
D e c e m b e r May 2009
Magnum
2 3D e c e m b e r May 2009
Magnum
D e c e m b e r May 2009
Magnum
2 3
Cover Story - Cement
Cement: India’s construction story1. Introduction: The Indian cement industry with a total capacity of about 211.8 million tonne (MT) at the beginning of fiscal 2010 is the second largest market after China. Al-though consolidation has taken place in the Indian cement industry with the top five players controlling almost 50% of the capacity, the balance capacity still remains pretty fragmented.The industry had been on a roll for 4-5 years till second half of FY09. Driven by a booming housing sector, global de-mand and increased activity in infrastructure development such as state and national highways, the cement industry outpaced itself, ramping up production capacity, attracting the top cement companies of the world, and sparking off a spate of mergers and acquisitions to spur growth.2. A brief history of Indian cement industry: The attempt to produce cement in India dates back to 1889 when a Calcutta firm attempted to produce cement from argillaceous (kankar). But the first organized effort on mass scale to manufacture Portland cement commenced in Madras (now Chennai) in 1904, by South India Indus-tries. However, the effort did not succeed. It was in 1914 that the first cement manufacturing unit in India was set up and commissioned by India Cement Company at Porban-dar in Gujarat, with an installed capacity of 10,000 tonnes. Subsequently two plants; one at Katni (Madhya Pradesh) and another at Lakheri (Rajasthan) were set up. The industry grew rapidly in the pre-independence era with supply often off-stripping demand resulting in a price war. However, in the early years of independence, huge growth in infrastructure construction resulted in demand rising sharply and soon the supply side bottlenecks ap-peared. To ensure a smooth supply of cement and to bring in more regional balance, government controls were implemented through 1969 to 1982. Though this period witnessed increase in supply, significant disequilibrium in various aspects of industry forced the government to first partially (1982) and then fully (1989) deregulate the indus-try. Since then the industry has been growing rapidly in a competitive atmosphere. 3. Characteristic of Indian cement industry: The Indian cement industry is characterised by its regional and seasonal nature due to vast geography of the country and high energy intensity. 3.1 Regional nature: The viability of the location plays a major role in the economics of cement manufacturing. As such, a major defining feature of the Indian cement industry is the location of limestone reserves in select parts of country, which has resulted in it’s evolution in the form of clusters. The proximity to coal deposits constitutes another important factor in determining the location. As a result, the cement industry has strong regional character-istics. Further, since cement is a high bulk and low value
commodity, competition is also localized because the cost of transportation of cement to distant markets often results in the product being uncompetitive in those markets. 3.2 Energy Intensive: The cement industry is highly energy intensive and power costs form the most critical cost component in cement manufacturing, contributing about 35% to total cost of production. This also results in emphasis on technology and hence importance of scale economies. As a result, the market structure of cement has developed into typical oligopoly with small number of large firms in direct competition with each other along with large number of small companies playing role of atomistic producers*. 3.3 Seasonal Demand: Another distinguishing charac-teristic of the Indian cement industry is its cyclical nature, as the market and consumption is closely linked to climatic and agricultural cycles. In India, cement production nor-mally peaks in the month of March while it is at its lowest in the month of August and September (monsoon months). The cyclical nature of the industry has also helped the cause of consolidation in the industry as the large players are able to easily withstand the cyclic downturn in demand due to their economies of scale, operational efficiencies, centrally controlled distribution systems and geographical diversification etc. 4. Growth of the industry in liberalised period: The cement industry has been on a high growth path ever since liberalisation of the economy took place in early 1990s. In recent years, the infrastructure development de-rive of the government has also helped the industry pick up rapid pace.
Year Installed Capacity(Million Tonnes)
Production (MT)
Per Capital Consumption
1991-92 66.56 53.61 631995-96 97.25 69.57 721999-00 119.1 100.45 972003-04 157.48 123.5 1102007-08 198 168 150
*Small or atomistic producers are typically characterized by their lack in influencing either the industry supply or price and take these variables as given.
Fig 1 : Capacity and Production of Cement
0
50
100
150
200
250
1991-92 1995-96 1999-00 2003-04 2007-08
(millio
ns o
f to
nn
e)
Installed capacity
Production
Table 1: Growth of Cement Industry in Post-liberalisation Era
D e c e m b e r May 2009
Magnum
D e c e m b e r May 2009
Magnum
2 3D e c e m b e r May 2009
Magnum
D e c e m b e r May 2009
Magnum
2 3
Cover Story - Cement
Fig : 3 Region Wise Growth in Production
Fig 2 : Cement Production ( 2008-09)
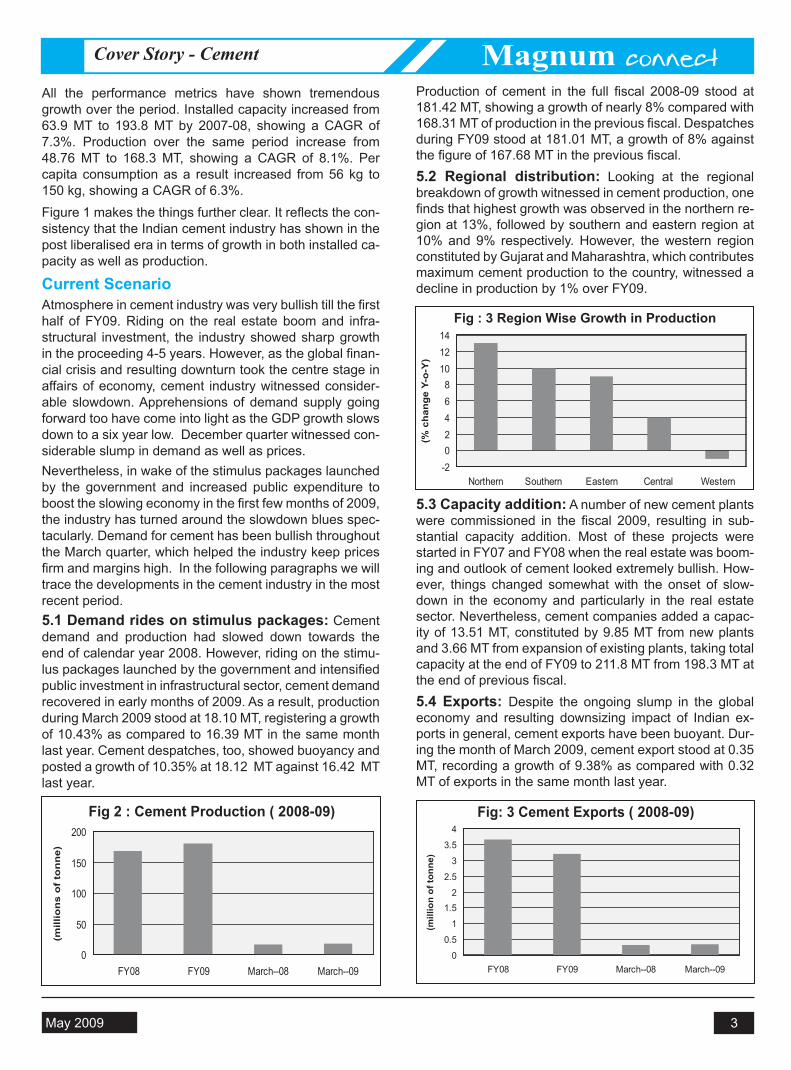
All the performance metrics have shown tremendous growth over the period. Installed capacity increased from 63.9 MT to 193.8 MT by 2007-08, showing a CAGR of 7.3%. Production over the same period increase from 48.76 MT to 168.3 MT, showing a CAGR of 8.1%. Per capita consumption as a result increased from 56 kg to 150 kg, showing a CAGR of 6.3%. Figure 1 makes the things further clear. It reflects the con-sistency that the Indian cement industry has shown in the post liberalised era in terms of growth in both installed ca-pacity as well as production.
Current ScenarioAtmosphere in cement industry was very bullish till the first half of FY09. Riding on the real estate boom and infra-structural investment, the industry showed sharp growth in the proceeding 4-5 years. However, as the global finan-cial crisis and resulting downturn took the centre stage in affairs of economy, cement industry witnessed consider-able slowdown. Apprehensions of demand supply going forward too have come into light as the GDP growth slows down to a six year low. December quarter witnessed con-siderable slump in demand as well as prices. Nevertheless, in wake of the stimulus packages launched by the government and increased public expenditure to boost the slowing economy in the first few months of 2009, the industry has turned around the slowdown blues spec-tacularly. Demand for cement has been bullish throughout the March quarter, which helped the industry keep prices firm and margins high. In the following paragraphs we will trace the developments in the cement industry in the most recent period. 5.1 Demand rides on stimulus packages: Cement demand and production had slowed down towards the end of calendar year 2008. However, riding on the stimu-lus packages launched by the government and intensified public investment in infrastructural sector, cement demand recovered in early months of 2009. As a result, production during March 2009 stood at 18.10 MT, registering a growth of 10.43% as compared to 16.39 MT in the same month last year. Cement despatches, too, showed buoyancy and posted a growth of 10.35% at 18.12 MT against 16.42 MT last year.
Production of cement in the full fiscal 2008-09 stood at 181.42 MT, showing a growth of nearly 8% compared with 168.31 MT of production in the previous fiscal. Despatches during FY09 stood at 181.01 MT, a growth of 8% against the figure of 167.68 MT in the previous fiscal. 5.2 Regional distribution: Looking at the regional breakdown of growth witnessed in cement production, one finds that highest growth was observed in the northern re-gion at 13%, followed by southern and eastern region at 10% and 9% respectively. However, the western region constituted by Gujarat and Maharashtra, which contributes maximum cement production to the country, witnessed a decline in production by 1% over FY09.
5.3 Capacity addition: A number of new cement plants were commissioned in the fiscal 2009, resulting in sub-stantial capacity addition. Most of these projects were started in FY07 and FY08 when the real estate was boom-ing and outlook of cement looked extremely bullish. How-ever, things changed somewhat with the onset of slow-down in the economy and particularly in the real estate sector. Nevertheless, cement companies added a capac-ity of 13.51 MT, constituted by 9.85 MT from new plants and 3.66 MT from expansion of existing plants, taking total capacity at the end of FY09 to 211.8 MT from 198.3 MT at the end of previous fiscal. 5.4 Exports: Despite the ongoing slump in the global economy and resulting downsizing impact of Indian ex-ports in general, cement exports have been buoyant. Dur-ing the month of March 2009, cement export stood at 0.35 MT, recording a growth of 9.38% as compared with 0.32 MT of exports in the same month last year.
Fig: 3 Cement Exports ( 2008-09)
0
50
100
150
200
FY08 FY09 March--08 March--09
(mill
ion
s o
f to
nn
e)
-202468
101214
Northern Southern Eastern Central Western
(% c
hang
e Y-
o-Y
)
0
0.5
1
1.52
2.5
3
3.5
4
FY08 FY09 March--08 March--09
(mill
ion
of to
nne)

D e c e m b e r May 2009
Magnum
D e c e m b e r May 2009
Magnum
4 5D e c e m b e r May 2009
Magnum
D e c e m b e r May 2009
Magnum
4 5
Cover Story - Cement
Total exports during the fiscal 2009 however have shown de-growth of 12.3%. India exported a total of 3.20 MT of cement in FY09 compared with 3.65 MT of cement export-ed in the previous fiscal. The decline primarily shows the impact of subdued exports in the first half of fiscal when commodity prices were soaring in India, local demand was surging.
5.5 Capacity utilisation shoots up in March: Buoy-ant cement demand during last few months, riding on higher demand from the infrastructure sector has pushed up capacity utilisation from poor levels witnessed towards end of calendar year 2008.
Further, increase in demand in March resulted in excep-tional rise in capacity utilisation to 103% from 92% in the month of February. Capacity utilisation in the full fiscal; however, has been lower at 88% compared with 94% in the previous fiscal, reflecting the impact of slowdown in cement industry during last quarter of 2008.
Outlook: After facing slowdown in last quarter of 2008, the cement industry has been performing very well in the first quarter of 2009. While demand from the real estate sector contin-ues to remain poor due to the ongoing severe downturn in the property market, increased investment in infrastruc-ture sector by the government has boosted the demand for cement from this segment.
As a result, there has been robust growth in both produc-tion and dispatches in the January-March quarter. Cement prices, which were facing a lot of downside pressure to-wards the end of 2008, have also stabilised in 2009, due to buoyant demand.
The country has witnessed cement dispatch growth of 9.98% at 18.06 million tonne (MT) during March this year, as against 16.42 MT during the corresponding month last year, according to Cement Manufacturers’ Associa-tion (CMA).The report says the total cement production in the country during March 2009 was 18.04 MT, up 10.06% over the figure of 16.39 MT reported during March 2008. The annual cement dispatch for fiscal 2008-09 posted a growth of 7.91% at 180.95 MT, compared to 167.68 MT
during 2007-08.
However, the upturn witnessed in the March quarter is rid-ing primarily in stimulus packages provided by the govern-ment and intensifying of public construction works in wake of the general elections. While the new government, which will take the office in June 2009 is expected to continue with measures to boost the economy, investment in the construction sector will come down from its exceptionally intense levels witnessed in January-March quarter.
As a result, the medium term prospects of cement do not look very strong at present. Demand supply mismatch, which was expected to hit the sector in early 2009, has only been delayed and as the demand softens in third quarter of current calendar, there may be significant over capacity, resulting in falling of capacity utilisation and hence margins.
The net effect of such demand-supply gap, however, will depend on nature and quantum of stimulus launched by the next government. Nevertheless, we expect the consump-tion growth in FY10 to slowdown by about 100-150 basis points compared with average of previous few years.
Talking of long term prospects with a time horizon of say more than couple of years, the cement industry possess-es excellent potential of returning to the high growth path witnessed over 4-5 years till FY09. Potential in growth of cement consumption is well reflected in the fact that even after recording around CAGR of 10% for last five years, per capita consumption of about 150 kg in India remains much below the world average of over 260 kg and more than 450 kg in China.
Further, as the global economy recovers and India moves back to growth rates of 8-9%, infrastructure investment too will grow at a rate in excess of 7-8%, thus providing ample scope of growth for the cement industry for many, many years to come. We may conclude the study by ob-serving that the cement industry has been one of the fast-est growing sectors in the liberalised history of India. Even though some doubts have been cast on the near term performance of the industry due the ongoing slowdown in global economy and its resulting downsizing impact on Indian economy, long run prospects of cement remains extremely healthy.
Capacity utilisation
80
85
90
95
100
105
FY08 FY09 March--08 March--09
(%)

D e c e m b e r May 2009
Magnum
D e c e m b e r May 2009
Magnum
4 5D e c e m b e r May 2009
Magnum
D e c e m b e r May 2009
Magnum
4 5
Company Research
UltraTech Cement SellUltraTech Cement was incorporated on August 24, 2000 as L&T Cement. Now, a $28 billion Aditya Birla Group company, it is the country’s largest exporter of cement clinker. The Aditya Birla Group that operates in 25 countries across the world is the 11th largest cement producer globally, the seventh largest in Asia and the second largest in India.UltraTech Cement has an annual capacity of 18.2 million tonnes. It manufactures and markets ordinary portland cement, portland blast furnace slag cement and portland pozzalana cement. It also manufactures ready mix concrete (RMC). The company has five integrated plants,
Stock Data (as on 29/04/09)
Current Mkt Price (Rs.) 567.60
52 week High (Rs.) 785
52 week low (Rs.) 250
Mkt Cap (Rs. Cr.) 7065.81
Return in last one Month (%) 6.93
Share Holding Pattern(as on Dec31,08) %
Total Promoter 54.78
Institutions 11.19
Non Institutions 33.88
Depository Receipt 0.15
Key Ratios
P/E 7.23
Price/Book(x) 3.60
Dividend Yield (%) 0.88
ROCE(%) 35.67
ROE(%) 37.37
Performance in the last year
six grinding units and three terminals – two in India and one in Sri Lanka.
ManagementThe management of the company is led by Kumar Mangalam Birla-Chairman, K C Birla is the Executive President & CFO, while other directors include Rajashree Birla, R C Bhargava, G M Dave, Y M Deosthalee, N J Jhaveri and few others. S Misra is the Managing Director of the company.
Business OverviewUltraTech Cement is the country’s largest exporter of cement clinker. The export markets span countries around the Indian Ocean, Africa, Europe and the Middle East. Individually it is the second biggest cement producer of the country, while together with Grasim it is the largest cement producer in India.The company’s products include ordinary portland cement, portland pozzolana cement and portland blast furnace slag cementThe company ensures a flawless operation in every stage, right from selecting raw materials to batching and mixing, transportation, placing of concrete till testing of concrete, putting together the right ingredients for perfect world class cement. The composite plants of the company are located at Tadipatri (Andhra Pradesh), Hirmi (Chhattisgarh), Jafrabad (Gujarat), Kovaya (Gujarat) and Awarpur (Maharashtra). The grinding units of the company are located at Magdalla (Gujarat), Ginigera (Karnataka), Ratnagiri (Maharashtra), Jharsuguda (Orissa), Arakkonam (Tamil Nadu) and Durgapur (West Bengal)
Investment Rationale The transport of concrete from its place of mixing to the delivery point is very critical, as there is possibility of the concrete drying out and losing its workability and plasticity. The company has got an edge on this point as the UltraTech Concrete transports concrete from its ready mix
0.00
100.00
200.00
300.00
400.00
500.00
600.00
700.00
800.00
30-Ap
r-08
30-M
ay-08
30-Ju
n-08
30-Ju
l-08
30-Au
g-08
30-Se
p-08
30-O
ct-08
30-No
v-08
30-De
c-08
30-Ja
n-09
28-Fe
b-09
30-M
ar-09
Date
Price

D e c e m b e r May 2009
Magnum
D e c e m b e r May 2009
Magnum
6 7D e c e m b e r May 2009
Magnum
D e c e m b e r May 2009
Magnum
6 7
Particulars March Qtr-09 March Qtr-08 Growth % FY08 FY07 Growth%Net Sales 1875.01 1601.66 17.07 6436.96 5508.78 16.85Total Income 1888.86 1628.69 15.97 6486.64 5609.07 15.64Other Income 13.85 27.03 -48.76 49.68 100.72 -50.68PBT 437.18 431.19 1.39 1361.46 1507.01 -9.66PAT 309.46 282.88 9.40 977.02 1007.61 -3.04OPM 29.96 27.56 -- 28.12 33.03 --NPM 16.50 14.56 -- 15.18 18.29 --EPS 24.86 45.40 -- 78.48 80.91 --
Company Research
concrete plants to the site through transit mixers. Further, the concrete is pumped to the actual point of concreting using high efficiency concrete pumps, Placing the concrete is expedited scientifically by specialised delivery trucks. Qualified and experienced engineers monitor the entire operation. UltraTech Concrete is equipped with computerised batching and mixing plants to strictly monitor the quality of the concrete. It uses a computerised recipe for the raw mix design and quantities of raw materials are weighed automatically as per the design mix.There has been a good appreciation in the cement dispatch figures for March keeping with growth trend seen in February, January, December and November. Industry observers expect the trend to continue in this quarter.
Latest result analysis F The company has posted a decline of 3.01% in its
consolidated net profit for the financial year ended March 31 at Rs 979.62 crore as compared to Rs 1,010.05 crore in the previous financial year.
F Net sales of the company during the year increased by 17.69% to Rs 6618.32 crore from Rs 5623.38 crore last year.
F The earning per share stood at Rs 78.57 against Rs 81.14 last year.
F The company reported a rise in its net profit after two consecutive quarters of decline.
F The net profit for the March quarter moved up by 9.39% to Rs 309.46 crore compared with Rs 282.88 crore in same quarter last year.
F Net sales during the three-month period improved by 17.06% to Rs 1,875.01 crore from Rs 1,601.66 crore in last year.
F The company reported a 230 basis points fall in operating margins at 29.2% in the fourth quarter.
F High input costs offset the company’s estimated 8.1% rise in cement realisations to Rs 4,166 per tonne in the fourth quarter of FY09.
INDUSTRY SCENARIOIndia is the world’s second largest producer of cement after China with industry capacity of over 200 million tonnes.
The Indian cement industry comprises of 134 large cement plants with an installed capacity of 173.08 million tonnes and more than 350 operating mini-cement plants across the country.Cement demand has a direct correlation with the GDP growth and had registered a growth of nearly 9% between FY06-FY08 driven primarily by strong demand from construction, infrastructure and real estate projects.
Latest developments Defending champions of IPL, Rajasthan Royals has signed a sponsorship deal with Ultratech Cement.Buoyed by improved demand, the Aditya Birla Group companies, Grasim Industries and UltraTech Cement, have recently raised prices by Rs 5-7 per bag.The Aditya Birla Group’s cement production for the period April-February 2009 has moved up by 5.23% at 290.09 lakh mt as against 275.67 lakh mt during April-February 2008. Dispatches grew by 5.25% at 289.71 lakh mt in April-February 2009 vis-a-vis 275.24 lakh mt in the corresponding period last year.
Recommendation FactorsIn its outlook, the company has said that a slow down in economic growth will aggravate the inevitable surplus in production capacity. The expected commissioning of an additional 50 million tonnes in FY10 and a further 15 million tonnes in the following year is likely to result in a reduction in capacity utilisation with adverse impact on margins.Additionally, the likely release of around 100 million tonnes capacity in a phased manner over the next two years coincides with slower economic growth. This will put pressure on sales realisation and margins in FY10.Volume increase to come up from commissioning of new capacities Cement prices currently ruling firm but likely to witness decline from Q1FY10.At current market price of Rs 569 (as on April 22, 2009), the stock is trading at a P/E of 7.3x and EV/EBITDA of 4.8x. We recommend a SELL on the stock as by the end of 2009-10 cement prices could start trending down as more capacity is commissioned and as new and smaller players look to establish themselves
(Rs. Cr.)
Standalone

D e c e m b e r May 2009
Magnum
D e c e m b e r May 2009
Magnum
6 7D e c e m b e r May 2009
Magnum
D e c e m b e r May 2009
Magnum
6 7
Stock Update
F ACC has posted Q4 pre-exceptional net profit at Rs4.08 bn owing to lower expenditure and lower power and fuel cost. Revenue for the quarter surged 14.4% to Rs20.5bn, mainly driven by 6.1% improvement in cement volumes (5.73mnt) and 7.9% increase in realizations to Rs3,587 per ton. It had a pre-exceptional EBIDTA for the quarter has spiked up 33.4% year-on-Year (y-o-y) basis to Rs6.28bn, while EBIDTA margins increased by 433 bps y-o-y to 30.5%,mainly on account of lower other expense.
F It has witnessed a reduction in power & fuel cost by 13.7% on quarter-on-quarter (Q-o-Q) basis on drop in international coal prices. ACC capacity expansion at Bargarh for 1.18 mtpa together with a 30 MW captive power plant is expected to be completed by mid CY2009.
F ACC remained firmed to keep its total cost per ton of cement to Rs2491, which is a meager 1.5% y-o-y increase thus clearly reflecting significant cost savings during the quarter. Further, the company continued to benefit on account of strong dispatch numbers and higher realizations on account of increase in cement prices on a pan India basis.
F Trading at a PE multiple of 10.1, the stock has an upside potential of 12% upsurges in near term, translating to the level of Rs 695-700. It is expected that ACC revenue to grow by a CAGR of 9.7% due to high fixed cost and low EBITDA per tonne, ACC’s earnings are highly sensitive to cement prices. It has been observed that for every 1% decline in cement prices, the EPS of the company reduces by 7.4%.
Last Traded Price (as on 29/04/09) Rs. 653.00
Price target Rs 695Market cap. in Rs cr. 12082.2152 Week H/L 790/369Free Float 53.79%BSE code 500410
ACC : Buy
F Shree Cements has reported Q4 FY09 net profit of Rs 235.6 crore from Rs 41 crore year-on-year. The company’s net sales spiked to Rs 806.2 crore as against Rs 662.5 crore YoY. Realization per bag is Rs 1 lower than last year’s overall realization. Volume growth is 28%. So, the realization is not per tonne, but the overall turnover is also higher by 28%. The cement prices have increased across the board and the rise has been undertaken on bagged cement.
F Excise duty relief has been given on the bulk cement and but the price increase is on the pack cement and in the pack cement no excise benefit has come. The price increase has been there on the retail sector. This maybe because of multiple things but the sector where the prices have not really increased, is the bulk cement, which is hardly 10% of the total production of the company.
F Due to the higher spending by the government in infrastructure projects, north India has successively posted a higher volume growth rate in the last quarter, compared to other regions and Shree Cement is expected to be the main beneficiary, as it has a strong presence in north India and also due to its relatively early expansion. On the back of strong demand, Shree Cement has raised cement prices by Rs4 to Rs6 per bag in the past couple of months (February-March).
F At the current market price of Rs776, the stock trades at 5.3 multiple and 8.8 multiple its FY2009 and FY2010 earnings estimate respectively, an enterprise value (EV)/earnings before interest, depreciation, tax and amortisation (EBIDTA) of 3.2x FY2010 and EV/tonne of $63 on expanded capacities of 10.1 million tonne. The stock has appreciated by over 45% since our last update on January 30, 2009. We maintain our Buy call on the stock with a revised 12-month price target of Rs825 (EV/tonne of $70 on expanded capacity).
Last Traded Price (as on 29/04/09) Rs. 776.00
Price target Rs 815Market cap. in Rs cr. 2702.8552 Week H/L 1045/330Free Float 53.79BSE code 500387
Shree Cements: Buy
PromoterInstNon Instt.
PromoterInst.Non InsttPublic
.
65.41%13.39%
10.13%
11.07%
46.21%
32.61%
21.18%

D e c e m b e r May 2009
Magnum
D e c e m b e r May 2009
Magnum
8 9D e c e m b e r May 2009
Magnum
D e c e m b e r May 2009
Magnum
8 9
Corporate News
GMR Group to exit non-core businesses The GMR Group, which has a strong presence in the infrastructure sector and has completed upgrading of domestic and international airports, is looking at exiting non-core business. The group has taken the decision in the wake of an overall cash crunch that has impacted infra projects in the country.The group has already hived off its ferro alloys business to Dubai-based Cronimet Mercon Invest for a consideration of around Rs 22 crore last year. It is currently in the process of offloading 30% stake in its sugar business to multinational Bunge, and plans to exit the sugar business in due time.The GMR Group has interests in agri business, ferro alloys, IPL, infrastructure and SEZ. Sahara takes Jet to court over non-payment of dues The Sahara Group, promoter of Air Sahara, which was acquired by Jet Airways in 2007, has taken the latter to court over default of dues worth Rs 1,450 crore that was part of the buyout deal.As per the deal, Jet was to pay Rs 900 crore to Sahara upfront, while Rs 137.5 crore was to be paid in yearly instalments over four years. Jet has reportedly defaulted on the annual instalments. Jet’s payout to Sahara in a single year’s default could be in the range of Rs 550 crore.Larsen & Toubro bags orders worth Rs 1100 crore in Q4 Turnkey engineering major Larsen & Toubro (L&T) has bagged a slew of large-value orders aggregating Rs 1100 crore in the electrical construction sector in the fourth quarter of 2008-09. The orders have come from leading public sector organizations like Power Grid Corporation of India (PGCIL) and the Rail Vikas Nigam and involve setting up high end transmission lines and substations as well as a project for the Indian Railways.RCom gets TDSAT nod for use of dual technology The Telecom Disputes Settlement and Appellate Tribunal (TDSAT), while hearing a petition filed by the Cellular Operators Association of India (COAI) that challenged the government’s decision to allow Reliance Communications to use dual technology (GSM and CDMA) for mobile services, cleared the latter’s use of dual technology.Criticising the COAI, the tribunal stated that GSM operators were not eligible for spectrum beyond 6.2 MHz. TDSAT also flayed the Telecom Regulatory Authority of India (TRAI) for mooting subscriber-linked criteria for allocating additional spectrum, which it claimed was not transparent.NMDC identifies potential partners for new coal blocks National Mineral Development Corporation (NMDC) has identified four prospective partners for developing new
coal blocks in India. The potential partners include Adani Power, KSK Power, Monnet Ispat and Sophia Power.NMDC had recently invited expression of interest’s (EoI) to develop the coal blocks jointly in the country. However, the company has not yet decided to take in multiple or single partners for the proposed joint venture. This depends on the allotment of fresh coal blocks.RIL begins gas production at KG-D6 block The Mukesh Ambani-led Reliance Industries (RIL) is reported to have started gas production at its Krishna-Godavari basin field creating a landmark in the history of oil and gas production in the country.The gas generated from the KG-D6 block is expected to boost the power supply from electricity generators starved of fuel and produce cheaper urea for agriculture.BHEL plans JV with foreign firm for Rs 1,200 cr Bharat Heavy Electricals (BHEL) is planning to invest around Rs 1,200 crore to form a joint venture with an international firm for manufacturing transmission equipment by June 2009.The company is currently in talks with a French equipment maker Areva and a Japan based Toshiba for forming a transmission joint venture by June 2009. The joint venture will manufacture transmission equipments having a capacity of 765 kilo volt (KV) and 1,200 KV.L&T to exit from infrastructure projects with minority stake Larsen & Toubro (L&T) is planning to exit from those infrastructure projects in which it holds minority stake (less than 50%). However, the company might bid in a consortium and take less than a 50% stake to diversify the risk in large and complex projects like urban metro.Bajaj Auto gets patent for its ExhausTEC technology Bajaj Auto has finally received a patent for its ‘ExhausTEC’ invention vide Patent No 231498 dated March 5, 2009 from the Indian Patent Office. The Pune-based company was involved in a controversy with TVS Motors as the two companies had clashed on issues related to technology infringement in 2007 when TVS developed the 125cc Flame using a technology similar to that of Bajaj.Videocon to mop up Rs 200 cr though preferential issue Videocon Industries has chalked out a plan to mop up Rs 200 crore through a preferential issue. The company’s has approved the issue of 1,17,65,000 crore warrants to Bennett, Coleman & Company (BCCL), which would be converted into equal number of equity shares, at a price of Rs 170 a piece.Upon conversion, BCCL’s holding in Videocon would rise to 6.13%. As on December 31, 2008 the former held 1.01% in Videocon, as per BSE data.

D e c e m b e r May 2009
Magnum
D e c e m b e r May 2009
Magnum
8 9D e c e m b e r May 2009
Magnum
D e c e m b e r May 2009
Magnum
8 9
Corporate News
Shareholders, creditors approve RIL-RPL merger The Mukesh Ambani-led Reliance Industries (RIL) has announced that the shareholders and the creditors of the company have approved the Scheme of Amalgamation of Reliance Petroleum (RPL) with RIL. Equity shareholders and secured and unsecured creditors of RIL took part in the meeting held on Saturday, April 4, 2009 and voted on the proposal. As per the media release by the company, 98.86% of the shareholders present in person/proxies, representing 99.9998% of the total value of the equity shares held by them, voted in favour of the Scheme of Amalgamation.Govt to finance Tata Motors’ Myanmar foray The government, which had signed an agreement with Myanmar offering the neighbouring country a $20 million line of credit, will finance Tata Motors’ plan of setting up a facility to assemble Tata Heavy Trucks in that country.The auto major is in the process of garnering a proper understanding of the project scope. The proposed plant will have an initial capacity of 1,500 trucks per year, with a provision for increasing the capacity as demand picks up.Govt appoints former AAI chief Ramalingam as Maytas Infra chairman The ministry of corporate affairs, on April 9, announced the appointment of K Ramalingam as the chairman of Maytas Infra, the company owned by the family of B Ramalinga Raju – the founder of the fraud-ridden Satyam Computer Services. Ramalingam is the former chief of the Airports Authority of India (AAI).The Centre has also appointed Anil K Agarwal on the board of Maytas Infra.Last month the Company Law Board had appointed noted tax lawyer O P Vaish and past president of Institute of Chartered Accountants of India Ved Jain on the board of Maytas Infra.Infosys Technologies reports 28.5% rise in consolidated profit IT services major Infosys Technologies, in its consolidated results for the year ended March 31, 2009, has posted a net profit after tax & minority interest rise of 28.52% to Rs 5,988 crore for the year ended March 31, 2009 as compared to Rs 4,659 crore in previous fiscal.Total income of the group has increased by 27.42% to Rs 22,166 crore from Rs 17,396 crore in the previous year.Infosys Technologies has also given a guidance for fiscal 2010, the revenues of the company is expected to grow by 1.7% to 5.7%; to decline by 6.7% to 3.1% in US dollar terms. Kingfisher again misses deadline to payback dues to IOC; seeks 10 days extension Kingfisher Airlines has missed deadlines of March 31 and April 10 to payback the dues to state-run Indian Oil Corporation (IOC) for jet fuel supplied by the refiner. The
airline has now sought a second extension of 10 days to settle the dues.The airline owes around Rs 1,000 crore to oil marketing companies like Hindustan Petroleum Corp (HPCL) and Bharat Petroleum Corp (BPCL) along with IOC. It has to settle dues amounting Rs 90 crore to IOC.L&T expects a 25-35% growth in order inflows for FY 2009-10 Larsen & Toubro (L&T) has come up with a strong order inflow outlook for 2009-10. The company recorded a healthy growth in order inflows during the fiscal 2008-09 and has bagged a number of prestigious orders, both domestic and international, from diverse sectors totalling approximately Rs 52,000 crore as compared to Rs 42,000 crore in the previous year.Wockhardt will finally sell minority stake in Wockhardt Hospitals The Wockhardt Group has finally decided to sell its minority stake in Wockhardt Hospitals, the hospital chain of the group, to reduce its debt burden of around Rs 3,700 crore.SBI to provide Rs 10,000 crore loan to Vodafone-Essar for 3G services State Bank of India (SBI) has decided to provide a loan of Rs 10,000 crore to Vodafone-Essar for financing the company’s foray into third generation (3G) telecom services, expansion of its broadband operations and various other business purposes. It will be a five-year loan carrying an interest rate of 13.25% for the first 2 years. Subsequently, the rate will be re-adjusted on the basis of the average prime lending rate of four public sector banks.Tech Mahindra completes the fund raising process for Satyam acquisition The new owner of scandal hit IT Company Satyam, Venturbay Consultants, a subsidiary of Tech Mahindra has informed that it has deposited Rs 2,910 crore in the escrow account. Venturbay is set to acquire total 51% stake in Satyam. It has raised the funds through non convertible debentures, commercial papers and borrowing from non-banking financial companies as well as partial funding from a special purpose vehicle and Rs 700 crore is raised internally.Tech Mahindra had agreed to buy Satyam for Rs 58 per share on April 13, 2009.GAIL among the 12 shortlisted for Nigeria gas field GAIL India has been shortlisted as prospective investors in Nigeria’s vast gas field. Besides GAIL, 11 foreign companies have also been short listed.The list of potential investors includes Russia’s Gazprom Oil and Gas, Germany’s E.ON Ruhrgas AG, UK based BG Group and Centrica Energy, Spain’s Gas Natural SDG SA and Union Fenosa and GAIL India.

D e c e m b e r May 2009
Magnum
D e c e m b e r May 2009
Magnum
10 11D e c e m b e r May 2009
Magnum
D e c e m b e r May 2009
Magnum
10 11
Indian equities markets ended on a positive note for the second consecutive month on the back of on the back of supportive global cues and continued buying interest shown by foreign institutional investors. This sudden ar-rival of foreign funds was perhaps a key reason for the strong rally witnessed by the local markets in the month. One thing evident was that there has been a considerable decrease of risk aversion, which was seen since last year. A fair amount of risk taking appetite was observed across all sections of investors.Indian markets also took heart as the world leaders reaching a $1.1-trillion deal to embark upon the global economic crisis at the G-20 summit added to optimism that the worst might be over for the world economy. Stock specific action was ob-served in the markets on account of announcement of profit numbers for the quarter and year ended March 2009.Though the benchmarks finally finished the month with positive gains, volatility did exist in the markets as inves-tors were seen booking profits after a rally in the past couple of weeks. Interestingly, there has been a sort of disconnect between the rally in the equities markets seen since past eight weeks and the continuing barrage of pes-simistic economic forecasts. Stock markets across the globe have seen an upmove, while the economic data shows that most economies continue to contract. Retail investors were seen cautious before making moves as they were aware that a sudden plunge in markets could be seen if the outcome of the general elections turns out to be something unexpected.Sensing a great opportunity from strong global cues, trad-ing on the local bourses have extended their gains fur-ther and substantiated by heavy buying in interest rate sensitive sectors like realty and banking in the mid of the month.
Domestic markets also took negative connotations amid rising uncertainties and gauged inflation figures adversely as heavy selling was witnessed in metal, realty, capital goods and power counters. Selling pressure was evident from dumping shares in hurry as the benchmark indices along with midcaps and smallcaps counters have taken a backseat and tweaked in tandem.The 30-share Bombay Stock Exchange’s (BSE) Sensex gained 1,694.75 points or 17.46% to 11,403.25, while the broader S&P CNX Nifty added 453 points or 15% to 3473.95 in the month of April 2009. Similarly, the BSE Mid-cap index surged 557.63 points or 18.86% to 3,513.86 and the BSE Small-cap index rose 694.27 points or 21.38% to 3,940.90.All sectoral indices on the BSE ended on a positive note in the month. Realty up 36.49%, Bankex up 26.59%, Capital Goods (CG) up 22.31%, Metal up 18.82% and TECk up 17.12% were the main gainers.Top gainers on the Sensex during the during the period be-tween March 31, 2009 and April 29, 2009 were Jaiprakash Associates 76.82%, ICICI Bank up 41.37%, Tata Motors up 40.66%, DLF up 39.47% and Rel Infra up 38.36%.Jaiprakash Associates has announced its result for the quarter and year ended March 31, 2009. The unaudited result for the quarter shows a net profit surge of 83% to Rs 385.32 crore against Rs 210.41 crore on Year on Year (YoY) basis. The total income stood at Rs 2,194.57 crore against Rs 1,345.28 crore showing a jump of 63% on YoY basis.ICICI Bank responded positively to the Reserve Bank of India’s (RBI) measure of reducing the benchmark repo and reverse repo rates by 25 basis points (bps). The bank has slashed its prime lending rate (PLR) by 50 bps to 16.25% effective April 22, 2009 and has also decided to reduce the deposit rates across various maturities by 25 to 50 bps, which will be applicable from April 24, 2009.On the other hand, Hindustan Unilever, down 2.03%, was the sole loser on the Sensex during the said period.For the third time with in two months, state-run oil market-ing companies (OMCs) on Wednesday raised prices of jet fuel, or ATF, this time by about 6.7%, in line with rising international rates. Indian Oil Corporation, Bharat Petroleum and Hindustan Petroleum hiked ATF prices by 10% on April 1 after a mar-ginal Rs 158 per kl increase two weeks earlier. ATF in Del-hi will now cost Rs 31,926 per kilo litre (kl) from April 16, as against Rs 29,925.97 per kl earlier. In Mumbai, ATF rates rose to Rs 32,855 per kl from Rs 30,784.81 per kl.The earnings and growth of the pharmaceutical sector is likely to take a hit in the last quarter of the just-concluded fiscal, as compared to the previous three quarters and is expected to be an underperformer during the fourth quar-ter of FY09.
Stocks in limelight on BSE Mid-cap index in AprilChange (%)
Jai Corp 115.99Anant Raj Inds 105.98BF Utilities 93.18HDIL 87.24Puravankara Projects 74.38
Sensex movement during April 2009
90009500
1000010500110001150012000
1-A
pr-0
9
2-A
pr-0
9
6-A
pr-0
9
8-A
pr-0
9
9-A
pr-0
9
13-A
pr-0
9
15-A
pr-0
9
16-A
pr-0
9
17-A
pr-0
9
20-A
pr-0
9
21-A
pr-0
9
22-A
pr-0
9
23-A
pr-0
9
24-A
pr-0
9
27-A
pr-0
9
28-A
pr-0
9
29-A
pr-0
9
Market Snapshot

D e c e m b e r May 2009
Magnum
D e c e m b e r May 2009
Magnum
10 11D e c e m b e r May 2009
Magnum
D e c e m b e r May 2009
Magnum
10 11
Market Snapshot
After the Reserve Bank of India (RBI) gave permission to domestic companies to buy back foreign currency con-vertible bonds (FCCBs) in December 2008, a dozen com-panies reacted in hurry to redeem such bonds worth $340 million at deep discounts to the conversion price in the melted markets, giving them a room for windfall gains.On one hand, buying back FCCBs companies pay off a loan at a discount, on the other hand they also earn a substantial windfall gain. To top it up, the deferment of AS11 mandate has relieved them from carrying the mark-to-market (MTM) losses for the redeemed FCCBs. Buying back FCCBs helps the domestic companies bring-ing down the liabilities on the company’s books as well as MTM losses provided for against the FCCBs. Hence, companies redeeming FCCBs are likely to gain from the practice and it will help them posting better results in the fourth quarter of the fiscal.As mentioned earlier, key reason of markets moving up at surprising speed in the month is that foreign institu-tional investors (FIIs) have been coming back in droves. The month saw of April saw a strong buying activity from FIIs, wherein the gross purchase of equities stood at Rs 38,871.55 crore against gross sales Rs 33,311.43 crore. As a result the FIIs emerged as net buyers of equities worth Rs 5,560.12 crore in the month.The world economy showed some mixed signals over last one month. There were good developments in US and China, suggesting the economy may be bottoming-out.
Close as on March 31 Close as on April 29 Change (points) Change (%)Sensex 9,708.50 11,403.25 1,694.75 17.46Nifty 3020.95 3473.95 453.00 15.00Mid-cap 2,956.23 3,513.86 557.63 18.86Small-cap 3,246.63 3,940.90 694.27 21.38
However, the good news was immediately followed by more bad news, raising serious doubts about any chances of an early recover. Adding to the woes of the policymakers, the country’s In-dex of Industrial Production (IIP) has again slipped in the negative zone to touch -1.2% vs 9.5% on a year-on-year (Y-o-Y) basis. February consumer durable goods also witnessed a negative growth at 3% as against 11.7% on Y-o-Y basis. The capital goods index, however, showed signs of strength posting a growth of 10.40% vs 10.70% on Y-o-Y basis, which is looking sustainable as the indus-try has a robust order book.India’s banking regulator Reserve Bank of India (RBI) has lowered its growth forecast for the current fiscal to 5.7%, down from 6% forecast of expansion that the bank had made three months ago.The RBI announced annual review of its monetary policy on April 21, 2009. The review came in back drop of sharp slowdown in economic activity in India, in line with the global economy suffering from severe slowdown. The bank cut the repo and reverse repo rates by 25 basis points (bps) each, primarily as a means to give signal to the markets that the apex bank will continue the aggres-sive stance it has taken since September last year to pro-tect growth and stimulating the slowing Indian economy. New repo and reverse repo rates will be 4.75% and 3.25% respectively. The bank however left the cash reserve ratio (CRR) unchanged at 5%.
Indices Close as on March 31 Close as on April 29 Change (points) Change (%)FMCG 2,036.24 2,095.00 58.76 2.89CD 1,625.45 1,757.58 132.13 8.13HC 2,830.11 3,067.98 237.87 8.40PSU 5,230.17 5,863.56 633.39 12.11Auto 3,061.67 3,498.24 436.57 14.26Power 1,847.10 2,112.76 265.66 14.38Oil & Gas 7,053.04 8,132.62 1,079.58 15.31IT 2,285.68 2,663.35 377.67 16.52TECk 1,846.83 2,163.00 316.17 17.12Metal 5,795.07 6,885.81 1,090.74 18.82CG 6,466.03 7,908.75 1,442.72 22.31Bankex 4,490.97 5,685.22 1,194.25 26.59Realty 1,560.83 2,130.41 569.58 36.49

D e c e m b e r May 2009
Magnum
D e c e m b e r May 2009
Magnum
12 13D e c e m b e r May 2009
Magnum
D e c e m b e r May 2009
Magnum
12 13
Quick Review of Economy
Monetary Policy India’s central bank Reserve Bank of India (RBI) announced the annual review of its monetary policy on April 21. The review came in the backdrop of a sharp slowdown in economic activity in India, in line with the global economy suffering from a severe slowdown. The Indian economy has slowed down to a six-year low with the quarterly expansion coming down to 5.3% for three months ending December 2008. In this wake, RBI was under a lot of pressure to take some further stimulus measures in its annual review, even if these come as a token of general stance. Before reviewing the monetary policy, it will be good to recall the conduct of monetary policy by the RBI since September 2008, when the US sub-prime problem officially turned into a global financial crisis impacting the world as well as the Indian economy. The fall of Lehmann Brothers resulted in freezing of global financial markets in the month of September last year. While Indian banks were not affected by the problem of toxic assets, the global deleveraging and resulting outflow of capital and frozen international markets resulted in acute cash crunch in Indian markets, too, forcing the RBI to loosen its monetary policy. Since September till the eve of annual review, the RBI had already cut the repo, the rate at which it infuses the short-term liquidity into markets and reverse repo, the rate at which it absorbs the excess liquidity from markets, by 400 and 250 basis points (bps) respectively. The bank had also cut the cash reserve ratio (CRR) by 400 basis points from 9% of net demand and time liabilities (NDTL) of banks to 5%. Together with CRR cut, increase in export credit refinance, special refinance Facility for banks and NBFCs etc, RBI had infused a total liquidity of Rs. 4,22,793 crore. As such, at the time release of monetary policy annual review the bank had already taken significant measures to keep the liquidity situation comfortable.
Annual Review for 2009-10The main thrust of the RBI’s policy was to ensure a policy regime that will enable credit expansion while preserving credit quality so as to support the return of the economy to a high growth path as well as preserve the price and financial stability of the system in wake of challenges being posed by the global financial crisis and its impact on the Indian economy. As such, the following are the main features of the annual review announced by the RBI on April 21. Major Policy Measures: The RBI cut the repo and reverse repo rates by 25 bps each, primarily as a means to give a signal to the markets that the apex bank will continue the aggressive stance it has taken since September last year to protect growth and stimulating the slowing the Indian economy. New repo and reverse repo rates stand at 4.75% and 3.25% respectively. The bank, however, left
the CRR unchanged at 5%. The bank rate was also left unchanged at 6%.
The special repo facility that the RBI introduced in September last year to provide financing to banks for meeting monetary needs of mutual funds arising out of excessive redemption pressure has been extended to March 31, 2010. The bank will conduct this repo on a weekly basis. The apex bank also extended a special refinance facility that was introduced on November 1, 2008 to provide funding to scheduled commercial banks up to 1% net demand and time liabilities (NDTL) as on October 24, 2008, to March 31, 2010.The RBI has also extended the relaxation on all-in-cost ceilings for external commercial borrowings (ECB) up to December 31, 2009. In view of the ongoing current global turmoil in the financial markets, the RBI has decided to continue, for the time being, with the current policy and procedures governing the presence of foreign banks in India. As per the ‘roadmap for presence of foreign banks in India’ which the apex bank has been following since beginning of FY065, the RBI was expected to review and expand the presence of foreign banks by allowing them to own controlling stakes in private Indian banks and enter into merger and acquisition with the latter. However, the review has been proposed and will be taken up after due consultation with all stakeholders once there is greater clarity regarding the stability of the global financial system and a shared understanding on the regulatory and supervisory architecture around the world.
Repo Rate since 2001
Reverse Repo Rate since 2001
0123456789
10
9/3/
2001
30-0
4-20
017/
6/20
0128
-03-
2002
12/1
1/20
027/
3/20
0319
-03-
2003
31-0
3-20
0426
-10-
2005
24-0
1-20
068/
6/20
0625
-07-
2006
30-1
0-20
0631
-01-
2007
30-0
3-20
0711
/6/2
008
24-0
6-20
0829
-07-
2008
20-1
0-20
083/
11/2
008
8/12
/200
82/
1/20
094/
3/20
0921
-04-
2009
(%)
012345678
2/2
0/20
01
3/2
/200
1
4/2
7/20
01
5/2
8/20
01
3/5
/200
2
6/2
7/20
02
10/
30/2
002
3/3
/200
3
8/2
5/20
03
10/
27/2
004
4/2
9/20
05
10/
26/2
005
1/2
4/20
06
6/8
/200
6
7/2
5/20
06
12/
8/20
08
1/2
/200
9
3/4
/200
9
(%)

D e c e m b e r May 2009
Magnum
D e c e m b e r May 2009
Magnum
12 13D e c e m b e r May 2009
Magnum
D e c e m b e r May 2009
Magnum
12 13
Quick Review of Economy
Monetary Projections: The RBI strongly mentioned its commitment to keep ample liquidity in the system in order the help the cause of growth. The bank observed that the liquidity overhang emanating from the surge in capital inflows witnessed during FY08 had substantially moderated in FY09. Further, the upside risks to inflation had declined substantially. As such, the bank placed money supply (M3) growth target for FY10 at 17.0%. Growth in non-food credit consistent with the monetary expansion has been targeted at 20%. The bank also projected the deposits of scheduled commercial banks to witness growth of 18% over FY10.
Growth Projection: Regarding the growth prospects of the Indian economy, the RBI observed that the fiscal and monetary stimulus measures initiated during 2008-09, coupled with lower commodity prices, could cushion the downturn in the growth momentum during 2009-10 by stabilising domestic economic activity to some extent. Nevertheless, it also added that any upturn in the growth momentum was unlikely in view of the projected contraction in global demand during 2009.
The bank in this wake placed its projection of GDP growth at 6% for the current fiscal. It may be mentioned that the median forecast in the survey of professional forecasts conducted by the RBI stood at 5.7% with respect to growth in FY10.
Government borrowing programme: RBI said in the annual policy review that one of the major challenges facing it was managing government borrowing. It mentioned that total borrowing need of the government during first half of FY10 was currently placed at Rs 2,07,364 crore.
However, the bank also signalled that ultimate supply of new securities into the market will be much less than the borrowing figure and also what was being expected by markets in recent months. The bank mentioned that after adjusting for MSS (market stabilisation scheme) unwinding and the Reserve Bank’s support by way of open market operations, net supply of fresh securities was expected to be of the order of Rs 85,364 crore. Although the fresh supply of securities would be higher than the first half of the last year, it would be of a much lower order as compared with the first half of 2007-08.
Inflation: With regard to inflation, the bank observed that the headline inflation measured by wholesale price index will remain negative during early part of the fiscal. However, RBI clearly said that the negative WPI inflation should not be interpreted as deflation and it had only statistical significance, not to be reflected in demand contraction in any way. RBI also observed that the sharp decline in WPI inflation had not been commensurately matched by a similar decline in inflation expectations, thus suggesting that RBI will have to continue to anchor inflationary expectation in the, particularly in the second
half of FY10. Union Finance: RBI expects the consolidated fiscal deficit of centre and state governments to reach the 9% mark, out of which 3% may be the contribution of states while the fiscal deficit of the Centre is expected around 6%. After including the off-budget and special securities issued by the central government outside the market borrowing programme, the total fiscal deficit may reach about 10.8% of GDP.
AssessmentOverall the credit policy was much in line with the market expectations. While the RBI avoided big ticket changes in policy stance in order to keep greater space with itself to manoeuvre the monetary policy once full budget for FY10 was out after the elections, it nevertheless did provided the signal markets were looking for through the 25 bps cut in both the policy rates. Further, RBI avoided placing any cap on deposits by commercial banks through the reverse repo window, a measure that was in talks among many quarters as means to check the yield on government securities. Such a measure could have proved overly distortionary and therefore it was probably in best interest that the RBI did not consider it. Another important detail in the policy was regarding the market borrowing programme of the government. The policy clearly specified that out of the total government borrowings in the first half of current fiscal, Rs 205,000 crore and Rs 120,000 crore was going to be through Open Market Operation (OMO) and Market Stabilisation Scheme (MSS) respectively, which leaves just Rs 85,000 crore to be raised incrementally through securities. While the announcement was aimed at calming the bond markets, it also reflected the commitment of RBI to keep the bond rates in check. Another important issue in the annual review is with regard to targeted (RBI however calls these indicators and not targets) monetary and credit expansions. The targets have been set at 17% and 20%, respectively, for growth in M3 and credit for FY10 against actual growth of 18.7% and 17.3% in FY09.Over past few years, there has been a wide deviation between targeted rates and the actual growth rates. For instance, target for of money supply expansion was at 14%, 15% and 17-17.5% for FY06, FY07 and FY08, respectively. However, riding on the bullish economy, the actual growth was above 20% in each of these years. Similarly, the growth for bank credit was anticipated around 20% in FY06 and FY07, whereas actual growth in credit was around 30% in both the fiscals. The target growth was revised upwards to 25% in FY09, bank credit grew merely 17%, suggesting the cautious

D e c e m b e r May 2009
Magnum
D e c e m b e r May 2009
Magnum
14 15D e c e m b e r May 2009
Magnum
D e c e m b e r May 2009
Magnum
14 15
behaviour of banks in view of slowing global economy. As such, it appears that monetary expansion has been overshooting or undershooting the RBI’s expectations depending on direction of trade cycle movement. As such, now that the economy is moving downwards, one may expect that the anticipated growth in money supply as well as credit delivery may fall short of targets or indicators set in the annual review. Finally, the bank has kept the economic growth projections and money supply and credit growth targets within reasonable reach. The bank has substantially lowered its growth target from 7% in previous review to 6% in the present one. This step indicates that the bank is keeping its feet on the ground and will approach the growth in a realistic way, which is a positive indication as far as RBI’s efforts to push the growth are concerned. On the whole we may observe that although the annual review might sound at some places a bit more bearish than expected, it nevertheless clearly outlines the fact that the bank will continue the aggressive stance to promote growth, a signal which the various players in economy desperately wanted.
Impact The major question facing the Indian economy at this stage is will and to what extent the policy rate cuts will lead to decline in banks’ retail rates. In this respect, the 25 bps rate cuts are not going to do much in terms of cutting the cost of funding for banks. Nevertheless, the RBI has by now cut the repo and reverse repo by 425 bps and 275 bps respectively and some substantial correction in the retail rates is due. What the rate cuts in policy review signify is that the RBI will uphold the aggressive policy stance it has been following to help the cause of growth. With regard top the retail rates being offered by commercial banks, most likely there will be a reduction going forward, although this may not be immediate. Banks have been parking a record daily average of Rs 1 lakh crore with the central bank through the reverse repo window, which fetch a return of 3.5% after the rate cut. While the decline of 25 bps in this rate is not large enough, it does give a signal to banks that his channel may not remain profitable in medium term and therefore may force them to enhance credit delivery in markets. The main reason why the rate cuts by the RBI have not transformed into the proportionate reduction in retail rate cuts by banks is that the financing costs of banks continue to remain relatively high. The fact is that banks have got locked into high cost medium-term deposits around the time of Lehman crisis and the average cost of deposits would go down as and when these high cost deposits run off. This is a process which will take place slowly and as the average cost of deposits comes down, there will certainly be more fall in prime lending rates (PLR) of banks
Reserve Bank of India (RBI) has said that slowdown was deepening in the Indian economy as the main indicators of growth showed significant moderation in a report prepared by the banking regulator. ‘Macroeconomic outlook of the Indian Economy’, based on various business expectations surveys, continues to exhibit the persistence of less than normal sentiments’, said the bank in its quarterly Macroeconomic and Monetary Developments report.
The professional forecasters’ survey conducted by the bank in December 2008 suggested further moderation in economic activity in 2008-09. ‘As reported by the respondents, the downside risks to growth seem to have amplified due to the projected global economic recession, deterioration in global financial markets and slowdown in domestic demand. The knock-on impact of the global downturn is visible as the main drivers of the growth process in the Indian economy have moderated during the third quarter of 2008-09’ said the bank.
The business expectations survey conducted by the central bank showed that the optimism for the quarters January-March 2009 and April-June 2009 based on major business sentiment indicators such as overall business situation, overall financial situation, production, order books, capacity utilisation, employment, exports, imports and profit margin significantly declined as compared to a year ago.
India’s growth trajectory has been hit hard by the ongoing economic slowdown and the capital outflows, sharp decline in exports and worsening sentiments have started telling on the actual economic expansion. Quarterly growth slowed down to lowest in more than five years in the three months ending December 2008 and most economists see the growth going further down for at least two more quarters before recovering.
India’s banking regulator Reserve Bank of India (RBI) said that there was more space with the monetary authority to further cut the policy rates even as it slashed key policy rates by 25 basis points (bps) in its annual review of monetary policy.
RBI Governor Duvvuri Subbarao said in an interview that there was more room for rate adjustments. “The room for adjustment has come down but that should not be read as a signal that there is no scope for further rate adjustment,’ he said.
However, he also added that this did not mean the RBI will necessarily cut rates in the near term. Earlier the apex bank cut its key lending rate for the sixth time in seven months on Tuesday and urged commercial banks to follow suit to promote the growth in a slowing economy that has taken a much bigger hit than was expected from the going global downturn.
Quick Review of Economy

D e c e m b e r May 2009
Magnum
D e c e m b e r May 2009
Magnum
14 15D e c e m b e r May 2009
Magnum
D e c e m b e r May 2009
Magnum
14 15
The RBI cut its repo rate, the rate at which it infuses short term liquidity into banks, to 4.75% from 5% and its reverse repo rate, at which it absorbs surplus cash from the banking system, to 3.25% from 3.50%.
India’s monetary authority Reserve Bank of India (RBI) said that short term prospects of growth of the Indian economy were expected to be mixed as it had taken a more than anticipated hit from the ongoing global economic crisis.
“India has sustained a greater than expected impact from the global economic crisis and has ‘mixed’ growth prospects for now,’ said D Subbarao, Governor of the central bank. He also added that GDP growth was slowing down, reflecting deceleration in production, negative export growth, shrinking corporate margins and slowing credit delivery growth.
Earlier the bank had lowered its projection of GDP growth at 6% for the current fiscal, in its annual review of monetary policy announced on April 21. While the RBI strongly mentioned its commitment to keep ample liquidity in the system in order the help the cause of growth, it accepted that there were signals of sharp slowdown in economy. The median forecast for growth in FY10 in the survey of professional forecasts conducted by the RBI stood at 5.7%, lowest in six years.
Mounting non-performing assets (NPAs) of the banks have led them to restructure loans worth Rs 80,000 crore in the last fiscal.
Tight liquidity conditions in the wake of the global financial crisis has prompted the Reserve Bank to give regulatory concession on restructuring to provide a breather to the corporate India.
Analysts believe that around 3% of the outstanding loans (Rs 80,000 crore) are to be restructured in the forth quarter of the last fiscal. It is believed that at over 3% of the outstanding credit, the incidence of restructuring is expected to be higher for PSU banks, as against 2% for private banks.
Inflation for the week ended April 18 stood up at 0.57% from 0.26%. Manufacturing index was up 0.3% and fuel index spiked up 0.1% (WoW), while primary articles index rose 1.7% (WoW).
The Reserve Bank of India has also announced to extend the concessional interest rate scheme for a further six months giving respite to exporters hit by shrinking global demand. The announcement came in wake of the deadline as the upper limit of interest on pre-shipment rupee export credit of up to 270 days and post-shipment credit of up to 180 days at BPLR minus 2.5% was due to terminate in the next few days.
In a memo to scheduled commercial banks the RBI said, ‘It has been decided to extend the validity of the scheme
to October 31, 2009’. However the announcement may fall short of exporters expectations who have been asking for credit at 7% without linking with the prime lending rate.
Majority of India’s export revenue comes from the US, Europe and the Middle East and exporters have been hit by a fall in demand in all these countries. For the first time in five years, India’s exports fell by 12.1% in October 2008 and have been unable to recover since.
The Reserve Bank of India has also announced to extend the concessional interest rate scheme for a further six months giving respite to exporters hit by shrinking global demand. The announcement came in wake of the deadline as the upper limit of interest on pre-shipment rupee export credit of up to 270 days and post-shipment credit of up to 180 days at BPLR minus 2.5% was due to terminate in the next few days.
In a memo to scheduled commercial banks the RBI said, ‘It has been decided to extend the validity of the scheme to October 31, 2009’. However the announcement may fall short of exporters expectations who have been asking for credit at 7% without linking with the prime lending rate.
Majority of India’s export revenue comes from the US, Europe and the Middle East and exporters have been hit by a fall in demand in all these countries. For the first time in five years, India’s exports fell by 12.1% in October 2008 and have been unable to recover since.
these things have been taken from Monthly Eco Review dated 20 April--
The outlook of the Indian economy continues to remain uncertain. India is getting increasingly coupled with the global economic downturn, through both the real as well as financial channels. However, the global scenario itself is uncertain and highly unpredictable at the moment. While some strength in expected in the near term to come from stimulus package being launched by the US government as well as some other developed countries, there remains doubts on how the governments will behave regarding foreign trade with some protectionism being already visible.
Further, any meaningful recovery in Indian economy, global economy will have to improve too. International Monetary Fund has already said that the year 2009 would be very difficult and recovery may be expected in 2010 if the global leaders pursue a coherent set of stimulus related policies while at the same time avoiding the protectionist tendencies.
Overall, we feel that outlook of Indian economy and the developing world in general has shown some improvement over the last one month. However, it is too early to reach any conclusion and one will have to wait for at least couple of quarters for some robust results to be discovered.
Quick Review of Economy

D e c e m b e r May 2009
Magnum
D e c e m b e r May 2009
Magnum
16 17D e c e m b e r May 2009
Magnum
D e c e m b e r May 2009
Magnum
16 17
Economy News
RBI hints at regulating NBFC holding cos On instance of the report compiled by the tax authorities, it has been found that many of NBFCs have transferred surplus funds earned earlier to their holding companies, which are currently regulated under the Companies Act, in the form of loans or dividends, the Reserve Bank of India (RBI) has decided in principle to bring under its ambit NBFC holding companies floated by business groups and companies.The move was prompted by the fact that the NBFCs had been frequently complaining of an acute shortage of funds despite receiving liquidity support from the government in consultation with RBI.Govt defers AS 11 till FY 11 Conceding to the suggestions of the National Advisory Committee on Accounting Standard (NACAS), the government has decided to defer the accounting standard 11 (AS-11) mandate deals with foreign exchange losses.The government is expected to come up with a notification that will give relief to India Inc on AS 11 stipulating to recognize foreign exchange losses in the profit and loss accounts every year. AS 11 suggests for mark-to-market provisioning in profit and loss account for foreign exchange related gains and losses.S&P, Fin Min discuss outlook downgrade issue Global rating agency Standard & Poor’s and officials from the ministry of finance have held talks to discuss the grounds for the rating agency downgrading India’s outlook from stable to negative.Late last month, S&P had downgraded its outlook on India’s long-term sovereign credit rating to negative from stable. It claimed that worsening government finances could increase the overseas borrowing costs for companies and weaken the Indian rupee.Govt directs cement cos to roll back price hike Cement companies have come under the wrath of government for charging higher prices despite asking for stimulus package. The government has also warned these companies it will not allow stimulus package to the industry unless it reduces the price of the commodity.Recently, cement companies increased the price by up to Rs 7 per 50 kg bag. The department of industrial policy and promotion (DIPP), in a strongly worded message told the Cement Manufacturers’ Association (CMA) that their decision of price increase was uncalled for. ARCs to benefit from new NPA transfer norms Asset reconstruction companies (ARC) – companies that deal in buying non-performing assets (NPAs) from banks and turning them into earning assets – may get an automated route through which the transfer of ownership of distressed assets that these buy from banks will be recognized by registrar of companies (RoC).
ARCs are mulling such a deal with the banks and the new system should be in place in a couple of months. The new norm will automate the transfer of ownership and all the rights associated with such transfer to ARCs. The change will be reflected in books of RoCs automatically too.India seeks G-7 anti-money laundering membership India has urged the G-7 nations for membership of the Financial Action Task Force (FATF), an inter-governmental body developing policies to combat money laundering and terror financing.At the Paris summit of G-7 in 1989, FATF, having 34 members today, was created for the purpose of developing and promotion of national and international policies to combat money laundering and terrorist financing. Corporate India mops up $14 bn via debt instruments in 2008-09 According to a latest data released from economic think tank Center for Monitoring Indian Economy (CMIE), India Inc has raised nearly $14 billion via debt instruments from the domestic primary market, mostly non-convertible debentures (NCDs) in the current fiscal 2008-09. Debt papers issuance in the domestic primary market rose 46.7% to $13.95 billion in the last fiscal, as compared to $9.51 billion in the previous fiscal.Civil aviation ministry asks carriers to cut capacity Domestic air carriers have been directed by the civil aviation ministry not to compete unfairly with each other and align schedules of their flights for better returns, as the domestic aviation industry is grappling with capacity woes and mounting losses. The civil aviation ministry has directed air-carriers to do away with the excess capacity on both foreign and domestic sectors and also reduce transit time to save on operational costs in the wake of losses incurred by different players in the industry including Indian Airlines and Jet Airways.Highway developers now securitize toll projects to raise funds As cash-starved highway developers are finding it difficult to fund their ambitious plans, they have got a new lease of life by keeping their completed toll road projects as security with banks and financial institutions to raise money to fund new projects. Many highway developers are resorting to securitize their road projects developed under build-operate-transfer (BOT) model in order to benefit the lender by the cash flow through toll collections. Auto ancillary to shift production mix to aerospace, defence sector The Indian auto ancillary industry, facing idle capacity concerns in the wake of the worldwide economic slump, is

D e c e m b e r May 2009
Magnum
D e c e m b e r May 2009
Magnum
16 17D e c e m b e r May 2009
Magnum
D e c e m b e r May 2009
Magnum
16 17
Economy News
now lured by the opportunities in making products for the emerging aerospace and defence sectors. Companies including Bharat Forge, Amtek Auto, Tata Automobile, Lumax Auto, Mahindra Systech, the JBM group and Sundram Fasteners, having more than half of the total revenue generated by the auto component industry, have now been shifting the production portfolio.Iron ore exports surge by 17% in February Buoyant demand from China has led India’s iron ore exports rising by 17% in the month of February. Total iron ore exports of India touched 12.6 million tonne in February 2009 compared with 10.8 million tonne in the same month last year.Major reason for the increase has been revival of demand from Chinese steel producers. Chinese government’s massive stimulus package has boosted the demand of steel in China resulting in higher demand for Indian iron ore too. Govt sets up committee for revival of jute industryConcerned over the prospects of the ailing jute industry, the government has set up a high-level committee comprising members from finance and labour ministries, labour unions and the The Indian Jute Mills Association (IJMA).The newly established committee is expected to examine issues related with costing, statutory obligations and agreement, and training in the jute industry, under three different sub-committees.RBI pegs GDP forecast for FY10 at 6%The Reserve Bank of India (RBI) has cut the repo and reverse repo rate by 25 basis points each. The repo rate has been cut to 4.75 % from the existing 5 % while the reverse repo has been cut to 3.25 % from the existing 3.5%, on the same time the CRR rate has been left untouched at 5%. Though the rate cuts were more or less on the lines of the market expectations, the most striking points that came from the policy is that the apex bank has pegged the GDP forecast for the FY10 at about 6%.RBI to extend greater credit to exportersThe Reserve Bank of India announced on Tuesday that it would extend the concessional interest rate scheme for a further six months giving respite to exporters hit by shrinking global demand. The announcement came in wake of the deadline as the upper limit of interest on pre-shipment rupee export credit of up to 270 days and post-shipment credit of up to 180 days at BPLR minus 2.5% was due to terminate in the next few days.In a memo to scheduled commercial banks the RBI said, ‘It has been decided to extend the validity of the scheme to October 31, 2009’. However the announcement may fall short of exporters expectations who have been asking for credit at 7% without linking with the prime lending rate.
ADB projects Asian equity markets recovery in HY 09According to the Asian Development Bank (ADB) report, Asian equity markets are likely to recover in the second half of 2009 on the back of aggressive central bank policies including fiscal and monetary stimulus packages by various governments.Stimulus policies resorted by government is expected to strengthen the current rally and contribute to better equity performance in the second half of the calendar year. Citing the rally witnessed in recent weeks, the report says the rally is mainly due to rising hopes of an early revival for the global economy.RBI introduces Basel-1 norms for RRBsRBI, in a move to bring regional rural banks (RRBs) at par with international conformity of Basel-I framework, has announced introducing capital to risk-weighted assets ratio norms (CRAR) for RRBs, after consultation with National Bank for Agriculture and Rural Development (NABARD).The move has come in the wake of recommendation made by Rakesh Mohan Committee for Financial Sector Assessment (CFSA). Unlike commercial banks which are exposed to systematic risks in the economy, RRBs are relatively distant from such risks given their small size of operation. However, the CFSA report has emphasize woes over their asset quality and their sub standard debt recovery mechanism.Disbursal under stimulus package worth Rs 9K cr to MSMEs sectorBanks have sanctioned nearly Rs 8,500-9,000 crore to micro, small and medium enterprises (MSMEs) in the last few months as a part of the stimulus packages announced by the government. The MSME sector contributes nearly 45% to the country’s total industrial production. On recommendation of SIDBI, banks are expected to double the amount released to the MSME sector. The government had announced various stimulus packages to the industry, mainly to the export units, MSMEs and commercial vehicles to combat the impacts of the global economic slowdown.Core sector posts highest growth in March since Sept.India has witnessed production growth in the six core infrastructure industries during the month of March at 2.9%, which is the highest since September last year. The March figures indicate some amount of recovery in the Indian economy. The figures of March are expected to cushion the fall in Index of Industrial Production (IIP), as it constitutes 27% of the index. IIP shrank by 1.2% in February 2009, the most in the last two decades. During the period of April-March 2008-09, the sector witnessed a growth of 2.7%, as against 5.9% in the year-ago period.

D e c e m b e r May 2009
Magnum
D e c e m b e r May 2009
Magnum
18 19D e c e m b e r May 2009
Magnum
D e c e m b e r May 2009
Magnum
18 19
Scorecard : Cement
Company Name
YearEnd
NOMEquity
Rs. Mn.FV Promoter
Stk % BVRs.
RONW(%)
Sales Rs. Mn.
Sales Var (%)
OPM(%)
NP Rs.Mn.
NP Var (%)
DIV (%)
CPS(Rs.)
ACC 200812 12 1876.80 10 46.21 262.55 26.71 74741.53 6.66 27.05 12127.84 -15.70 200 80.29
Ambuja Cement 200812 12 3045.20 2 46.46 37.23 27.17 62817.10 10.11 31.10 14022.70 -20.74 110 10.92
Andhra Cements 200903 18 1258.53 10 72.99 0.95 ---- 3711.20 -16.14 16.39 630.10 -14.81 ---- 4.84
Anjani Portland 200803 12 183.90 10 61.44 23.03 45.54 1030.68 15.90 31.76 163.11 30.47 15 10.57
Barak Valley 200803 12 221.60 10 60.49 32.91 18.47 703.14 ---- 28.57 110.03 ---- 20 7.08
Binani Cement 200903 12 2031.01 10 64.91 20.56 48.92 14973.20 53.00 20.46 1086.60 -38.19 25 9.30
Binani Inds 200903 12 295.96 10 51.28 54.59 9.42 470.60 ---- 60.75 211.10 41.39 30 7.24
Birla Corp 200803 12 770.05 10 62.90 129.41 47.61 17247.80 10.08 35.58 3935.70 20.64 40 56.49
Burnpur Cement 200803 12 430.04 10 47.29 12.70 4.07 270.34 ---- 16.38 14.18 ---- ---- 0.49
Chettinad Cement 200803 12 295.00 10 85.03 133.05 49.95 9301.80 28.25 37.30 1637.70 42.77 100 83.13
Dalmia Cement 200803 12 161.69 2 56.19 132.94 39.68 14806.70 50.10 42.78 3471.50 51.64 200 53.56
Deccan Cements 200803 12 70.04 10 54.63 198.22 41.33 2092.15 21.85 38.00 479.66 68.75 30 76.78
Everest Industries 200803 12 148.00 10 50.09 95.50 10.38 2851.40 -6.13 11.35 143.20 22.81 40 16.19
Heidelberg Cem.(I) 200812 12 1580.10 10 68.55 20.53 35.43 8044.99 35.31 16.54 1255.26 28.54 ---- 6.48
Hyderabad Inds. 200803 12 74.63 10 42.19 195.08 9.99 4827.10 9.78 8.36 140.80 -18.38 50 33.77
India Cements 200803 12 2818.67 10 28.02 91.26 32.48 35544.70 73.41 31.81 6856.80 52.54 20 28.81
J K Cement 200803 12 699.27 10 63.80 108.72 41.63 14583.00 18.24 29.05 2652.00 48.49 50 43.80
JK Lakshmi Cem. 200803 12 611.80 10 45.66 103.74 43.70 11076.60 31.27 30.42 2236.70 25.58 25 46.13
Kakatiya Cem. Sugar 200903 12 77.74 10 48.32 135.30 17.28 1702.93 3.51 23.07 213.12 36.35 24 37.86
Katwa Udyog 200803 12 51.24 10 58.81 12.08 15.47 157.56 91.03 15.19 9.59 161.31 10 2.73
KCP 200803 12 128.92 10 46.26 147.28 40.01 4035.60 37.12 27.53 635.30 31.56 100 55.67
Mangalam Cement 200903 12 282.47 10 27.07 76.72 63.27 5661.36 11.03 28.62 971.64 -14.43 50 43.32
NCL Industries 200803 12 325.04 10 43.26 30.48 34.42 1927.30 20.28 36.35 295.69 10.21 25 11.98
OCL India 200803 12 113.80 2 69.77 97.20 25.32 8928.20 10.46 24.62 1138.00 58.58 125 24.62
Prism Cement 200903 9 2982.50 10 61.74 22.18 15.04 6298.60 ---- 28.55 962.30 ---- 15 4.04
Rain Commodities 200812 9 321.10 10 42.89 99.86 12.32 11121.60 140.70 17.29 850.60 -0.56 28 15.18
Ramco Inds. 200803 12 43.33 10 50.54 567.57 10.82 3444.30 17.51 24.57 254.80 4.77 150 123.88
Sagar Cement 200803 12 133.37 10 44.16 78.55 34.91 2231.43 98.35 25.81 309.56 11.89 25 23.39
Sanghi Industries 200803 12 2199.80 10 51.01 26.92 19.77 8465.10 ---- 33.95 1063.90 ---- ---- 8.49
Saurashtra Cement 200812 18 511.91 10 64.42 0.10 ---- 7286.51 ---- 7.56 -481.53 ---- ---- -4.17
Shree Cement 200803 12 348.37 10 65.41 193.13 46.19 21091.18 54.18 44.36 2992.56 69.07 80 223.33
Shree Digvijay Cem 200803 12 1413.74 10 73.63 2.04 ---- 2540.80 -0.46 -2.62 -140.20 -126.24 ---- -0.54
Ultratech Cement 200903 12 1244.90 10 54.78 216.58 45.18 64369.60 16.85 28.12 9770.20 -3.04 50 104.43
Vinay Cements 200803 12 189.00 10 0.00 39.97 5.03 406.98 -16.77 17.07 29.42 -71.19 ---- ----
Visaka Inds. 200803 12 158.81 10 37.70 100.28 4.87 4331.31 14.22 10.29 76.73 -67.67 30 14.69
Scorecard Legends : NOM - Number of Months for which P& L a/c is prepared by the companies, Equity Rs.Mn - Latest Paid Up Capital of the Company, FV-Latest Face values of equity Shares, Promoter Stk % - Its promoter holding in the equity capital of the company as per latest shareholding pattern, BV Rs. - Book Value Per Share is calculated as (Equity + reserves ) / No of Equity shares, RONW - Return on Net Worth is calculated as {(Net profit - preference capital)/ Shareholder’s Fund }*100.Share- holders funds includes Equity Paid Up + Reserves excluding revaluation reserves - Misc Expenditures Not written off, Sales Rs. Mn - Sales , Turnover & Income from operations,Sales Var% - Percentage Change in Sales over previous period Sales, OPM% - Operating Profit after interest expended as a % of Interest income & income from operation, NP Rs. Mn - Net Profit as reported after Tax, NP Var% - Percentage Change in Net profit over previous period Net profits, Div% - Total % of Dividend Declared during latest Financial year.
CPS Rs. - Cash Profit per Shares, EPS Rs. - Earning Per Shares is calculated as Net Profit / Number of Equity Shares, Sales Rs. Mn - Sales ,Turnover & Income from operations for Latest Quarter, Sales Var% - Percentage Change in Sales for Latest Quarter over previous Corresponding Quarter Sales, OPM% - Operating Profit after interest expended as a % of Interest income & income from operation for Latest Quarter,NP Rs. Mn - Net Profit as reported after Tax for Latest Quarter,NP Var% - Percent-age Change in Net profit for Latest Quarter over Previous quarter Net profits, Ended - Trailing Twelve months Ended On, TTMEPS - Earning Per Shares is calculated as TTM Net Profit / Number of Equity Shares,TTMNP Var% - Percentage Change in TTM Net profit over Corresponding previous TTM Net profits, H52 - High Price during last 52 Week,L52 - Low Price during last 52 Week,PE - Market Price / TTM Earning Per Shares,Market cap Rs.Mn - Market Capitalisation is calculated as Latest price multiplied by No of Equity Shares outstanding.
Scorecard : Cement
Latest Quarter TTM Market DataEPSRs.
SalesRs. Mn.
SalesVar (%)
OPMRs. Mn.
% NPNP
Var(%)Ended
EPSRs.
NPVar (%)
Price29/04/09
H52W L52W PEMkt. Cap(Rs. Mn.)
64.62 20817.00 15.92 33.54 4047.64 13.21 200903 67.13 -14.04 653.00 783.00 369.00 9.73 122555.04
9.21 18626.60 12.56 30.37 3340.50 2.41 200903 9.26 -6.70 80.75 115.25 43.00 8.72 122949.95
4.75 1112.20 35.53 13.18 142.00 -17.97 200903 4.76 -5.51 18.75 32.86 11.50 3.94 2359.75
8.87 299.20 29.65 25.29 35.45 -30.57 200812 9.55 -0.51 26.40 37.75 15.00 2.76 485.49
4.97 195.72 7.28 24.40 19.80 16.13 200812 4.83 100.00 17.86 42.10 10.00 3.70 395.78
5.35 4980.80 48.24 19.37 200.70 -68.70 200903 5.35 -99.34 37.10 82.00 24.95 6.93 7535.06
7.13 56.60 ---- 48.41 11.20 -131.11 200903 7.13 29.28 46.90 146.90 25.80 6.58 1388.07
51.11 4562.40 5.40 26.51 813.80 -23.52 200812 41.49 -27.78 199.75 227.00 71.00 4.81 15381.81
0.33 35.93 ---- ---- -7.17 ---- 200812 0.00 ---- 10.26 23.70 7.15 ---- 441.22
55.51 2596.70 9.27 8.65 163.90 -60.46 200812 44.24 -18.19 479.95 525.00 360.15 10.85 14158.53
42.89 4099.40 12.83 23.75 237.10 -78.93 200812 22.78 -83.86 88.60 305.00 67.20 3.89 7162.87
68.49 538.27 9.16 29.95 91.56 -19.82 200812 56.46 -13.83 167.00 292.00 109.25 2.96 1169.63
9.68 1281.60 85.63 9.85 -34.10 -149.14 200812 1.64 -587.60 64.65 124.50 43.50 39.54 956.82
5.54 3205.59 135.70 14.98 543.53 192.42 200812 5.54 22.20 25.00 39.75 11.01 4.51 3950.25
18.87 1300.20 16.52 12.68 66.00 -447.37 200812 52.80 65.74 180.60 207.90 89.00 3.42 1347.75
24.28 8776.60 2.71 22.12 619.10 -51.27 200812 17.38 -37.08 115.05 178.10 68.50 6.62 32428.84
37.93 3633.51 -6.81 19.47 286.72 -64.25 200812 20.36 -87.40 58.95 159.00 34.80 2.90 4122.21
36.56 2977.30 5.45 26.39 560.40 -8.28 200812 30.93 -39.45 62.00 120.50 30.25 2.00 3793.13
27.41 422.32 -21.21 27.37 70.30 -7.67 200903 27.43 26.79 77.65 108.00 46.10 2.83 603.64
1.87 39.53 5.22 40.93 0.54 -41.94 200812 0.00 ---- 11.01 24.80 8.21 ---- 56.42
49.28 795.80 -24.97 35.57 148.30 -23.20 200812 39.71 -40.87 181.30 485.40 111.25 4.57 2337.34
34.66 1696.28 35.90 33.70 385.74 13.07 200903 34.66 -16.86 79.50 141.95 38.15 2.29 2245.61
8.74 825.60 62.99 27.70 87.18 35.08 200812 9.45 27.06 30.50 51.00 19.00 3.23 991.37
20.00 3099.90 36.95 23.59 322.00 4.61 200812 21.90 18.35 69.75 145.00 33.00 3.18 3968.78
3.23 252.30 -88.97 ---- -107.90 -116.77 200903 3.23 -155.33 26.90 43.90 13.50 8.34 8022.93
12.01 2666.80 38.45 24.18 331.20 8.77 200903 12.39 -65.85 91.00 255.00 52.25 7.35 2922.01
58.80 824.40 6.69 22.27 29.90 -18.75 200812 74.82 16.29 464.15 883.00 326.00 6.20 2011.23
20.63 798.58 30.82 22.52 53.65 -39.65 200812 10.39 -98.27 160.25 421.45 85.10 15.43 2137.30
4.84 1879.50 -6.50 30.45 178.80 -14.61 200812 3.02 -103.24 24.00 78.00 17.05 7.96 5279.52
-9.41 3544.19 220.05 ---- -323.42 -7161.57 200812 -9.41 135.39 20.35 39.15 9.27 ---- 1041.74
85.90 8116.41 24.85 42.81 2356.37 473.67 200903 165.91 48.22 775.85 1040.00 330.00 4.68 27028.44
-0.99 692.50 14.33 13.40 48.20 -50.82 200812 -2.67 211.98 8.56 23.50 4.23 ---- 1210.16
78.48 18750.10 17.07 29.96 3094.60 9.40 200903 78.48 -3.13 590.00 785.00 250.00 7.52 73449.10
---- 70.40 -2.68 5.70 -5.80 -240.78 200812 ---- -543.27 40.05 47.00 22.00 ---- 756.94
4.83 1212.68 19.64 15.25 62.53 1062.27 200812 19.95 68.77 52.85 84.45 31.70 2.65 839.31

D e c e m b e r May 2009
Magnum
D e c e m b e r May 2009
Magnum
18 19D e c e m b e r May 2009
Magnum
D e c e m b e r May 2009
Magnum
18 19
Scorecard : Cement
Company Name
YearEnd
NOMEquity
Rs. Mn.FV Promoter
Stk % BVRs.
RONW(%)
Sales Rs. Mn.
Sales Var (%)
OPM(%)
NP Rs.Mn.
NP Var (%)
DIV (%)
CPS(Rs.)
ACC 200812 12 1876.80 10 46.21 262.55 26.71 74741.53 6.66 27.05 12127.84 -15.70 200 80.29
Ambuja Cement 200812 12 3045.20 2 46.46 37.23 27.17 62817.10 10.11 31.10 14022.70 -20.74 110 10.92
Andhra Cements 200903 18 1258.53 10 72.99 0.95 ---- 3711.20 -16.14 16.39 630.10 -14.81 ---- 4.84
Anjani Portland 200803 12 183.90 10 61.44 23.03 45.54 1030.68 15.90 31.76 163.11 30.47 15 10.57
Barak Valley 200803 12 221.60 10 60.49 32.91 18.47 703.14 ---- 28.57 110.03 ---- 20 7.08
Binani Cement 200903 12 2031.01 10 64.91 20.56 48.92 14973.20 53.00 20.46 1086.60 -38.19 25 9.30
Binani Inds 200903 12 295.96 10 51.28 54.59 9.42 470.60 ---- 60.75 211.10 41.39 30 7.24
Birla Corp 200803 12 770.05 10 62.90 129.41 47.61 17247.80 10.08 35.58 3935.70 20.64 40 56.49
Burnpur Cement 200803 12 430.04 10 47.29 12.70 4.07 270.34 ---- 16.38 14.18 ---- ---- 0.49
Chettinad Cement 200803 12 295.00 10 85.03 133.05 49.95 9301.80 28.25 37.30 1637.70 42.77 100 83.13
Dalmia Cement 200803 12 161.69 2 56.19 132.94 39.68 14806.70 50.10 42.78 3471.50 51.64 200 53.56
Deccan Cements 200803 12 70.04 10 54.63 198.22 41.33 2092.15 21.85 38.00 479.66 68.75 30 76.78
Everest Industries 200803 12 148.00 10 50.09 95.50 10.38 2851.40 -6.13 11.35 143.20 22.81 40 16.19
Heidelberg Cem.(I) 200812 12 1580.10 10 68.55 20.53 35.43 8044.99 35.31 16.54 1255.26 28.54 ---- 6.48
Hyderabad Inds. 200803 12 74.63 10 42.19 195.08 9.99 4827.10 9.78 8.36 140.80 -18.38 50 33.77
India Cements 200803 12 2818.67 10 28.02 91.26 32.48 35544.70 73.41 31.81 6856.80 52.54 20 28.81
J K Cement 200803 12 699.27 10 63.80 108.72 41.63 14583.00 18.24 29.05 2652.00 48.49 50 43.80
JK Lakshmi Cem. 200803 12 611.80 10 45.66 103.74 43.70 11076.60 31.27 30.42 2236.70 25.58 25 46.13
Kakatiya Cem. Sugar 200903 12 77.74 10 48.32 135.30 17.28 1702.93 3.51 23.07 213.12 36.35 24 37.86
Katwa Udyog 200803 12 51.24 10 58.81 12.08 15.47 157.56 91.03 15.19 9.59 161.31 10 2.73
KCP 200803 12 128.92 10 46.26 147.28 40.01 4035.60 37.12 27.53 635.30 31.56 100 55.67
Mangalam Cement 200903 12 282.47 10 27.07 76.72 63.27 5661.36 11.03 28.62 971.64 -14.43 50 43.32
NCL Industries 200803 12 325.04 10 43.26 30.48 34.42 1927.30 20.28 36.35 295.69 10.21 25 11.98
OCL India 200803 12 113.80 2 69.77 97.20 25.32 8928.20 10.46 24.62 1138.00 58.58 125 24.62
Prism Cement 200903 9 2982.50 10 61.74 22.18 15.04 6298.60 ---- 28.55 962.30 ---- 15 4.04
Rain Commodities 200812 9 321.10 10 42.89 99.86 12.32 11121.60 140.70 17.29 850.60 -0.56 28 15.18
Ramco Inds. 200803 12 43.33 10 50.54 567.57 10.82 3444.30 17.51 24.57 254.80 4.77 150 123.88
Sagar Cement 200803 12 133.37 10 44.16 78.55 34.91 2231.43 98.35 25.81 309.56 11.89 25 23.39
Sanghi Industries 200803 12 2199.80 10 51.01 26.92 19.77 8465.10 ---- 33.95 1063.90 ---- ---- 8.49
Saurashtra Cement 200812 18 511.91 10 64.42 0.10 ---- 7286.51 ---- 7.56 -481.53 ---- ---- -4.17
Shree Cement 200803 12 348.37 10 65.41 193.13 46.19 21091.18 54.18 44.36 2992.56 69.07 80 223.33
Shree Digvijay Cem 200803 12 1413.74 10 73.63 2.04 ---- 2540.80 -0.46 -2.62 -140.20 -126.24 ---- -0.54
Ultratech Cement 200903 12 1244.90 10 54.78 216.58 45.18 64369.60 16.85 28.12 9770.20 -3.04 50 104.43
Vinay Cements 200803 12 189.00 10 0.00 39.97 5.03 406.98 -16.77 17.07 29.42 -71.19 ---- ----
Visaka Inds. 200803 12 158.81 10 37.70 100.28 4.87 4331.31 14.22 10.29 76.73 -67.67 30 14.69
Scorecard Legends : NOM - Number of Months for which P& L a/c is prepared by the companies, Equity Rs.Mn - Latest Paid Up Capital of the Company, FV-Latest Face values of equity Shares, Promoter Stk % - Its promoter holding in the equity capital of the company as per latest shareholding pattern, BV Rs. - Book Value Per Share is calculated as (Equity + reserves ) / No of Equity shares, RONW - Return on Net Worth is calculated as {(Net profit - preference capital)/ Shareholder’s Fund }*100.Share- holders funds includes Equity Paid Up + Reserves excluding revaluation reserves - Misc Expenditures Not written off, Sales Rs. Mn - Sales , Turnover & Income from operations,Sales Var% - Percentage Change in Sales over previous period Sales, OPM% - Operating Profit after interest expended as a % of Interest income & income from operation, NP Rs. Mn - Net Profit as reported after Tax, NP Var% - Percentage Change in Net profit over previous period Net profits, Div% - Total % of Dividend Declared during latest Financial year.
CPS Rs. - Cash Profit per Shares, EPS Rs. - Earning Per Shares is calculated as Net Profit / Number of Equity Shares, Sales Rs. Mn - Sales ,Turnover & Income from operations for Latest Quarter, Sales Var% - Percentage Change in Sales for Latest Quarter over previous Corresponding Quarter Sales, OPM% - Operating Profit after interest expended as a % of Interest income & income from operation for Latest Quarter,NP Rs. Mn - Net Profit as reported after Tax for Latest Quarter,NP Var% - Percent-age Change in Net profit for Latest Quarter over Previous quarter Net profits, Ended - Trailing Twelve months Ended On, TTMEPS - Earning Per Shares is calculated as TTM Net Profit / Number of Equity Shares,TTMNP Var% - Percentage Change in TTM Net profit over Corresponding previous TTM Net profits, H52 - High Price during last 52 Week,L52 - Low Price during last 52 Week,PE - Market Price / TTM Earning Per Shares,Market cap Rs.Mn - Market Capitalisation is calculated as Latest price multiplied by No of Equity Shares outstanding.
Scorecard : Cement
Latest Quarter TTM Market DataEPSRs.
SalesRs. Mn.
SalesVar (%)
OPMRs. Mn.
% NPNP
Var(%)Ended
EPSRs.
NPVar (%)
Price29/04/09
H52W L52W PEMkt. Cap(Rs. Mn.)
64.62 20817.00 15.92 33.54 4047.64 13.21 200903 67.13 -14.04 653.00 783.00 369.00 9.73 122555.04
9.21 18626.60 12.56 30.37 3340.50 2.41 200903 9.26 -6.70 80.75 115.25 43.00 8.72 122949.95
4.75 1112.20 35.53 13.18 142.00 -17.97 200903 4.76 -5.51 18.75 32.86 11.50 3.94 2359.75
8.87 299.20 29.65 25.29 35.45 -30.57 200812 9.55 -0.51 26.40 37.75 15.00 2.76 485.49
4.97 195.72 7.28 24.40 19.80 16.13 200812 4.83 100.00 17.86 42.10 10.00 3.70 395.78
5.35 4980.80 48.24 19.37 200.70 -68.70 200903 5.35 -99.34 37.10 82.00 24.95 6.93 7535.06
7.13 56.60 ---- 48.41 11.20 -131.11 200903 7.13 29.28 46.90 146.90 25.80 6.58 1388.07
51.11 4562.40 5.40 26.51 813.80 -23.52 200812 41.49 -27.78 199.75 227.00 71.00 4.81 15381.81
0.33 35.93 ---- ---- -7.17 ---- 200812 0.00 ---- 10.26 23.70 7.15 ---- 441.22
55.51 2596.70 9.27 8.65 163.90 -60.46 200812 44.24 -18.19 479.95 525.00 360.15 10.85 14158.53
42.89 4099.40 12.83 23.75 237.10 -78.93 200812 22.78 -83.86 88.60 305.00 67.20 3.89 7162.87
68.49 538.27 9.16 29.95 91.56 -19.82 200812 56.46 -13.83 167.00 292.00 109.25 2.96 1169.63
9.68 1281.60 85.63 9.85 -34.10 -149.14 200812 1.64 -587.60 64.65 124.50 43.50 39.54 956.82
5.54 3205.59 135.70 14.98 543.53 192.42 200812 5.54 22.20 25.00 39.75 11.01 4.51 3950.25
18.87 1300.20 16.52 12.68 66.00 -447.37 200812 52.80 65.74 180.60 207.90 89.00 3.42 1347.75
24.28 8776.60 2.71 22.12 619.10 -51.27 200812 17.38 -37.08 115.05 178.10 68.50 6.62 32428.84
37.93 3633.51 -6.81 19.47 286.72 -64.25 200812 20.36 -87.40 58.95 159.00 34.80 2.90 4122.21
36.56 2977.30 5.45 26.39 560.40 -8.28 200812 30.93 -39.45 62.00 120.50 30.25 2.00 3793.13
27.41 422.32 -21.21 27.37 70.30 -7.67 200903 27.43 26.79 77.65 108.00 46.10 2.83 603.64
1.87 39.53 5.22 40.93 0.54 -41.94 200812 0.00 ---- 11.01 24.80 8.21 ---- 56.42
49.28 795.80 -24.97 35.57 148.30 -23.20 200812 39.71 -40.87 181.30 485.40 111.25 4.57 2337.34
34.66 1696.28 35.90 33.70 385.74 13.07 200903 34.66 -16.86 79.50 141.95 38.15 2.29 2245.61
8.74 825.60 62.99 27.70 87.18 35.08 200812 9.45 27.06 30.50 51.00 19.00 3.23 991.37
20.00 3099.90 36.95 23.59 322.00 4.61 200812 21.90 18.35 69.75 145.00 33.00 3.18 3968.78
3.23 252.30 -88.97 ---- -107.90 -116.77 200903 3.23 -155.33 26.90 43.90 13.50 8.34 8022.93
12.01 2666.80 38.45 24.18 331.20 8.77 200903 12.39 -65.85 91.00 255.00 52.25 7.35 2922.01
58.80 824.40 6.69 22.27 29.90 -18.75 200812 74.82 16.29 464.15 883.00 326.00 6.20 2011.23
20.63 798.58 30.82 22.52 53.65 -39.65 200812 10.39 -98.27 160.25 421.45 85.10 15.43 2137.30
4.84 1879.50 -6.50 30.45 178.80 -14.61 200812 3.02 -103.24 24.00 78.00 17.05 7.96 5279.52
-9.41 3544.19 220.05 ---- -323.42 -7161.57 200812 -9.41 135.39 20.35 39.15 9.27 ---- 1041.74
85.90 8116.41 24.85 42.81 2356.37 473.67 200903 165.91 48.22 775.85 1040.00 330.00 4.68 27028.44
-0.99 692.50 14.33 13.40 48.20 -50.82 200812 -2.67 211.98 8.56 23.50 4.23 ---- 1210.16
78.48 18750.10 17.07 29.96 3094.60 9.40 200903 78.48 -3.13 590.00 785.00 250.00 7.52 73449.10
---- 70.40 -2.68 5.70 -5.80 -240.78 200812 ---- -543.27 40.05 47.00 22.00 ---- 756.94
4.83 1212.68 19.64 15.25 62.53 1062.27 200812 19.95 68.77 52.85 84.45 31.70 2.65 839.31
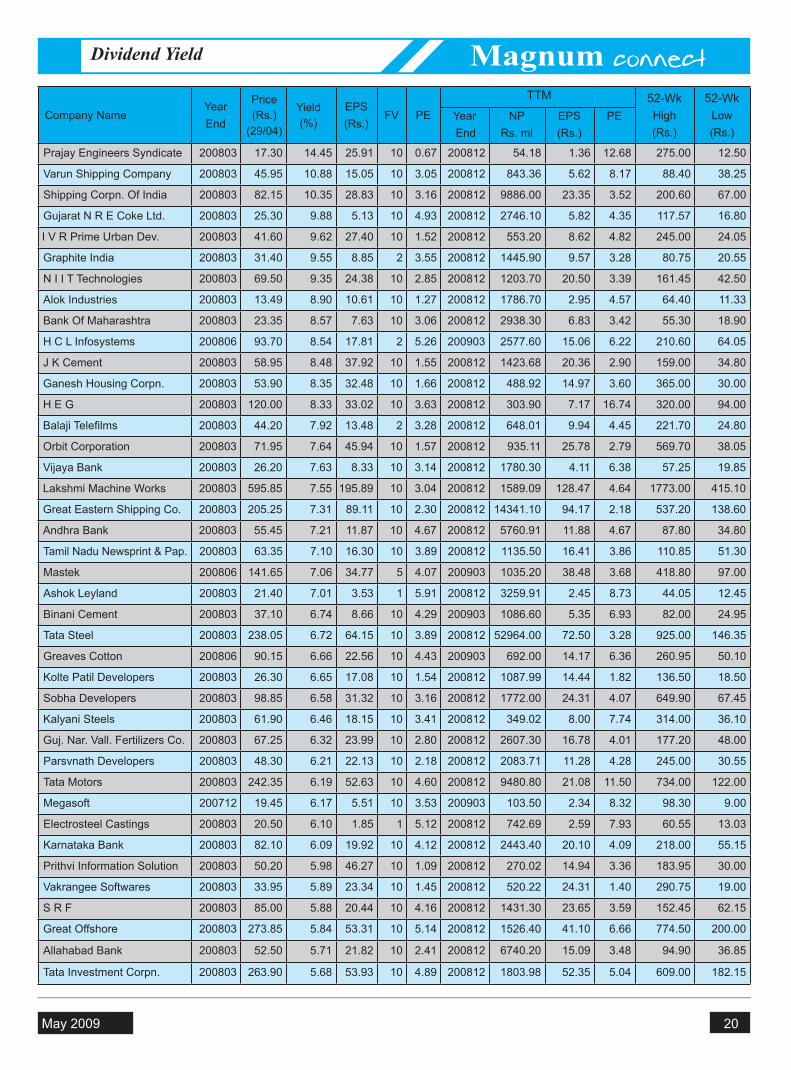
D e c e m b e r May 2009
Magnum
D e c e m b e r May 2009
Magnum
20 21D e c e m b e r May 2009
Magnum
D e c e m b e r May 2009
Magnum
20 21
Dividend Yield
Company NameYear End
Price(Rs.)
(29/04)
Yield(%)
EPS(Rs.)
FV PE
TTM 52-WkHigh(Rs.)
52-WkLow(Rs.)
Year End
NPRs. ml
EPS(Rs.)
PE
Prajay Engineers Syndicate 200803 17.30 14.45 25.91 10 0.67 200812 54.18 1.36 12.68 275.00 12.50
Varun Shipping Company 200803 45.95 10.88 15.05 10 3.05 200812 843.36 5.62 8.17 88.40 38.25
Shipping Corpn. Of India 200803 82.15 10.35 28.83 10 3.16 200812 9886.00 23.35 3.52 200.60 67.00
Gujarat N R E Coke Ltd. 200803 25.30 9.88 5.13 10 4.93 200812 2746.10 5.82 4.35 117.57 16.80
I V R Prime Urban Dev. 200803 41.60 9.62 27.40 10 1.52 200812 553.20 8.62 4.82 245.00 24.05
Graphite India 200803 31.40 9.55 8.85 2 3.55 200812 1445.90 9.57 3.28 80.75 20.55
N I I T Technologies 200803 69.50 9.35 24.38 10 2.85 200812 1203.70 20.50 3.39 161.45 42.50
Alok Industries 200803 13.49 8.90 10.61 10 1.27 200812 1786.70 2.95 4.57 64.40 11.33
Bank Of Maharashtra 200803 23.35 8.57 7.63 10 3.06 200812 2938.30 6.83 3.42 55.30 18.90
H C L Infosystems 200806 93.70 8.54 17.81 2 5.26 200903 2577.60 15.06 6.22 210.60 64.05
J K Cement 200803 58.95 8.48 37.92 10 1.55 200812 1423.68 20.36 2.90 159.00 34.80
Ganesh Housing Corpn. 200803 53.90 8.35 32.48 10 1.66 200812 488.92 14.97 3.60 365.00 30.00
H E G 200803 120.00 8.33 33.02 10 3.63 200812 303.90 7.17 16.74 320.00 94.00
Balaji Telefilms 200803 44.20 7.92 13.48 2 3.28 200812 648.01 9.94 4.45 221.70 24.80
Orbit Corporation 200803 71.95 7.64 45.94 10 1.57 200812 935.11 25.78 2.79 569.70 38.05
Vijaya Bank 200803 26.20 7.63 8.33 10 3.14 200812 1780.30 4.11 6.38 57.25 19.85
Lakshmi Machine Works 200803 595.85 7.55 195.89 10 3.04 200812 1589.09 128.47 4.64 1773.00 415.10
Great Eastern Shipping Co. 200803 205.25 7.31 89.11 10 2.30 200812 14341.10 94.17 2.18 537.20 138.60
Andhra Bank 200803 55.45 7.21 11.87 10 4.67 200812 5760.91 11.88 4.67 87.80 34.80
Tamil Nadu Newsprint & Pap. 200803 63.35 7.10 16.30 10 3.89 200812 1135.50 16.41 3.86 110.85 51.30
Mastek 200806 141.65 7.06 34.77 5 4.07 200903 1035.20 38.48 3.68 418.80 97.00
Ashok Leyland 200803 21.40 7.01 3.53 1 5.91 200812 3259.91 2.45 8.73 44.05 12.45
Binani Cement 200803 37.10 6.74 8.66 10 4.29 200903 1086.60 5.35 6.93 82.00 24.95
Tata Steel 200803 238.05 6.72 64.15 10 3.89 200812 52964.00 72.50 3.28 925.00 146.35
Greaves Cotton 200806 90.15 6.66 22.56 10 4.43 200903 692.00 14.17 6.36 260.95 50.10
Kolte Patil Developers 200803 26.30 6.65 17.08 10 1.54 200812 1087.99 14.44 1.82 136.50 18.50
Sobha Developers 200803 98.85 6.58 31.32 10 3.16 200812 1772.00 24.31 4.07 649.90 67.45
Kalyani Steels 200803 61.90 6.46 18.15 10 3.41 200812 349.02 8.00 7.74 314.00 36.10
Guj. Nar. Vall. Fertilizers Co. 200803 67.25 6.32 23.99 10 2.80 200812 2607.30 16.78 4.01 177.20 48.00
Parsvnath Developers 200803 48.30 6.21 22.13 10 2.18 200812 2083.71 11.28 4.28 245.00 30.55
Tata Motors 200803 242.35 6.19 52.63 10 4.60 200812 9480.80 21.08 11.50 734.00 122.00
Megasoft 200712 19.45 6.17 5.51 10 3.53 200903 103.50 2.34 8.32 98.30 9.00
Electrosteel Castings 200803 20.50 6.10 1.85 1 5.12 200812 742.69 2.59 7.93 60.55 13.03
Karnataka Bank 200803 82.10 6.09 19.92 10 4.12 200812 2443.40 20.10 4.09 218.00 55.15
Prithvi Information Solution 200803 50.20 5.98 46.27 10 1.09 200812 270.02 14.94 3.36 183.95 30.00
Vakrangee Softwares 200803 33.95 5.89 23.34 10 1.45 200812 520.22 24.31 1.40 290.75 19.00
S R F 200803 85.00 5.88 20.44 10 4.16 200812 1431.30 23.65 3.59 152.45 62.15
Great Offshore 200803 273.85 5.84 53.31 10 5.14 200812 1526.40 41.10 6.66 774.50 200.00
Allahabad Bank 200803 52.50 5.71 21.82 10 2.41 200812 6740.20 15.09 3.48 94.90 36.85
Tata Investment Corpn. 200803 263.90 5.68 53.93 10 4.89 200812 1803.98 52.35 5.04 609.00 182.15

D e c e m b e r May 2009
Magnum
D e c e m b e r May 2009
Magnum
20 21D e c e m b e r May 2009
Magnum
D e c e m b e r May 2009
Magnum
20 21
High PE
Company Name Year End Price (29/04) Rs. EPS FV PEFortis Healthcare Ltd. 200803 68.05 0.12 10 575.57IRB Infrastructure Developers Ltd 200803 95.40 0.18 10 535.87B F Utilities Ltd. 200809 589.30 1.23 5 479.75G M R Infrastructure Ltd. 200803 112.85 0.34 2 327.70Reliance Power Ltd 200803 123.30 0.42 10 294.34U T V Software Communications Ltd. 200803 300.70 1.80 10 166.90K S K Energy Ventures Ltd. 200703 165.40 1.11 10 149.28New Delhi Television Ltd. 200803 101.55 0.68 4 148.48Reliance Natural Resources Ltd. 200803 56.65 0.42 5 134.87Gammon Infrastructure Projects Ltd 200803 63.70 0.48 10 129.75Jindal South West Holdings Ltd. 200803 373.05 3.01 10 124.09Religare Enterprises Ltd 200803 318.40 3.08 10 103.31Future Capital Holdings Ltd 200803 126.05 1.41 10 89.66Bombay Dyeing & Manufacturing. Co. Ltd. 200803 173.95 4.07 10 87.89Mundra Port & Special Economic Zone Ltd 200803 386.00 5.33 10 76.66Bajaj Finserv Ltd 200803 217.10 3.04 5 71.47Edelweiss Capital Ltd 200803 274.35 3.84 5 71.44Nirlon Ltd. 200803 25.95 0.28 10 67.86Advanta India Ltd. 200712 515.55 7.79 10 66.15Strides Arcolab Ltd. 200812 96.65 1.53 10 63.09Educomp Solutions Ltd. 200803 2474.25 40.62 10 60.91Max India Ltd. 200803 141.10 2.79 2 50.54Reliance Industrial Infrastructure Ltd. 200803 725.60 14.43 10 50.28Hindustan Copper Ltd. 200803 161.00 3.21 5 50.18Tata Communications Ltd 200803 547.75 10.68 10 49.45Asahi India Glass Ltd. 200803 41.45 0.85 1 49.10Ispat Industries Ltd. 200803 13.21 0.28 10 46.37Entertainment Network (India) Ltd. 200803 150.75 3.40 10 44.36G V K Power & Infrastructure Ltd. 200803 27.95 0.65 1 43.25Hindustan Oil Exploration Company Ltd. 200803 79.45 1.85 10 43.02Nagarjuna Fertilizers & Chemicals Ltd. 200803 22.35 0.53 10 42.53I L & F S Investsmart Ltd. 200803 92.75 2.23 10 41.57Onmobile Global Ltd 200803 322.00 8.29 10 38.86United Breweries Ltd. 200803 110.45 2.89 1 38.20Shree Renuka Sugars Ltd. 200809 97.90 2.70 1 36.24B O C India Ltd. 200703 142.10 9.09 10 34.34Arshiya International Ltd. 200803 75.50 2.17 2 33.89Adani Enterprises Ltd. 200803 420.30 12.66 1 33.20P T C India Ltd. 200803 70.95 2.14 10 33.12Television Eighteen India Ltd. 200803 83.75 2.55 5 32.84Everest Kanto Cylinder Ltd. 200803 151.55 4.67 2 32.44
EPS Earning Per Shares is calculated as Net Profit / Number of Equity Shares (Rs)FV Latest Face values of equity Shares (Rs)PE Market Price / Trailing Twelve Months Earning Per Shares

D e c e m b e r May 2009
Magnum
D e c e m b e r May 2009
Magnum
22 23D e c e m b e r May 2009
Magnum
D e c e m b e r May 2009
Magnum
22 23
Low PE
EPS Earning Per Shares is calculated as Net Profit / Number of Equity Shares (Rs)FV Latest Face values of equity Shares (Rs)PE Market Price / Trailing Twelve Months Earning Per Shares
Company Name Year End Price (29/04) Rs. EPS FV PEAftek Ltd. 200803 9.22 8.66 2 1.06Prithvi Information Solutions Ltd. 200803 50.20 46.27 10 1.09Amtek India Ltd. 200806 34.05 30.93 2 1.10Alok Industries Ltd. 200803 13.49 10.61 10 1.27I F C I Ltd. 200803 25.15 13.36 10 1.33Sujana Towers Ltd. 200809 16.15 11.13 5 1.45Vakrangee Softwares Ltd. 200803 33.95 23.34 10 1.45I V R Prime Urban Developers Ltd. 200803 41.60 27.40 10 1.52Chennai Petroleum Corporation. Ltd. 200803 114.85 75.41 10 1.52Kolte Patil Developers Ltd 200803 26.30 17.08 10 1.54J K Lakshmi Cement Ltd. 200803 62.00 36.56 10 1.55J K Cement Ltd. 200803 58.95 37.92 10 1.55Orbit Corporation Ltd. 200803 71.95 45.94 10 1.57Ashapura Minechem Ltd. 200803 27.50 17.19 2 1.60Ganesh Housing Corpn. Ltd. 200803 53.90 32.48 10 1.66Ajmera Realty & Infra India Ltd 200803 36.35 20.76 10 1.75Kei Industries Ltd. 200803 12.54 7.16 2 1.75Kesoram Industries Ltd. 200803 154.15 83.80 10 1.84K L G Systel Ltd. 200803 90.20 44.75 10 2.02Vishal Retail Ltd. 200803 37.10 18.14 10 2.04Dalmia Cement (Bharat) Ltd. 200803 88.60 42.94 2 2.06Bharati Shipyard Ltd. 200803 81.20 38.97 10 2.08Marg Ltd. 200803 55.15 26.34 10 2.09Indage Vintners Ltd 200803 57.70 27.36 10 2.11Ansal Properties & Infrastructure Ltd. 200803 30.80 14.24 5 2.16Parsvnath Developers Ltd. 200803 48.30 22.13 10 2.18Housing Development & Infrastructure Ltd. 200803 146.80 65.83 10 2.23Great Eastern Shipping Company Ltd. 200803 205.25 89.11 10 2.30Hindalco Industries Ltd. 200803 53.85 23.31 1 2.31Man Industries (India) Ltd. 200803 31.80 13.36 5 2.38Omaxe Ltd. 200803 54.75 22.98 10 2.38Mascon Global Ltd. 200803 3.49 1.46 10 2.39Allahabad Bank Ltd 200803 52.50 21.82 10 2.41Gujarat Alkalies & Chemicals Ltd. 200803 74.65 30.51 10 2.45Unity Infraprojects Ltd. 200803 110.40 44.92 10 2.46Oriental Bank Of Commerce Ltd 200803 131.25 33.57 10 2.47Videocon Industries Ltd. 200809 109.10 37.23 10 2.55Maytas Infra Ltd. 200803 37.25 16.93 10 2.55Asian Electronics Ltd. 200803 22.60 -51.57 5 2.73Gujarat Fluorochemicals Ltd. 200803 76.90 27.68 1 2.78Gujarat Narmada Valley Fertilizers Co.Ltd. 200803 67.25 23.99 10 2.80

D e c e m b e r May 2009
Magnum
D e c e m b e r May 2009
Magnum
22 23D e c e m b e r May 2009
Magnum
D e c e m b e r May 2009
Magnum
22 23
Sales
Company Name200903 Qtr Net Sales
200803Qtr Net Sales
Change In Sales
% Change in Sales
200903 Net Profits
200803 Net Profits
Change In Net Profits
% Change in Net Profits
Jindal Drilling 3336.40 1022.70 2313.70 226.23 151.50 54.90 96.60 175.96Seamec 1001.20 348.50 652.70 187.29 619.50 -170.28 789.78 -463.81Raj Television 194.94 86.44 108.50 125.52 -30.76 -3.42 -27.34 799.42Deep Industries 108.75 61.01 47.74 78.25 12.22 15.26 -3.04 -19.92Granules India 868.62 494.67 373.95 75.60 11.44 20.17 -8.73 -43.28Areva T & D 8450.00 5029.00 3421.00 68.03 514.00 541.00 -27.00 -4.99Jaiprakash Assoc 21516.70 12960.00 8556.70 66.02 3853.20 2100.00 1753.20 83.49Siemens Healthcare Diagno 406.26 248.99 157.27 63.16 -21.15 22.73 -43.88 -193.05A K Capital 433.77 271.28 162.49 59.90 138.71 70.63 68.08 96.39Mphasis 7681.60 4841.90 2839.70 58.65 1873.70 569.00 1304.70 229.30Alstom Projects 8092.30 5109.00 2983.30 58.39 261.90 15.00 246.90 1646.00United Breweries Hdg 1030.90 656.60 374.30 57.01 126.80 138.50 -11.70 -8.45Bartronics India 1145.28 732.75 412.53 56.30 21.45 164.21 -142.76 -86.94Strides Arcolab 1860.21 1196.88 663.33 55.42 214.81 -160.48 375.29 -233.86Shaw Wallace 639.90 412.00 227.90 55.32 35.60 203.90 -168.30 -82.54Nagarjuna Agrichem 1436.80 925.80 511.00 55.20 110.90 25.90 85.00 328.19Bajaj Hind Sugar 959.00 626.20 332.80 53.15 488.40 68.20 420.20 616.13Gruh Finance 955.90 624.90 331.00 52.97 224.90 204.00 20.90 10.25Era Infra Engg 9525.81 6250.65 3275.16 52.40 1076.26 367.64 708.62 192.75Facor Alloys 1022.46 672.18 350.28 52.11 -34.37 259.64 -294.01 -113.24Petronet LNG 26548.80 17526.50 9022.28 51.48 2043.53 1200.38 843.15 70.24Axis Bank 30392.20 20154.30 10237.90 50.80 5814.50 3614.00 2200.50 60.89J Kumar Infraproject 1496.72 992.78 503.94 50.76 119.81 106.08 13.73 12.94Jhagadia Copper 630.70 421.50 209.20 49.63 -782.00 -559.80 -222.20 39.69Binani Cement 4980.80 3360.00 1620.80 48.24 200.70 641.30 -440.60 -68.70Coromandel Fertilisers 8568.60 5844.30 2724.30 46.61 -124.70 33.60 -158.30 -471.13Oil Country Tubular 1529.49 1049.15 480.34 45.78 119.86 -52.37 172.23 -328.87Yes Bank 5663.10 3884.80 1778.30 45.78 801.10 645.00 156.10 24.20I D B I 32622.10 22497.40 10124.70 45.00 3136.70 2449.90 686.80 28.03HDFC Bank 42508.30 29561.80 12946.50 43.79 6308.80 4711.10 1597.70 33.91Idea Cellular 28324.60 19724.00 8600.60 43.60 3042.80 2782.00 260.80 9.37Mah Seamless 5495.60 3843.10 1652.50 43.00 646.30 540.50 105.80 19.57Upper Ganges Sugar 972.29 688.48 283.81 41.22 90.99 145.17 -54.18 -37.32AMD Industries 318.73 226.61 92.12 40.65 -4.57 -2.60 -1.97 75.77Rain Commodities 2666.80 1926.20 740.60 38.45 331.20 304.50 26.70 8.77Bharati Shipyard 2842.72 2064.05 778.67 37.73 353.77 326.51 27.26 8.35Indian Bank Ltd 18563.70 13599.90 4963.76 36.50 3940.74 2416.70 1524.04 63.06Corporation Bank Ltd 17063.80 12535.20 4528.65 36.13 2604.91 2056.00 548.91 26.70Mangalam Cement 1696.28 1248.18 448.10 35.90 385.74 341.16 44.58 13.07Supreme Industries 4421.58 3262.01 1159.57 35.55 285.59 82.60 202.99 245.75Andhra Cements 1112.20 820.60 291.60 35.54 142.00 173.10 -31.10 -17.97Aban Offshore 2652.71 1963.87 688.84 35.08 468.43 345.49 122.94 35.58Maruti Suzuki India 64329.00 47629.10 16699.90 35.06 2431.30 2976.80 -545.50 -18.33Andhra Sugars 1456.37 1080.11 376.26 34.84 94.57 122.66 -28.09 -22.90Pochiraju Industries 155.81 115.93 39.88 34.40 41.91 31.43 10.48 33.34LIC Housing Finance 7904.75 5895.90 2008.85 34.07 1575.58 1181.00 394.58 33.41Zandu Pharm 383.49 288.01 95.48 33.15 79.72 11.40 68.32 599.30Power Finance Corp 18169.40 13651.80 4517.53 33.09 3905.84 2954.00 951.84 32.22Glaxo.Cons.Healthcare 5393.70 4106.00 1287.70 31.36 838.90 566.00 272.90 48.22Sterling Biotech 3512.06 2690.36 821.70 30.54 477.28 550.89 -73.61 -13.36
Rs. in million

D e c e m b e r May 2009
Magnum
D e c e m b e r May 2009
Magnum
24 25D e c e m b e r May 2009
Magnum
D e c e m b e r May 2009
Magnum
24 25
Price Trends
Date Price Rs.29-Apr-09 14543.3528-Mar-09 15125.0028-Feb-09 15400.0029-Dec-08 13700.0028-Nov-08 13075.0029-Oct-08 12150.5029-Sep-08 13136.5028-Aug-08 11938.2029-Jul-08 12795.0025-Jun-08 12274.1528-May-08 12392.8529-Apr-08 11617.00
Silver
Crude
Gold
Currency
Date Price Rs.29-Apr-09 21100.0030-Mar-09 21978.0028-Feb-09 21500.0029-Dec-08 17915.7528-Nov-08 17314.4527-Oct-08 16444.8529-Sep-08 20687.0028-Aug-08 20793.3529-Jul-08 24685.0025-Jun-08 23823.3528-May-08 23967.8529-Apr-08 22575.00
Date Price Rs.29-Apr-09 49.9730-Mar-09 51.1827-Feb-09 51.3329-Dec-08 48.5128-Nov-08 49.5829-Oct-08 49.6129-Sep-08 47.6729-Aug-08 43.9329-Jul-08 42.4929-Jun-08 42.8029-May-08 42.5529-Apr-08 40.41
Date Price $29-Apr-09 50.7230-Mar-09 48.9527-Feb-09 43.6029-Dec-08 37.9328-Nov-08 53.9329-Oct-08 67.6629-Sep-08 99.0029-Aug-08 116.1029-Jul-08 121.7630-Jun-08 141.0629-May-08 126.6229-Apr-08 115.63
0
2000
4000
6000
8000
10000
12000
14000
16000
18000
29-A
pr-0
8
29-M
ay-0
8
29-J
un-0
8
29-J
ul-0
8
29-A
ug-0
8
29-S
ep-0
8
29-O
ct-0
8
29-N
ov-0
8
29-D
ec-0
8
29-J
an-0
9
28-F
eb-0
9
29-M
ar-0
9
29-A
pr-0
9
0
5000
10000
15000
20000
25000
30000
29-A
pr-0
8
29-M
ay-0
8
29-J
un-0
8
29-J
ul-0
8
29-A
ug-0
8
29-S
ep-0
8
29-O
ct-0
8
29-N
ov-0
8
29-D
ec-0
8
29-J
an-0
9
28-F
eb-0
9
29-M
ar-0
9
29-A
pr-0
9
0
20
40
60
80
100
120
140
160
29-A
pr-0
8
29-M
ay-0
8
29-J
un-0
8
29-J
ul-0
8
29-A
ug-0
8
29-S
ep-0
8
29-O
ct-0
8
29-N
ov-0
8
29-D
ec-0
8
29-J
an-0
9
28-F
eb-0
9
29-M
ar-0
9
29-A
pr-0
9
0
10
20
30
40
50
60
29-A
pr-0
8
29-M
ay-0
8
29-J
un-0
8
29-J
ul-0
8
29-A
ug-0
8
29-S
ep-0
8
29-O
ct-0
8
29-N
ov-0
8
29-D
ec-0
8
29-J
an-0
9
28-F
eb-0
9
29-M
ar-0
9
29-A
pr-0
9

D e c e m b e r May 2009
Magnum
D e c e m b e r May 2009
Magnum
24 25D e c e m b e r May 2009
Magnum
D e c e m b e r May 2009
Magnum
24 25
Sectoral Mutual Fund Analysis
ICICI Prudential Infra (G) ICICI Prudential Infrastructure (Growth) scheme is a ICI-CI Prudential Mutual Fund Asset Management managed open-ended Equity – Infrastructure scheme.The fund was launched on September 12, 2005 and its cur-rent net asset as on March 31, 2009 is Rs 2689.67 crore. The benchmark index of the fund is S&P CNX Nifty and the custodian of the fund is the Hongkong and Shanghai Banking Corporation.The current net asset value (NAV) of the fund as on April 29, 2009 is Rs 20.05; while the 52 week high NAV was Rs 29.49 on May 5, 2008 and the 52 week low NAV for the scheme was Rs 14.11 on October 27, 2008. The minimum investment to the fund is Rs 5,000 and additional investments can be made in the multiples of Rs 500.The investment objective of the fund is to invest in equity/equity related securities of the companies belonging to in-frastructure development and the balance in debt securi-ties and money market instruments including call money.The fund charges an entry load of 2.25% for investment below Rs 5 crore, and Exit load of 1% for investment less than Rs 5 crores if redeemed within 6 months from the date of allotment.The portfolio of the fund comprises 62.081% in domestic equities, 27.24% in futures and remaining 10.679 % is of cash and cash equivalents.The top five holdings of the fund are:
On the sectoral basis the fund has the maximum contribu-tion from Capital Goods sector followed by ferrous metals and Telcom services while Cement sector holds 3.28% in the fund.As far as market capitalization-wise companies are con-cerned, the scheme’s portfolio consists of 49.714 % from Large-cap, 4.29% from Mid-cap and 8.07% from Small-cap companies.Crompton Greaves with holding of 1.47%, ACC with hold-
ing of 0.50%, IOC with holding of 0.07% were the latest to be included in the schemes portfolio. On the other hand HDFC with holding of 0.25%, Kotak Mahindra bank with holding of 0.59%,ONGC with holding of 2.34% and Axis bank with holding of 1.69% made their way out from the scheme.The fund has given a return of 19.66% since inception and a negative return of 31.34% in last one year, while the category average in the same period has been -13.69% and -40.61 respectively.
OutlookICICI Prudential Infrastructure (Growth) is one of the best performing fund in its category .The fund is being managed by Sankaran Naren and Mrinal Singh. The fund is an open-ended equity fund focused on capturing the opportunity presented by the long term growth potential of the Indian Infrastructure sector. It invests across infrastructure sectors such as Cement, Power, Telecom, Oil and Gas, Construction, Banking etc and seeks to optimise the risk adjusted return by a mix of top-down macro and bottom-up micro research to pick up stocks providing long term potential. It is a multi-sector fund and therefore has a much lesser concentration risk than a typical sector fund
Market cap-wise Allocation StyleAverage Mkt Cap (Rs Cr) 24064.26Market Capitalization % of Portfolio Large 49.71Mid 4.29Small 8.07Note: Large-Cap = 5000 Crs. and above, Mid-Cap = 2000 Crs. to 5000 Crs. and Small-Cap = less than 2000 Crs.
Duration 1 Week 1 Mth 3 Mth 6 Mth 1 Year 3 Year 5 Year Since Inc.Scheme Return % 2.98 13.02 21.59 32.52 -31.34 7.45 NA 19.66Category Avg % 1.70 13.02 16.96 18.23 -40.61 -4.16 11.17 -13.69
Company RIL Bharti Airtel
HDFC Bank SBI ICICI
Bank% Holding 9.64 8.49 6.51 4.36 3.09
Performance in the last one year
0.00
5.00
10.00
15.00
20.00
25.00
30.00
35.00
2-May-
08
16-Ma
y-08
30-Ma
y-08
13-Jun
-08
27-Jun
-08
11-Jul
-08
25-Jul
-08
8-Aug-
08
22-Aug
-08
5-Sep-
08
19-Sep
-08
3-Oct-0
8
17-Oc
t-08
31-Oc
t-08
14-Nov
-08
28-Nov
-08
12-Dec
-08
26-Dec
-08
9-Jan-
09
23-Jan
-09
6-Feb-
09
20-Feb
-09
6-Mar-0
9
20-Ma
r-09
3-Apr-0
9
17-Apr
-09

D e c e m b e r May 2009
Magnum
D e c e m b e r May 2009
Magnum
26 27D e c e m b e r May 2009
Magnum
D e c e m b e r May 2009
Magnum
26 27
MF Scorecard
Scheme NameNAV(Rs.)
InceptionDate
Absolute % CAGR % AUM
(Rs. cr)1 M 3 M 6 M 1 Y 3 Y 5 Y Since
Inception
Equity - DiversifiedBirla Sun Life India Opp(G) 27.06 21-Jan-95 25 15.94 22.11 8.72 -45.98 -18.80 -0.33 7.25Birla SL Special Situations(G) 6.01 15-Jan-08 361 14.88 18.60 20.78 -36.82 - - -30.07DSPBR Opportunities(G) 45.78 10-Apr-00 675 11.50 18.47 21.09 -33.07 -2.72 13.48 14.11Fidelity Equity(G) 18.27 19-Apr-05 1711 10.71 18.14 19.83 -29.84 -0.02 - 8.30ICICI Pru Dynamic(G) 56.80 18-Oct-02 1046 13.50 18.02 23.67 -28.18 2.20 16.79 21.27Kotak Opportunities(G) 25.31 25-Aug-04 603 11.56 16.29 20.17 -39.15 -0.47 - 13.09Magnum Comma(G) 14.21 25-Jul-05 397 9.48 21.14 22.71 -37.73 -2.15 - 2.46Magnum Multicap(G) 11.02 16-Sep-05 443 11.76 20.04 17.36 -37.06 -8.59 - -2.52Reliance Equity Oppor-Ret(G) 15.14 7-Mar-05 1054 11.23 18.63 17.24 -36.53 -6.18 - 4.45Reliance Natural Resources(G) 6.90 30-Jan-08 3246 9.92 18.49 25.39 -32.44 - - -25.11
Equity - ELSSBirla Sun Life Tax Relief '96(D) 41.86 29-Mar-96 436 -11.59 -8.74 -40.73 -58.87 -6.53 7.89 28.76DSPBR Tax Saver(G) 8.91 26-Dec-06 378 12.38 17.71 17.23 -36.05 - - -9.64Fidelity Tax Advantage(G) 11.08 31-Jan-06 675 10.61 18.15 19.72 -29.65 - - -2.43Franklin India Taxshield(G) 112.25 10-Apr-99 406 13.20 19.73 18.45 -29.87 -4.20 12.45 22.18HDFC Long Term Adv(G) 68.30 27-Dec-00 498 14.77 17.24 13.04 -33.80 -9.94 12.38 21.12Principal Personal Tax saver(G) 54.89 1-Jan-96 296 14.14 21.90 18.78 -42.05 -6.49 7.98 19.99Reliance Tax Saver (ELSS)(G) 10.99 23-Aug-05 1339 12.67 16.74 16.82 -28.51 -6.86 - -1.73Sundaram Taxsaver (D) 26.27 22-Nov-99 621 12.96 14.58 14.07 27.34 -0.37 24.76 19.23
Equity - Large-capBirla Sun Life Equity(G) 145.45 27-Aug-98 671 13.66 18.85 16.71 -36.84 -3.44 15.90 22.84Birla Sun Life Frontline Equity(G) 47.72 30-Aug-02 394 12.60 18.82 23.63 -28.71 3.72 14.62 18.37DSPBR Equity(D) 32.51 15-Apr-97 868 10.97 14.39 15.97 -30.61 1.83 21.93 22.02DSPBR Top 100 Equity(G) 58.18 21-Feb-03 1090 9.70 15.90 19.48 -25.31 6.76 17.09 25.34JM Large Cap(G) 13.14 9-Jun-04 5 19.00 18.80 2.92 -32.39 -10.39 - 2.00Kotak 30(G) 61.70 21-Dec-98 639 9.73 14.55 16.67 -33.48 1.58 16.65 26.47Magnum Equity(D) 16.94 30-Nov-90 218 -9.27 -5.04 -37.61 -50.00 -0.39 13.82 10.09Reliance Equity-Ret(G) 10.25 7-Mar-06 1678 8.03 15.95 12.30 -27.78 0.00 0.00 -3.69Reliance Vision-Ret(G) 150.80 7-Oct-95 2399 10.01 17.74 17.92 -31.96 -1.84 13.28 18.21Sundaram BNPP Growth(G) 52.04 15-Feb-97 93 13.52 14.67 8.49 -41.85 -4.29 11.24 14.88
Equity - Mid-capBirla Sun Life Midcap(G) 51.07 1-Oct-02 298 17.51 18.49 16.36 -39.92 -5.88 13.72 19.73ICICI Pru Emerging S.T.A.R.(G) 15.48 25-Sep-04 234 13.41 16.92 12.01 -53.03 -15.95 - 4.46Kotak Mldcap(G) 12.00 28-Jan-05 75 12.63 12.94 13.80 -46.24 -12.63 - 1.28Reliance Growth-Ret(G) 242.88 7-Oct-95 3240 16.30 21.58 16.57 -34.15 -0.90 20.65 21.93Reliance Reg Sav-Equity(G) 15.43 10-Jun-05 648 13.23 22.88 19.93 -34.98 5.79 - 3.89Sundaram BNPP S.M.I.L.E(G) 15.92 21-Jan-05 115 19.37 21.41 21.01 -37.95 -5.74 - 4.96Sundaram BNPP Slct Midcap(G) 66.19 19-Jul-02 855 17.61 19.49 11.21 -39.69 -4.33 17.61 23.45
Equity - AutoJM Auto Sector(G) 14.13 9-Jun-04 5 16.80 36.06 31.48 -28.52 -17.88 - 0.41
Returns as on 28th April, 2009

D e c e m b e r May 2009
Magnum
D e c e m b e r May 2009
Magnum
26 27D e c e m b e r May 2009
Magnum
D e c e m b e r May 2009
Magnum
26 27
MF Scorecard
Scheme NameNAV(Rs.)
InceptionDate
Absolute % CAGR % AUM
(Rs. cr)1 M 3 M 6 M 1 Y 3 Y 5 Y Since
Inception
Equity - Small-capDSPBR Micro-Cap(G) 5.61 25-May-07 126 20.28 12.67 -0.37 -49.44 - - -20.38HSBC Small Cap(G) 5.67 3-Mar-08 35 18.90 13.90 6.41 -46.83 - - -29.10ICICI Pru CCP-Gift 28.71 6-Aug-01 74 15.95 15.72 8.30 -43.56 -9.25 4.84 10.60Sundaram BNPP Slct Small Cap(G) 5.59 24-Jan-07 145 16.49 15.31 4.89 -47.80 - - -21.47
Equity - Banks & Fin SrvsJM Fin Services Sector(G) 6.32 20-Nov-06 26 5.98 -11.32 -12.74 -56.82 - - -9.46Reliance Banking(G) 43.71 21-May-03 602 16.42 17.83 20.96 -24.22 4.37 16.71 19.96
Equity - ContriarianJM Contra(G) 3.60 14-Aug-07 224 10.40 11.85 -4.61 -68.26 - - -32.45Kotak Contra(G) 12.25 1-Jul-05 61 11.51 16.60 18.97 -29.78 -5.69 - 0.25Tata Contra(G) 8.92 25-Oct-05 71 13.62 20.64 24.52 -37.82 -11.95 - -6.50UTI-Contra(G) 8.65 22-Mar-06 173 10.05 15.49 21.83 -22.28 - - -7.66
Equity - Dividend YieldBirla Sun Life Divi Yield Plus(G) 39.51 7-Feb-03 177 10.64 11.17 18.86 -21.42 -3.26 9.89 19.60Principal Dividend Yield(G) 12.14 27-Sep-04 68 9.96 11.99 11.68 -36.37 -11.84 - 1.04Tata Dividend Yield(G) 15.76 27-Oct-04 78 12.99 18.63 20.73 -32.88 -5.55 - 4.47UTl-Dividend Yield(G) 16.78 3-May-05 932 9.03 14.62 19.52 -21.26 1.77 - 7.34
Equity - Energy / PowerReliance Diver Power Sector(G) 46.77 15-Apr-04 3440 14.54 20.90 23.50 -30.58 16.07 - 24.69Sundaram BNPP Energy Oppor(G) 5.19 11-Dec-07 1153 11.61 16.50 10.78 -39.51 - - -34.13
Equity - FMCGFranklin FMCG(G) 33.79 31-Mar-99 21 9.78 10.57 16.60 -14.96 -0.56 14.76 10.83ICICI Pru FMCG(G) 33.16 5-Mar-99 44 6.73 6.45 11.73 -33.32 -2.37 20.56 10.89Magnum FMCG 13.67 3-Jul-99 6 9.62 14.20 19.39 -14.83 -5.07 10.30 4.71
Equity - GlobalFortis China-India(G) 6.00 1-Oct-07 82 8.28 19.26 28.32 -32.35 - - -21.42Birla Sun Life Intl. Equity-A(G) 7.25 16-Oct-07 134 0.39 3.40 5.05 -27.19 - - -12.36Birla Sun Life Intl. Equity-B(G) 5.96 16-Oct-07 387 9.10 14.17 11.28 -32.97 - - -20.43DSPBR Natural Res-Reg(G) 7.91 31-Mar-08 182 11.12 22.01 26.44 -23.90 - - -20.91Fidelity International Oppor(G) 7.22 30-Apr-07 548 12.73 18.66 15.46 -33.99 - - -16.48Franklin Asian Equity(G) 7.66 18-Dec-07 346 5.88 18.56 26.60 -21.15 - - -20.99Mirae Assel GIbl Comdty Stock(G) 7.52 23-Jul-08 45 6.66 24.24 29.39 -28.22 - - -24.69Templeton India Equity Income(G) 10.48 20-Apr-06 754 11.17 24.67 27.61 -34.40 - - -5.31
Equity - Pharma & HCFranklin Pharma(G) 24.69 31-Mar-99 36 14.36 15.45 15.39 -15.13 -7.37 5.14 7.01Reliance Pharma(G) 20.05 26-May-04 88 9.28 13.21 15.82 -17.00 -2.21 - 9.67
Returns as on 28th April, 2009

D e c e m b e r May 2009
Magnum
D e c e m b e r May 2009
Magnum
28 29D e c e m b e r May 2009
Magnum
D e c e m b e r May 2009
Magnum
28 29
MF Scorecard
Scheme NameNAV(Rs.)
InceptionDate
Absolute % CAGR % AUM
(Rs. cr)1 M 3 M 6 M 1 Y 3 Y 5 Y Since
Inception
Equity - InfrastructureBirla Sun Life Infrastructure(G) 9.44 18-Feb-06 258 14.98 20.87 21.96 -37.89 - - -6.69DSPBR India T.I.G.E.R-Reg(G) 28.78 20-May-04 2322 12.17 22.02 26.59 -35.20 -0.21 - 14.67ICICI Pru Infrastructure(G) 20.05 10-Aug-05 2690 13.02 21.59 32.52 -31.34 7.88 - 9.19Sund BNPP CAPEX Oppor(G) 12.56 5-Sep-05 307 13.91 16.36 -1.57 -47.38 -4.08 - 1.12
Equity - MediaReliance Media & Ent(G) 15.46 27-Sep-04 99 12.56 12.20 12.98 -47.01 -5.91 - 5.20
Equity - MNCBirla Sun Life MNC(G) 95.80 22-Apr-94 99 12.32 19.09 21.76 -23.43 -8.12 8.80 20.77Kotak MNC 20.92 24-Mar-00 21 9.36 14.60 19.72 -26.08 -9.47 10.16 8.73
Equity - QuantReligare AGILE(G) 4.71 23-Nov-07 165 5.61 11.61 19.85 -39.69 - - -26.01Reliance Quant Plus-Ret(G) 7.78 18-Apr-08 38 11.70 20.79 26.59 -25.55 - - -21.64
Equity - Service IndsICICI Pru Services Inds(G) 9.75 18-Nov-05 256 15.93 18.61 15.38 -45.50 -8.92 - -4.58Principal Services Inds(G) 8.84 31-Jan-06 94 13.04 19.30 23.46 -35.00 - - -8.27Tata Service Inds(G) 12.31 10-Mar-05 78 13.75 19.64 11.73 -43.01 -13.79 - -0.30
Equity - TECkBirla Sun Life New Millennium(G) 11.12 15-Jan-00 36 19.44 19.44 6.31 -43.15 -12.57 5.51 -1.04DSPBR Technology.com(G) 16.07 10-Apr-00 53 17.73 17.68 5.92 -43.68 -5.51 10.59 2.90Franklin Infotech(G) 28.38 22-Aug-98 70 15.30 20.72 3.05 -32.80 -16.78 1.96 13.08ICICI Pru Technology(G) 7.27 28-Jan-00 46 19.57 18.60 10.65 -47.81 -16.93 1.57 -5.19JM Telecom Sector(G) 6.54 20-Nov-06 3 19.83 23.44 10.38 -44.96 - - -15.11Kotak Tech 4.88 24-Mar-00 13 12.89 16.73 11.42 -41.09 -19.60 -2.13 -8.71Magnum IT 10.00 3-Jul-99 26 25.47 27.55 -5.30 -51.15 -20.91 1.28 0.14
Equity - Sensex Linked IndexFranklin India Index-Sensex(G) 32.12 27-Aug-01 27 13.27 23.02 25.28 -34.05 -2.91 7.86 10.49HDFC Index-Sensex Plus(G) 130.09 10-Jul-02 30 13.53 20.26 20.17 -28.90 -0.03 11.34 33.83HDFC Index-Sensex(G) 96.72 10-Jul-02 39 13.26 22.01 22.13 -35.91 -5.55 6.16 28.56UTI-SUNDER 364.60 11-Jul-03 7 11.52 22.75 28.67 -31.56 -1.18 9.16 16.34
FOF - DebtBirla Sun Life AA-Cons(G) 16.44 23-Jan-04 5 3.47 4.40 6.88 2.20 8.04 - 7.83
FOF - OverseasICICI Pru Indo Asia Eq(G) 5.99 21-Sep-07 363 12.17 19.09 26.91 -37.47 - - -21.27Sundaram BNPP Global Adv(G) 7.38 31-Jul-07 135 5.28 23.48 28.84 -31.12 - - -14.81
Returns as on 28th April, 2009

D e c e m b e r May 2009
Magnum
D e c e m b e r May 2009
Magnum
28 29D e c e m b e r May 2009
Magnum
D e c e m b e r May 2009
Magnum
28 29
MF Scorecard
Scheme NameNAV(Rs.)
InceptionDate
Absolute % CAGR % AUM
(Rs. cr)1 M 3 M 6 M 1 Y 3 Y 5 Y Since
Inception
Equity - Nifty Linked IndexBirla Sun Life Index(G) 34.82 17-Sep-02 26 11.50 23.42 28.61 -33.61 -3.40 6.78 13.05Magnum Index(G) 29.70 16-Jan-02 15 11.75 23.27 27.36 -34.64 -4.13 6.07 10.90Nifty BeES 351.02 18-Dec-01 118 11.67 22.94 28.95 -32.31 -2.49 7.83 12.37Reliance Banking ETF 518.08 30-May-08 9 16.62 17.70 19.94 - - - -35.76
Arbitrage Funds ICtCI Pru Eq & Deriv-lnc-Ret(G) 12.14 7-Dec-06 250 0.50 1.00 3.06 6.58 - - 6.18SBI Arbitrage Opportunities(G) 12.20 13-Oct-06 348 0.47 0.80 2.96 6.89 - - 4.85UTI-SPrEAD(G) 12.82 22-Jun-06 259 0.86 2.19 5.00 9.74 - - 5.86
Balanced - Equity OrientedKotak Balance 17.41 25-Nov-99 55 10.26 12.73 14.03 -24.84 0.64 15.01 11.88Sundaram BNPP Balanced(G) 28.72 25-May-00 28 8.67 13.07 12.26 -27.59 -3.36 7.56 9.42
Balanced - Debt-OrientedHDFC Children's Gift - Savings 17.00 2-Feb-01 51 4.54 5.84 9.87 1.66 2.85 6.26 8.50ICICI Pru CCP-Study 21.65 6-Aug-01 25 6.07 4.30 6.51 -2.95 6.21 8.27 8.51
FOF - EquityBirla Sun Life AA-Aggr(G) 19.92 23-Jan-04 6 11.65 14.15 15.07 -16.16 2.43 - 9.47FT India Dyn PE Ratio FOFs(G) 27.05 31-Oct-03 38 12.43 19.48 21.24 -11.78 4.75 12.77 11.77ICICI Pru Advisor-Very Aggr(G) 21.24 28-Nov-03 6 10.56 17.79 22.32 -28.16 -1.96 10.35 8.17Kotak Equity FOF(G) 21.28 19-Jul-04 33 12.16 19.22 20.07 -31.55 -4.19 - 9.46
Commodities - GoldGold BeES 1438.85 23-Feb-07 303 -4.17 4.27 19.86 24.79 - - 11.33Kotak GOLD ETF 1442.24 4-Jul-07 56 -4.15 4.25 19.82 24.73 - - 11.42DSPBR World Gold-Reg(G) 11.65 23-Aug-07 1796 -7.78 12.10 66.15 -12.30 - - 0.68Reliance Gold ETF 1401.73 1-Nov-07 190 -4.16 4.11 19.40 22.86 - - 10.42UTI-Gold ETF 1439.90 16-Mar-07 187 -4.17 4.28 19.68 24.62 - - 11.35
Floating Rate - Long TermBirla Sun Life FRF-LT(G) 14.73 4-Jun-03 242 0.81 1.93 4.09 8.88 8.04 6.89 5.38Sundaram BNPP Flexible-FIP-Reg(G) 13.15 24-Dec-04 3 0.71 1.77 3.61 7.66 7.09 - 4.35
Floating Rate - Short TermBirla Sun Life FRF-ST(G) 14.50 4-Jun-03 69 0.50 1.63 3.48 8.41 7.74 6.70 5.20ICICI Pru FRF-Option A(G) 13.69 28-Mar-04 1940 0.49 1.42 3.55 8.14 7.80 - 5.11LICMF FRF-STP(G) 14.39 29-Mar-04 839 0.45 1.75 4.23 9.45 8.71 - 5.92Magnum FRF-STP(G) 13.59 14-Jul-04 15 0.63 1.65 6.46 9.09 7.33 - 4.94
Gilt - Short TermBirla Sun Life Gilt Plus-Liquid(G) 20.29 11-Oct-99 12 0.56 1.09 2.65 4.23 5.85 5.39 6.53
Returns as on 28th April, 2009

D e c e m b e r May 2009
Magnum
D e c e m b e r May 2009
Magnum
30 31D e c e m b e r May 2009
Magnum
D e c e m b e r May 2009
Magnum
30 31
MF Scorecard
Scheme NameNAV(Rs.)
InceptionDate
Absolute % CAGR % AUM
(Rs. cr)1 M 3 M 6 M 1 Y 3 Y 5 Y Since
Inception
Gilt - Long TermBirla Sun Life Gilt Plus-PF(G) 24.13 11-Oct-99 76 4.10 -2.65 7.85 8.25 8.25 5.60 8.74
ICICI Pru Gilt-lnvest(G) 31.65 9-Aug-99 806 6.16 0.35 12.66 30.54 15.17 9.88 11.17
Liquid FundsBirla Sun Life Cash Mgr-Ret(G) 21.62 14-May-98 615 0.48 1.61 3.72 8.28 7.68 6.56 6.49
Birla Sun Life Cash Plus-Ret(G) 23.66 13-Jun-97 7856 0.44 1.43 3.38 8.01 7.75 6.58 6.73
Kotak Liquid(G) 17.25 6-Oct-00 2115 0.43 1.43 3.48 7.98 7.30 6.21 5.45
LICMF Liquid(G) 16.15 13-Mar-02 11023 0.52 1.73 4.09 9.04 8.23 7.06 5.93
Magnum InstaCash-Cash(G) 19.73 19-May-99 2837 0.47 1.54 3.69 8.22 7.68 6.58 6.22
Reliance Liquid-Cash(G) 14.69 4-Dec-01 53 0.14 0.63 2.02 5.98 6.22 5.50 4.29
UTI-Money Mkt(G) 24.74 23-Apr-97 1515 0.52 1.67 3.93 8.68 7.79 6.65 7.07
Liquid PlusBirla Sun Life Savings-Ret(G) 16.44 26-Nov-01 14578 0.55 1.61 3.84 8.54 7.91 6.72 5.47
DSPBR Money Mgr-Reg(G) 1228.17 18-Jul-06 1445 0.67 1.85 4.35 8.56 - - 4.76
ICICI Pru Flexible Income(G) 16.38 21-Sep-02 9261 0.60 1.70 4.04 8.94 8.07 6.22 6.12
Principal Ultra ST-Reg(G) 11.34 6-Nov-07 130 0.60 1.70 4.04 8.85 - - 3.66
Long & Medium Term IncomeReliance Reg Savings-Debt(G) 12.00 10-Jun-05 2 4.15 3.64 4.54 7.72 4.41 - 3.02
UTI-Invest Bond-I(G) 10.46 31-Dec-07 1 -0.08 0.22 0.39 1.76 - - 2.18
Monthly Income PlansBirla Sun Life MIP II-Savings 5(G) 15.30 30-Apr-04 32 3.36 1.68 7.79 18.46 11.63 - 7.14
Birla Sun Life MIP II-Wealth 25(G) 14.61 30-Apr-04 57 8.41 9.23 18.98 1.61 3.05 - 4.92
Birla Sun Life MIP(G) 22.66 10-Nov-00 83 6.21 7.27 16.85 7.76 6.36 6.55 7.74
Birla Sun Life Monthly Income(G) 30.27 14-Jul-99 119 6.21 7.20 15.89 7.82 7.90 7.42 9.95
DBS Chola MIP(G) 16.92 1-Aug-98 18 1.40 1.72 5.13 -1.28 10.17 8.76 5.18
DSPBR Savings Plus-Agg(G) 15.75 20-May-04 60 2.04 3.99 7.92 3.88 7.47 - 7.12
ICICI Pru Income Multiplier(G) 15.85 5-Mar-04 180 9.03 10.13 19.49 1.25 4.34 - 6.17
Magnum Income Plus-Savings(G) 10.53 22-Oct-03 2 -0.16 0.15 0.82 -0.64 0.40 0.82 0.71
UTI-MIS(G) 16.39 11-Oct-02 121 3.37 5.17 11.23 5.57 6.97 6.48 5.70
Short Term Income PlansBirla Sun Life ST-Ret(G) 15.99 19-Apr-02 5599 0.56 1.56 3.72 8.32 8.59 6.95 5.82
DSPBR ST(G) 15.22 4-Sep-02 37 0.69 1.68 4.05 8.40 7.39 6.33 5.15
Sund BNPP Slct Dbt-STAP(G) 14.97 30-Aug-02 0 0.16 0.59 1.69 5.47 7.32 6.22 5.09
Real Estate Securities
ICICI Pru Real Estate Sec-Ret(G) 9.09 14-Dec-07 340 2.08 3.25 5.60 -5.75 - - -4.18
Returns as on 28th April, 2009

D e c e m b e r May 2009
Magnum
D e c e m b e r May 2009
Magnum
30 31D e c e m b e r May 2009
Magnum
D e c e m b e r May 2009
Magnum
30 31
Currency Futures
‘Future’ is Bright for Currency TradingThe Indian economy is integrating at a faster pace with the rest of the world. Indian Financial Markets have also been growing significantly; the equity markets have shown a growth of almost 35-40% in past one and a half month. And the currency futures market is no exception to the story, the average daily turnover in the segment has in-creased from $60 million to $700-800 million and show-ing the signs of crossing the magical figure of $1 billion in consonance with the increasing interest of the traders in currency future transactions. Liberalization has helped the Indian forex markets in various ways; the extensive fluctuations of exchange rates have attracted a great deal of interest from policymakers and investors. The SEBI has made a welcome move in the month of March, 2009 by increasing the daily forex futures limits by 100% to $10 million for traders and $50 million for brokers this is going to help in the long way to the currency futures market. The initiative will help in addressing the concerns of entities which are engaged in bulky forex transactions and will increase the liquidity in this segment. Apart from this the policy makers are going to take a final call to al-low Foreign Institutional Investors (FIIs) and Non Resident Indians (NRIs) in the currency futures market in coming three to four months, the move will provide the much needed depth to the market. Currently, only dollar-rupee contracts are available for trad-ing because there is hardly any demand for contracts on other currencies however a SEBI-RBI led technical com-mittee has already given its nod to introduce the contracts
on other currencies as well, the exchanges may also be allowed to decide the timing of the trading session and products which they desire to start. Currently there are three exchanges which offer currency futures trading; the National Stock Exchange (NSE), the Bombay Stock Exchange (BSE) and the Multi Commodity Exchange (MCX-SX) and a new exchange will go live in July, 2009 which is being floated by MMTC.As we can see in the above mentioned chart 1, since January 1, 2009 to till date currency market has shown a reasonable move upward as well as downward leaving an enough room for traders and investors to take their call. The dollar-rupee rates increased from sub 48.73 levels to the highs of 52.06 on March 5, 2009 the period dur-ing which the stock market was under pressure as shown in Chart 2 when the CNX Nifty-50 came down from sub 3,033 levels to 2,573 indicating a more selling by Foreign Institutional Investors (FIIs) which total to Rs 6,681.90 crore worth of FII selling during January, 2009 to Febru-ary, 2009; because of which demand for dollar increased resulting in a sharp up move in dollar as indicated in the Chart 1. Since March first week CNX Nifty-50 has shown a sharp up move during which the index has increased al-most 35% resulting in depreciation in dollar from the high of 52.06 to around 49.50 levels. In the past four months the dollar and the equities are showing an inverse relation-ship with each other which can be concluded by looking at both the charts together.Difference between Base Currency and Terms CurrencyIn foreign exchange markets, the base currency is the first currency in a currency pair and the second currency is called as the terms currency. Exchange rates are quoted in per unit of the base currency. E.g. the expression Dollar – Rupee, tells you that the Dollar is being quoted in terms of the Rupee. The Dollar is the base currency and the Ru-pee is the terms currency.Exchange rates are constantly changing, which means that the value of one currency in terms of the other is constantly in flux. Changes in rates are expressed as strengthening or weakening of one currency vis-à-vis the second curren-cy. Changes are also expressed as Appreciation or depre-ciation of one currency in terms of the second currency. Whenever the base currency buys more of the terms cur-rency, the base currency has strengthened / appreciated and the terms currency has weakened / depreciated. E.g. If Dollar – Rupee moved from 50.00 to 50.50. The Dollar has appreciated and the Rupee has depreciated.Clearing & Settlement of Currency Future TradesThe clearing and settlement of all trades executed on the Currency Derivatives Segment of the National Stock Ex-change (NSE) is done through National Securities Clear-ing Corporation (NSCCL). It also acts as legal counterpar-ty to all trades on the Currency Derivatives segment and guarantees their financial settlement. The NSCCL takes help of clearing members and clearing banks for clearing and settlement of trades.
48
48.5
49
49.5
50
50.5
51
51.5
52
52.5
1-Ja
n-09
8-Ja
n-09
15-J
an-0
9
22-J
an-0
9
29-J
an-0
9
5-Fe
b-09
12-F
eb-0
9
19-F
eb-0
9
26-F
eb-0
9
5-M
ar-0
9
12-M
ar-0
9
19-M
ar-0
9
26-M
ar-0
9
2-A
pr-0
9
9-A
pr-0
9
16-A
pr-0
9
Chart 1= Dollar-Rupee Exchange Rates: Since January, 2009
$ v/s Rs.
Chart 2= CNX Nifty-50: Since January, 2009 CNX Nifty-50
2,500.002,600.002,700.002,800.002,900.003,000.003,100.003,200.003,300.003,400.003,500.00
1-Ja
n-09
8-Ja
n-09
15-J
an-0
9
22-J
an-0
9
29-J
an-0
9
5-Fe
b-09
12-F
eb-0
9
19-F
eb-0
9
26-F
eb-0
9
5-M
ar-0
9
12-M
ar-0
9
19-M
ar-0
9
26-M
ar-0
9
2-A
pr-0
9
9-A
pr-0
9
16-A
pr-0
9

D e c e m b e r May 2009
Magnum
D e c e m b e r May 2009
Magnum
32 33D e c e m b e r May 2009
Magnum
D e c e m b e r May 2009
Magnum
32 33
Clearing MembersIn the Currency Derivatives segment, trading member-cum-clearing member, clear and settle their own trades as well as trades of other trading members (TMs). Be-sides, there is a special category of members, called pro-fessional clearing members (PCM) who clear and settle trades executed by TMs. The members clearing their own trades and trades of others, and the PCMs are required to bring in additional security deposits in respect of every TM whose trades they undertake to clear and settle.Clearing BanksFunds settlement takes place through clearing banks. For the purpose of settlement all clearing members are required to open a separate bank account with NSCCL designated clearing bank for Currency Derivatives seg-ment. The Clearing and Settlement process comprises of the following three main activities:1) Clearing2) Settlement3) Risk ManagementClearing MechanismThe clearing mechanism essentially involves working out open positions and obligations of clearing (trading-cum-clearing/professional clearing) members. This position is considered for exposure and daily margin purposes. All futures contracts are cash settled, i.e. through ex-change of cash in Indian Rupees. The settlement amount for a CM is netted across all their TMs/clients, with respect to their obligations on mark to mark (MTM) settlement.Settlement MechanismCurrency futures contracts have two types of settlements, the mark to market (MTM) settlement which happens on a continuous basis at the end of each day, and the final settlement which happens on the last trading day of the futures contract.Mark to Market settlement (MTM Settlement):All futures contracts for each member are marked-to-market (MTM) to the daily settlement price of the relevant futures contract at the end of each day. The profits/losses are computed as the difference between:1. The trade price and the day’s settlement price for con-tracts executed during the day but not squared up.2. The previous day’s settlement price and the current day’s settlement price for brought forward contracts.3. The buy price and the sell price for contracts executed during the day and squared up.After completion of daily settlement computation, all the open positions are reset to the daily settlement price. Such positions become the open positions for the next day.Final Settlement for FuturesOn the last trading day of the futures contracts, after the close of trading hours, NSCCL marks all positions of a CM to the final settlement price and the resulting profit/loss is settled in cash. Final settlement loss/profit amount
is debited/ credited to the relevant CM’s clearing bank ac-count on trading plus two (T+2) working day following the Contract expiry Day.Settlement Prices for FuturesDaily settlement price on a trading day is the closing price of the respective futures contracts on such day. The clos-ing price for a futures contract is currently calculated as the last half an hour weighted average price of the con-tract in the Currency Derivatives Segment of NSE. The final settlement price is the RBI reference rate on the last trading day of the futures contract. All open positions shall be marked to market on the final settlement price. Such marked to market profit / loss shall be paid to / received from clearing members.The main difference between currency futures and equity futures is the final settlement price. For equity futures the final settlement price is the spot price of its underlying at the time of expiry whereas for currency futures the final settlement price is the RBI’s reference rate which is con-sidered as a spot rate for the currency. Reasons for Traders to Trade in Currency Futures
• Decent Intra Day Volatility: The past six to eight months have witnessed a intraday volatility of around 43 paisa and 52 paisa in the currency futures segment of NSE and MCX, which leaves an handsome opportunity for the traders to make most out of it.
• Low Margins: The margins on the trades on NSE have been slashed by almost 50% which results in margin of 3 to 3.5% of contract value for currency futures against the average margin of 10 to 15% on index or stock fu-tures.
• Low Brokerage Rates: The brokerage rates vary be-tween 3 to 10 basis points depending on volumes and holding period.
• Sound Clearing and Settlement Mechanism: As we have seen earlier the clearing and settlement process followed by NSE is very sound and it is similar to one which is followed for index and stock futures settle-ment.
• Increasing Volumes: The volumes have been increas-ing consistently since the introduction of the currency futures trading on the exchanges in August. With SEBI’s move to increase the daily forex futures limits by 100% for traders and brokers will provide more liquidity and make trading more feasible in days to come.
ConclusionWhen there are two markets in existence for the same commodity and if there is no integration between both of them then it creates an arbitrage opportunity for the arbi-tragers which brings about convergence in both the mar-kets, as there can not be two different prices for the same commodity with the same features, the same opportunity lies in currency forward and currency futures market which leaves a tremendous opportunity for the volumes in the currency futures market to rise exponentially in coming days which will create more and more trading and hedg-ing opportunities for the market participants.
Currency Futures

D e c e m b e r May 2009
Magnum
D e c e m b e r May 2009
Magnum
32 33D e c e m b e r May 2009
Magnum
D e c e m b e r May 2009
Magnum
32 33
TECHNICAL ANALYSIS: The Voodooism of Stock MarketsMarkets move in a zigzag manner: rallying, leveling off, and surging again, only to be hit by a wave of profit-tak-ing before settling into a trading range, awaiting the next reason to advance or retreat. This activity carries on in the general direction of the trend, easily seen on a price chart. Technical analysis, as opposed to the fundamental school of thought, finds its roots in the behavioral pattern of price following trends which claims to forecast the future move-ment in prices. Technical analysis ignores and rubbishes the intrinsic/fundamental value of a stock as propounded by fundamental analysis. Technical analysis is frequently contrasted with fundamental analysis, the study of eco-nomic factors that influence prices in financial markets. Technical analysis holds that prices already reflect all such influences before investors are aware of them, hence the study of price action alone.Technically, the trend should be considered up as long as the market unfolds with a series of higher lows and higher highs. Similarly, the trend is considered down if the price action is a series of lower lows, with lower highs before each new low. A market is considered not to be in a trend if the price movement manifests itself in a series of fits and starts or if it fails to sustain levels beyond the previous extreme points, often reversing and forming the range. Technical analysts (popularly called technicians) seek to identify price patterns and trends in financial markets and attempt to exploit those patterns. As technicians use vari-ous methods and tools, the study of price charts is of ut-most importance.Technical analysis is based on certain tenets under which there are many approaches to study the price pattern in order to make a valuable judgement for the future. Assumptions Technicians opine that a market price of the stock reflects all relevant information, so their analysis looks more at in-ternals than at externals such as news events. Price ac-tion also tends to repeat itself because investors collec-tively tend toward patterned behavior – hence technicians’ focus on identifiable trends and conditions.A) The action of the markets discounts everythingAs all relevant information is already reflected by prices, pure technical analysts believe it is redundant to do funda-mental analysis and hold that news events do not signifi-cantly influence price, and cite supporting research.On most of the sizable return days the information that the press cites as the cause of the market move is not particularly important. Press reports on adjacent days also fail to reveal any convincing accounts of why future prof-its or discount rates might have changed. Our inability to
FII Trends
identify the fundamental shocks that accounted for these significant market moves is difficult to reconcile with the view that such shocks account for most of the variation in stock returns.B) Prices follow in trendsTechnical analysts believe that prices follow certain trends. Technicians say that markets trend up, down, or sideways. This basic definition of price trends is the one put forward by Dow Theory.Each time the stock rises, sellers would enter the mar-ket and sell the stock; hence the zig-zag movement in the price. The series of lower highs and lower lows is a tell tale sign of a stock in a down trend. In other words, each time the stock edged lower, it fell below its previous relative low price. Each time the stock moved higher, it could not reach the level of its previous relative high price.C) History repeats itselfTechnicians believe that investors collectively repeat the behavior of the investors that preceded them. To a techni-cian, the emotions in the market may be irrational, but they exist. Because investor behavior repeats itself so often, technicians believe that recognizable (and predictable) price patterns will develop on a chart.Technical analysis is not limited to charting, but it always considers price trends. For example, many technicians monitor surveys of investor sentiment. These surveys gauge the attitude of market participants, specifically whether they are bearish or bullish. Technicians use these surveys to help determine whether a trend will continue or if a reversal could develop; they are most likely to antici-pate a change when the surveys report extreme investor sentiment. Support and resistance are the key junctures where the forces of supply and demand meet. In the financial mar-kets, prices are driven by excessive supply (down) and demand (up). Supply is synonymous with bearish, bears and selling. Demand is synonymous with bullish, bulls and buying. As demand increases, prices advance and as sup-ply increases, prices decline. When supply and demand are equal, prices move sideways as bulls and bears slug it out for control. Support Support is the price level at which demand is thought to be strong enough to prevent the price from declining further. The logic dictates that as the price declines towards sup-port and gets cheaper, buyers become more inclined to buy and sellers become less inclined to sell. By the time the price reaches the support level, it is believed that de-mand will overcome supply and prevent the price from fall-ing below support. Support levels are usually below the current price, but it is not uncommon for a security to trade at or near support. Technical analysis is not an exact science and it is some-

D e c e m b e r May 2009
Magnum
D e c e m b e r May 2009
Magnum
34 35D e c e m b e r May 2009
Magnum
D e c e m b e r May 2009
Magnum
34 35
times difficult to set exact support levels. In addition, price movements can be volatile and dip below support briefly. Sometimes it does not seem logical to consider a support level broken if the price closes 1/8 below the established support level. For this reason, some traders and investors establish support zones. Resistance Resistance is the price level at which selling is thought to be strong enough to prevent the price from rising further. The logic dictates that as the price advances towards re-sistance, sellers become more inclined to sell and buyers become less inclined to buy. By the time the price reaches the resistance level, it is believed that supply will over-come demand and prevent the price from rising above resistance. Resistance does not always hold and a break above resis-tance signals that the bulls have won out over the bears. A break above resistance shows a new willingness to buy and/or a lack of incentive to sell. Resistance breaks and new highs indicate buyers have increased their expecta-tions and are willing to buy at even higher prices. In addi-tion, sellers could not be coerced into selling until prices rose above resistance or above the previous high. Once resistance is broken, another resistance level will have to be established at a higher level. Support & Resistance levels of Nifty
In the chart of Nifty during the period January to April, the support and resistance levels have been shown. Starting from the lowest level, the support level is hovering around 2550 in March. The next support level is visible at the level tad lower from 2700. At the level of nearly 2950, a resistance level is estab-lished, which precedes the 3100 level as the new support level. Every resistance becomes the next support level if the market improves, just as 3100 was a resistance, it be-comes the new support level when Nifty advances further to the level 3300, which is a resistance level. Again, when Nifty breakouts towards 3500 level, previous resistance level of 3300 becomes the support level for the range bound market in the bracket 3300-3500.After the resistance level tastes a breakout, a new resis-tance level is formed and the former resistance level be-
comes the support of the new price pattern.Fibonacci RatioReverend mathematician Leonardo Fibonacci, through the process of solving a mathematical riddle, discovered a unique mathematical sequence or series wherein the ratio of any two consecutive numbers approximates 1.618 or its inverse, 0.618. The Fibonacci sequence is the sum of any two adjacent numbers that forms the next number in the series. The first 14 terms in the sequence are 1, 1, 2, 3, 5, 8, 13, 21, 34, 55, 89, 144, 233, 377. The ratios of each two consecutive numbers from the series are 1, 0.50, 0.666, 0.60, 0.625, 0.615, 0.619, 0.618, 0.618..., and between al-ternate numbers, the ratio is 2.618 and its inverse, 0.382. The Fibonacci ratio is also referred to as the Golden Ratio or the Golden Mean.As far as applications of the Fibonacci number is con-cerned in the technical analysis, the golden ratio is trans-lated into three different percentages- 38.2%, 50% and 61.8%. Apart from applying the golden ratio for retrace-ments, arcs and fans, it is also used in determining the time zones. Time zones are typically a series of vertical lines that are constructed by dividing a chart into segments with vertical lines spaced in increments in accordance with the Fibo-nacci sequence (1,1,2,3,5,8,13,21,34, etc.). Time zones represent the sensitive areas from where major price movements can be expected.
In the given chart of Nifty spanning January to April, three time zones have been drawn following Fibonacci se-quence. As the time zone has divided the chart into three parts, major price changes can be traced from the pattern of the breakup of the chart.The first part is conclusive of fresh low ahead days to come. Time zone, however, is not the facilitator of an up-tick or downtick, rather, it gives a direction of the price pat-tern. In the second part of the time zone, it ends up with a new incentive for a price transformation after taking a dip in the middle. Later, in the third part, it touches new highs in conformity with a directional move as propounded by the Fibonacci sequence.However, the results of Fibonacci ratio must be applied in conjunction with other tools to make meaningful insights.
FII Trends

D e c e m b e r May 2009
Magnum
D e c e m b e r May 2009
Magnum
34 35D e c e m b e r May 2009
Magnum
D e c e m b e r May 2009
Magnum
34 35
(SIP) - Insurance
Systematic Investment Plan (SIP) The formula for getting your dreams come true – start early & invest regularlyA systematic investment plan (SIP) is a method of in-vesting a fixed sum, on a regular basis, in a mutual fund scheme – almost similar to regular saving schemes like a recurring deposit. In simple words it’s a drop of water to create an ocean.
One time lump sum investment means that you just hand over the cheque and you get your fund units depending on the value of the units on that particular day.
But in the periodic investments, or SIP, one has to commit to invest a regular sum at a regular interval of time. For example if one puts Rs 1,000 monthly in a fund, then at the end of a year, he would have invested Rs 12,000. Let us suppose that the NAV on the day of investment in the first month is Rs 20; one will get 50 units. The next month, the NAV is Rs 25 then same fund will add 40 units similarly if the NAV goes down the following month to Rs 18 then it will accumulate 55.56 units.
So, after three months, there will be total of 145.56 units. On an average, one would have paid around Rs 21 per unit. This is because, when the NAV is high, one get fewer units while when the NAV falls, one get more units.
The SIP investment is meant for common investors who lack market knowledge, expertise of investing and do not have the big pool of money. It is an ultimate solution for different worries, instead of timing the market. Investing month after month will ensure that one is invested at the high and the low, and make the best out of an opportunity that could be tough to predict in advance, comparatively lower risk and a possibility of much, much higher return then recurring deposits like saving schemes.
It offers a disciplined way to invest a portion of one’s in-come at regular intervals without trying to second-guess the market, protecting the investor from extreme fluctua-tions in the market.
The method of SIP is very simple – one have to identify the funds he want to invest in and the amount required to achieve his financial goals, and after payment through the agency on a regular interval, the units gets allotted to the fund based on the NAV on the date of each transaction, which reflects to the fund account.
One thing will have to be kept in mind is that liquid funds, cash funds and floating rate debt funds do not offer an SIP. These are funds that invest in very short-term fixed-return investments. Floating rate debt funds invest in fixed return investments where the interest rate moves in tandem with interest rates in the economy.
As far as the tax implications are concerned if one sells
the units after a year of buying, he does not have to pay capital gains tax but if he sells before a year, capital gains tax of 10% is applicable.
SIP is a process of compounding and the power of com-pounding underlines the essence of making money work, if only invested at an early age. The longer one delays in investing, the greater the financial burden to meet desired goals. Saving a small sum of money regularly at an early age makes money work with greater power of compound-ing with significant impact on wealth accumulation.
Advantages of SIPThe investments we make are ultimately for some objec-tives such as to buy a house, children’s education, mar-riage etc; and many of them require a huge one-time in-vestment. SIP offers a disciplined way to invest a portion of one’s income at regular intervals without trying to second-guess the market, protecting the investor from extreme fluctuations in the market and providing an opportunity to build the corpus over a longer period of time.
Qualified and experienced professionals who have the expertise of investment techniques, backed by dedicated investment research team, manage mutual fund invest-ments. One can purchase a scheme’s units at a lesser cost as most asset management companies (AMCs) charge less ‘entry load’, while some scheme do not even charge anything for SIP investments, as compared to nor-mal purchases in the scheme.
The power of compounding underlines the essence of making money work if only invested at an early age. The longer one delays in investing, the greater the financial burden to meet desired goals. Saving a small sum of money regularly at an early age makes money work with greater power of compounding with significant impact on wealth accumulation.
SIP gives an advantage that even with small amounts one can enjoy the benefits of diversification as diversification reduces the overall impact on the returns from a portfolio.
SIP is disciplined investing, irrespective of the state of the market making the market timing totally irrelevant.
The Systematic Investment Plan (SIP) is a simple and time honored investment strategy for accumulation of wealth in a disciplined manner over a long-term period. It makes the volatility in the market work in favour of the investor. Since a fixed amount is invested, more units are purchased when a scheme’s NAV is low and fewer units when the NAV is high. As a result, over a period of time these market fluctuations are generally averaged. Thus the average cost of investment is often reduced.
The method aims at a better future for its investors as a SIP investor gets good rate of returns compared to a one time investor

D e c e m b e r May 2009
Magnum
D e c e m b e r May 2009
Magnum
36 PB
(ICICI Lombard) - Insurance
ICICI Lombard - Car InsuranceThe number of road accidents in India is estimated to be three times vis-a-vis developed countries. The number of accidents for 1000 vehicles in India is as high as 35 while the figure ranges from 4 to 10 in developed countries.
Comprehensive insurance cover type of insurance includes all the risks covered in the Motor Vehicles Act plus loss or damage caused to the vehicle due to different vagaries like accident, fire, explosion, self-ignition, lightning, burglary, house-breaking, theft riots & strikes, earthquakes, etc.
Comprehensive insurance serves as an add-on to the mandatory third-party cover and protects the vehicle owner from financial losses, caused by damage or theft
ICICI Lombard has launched a comprehensive package policy for four-wheelers in India, covering Third Party Liability (TPL) for bodily injury and/or death, personal accident cover for owner-driver and loss or damage to the vehicle insured (Own Damage or OD). This policy gives an unique advantage so that now you can insure your vehicle against acts of terrorism, even when you’re away.
Policy CoverageThe policy provides coverage against loss or damage to the vehicle or its accessories due to natural and man-made calamities.
Natural calamities include fire, explosion, self-ignition or lightning, earthquake, flood, typhoon, hurricane, storm, tempest, inundation, cyclone, hailstorm, frost, landslide and rockslide.
The man made calamities cover burglary, theft, riot, strike, malicious act, accident by external means, terrorist activity, any damage in transit by road, rail, inland waterway, lift, elevator or air.
The policy gives an advantage to customise the insurance with additional covers for electrical and/ or non-electrical items fitted to the vehicle, which can be insured separately. For example: fog lights, music system, seat covers, etc.
Above all, the policy is governed by the Indian Motor Tariff Act.
Key BenefitsThe policy not only covers the vehicle, but also provides a compulsory personal accident cover of Rs 2 lakh for individual owners of the vehicle while driving. One can also opt for a personal accident cover for passengers.
A digitally signed policy is issued immediately through online facility and it also has an online payment option through ICICI Bank, HDFC Bank and Citibank EMI through credit card is available without any extra charge.
(EMI option is available subject to minimum annual
premium of Rs 1500)
Towing charges can be claimed up to Rs 1,500. Cashless claim settlement is available at ‘All India Cashless Garage List’ all across India.
Apart from this, there are lots of bonuses and discounts available with the policy like
No Claim Bonus (NCB): If one do not make a claim during the policy period, a NCB is offered on renewals, this discount can go as high as 50%, and it can be transferred in full when one shift his motor insurance policy to another company.
Voluntary Excess Discount: A further discount on the premium is available if one opts for a Voluntary Excess in addition to the Compulsory Excess. (Compulsory Excess is the amount of loss, which the insured has to bear in each and every claim.)
Additional discounts: Apart from above, one can also avail of additional discounts if on is a member of a recognized Automobile Association in India.
There are certain Policy Exclusions that includes
• Normal wear, tear and general aging of the vehicle
• Depreciation or any consequential loss
• Mechanical/ electrical breakdown
• Wear and tear of consumables like tyres and tubes
• Vehicle being used other than in accordance with limitations as to use
• Damage to/ by a person driving the vehicle without a valid license
• Damage to/ by a person driving the vehicle under the influence of drugs or liquor
• Loss/ damage due to war, mutiny or nuclear risk
Motor Claim ProcedureIn case of motor insurance claim, one can avail cashless facility for the repair of the car in any of the company’s All India Cashless Garage List. However, if the car is serviced in a garage outside the purview of its network, one can claim reimbursement for the same.
In case of an accident, it is advised to note the number of the other vehicle involved in the accident, if any. Jot down the names and contact details of witnesses, if any. File an FIR at the nearest police station in case of property damage, bodily injury, theft and major damages.
Register the claim to the insurance company’s office and after registering the claim, the customer service manager will contact the policyholder within 24 hours of registering the claim.