20101105 tradeline animal facilities 2010.ppt
TRANSCRIPT

Animal Research Facilities 2010Tradeline Conference Series
NEW CAGEWASH DECISIONS NEW CAGEWASH DECISIONS FOR RAISING EFFICIENCY,
LOWERING OPERATING COSTS, AND CUTTING LABOR
Concurrent Forum Session “G”
November 08 & 09 2010November 08 & 09 2010
Lloyd E.L. Fisk, AIA LEED APPaul Lemestre, PE LEED AP
Research Facilities Design
PRESENTATION OUTLINE
I. Introduction
II Cagewash Metric AnalysesII. Cagewash Metric Analyses
III. Cagewash Layout Issues
IV. MEP System Issues
V. Conclusions
Please ask questions as you think of them
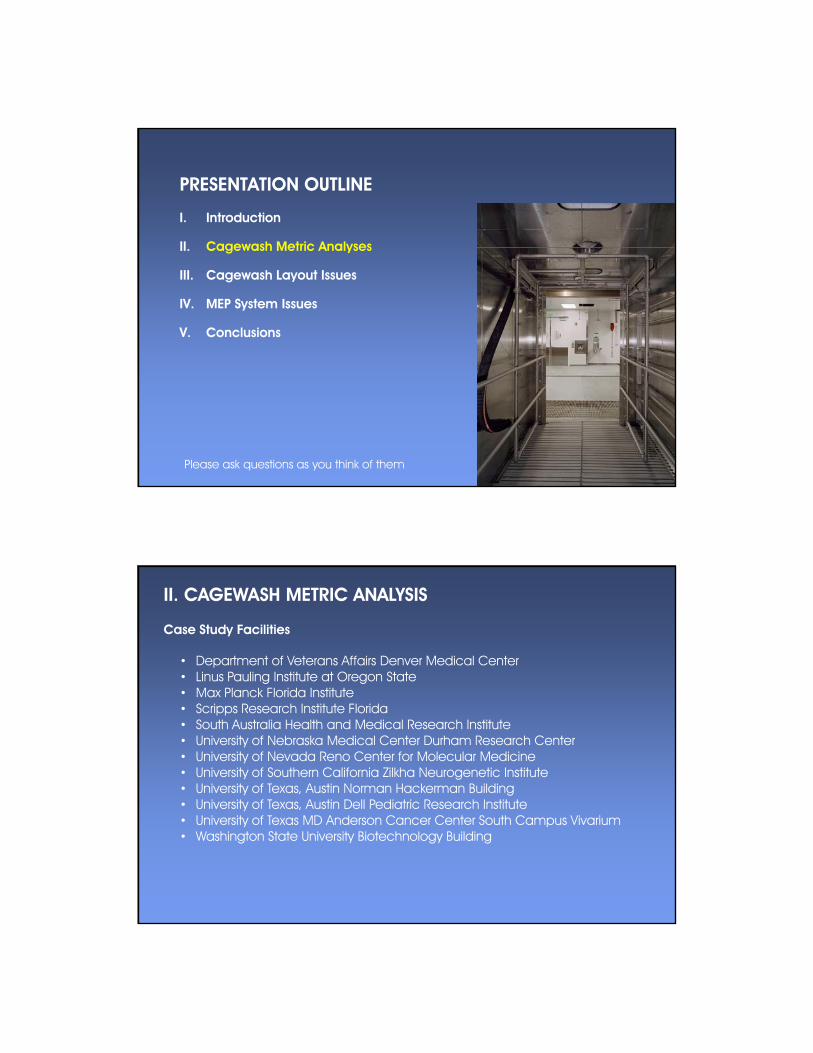
PRESENTATION OUTLINE
I. Introduction
II Cagewash Metric AnalysesII. Cagewash Metric Analyses
III. Cagewash Layout Issues
IV. MEP System Issues
V. Conclusions
Please ask questions as you think of them
II. CAGEWASH METRIC ANALYSIS
• Department of Veterans Affairs Denver Medical Center• Linus Pauling Institute at Oregon State
Case Study Facilities
• Max Planck Florida Institute • Scripps Research Institute Florida • South Australia Health and Medical Research Institute• University of Nebraska Medical Center Durham Research Center• University of Nevada Reno Center for Molecular Medicine • University of Southern California Zilkha Neurogenetic Institute • University of Texas, Austin Norman Hackerman Building• University of Texas Austin Dell Pediatric Research Institute• University of Texas, Austin Dell Pediatric Research Institute • University of Texas MD Anderson Cancer Center South Campus Vivarium • Washington State University Biotechnology Building

II. CAGEWASH METRIC ANALYSIS
Case Study Facilities – Completion Year
4
1
2
3
0
2003 2004 2005 2006 2007 2008 2009 2010 2011 2012 2013
II. CAGEWASH METRIC ANALYSIS
Case Study Facilities – Overall Vivarium Size (NSF)
60000
20000
30000
40000
50000
0
10000
1 2 3 4 5 6 7 8 9 10 11 12

II. CAGEWASH METRIC ANALYSIS
Case Study Facilities – Vivarium Cage Capacity
35000
10000
15000
20000
25000
30000
0
5000
1 2 3 4 5 6 7 8 9 10 11 12
II. CAGEWASH METRIC ANALYSIS
Cagewash as a % of Overall Vivarium NSF

II. CAGEWASH METRIC ANALYSIS
Cagewash as a % of Overall Vivarium NSF
25%
10%
15%
20%
0%
5%
1 2 3 4 5 6 7 8 9 10 11 12
II. CAGEWASH METRIC ANALYSIS
Cagewash as a % of Overall Vivarium NSF
25%60000
5%
10%
15%
20%
20000
30000
40000
50000
Total Vivarium NSF
Cagewash % of Facility
0%
5%
0
10000
1 2 3 4 5 6 7 8 9 10 11 12

II. CAGEWASH METRIC ANALYSIS
Cagewash as a % of Overall Vivarium NSF
25%60000
10%
15%
20%
20000
30000
40000
50000
Total Vivarium NSF
Cagewash % of Facility
Linear (Cagewash % of Facility)
0%
5%
0
10000
1 2 3 4 5 6 7 8 9 10 11 12
II. CAGEWASH METRIC ANALYSIS
Holding Capacity (Cages)/ NSF of Cagewash Suite

II. CAGEWASH METRIC ANALYSIS
Holding Capacity (Cages)/ NSF of Cagewash Suite
14.00
6.00
8.00
10.00
12.00
5.32
0.00
2.00
4.00
1 2 3 4 5 6 7 8 9 10 11 12
II. CAGEWASH METRIC ANALYSIS
Holding Capacity (Cages)/ NSF of Cagewash Suite
14.00
6.00
8.00
10.00
12.00
4.64
0.00
2.00
4.00
1 2 3 4 5 6 7 8 9 10 11 12

II. CAGEWASH METRIC ANALYSIS
Holding Room NSF/ NSF of Cagewash Suite
II. CAGEWASH METRIC ANALYSIS
Holding Room NSF/ NSF of Cagewash Suite
3 00
3.50
1.50
2.00
2.50
3.00
1.69
0.00
0.50
1.00
1 2 3 4 5 6 7 8 9 10 11 12

II. CAGEWASH METRIC ANALYSIS
Dirty Cagewash/ Clean Cagewash
II. CAGEWASH METRIC ANALYSIS
Clean Cagewash/ Dirty Cagewash
1.60
1.80
1.08
0.60
0.80
1.00
1.20
1.40
1.60
0.00
0.20
0.40
1 2 3 4 5 6 7 8 9 10 11 12

II. CAGEWASH METRIC ANALYSIS
Disposable Caging Option
II. CAGEWASH METRIC ANALYSIS
Disposable Caging Option
6,500 Cage Capacity
Change @ 14 Days
3,250 Cages/ Week
14,000 Cages/ Month
= 14 Clean Pallets of Storage
+ 14 Dirty Pallets of Storage
+ Handling/ Maneuvering Space
= 1,300 NSF of Cage Handling Space
II. CAGEWASH METRIC ANALYSIS
Disposable Caging Option – Cagewash as a % of Overall Vivarium
25%60000
10%
15%
20%
20000
30000
40000
50000
Total Vivarium NSF
Cagewash % of Facility
Linear (Cagewash % of Facility)
0%
5%
0
10000
1 2 3 4 5 6 7 8 9 10 11 12
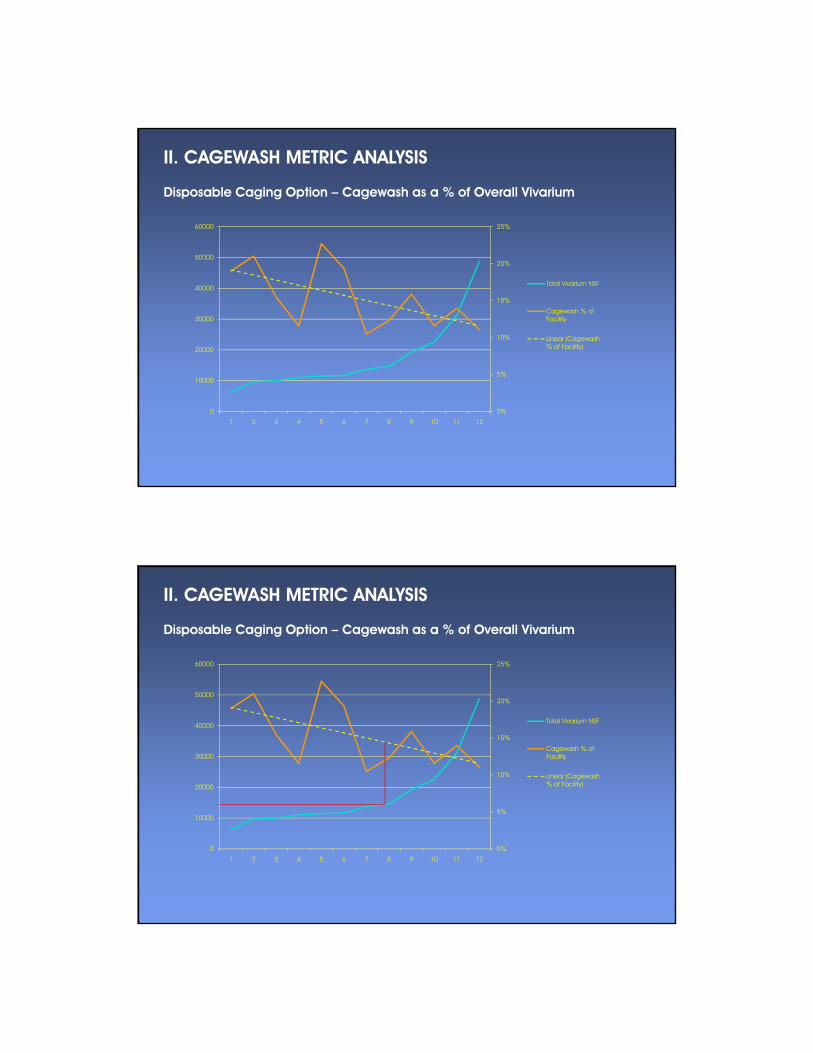
II. CAGEWASH METRIC ANALYSIS
Disposable Caging Option – Cagewash as a % of Overall Vivarium
25%60000
10%
15%
20%
20000
30000
40000
50000
Total Vivarium NSF
Cagewash % of Facility
Linear (Cagewash % of Facility)
0%
5%
0
10000
1 2 3 4 5 6 7 8 9 10 11 12

II. CAGEWASH METRIC ANALYSIS
Disposable Caging Option – Cagewash as a % of Overall Vivarium
25%60000
10%
15%
20%
20000
30000
40000
50000
Total Vivarium NSF
Cagewash % of Facility
Linear (Cagewash % of Facility)9%
0%
5%
0
10000
1 2 3 4 5 6 7 8 9 10 11 12
II. CAGEWASH METRIC ANALYSIS
Disposable Caging Option – Cagewash as a % of Overall Vivarium
25%60000
10%
15%
20%
20000
30000
40000
50000
Total Vivarium NSF
Cagewash % of Facility
Linear (Cagewash % of Facility)9%
0%
5%
0
10000
1 2 3 4 5 6 7 8 9 10 11 12?

II. CAGEWASH METRIC ANALYSIS
Metrics Summary
Cagewash as a % of Facility NSF: 12-18%
H ldi C it (C )/NSF C h 2 6 CHolding Capacity (Cages)/NSF Cagewash 2-6 Cages
Holding Room NSF/ NSF Cagewash 1:1 to 2.5:1
Clean Cagewash/ Dirty Cagewash 0.7:1 to 1.5:1
PRESENTATION OUTLINE
I. Introduction
II Cagewash Metric AnalysesII. Cagewash Metric Analyses
III. Cagewash Layout Issues
IV. MEP System Issues
V. Conclusions
Please ask questions as you think of them

III. CAGEWASH LAYOUT ISSUES
Cagewash Rooms
Contaminated
Dirty
Clean
Sterile Sterile
Project 1 2 3 4 5 6 7 8 9 10 11 12
III. CAGEWASH LAYOUT ISSUES
Cagewash Rooms – Autoclave Location

III. CAGEWASH LAYOUT ISSUES
Cagewash Rooms – Autoclave Location
III. CAGEWASH LAYOUT ISSUES
Cagewash Rooms – Autoclave Location

III. CAGEWASH LAYOUT ISSUES
Cagewash Rooms – Autoclave Location
III. CAGEWASH LAYOUT ISSUES
Cagewash Rooms – Autoclave Location

III. CAGEWASH LAYOUT ISSUES
Cagewash Rooms – Autoclave Location
III. CAGEWASH LAYOUT ISSUES
Cagewash Chambers

III. CAGEWASH LAYOUT ISSUES
Cagewash Chambers
III. CAGEWASH LAYOUT ISSUES
Cagewash Chambers

III. CAGEWASH LAYOUT ISSUES
Cagewash Chambers
III. CAGEWASH LAYOUT ISSUES
Cagewash Chambers

III. CAGEWASH LAYOUT ISSUES
Cagewash Chambers
III. CAGEWASH LAYOUT ISSUES
Barrier Walls

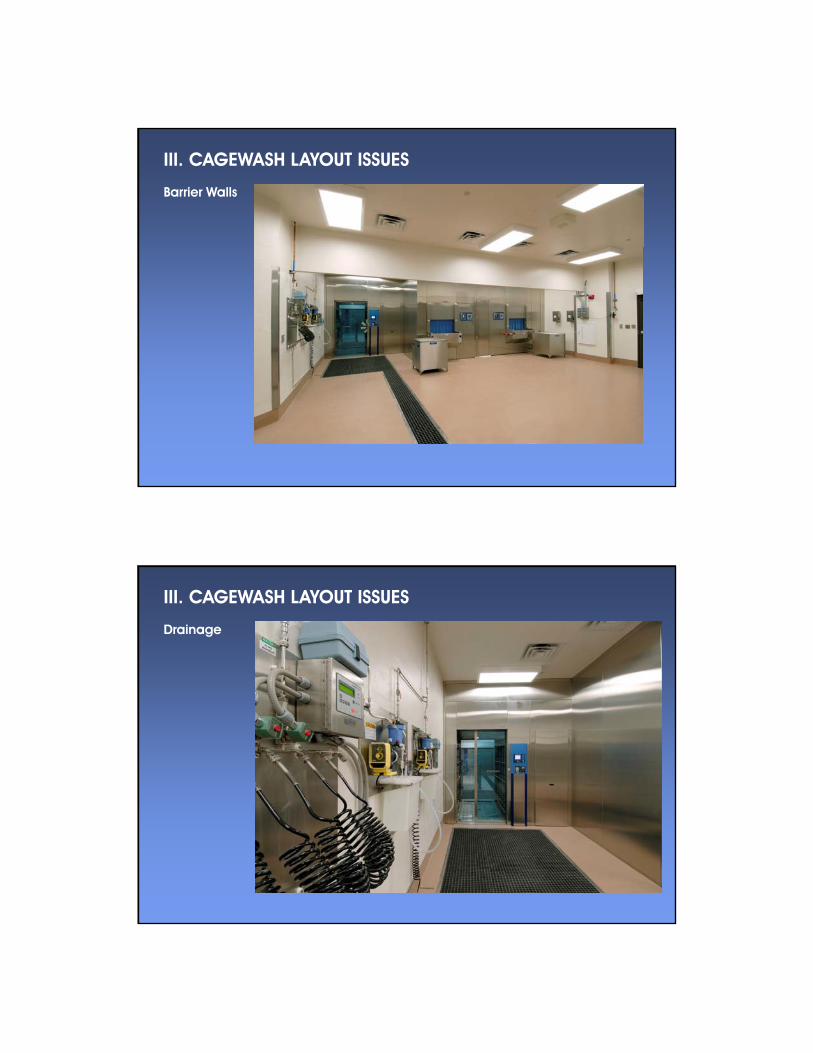
III. CAGEWASH LAYOUT ISSUES
Barrier Walls
III. CAGEWASH LAYOUT ISSUES
Barrier Walls

III. CAGEWASH LAYOUT ISSUES
Barrier Walls
III. CAGEWASH LAYOUT ISSUES
Barrier Walls
III. CAGEWASH LAYOUT ISSUES
Barrier Walls
III. CAGEWASH LAYOUT ISSUES
Drainage

III. CAGEWASH LAYOUT ISSUES
Drainage
III. CAGEWASH LAYOUT ISSUES
Drainage
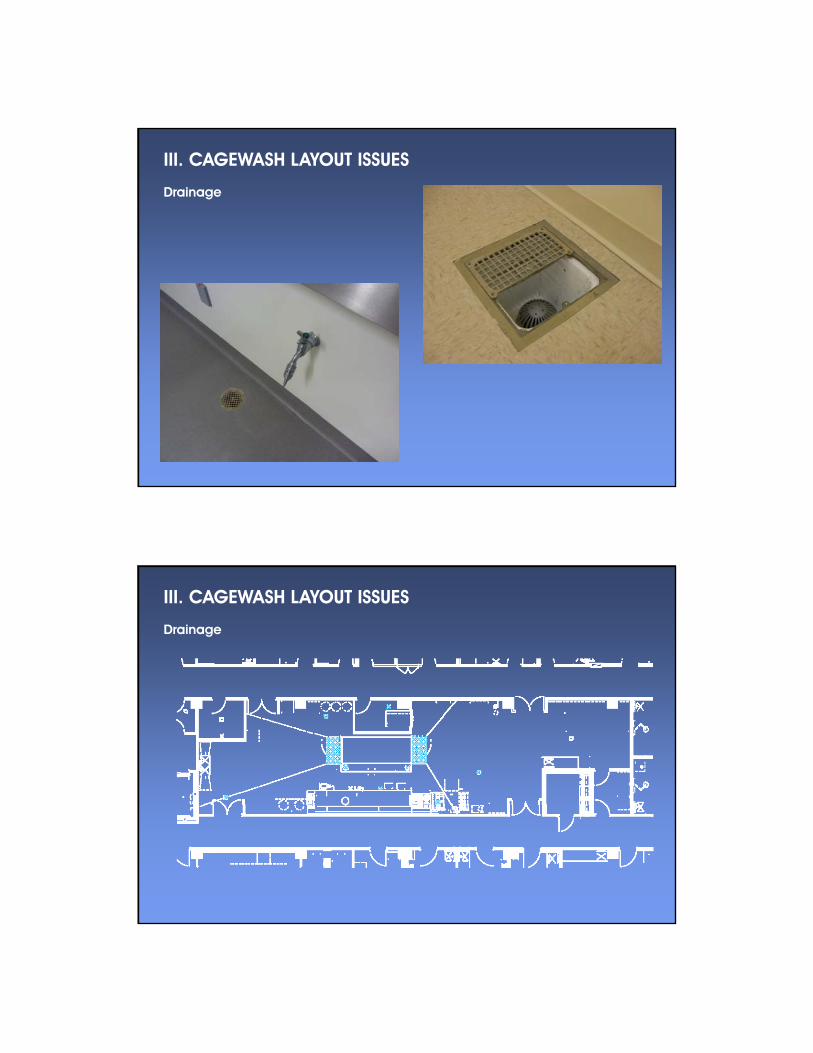
III. CAGEWASH LAYOUT ISSUES
Drainage
III. CAGEWASH LAYOUT ISSUES
Drainage

III. CAGEWASH LAYOUT ISSUES
Drainage
III. CAGEWASH LAYOUT ISSUES
Drainage

III. CAGEWASH LAYOUT ISSUES
Automation
III. CAGEWASH LAYOUT ISSUES
Automation

III. CAGEWASH LAYOUT ISSUES
Automation
Robotics
Bedding Removal
Bedding Delivery
Project 1 2 3 4 5 6 7 8 9 10 11 12Project 1 2 3 4 5 6 7 8 9 10 11 12
Garbell
III. CAGEWASH LAYOUT ISSUES
Detergent Handling

III. CAGEWASH LAYOUT ISSUES
Detergent Handling
III. CAGEWASH LAYOUT ISSUES
Detergent Handling

III. CAGEWASH LAYOUT ISSUES
Detergent Handling
III. CAGEWASH LAYOUT ISSUES
Utility Drops

III. CAGEWASH LAYOUT ISSUES
Utility Drops
III. CAGEWASH LAYOUT ISSUES
Utility Drops

III. CAGEWASH LAYOUT ISSUES
Utility Drops
PRESENTATION OUTLINE
I. Introduction
II Cagewash Metric AnalysesII. Cagewash Metric Analyses
III. Cagewash Layout Issues
IV. MEP System Issues
V. Conclusions
Please ask questions as you think of them
CAGEWASH MEP SERVICES (SUMMARY)
HVAC• General Exhaust• Equipment Exhaust• Supply Air
ELECTRICAL• 480 vac/3ɸ• 208 vac/3ɸ
120 /1ɸSupply Air
PLUMBING• Steam• Steam Condensate Return• Industrial Cold Water (non-potable)• Industrial Hot Water (non-potable)
• 120 vac/1ɸ
( p )• Compressed Air• Sanitary Drainage• Animal Water
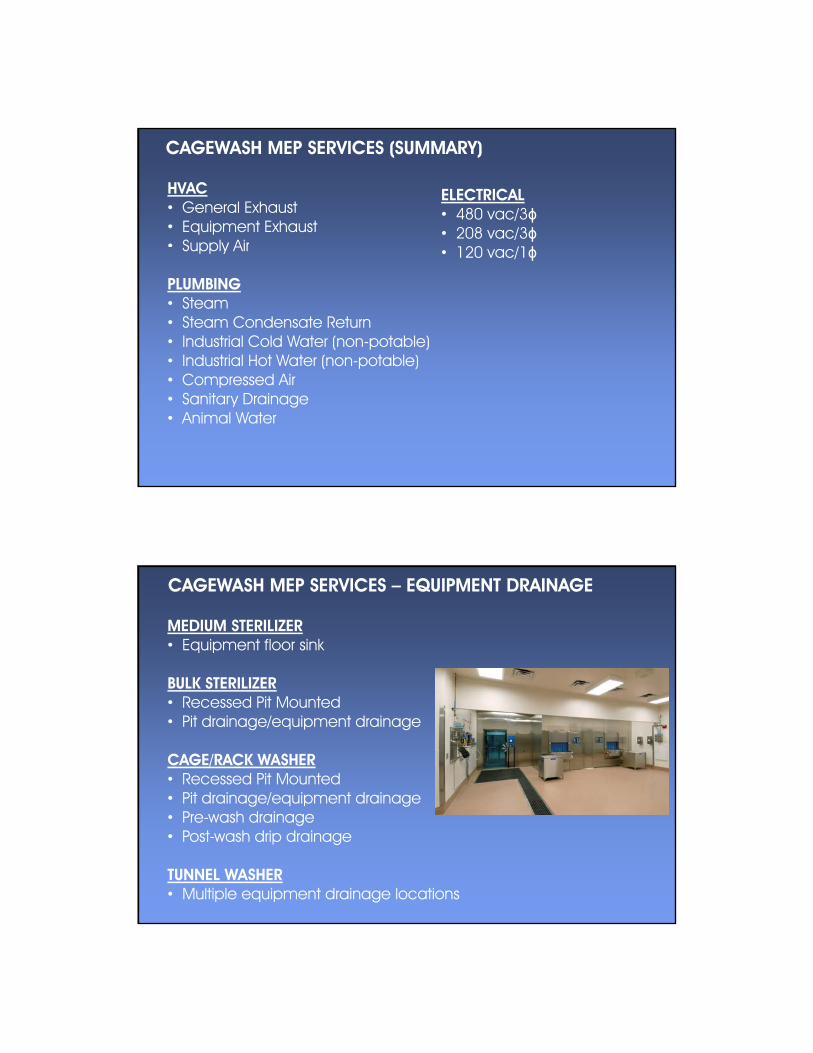
CAGEWASH MEP SERVICES – EQUIPMENT DRAINAGE
MEDIUM STERILIZER• Equipment floor sink
BULK STERILIZERBULK STERILIZER• Recessed Pit Mounted• Pit drainage/equipment drainage
CAGE/RACK WASHER• Recessed Pit Mounted• Pit drainage/equipment drainageg / q p g• Pre-wash drainage• Post-wash drip drainage
TUNNEL WASHER• Multiple equipment drainage locations

CAGEWASH MEP SERVICES – EQUIPMENT DRAINAGE
Tunnel Washer Drains
Pre-Wash Drain Grate
CAGEWASH MEP SERVICES – EQUIPMENT DRAINAGE
Post-Wash Drain Grate
Tunnel Washer Drains
Pit/Equipment Drain

CAGEWASH HEAT LOADS – EXAMPLE
CAGEWASH DIRTY• Area: 1,000 SF• Equipment Heat Load: 27,000 Btuh• 6 ACH Ventilation: 1,000 cfm
CAGEWASH HEAT LOADS – EXAMPLE
CAGEWASH EQUIPMENT•Area: 450 SF•Equipment Heat Load: 133,000 Btuh •6 ACH Ventilation: 450 cfm

CAGEWASH HEAT LOADS – EXAMPLE
CAGEWASH CLEAN• Area: 1,100 SF• Equipment Heat Load: 48,000 Btuh• 6 ACH Ventilation: 1,100 cfm
CAGEWASH HEAT LOADS (75F room temperature all areas)
ROOM AREA HEAT LOAD EQUIPEXHAUST
6 ACH AIRFLOW
DESIGNAIRFLOW
DESIGNACH
CagewashDirty
1,000 SF 27,000 Btuh 0 cfm 1,000 cfm 1,270 cfm 7.6y
Cagewash Equip
450 SF 133,000 Btuh 2,200 cfm 450 cfm 6,160 cfm 82.1
Cagewash Clean
1,100 SF 48,000 Btuh 0 cfm 1,100 cfm 2,250 cfm 12.2
Notes: Based on 10-ft ceiling height; 75F design room temperature

CAGEWASH HEAT LOADS (75F Room; 85F Equip)
ROOM AREA HEAT LOAD EQUIPEXHAUST
6 ACH AIRFLOW
DESIGNAIRFLOW
DESIGNACH
CagewashDirty
1,000 SF 27,000 Btuh 0 cfm 1,000 cfm 1,270 cfm 7.6y
Cagewash Equip
450 SF 133,000 Btuh 2,200 cfm 450 cfm 4,800cfm 64
Cagewash Clean
1,100 SF 48,000 Btuh 0 cfm 1,100 cfm 2,250 cfm 12.2
Notes: Based on 10-ft ceiling height; 75F design room temperature Dirty and Clean; 85F design temperature Equip.
CAGEWASH HEAT LOADS - CANOPIES
• Heat & vapor capture• Promotes heat removal from
equipment – reduce ACH rates and HVAC energyW k f t• Worker comfort

CAGEWASH EQUIPMENT – ENERGY SAVINGS INITIATIVES
• Water use reduction• Equipment heat load reduction – HVAC energy reduction• Energy recovery• Waste water recoveryWaste water recovery• Increased productivity (fewer cycles)• VHP decontamination
CAGEWASH EQUIPMENT – ENERGY SAVINGS INITIATIVES
• Water use reduction
• Autoclave water saving package (recirculating closed water loop)• Example:
• 227 gal/cycle standard• 68 gal/cycle with water saving package• 70% reduction• 0.232 Kw-Hr vs 0.772 Kw-Hr (230% increase)
• Autoclave vacuum pump versus water air ejector• Tradeoff between water consumption and electrical• Tradeoff between water consumption and electrical
consumption• Drain cooldown heat exchanger
• Utilize house closed water cooling system (chilled or process) to temper drain water below 140°F.
• Example:• Cage/rack washer: reduce water consumption by
696,800 gal/year (20 cycles per day)

CAGEWASH EQUIPMENT – ENERGY SAVINGS INITIATIVES
•Water use reduction (continued)
•Washer rinse recovery re-use tank•Capture and store final rinse water for next cycle pre-wash
•Washer low volume sumps•Reduce fill volume of water for cycles•Example:
•50% water reduction on equipment startup•18% water reduction during continuous operation
CAGEWASH EQUIPMENT – ENERGY SAVINGS INITIATIVES
• Water use reduction• Equipment heat load reduction – HVAC energy reduction
• Sealed doors• Reduced equipment heat loss from hot water and drying
• High efficiency insulation• Reduce heat loss to surrounding room – reduces HVAC energy

CAGEWASH EQUIPMENT – ENERGY SAVINGS INITIATIVES
• Water use reduction• Equipment heat load reduction – HVAC energy reduction• Energy recovery
• Air-to-air exhaust heat exchangers (Cage/Rack washers)• Pre-heat incoming air during drying phase• Reduce temperature and humidity of equipment
exhaust – less corrosion on exhaust system• Reduced drying time – chamber reaches
temperature more quickly• Achieve higher chamber temperature for drying
Exhaust from
chamber
Achieve higher chamber temperature for drying• Example:
• 180°F vs 150°F• Reduced steam load of 17.2 lbm/cycle
(90,000 lbm/year)• Example:
• 33% energy reduction/cycle Building Exhaust
Dryingair to
chamber
Room Air
CAGEWASH EQUIPMENT – ENERGY SAVINGS INITIATIVES
• Water use reduction• Equipment heat load reduction – HVAC energy reduction• Energy recovery• Waste water recoveryWaste water recovery
• Collect equipment waste water and route to building reclaimed water system• Reclaimed water system used for
• Irrigation• Cooling tower make-up water• Restroom flushing water

CAGEWASH EQUIPMENT – ENERGY SAVINGS INITIATIVES
• Water use reduction• Equipment heat load reduction – HVAC energy reduction• Energy recovery• Waste water recoveryWaste water recovery• Increased productivity (fewer cycles)
• Increased load capacity• Spray manifold design• Equipment width and wash rack design• Example:p
• 184 cages/cycle vs 92 cages/cycle• Improved drying effectiveness and controls
• Turbulent drying air• Relative humidity sensing to end drying cycle
CAGEWASH EQUIPMENT – ENERGY SAVINGS INITIATIVES
• Water use reduction• Equipment heat load reduction – HVAC energy reduction• Energy recovery• Waste water recoveryWaste water recovery• Increased productivity (fewer cycles)• VHP decontamination
• Cage/rack washer• Duel use:
• Cage/rack wash (traditional)g / ( )• VHP decontamination
• Space savings• Potential for reduce bulk autoclave cycles – reduced utilities
• Thermal disinfection (autoclave) vs chemical disinfection (VHP)

CAGEWASH EQUIPMENT – ITEMS TO WATCH OUT FOR
CONDENSATE RETURN EQUIPMENT• No space allocated for additional MEP equipment in Cagewash areas.• Large equipment• Locate in separate room or mezzanine above
CAGEWASH EQUIPMENT – ITEMS TO WATCH OUT FOR
EQUIPMENT DRAINAGE• Plumbing drains magically appear from above!• Some equipment drainage is located specifically for the equipment only.
Should not be used for HVAC drains.• Be detailed in design for drainage of non-Cagewash equipment and systems

PRESENTATION OUTLINE
I. Introduction
II Cagewash Metric AnalysesII. Cagewash Metric Analyses
III. Cagewash Layout Issues
IV. MEP System Issues
V. Conclusions
Please ask questions as you think of them
V. CONCLUSIONS – THE TRADELINE THREE
1. PLAN FOR ADEQUATE BUT NOT EXCESSIVE CAGEWASH SPACE
2. DISCUSS THE DETAILS!2. DISCUSS THE DETAILS!
3. LOOK FOR ENERGY SAVINGS WHEREVER POSSIBLE

Animal Research Facilities 2010Tradeline Conference Series
NEW CAGEWASH DECISIONS NEW CAGEWASH DECISIONS FOR RAISING EFFICIENCY,
LOWERING OPERATING COSTS, AND CUTTING LABOR
Concurrent Forum Session “G”
November 08 & 09 2010November 08 & 09 2010
Lloyd E.L. Fisk, AIA LEED APPaul Lemestre, PE LEED AP
Research Facilities Design