2010 undergraduate campus climate survey presentation to nc state university student affairs...
TRANSCRIPT

2010 Undergraduate Campus Climate Survey Presentation to NC State University Student Affairs
December 7, 2011
Nancy Whelchel, University Planning & Analysis
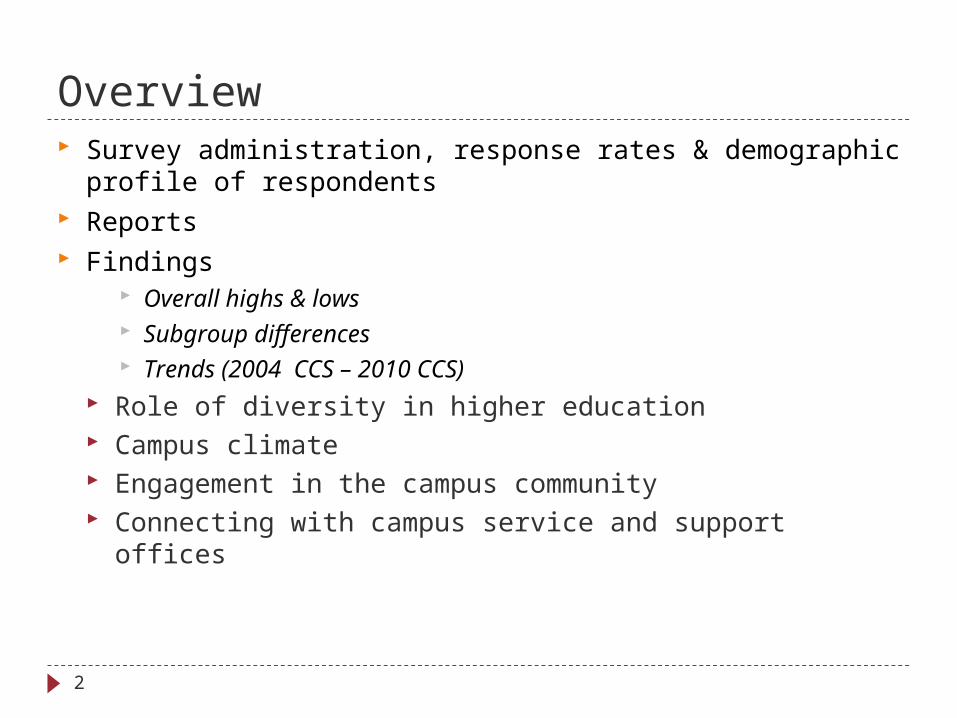
Overview Survey administration, response rates & demographic profile of
respondents Reports Findings
Overall highs & lows Subgroup differences Trends (2004 CCS – 2010 CCS)
Role of diversity in higher education Campus climate Engagement in the campus community Connecting with campus service and support offices
2

Survey Administration Population
All NC State undergraduate and graduate students Enrolled Fall semester 2010 Taking 1+ face-to-face course
Online surveys Oct. 20-Nov 17, 2010 Confidential (but not anonymous)
Questionnaires Slightly different versions for grad & undergrads @200 closed-end & 6 open-end questions
3

Response Rates
Sample Bias (Undergraduates) ++ female (54% vs 43% of population)
+ ‘non-traditional’ students (> 27 yrs of age) + freshmen + CHASS - COM
4
UndergraduatePopulation
NRespondent
NResponse
RateMOSE
2010 22,050 3,307 15.0% +/- 1.42004 18,158 3,211 17.7% +/- 1.4
GraduatePopulation
NRespondent
NResponse
RateMOSE
2010 6,795 1,388 20.4% +/- 2.12004 4,834 1,315 27.2% +/- 2.0
Demographic Profile of Undergraduate Respondents
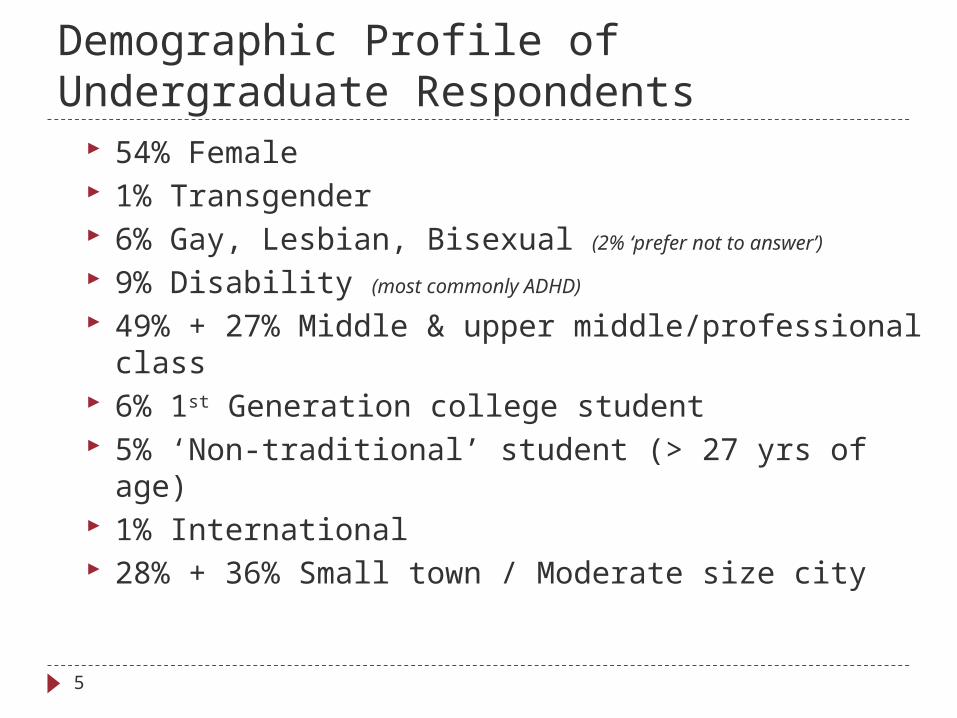
54% Female 1% Transgender 6% Gay, Lesbian, Bisexual (2% ‘prefer not to answer’)
9% Disability (most commonly ADHD)
49% + 27% Middle & upper middle/professional class 6% 1st Generation college student 5% ‘Non-traditional’ student (> 27 yrs of age) 1% International 28% + 36% Small town / Moderate size city
5

Demographic Profile of Undergraduate Respondents cont.
Summary: Straight, white, middle/upper middle class, traditional-age
student with college-educated parent(s) from small town/moderate size city
40% lived in a neighborhood AND graduated from a high school where the other residents/students were mostly, nearly all, or all their same race/ethnicity
6

Reports see http://www2.acs.ncsu.edu/UPA/survey/reports/ccs10/
Highlights (coming soon)
Executive summary (coming soon)
Introduction, Research Methods, & Response Rates
Overall results (annotated questionnaires)
Demographic profile Academic class Gender Race/ethnicity Residency (US citizen vs
non US citizen) Socioeconomic
background 1st generation college
student vs other Sexual orientation Disability status Age
7

Reports cont.
Academic College (NCSU authentication required) Overall college comparisons Demographic profile w/in college
Gender Race/ethnicity (white/student of color) SES
Open-End Comments (coming soon)
Presentations
8

Undergraduates’ Perceptions of the Role of Diversity in Higher Education
Support for diversity as a goal
Educational value of diversity
Assessing diversity efforts at NC State
Influencing diversity attitudes and behaviors
9

Diversity as NC State Mission/Value/GoalUndergraduate students generally think diversity is important as
an institutional value/goal, but also think there are tradeoffs
Most supportive Diversity is good for NCSU (83% agree) Holding diversity as an essential value is important (82%) Fostering intellectual diversity should be key goal (75%)
Least supportive Leads to admission of less qualified students (41% agree) Too much emphasis on diversity (35% agree) Leads to hiring of less qualified admin/fac/staff (33% agree)
Subgroup differences Men, whites, and straight students are much more likely than
others to be skeptical of diversity as a University value
10

Importance of NC State holding diversity as an essential value (undergraduate students)
11

Trends:Diversity as NC State Mission/Value/GoalUndergraduate students (especially GLB students and those with
a disability) are now slightly more likely to agree that “building a diverse and inclusive campus community should be a key goal of NC State.”
12

Trends:Diversity as NC State Mission/Value/GoalUndergraduate students have become more polarized on whether
or not “NC State is placing too much emphasis on achieving diversity.”
13

Educational Value of Learning about DiversityTwo-thirds or more undergraduate students agree that there are a
range of educational benefits to diversity, but they are less supportive of including it in the curriculum
Most supportive Respect for diversity will better enable me to work in chosen field
and to live in community (77% and 76%, respectively, agree)
Least supportive Diversity in curriculum detracts from important knowledge (39%
agree) Students benefit from GE diversity requirement (21% disagree)
Subgroup differences Men are much more likely than others to be skeptical of the
educational value of learning about diversity
14

Respect for diversity will better enable me to work in my chosen field (undergraduate students)
15

Trends: Educational Value of Learning about DiversityOverall there has been little change in undergraduates’
perceptions about the value of learning about diversity
Students are now more likely to ‘strongly agree’ that Learning about people from different cultures is an essential
part of a college education (26% vs 35%) Interaction w/ people different from me is an essential part of a
college education (26% vs 32%)
Students are now slightly more likely to ‘agree’ that Including diversity topics in the curriculum detracts from
learning more important knowledge (35% vs 39%)
16
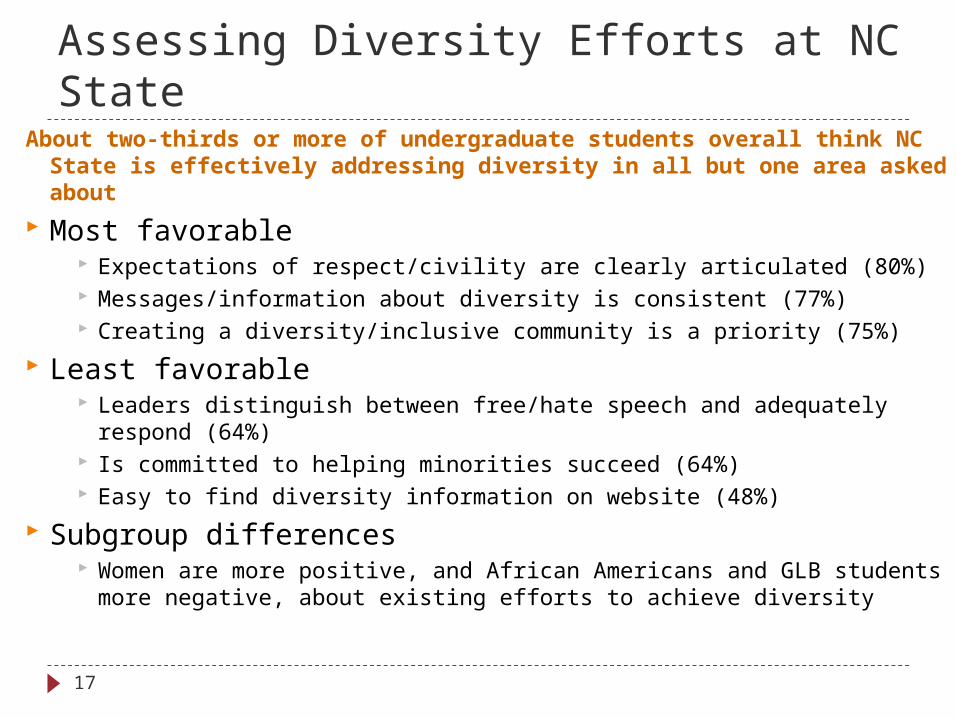
Assessing Diversity Efforts at NC StateAbout two-thirds or more of undergraduate students overall think NC State is
effectively addressing diversity in all but one area asked about
Most favorable Expectations of respect/civility are clearly articulated (80%) Messages/information about diversity is consistent (77%) Creating a diversity/inclusive community is a priority (75%)
Least favorable Leaders distinguish between free/hate speech and adequately respond
(64%) Is committed to helping minorities succeed (64%) Easy to find diversity information on website (48%)
Subgroup differences Women are more positive, and African Americans and GLB students more
negative, about existing efforts to achieve diversity
17

Trends: Assessing Diversity Efforts at NC StateRatings of diversity efforts at NC State generally grew more
positive for all undergraduate groups, but most notably for women, poor and middle class students, and non-traditional students
Students are now much more likely to ‘strongly agree’ that
NCSU provides an environment for free expression (18% vs 31%) NCSU is a good place to gain an understanding of diversity &
multicultural perspectives (9% vs 20%) Can easily find diversity information on NCSU website (6% vs 14%)
18

What experiences influence thinking about diversity?A majority of undergraduate students cite a wide range of
experiences as having a positive influence on their thinking about diversity; reports of ‘negative influence’ are very rare
Most likely to have a ‘very positive’ influence Friends/acquaintances (34%) Family/hometown (28%) Campus organizations/clubs (27%) Living in residence halls (26%) Interactions with students outside of class (25%)
Most likely to have a ‘negative’ influence Family/hometown (10%) Living in residence halls (5%)
Especially GLB (15%) and African Americans (11%)
19

What experiences influence thinking about diversity? Cont.
Most likely to have no influence (i.e., ‘neither positive nor negative’) on undergraduates
Interactions/messages from NC State administration (45%) Course materials (41%) Interactions with staff (37%) Common Reading (37% [among those reading it]) Interactions with faculty outside of class (36%) College/department activities/events (36%)
Subgroup differences Among undergraduates, males, whites, international students,
students with a disability, and non-traditional students are consistently more likely to say specific experiences have had ‘neither a positive nor a negative’ influence on their thinking about diversity
20

Trends: What experiences influence thinking about diversity? Overall, undergraduate students are now more likely to say
experiences had a ‘very positive’ influence on their thinking about diversity and less likely to say they had ‘no influence’
Campus organizations/clubs (13% vs 27% ‘very positive’) Campus events (9% vs 23%) Residence hall (14% vs 26%) Interactions w/ students in class (14% vs 24%) Interactions w/ faculty/instructors outside of class (11% vs 21%) Interactions w/ faculty/instructors in class (12% vs 21%) Interactions w/ students outside of class (16% vs 25%) Course materials (7% vs 16%) Friendships/acquaintances (26% vs 34%)
21

Undergraduates’ Perceptions of the Campus Climate
Overall satisfaction
Respect & friendships among students
Use of inappropriate statements
Supportiveness of campus environment
22

Overall Satisfaction at NC State60% or more undergraduate students overall are satisfied in 9 of the
10 areas asked about
Most positive ratings Overall experience (92% ‘excellent’/’good’) Overall academic experience (85% ‘very satisfied’/’satisfied’) Proud to be member of NC State community (82% ‘often’/’always’)
Least positive ratings Have a good support network (15% ‘seldom’/’never’) Have good role models on campus (16% ‘seldom’/’never’)
Subgroup differences International and GLB students are typically less likely to be
satisfied at NC State
23

Feel like you don’t fit in (undergraduate students)
24

Trends: Overall SatisfactionUndergraduate students, especially Asian, Hispanic and non-
traditional students, are now less likely to say they “have a good support network”
25

Respect Among StudentsUndergraduate students are divided on the extent to which
different groups are respectful of each other
One-fourth of students rate student respect for students from a racial/ethnic group different from one’s own as ‘excellent’ and one-fifth say it is ‘fair’ or ‘poor’
White and Asian students give much more favorable ratings than African Americans
One-fifth of students rate student respect for students with a sexual orientation different from one’s own as ‘excellent’ and 38% say it is either ‘fair’ or ‘poor’
Straight students give much more favorable ratings than GLB students
26

Trends:Friendships Among StudentsWhile still seen as ‘fair’ or ‘poor’ by a notable number of
undergraduate students, students overall are now more positive about the quality of friendships between different groups
27

Inappropriate Statements by Students40% or more of undergraduate students report at least ‘occasionally’
hearing other students make negative/inappropriate comments about 5 of 7 statuses asked about
Most likely about Sexual orientation (30% ‘often/very often’ [16% ‘never’]) Gender/sexual identity (23% ‘often/very often’ [20% ‘never’]) Race/ethnicity(21% ‘often/very often’ [47% ‘never’])
Least likely about Disability status (6% ‘often/very often’ [45% ‘never’]) Socio-economic status (8% ‘often/very often’ [40% ‘never’])
Subgroup differences Students from identified group are much more likely to say
students make inappropriate comments about their ‘group’
28
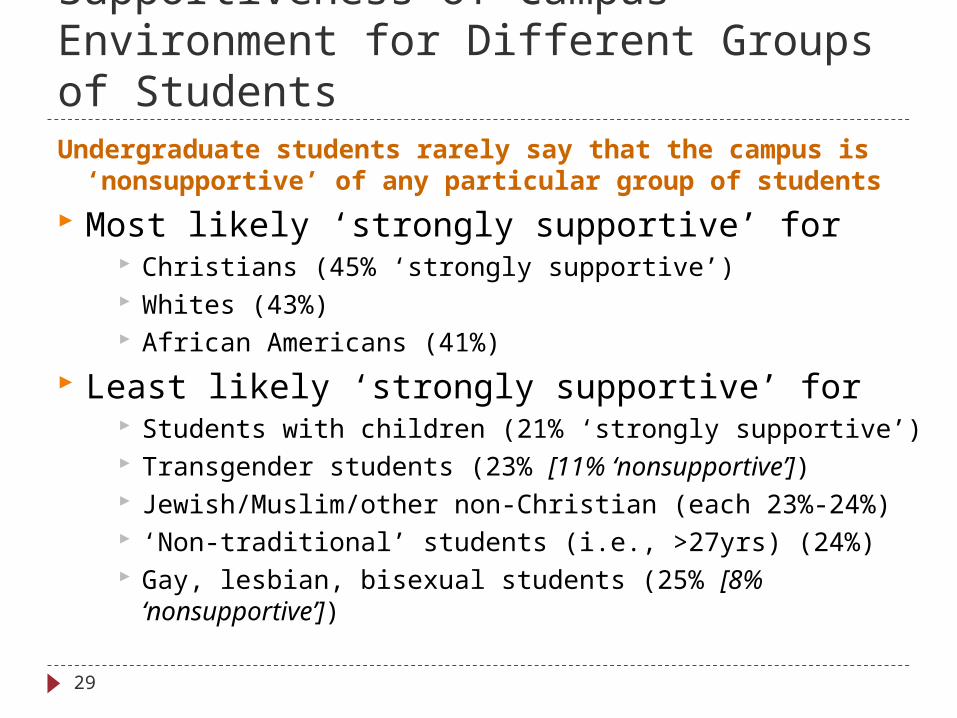
Supportiveness of Campus Environment for Different Groups of StudentsUndergraduate students rarely say that the campus is
‘nonsupportive’ of any particular group of students
Most likely ‘strongly supportive’ for Christians (45% ‘strongly supportive’) Whites (43%) African Americans (41%)
Least likely ‘strongly supportive’ for Students with children (21% ‘strongly supportive’) Transgender students (23% [11% ‘nonsupportive’]) Jewish/Muslim/other non-Christian (each 23%-24%) ‘Non-traditional’ students (i.e., >27yrs) (24%) Gay, lesbian, bisexual students (25% [8% ‘nonsupportive’])
29

Supportiveness of Campus Environment for Different Groups of Students cont.
Subgroup differences Undergraduate students from identified group are typically
much less likely to say the campus environment is supportive of their ‘group’
White undergraduate students are consistently more likely than others say the campus is ‘very supportive’ of all groups, except for whites and middle and upper class students
30

Trends: Supportiveness of Campus Environment for Different Groups of Students Perceptions that the campus environment is ‘strongly supportive’
of their ‘group’ increased for most undergraduate student groups
Increases were largest for GLB students (2% vs 20%)* Hispanics (10% vs 27%) Poor/working class students (11% vs 24%) Females (25% vs 38%) Middle class students (17% vs 29%) Whites (32% vs 43%) International students (8% vs 19%) [note: very small N]
*Difference in ratings is likely due to the inclusion of ‘transgender’ students in the 2004 survey question wording
31

Engagementin the Campus Community
Interacting with others
Participation in campus activities
32
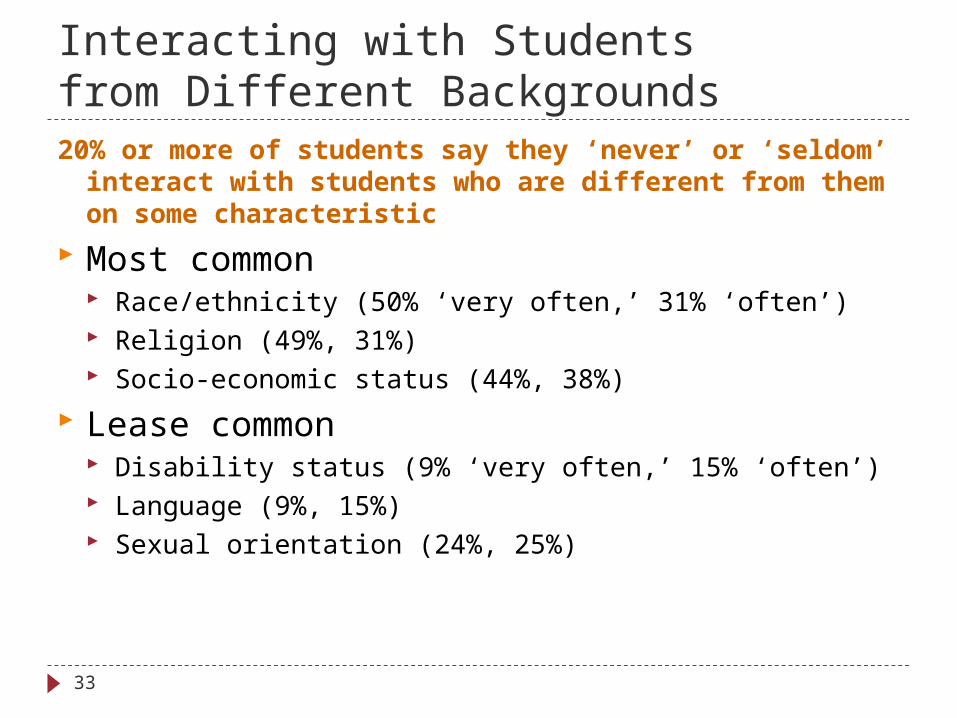
Interacting with Studentsfrom Different Backgrounds20% or more of students say they ‘never’ or ‘seldom’ interact with
students who are different from them on some characteristic
Most common Race/ethnicity (50% ‘very often,’ 31% ‘often’) Religion (49%, 31%) Socio-economic status (44%, 38%)
Lease common Disability status (9% ‘very often,’ 15% ‘often’) Language (9%, 15%) Sexual orientation (24%, 25%)
33

Interacting with Studentsfrom Different Backgrounds cont.
Subgroup differences More likely to ‘seldom’ or ‘never’ interact with those who are
different from them Whites
Racial/ethnic group Language
African American Religion
Males Sexual orientation
34

Interacting with Studentsfrom Different Backgrounds: Why Not?Students cite a number of different reasons for limited interaction
between students from different backgrounds.
Most likely Lack of opportunity (39% a ‘great deal’ or ‘some’) Prefer to interact with similar people (33%)
Less likely Uncertain what to say (25% a ‘great deal’ or ‘some’) Fear of appearing ignorant/insensitive (25%) Worry about being understood (21%) Conflicting feelings about other cultures (20%)
Subgroup differences Asians and international students were consistently more likely than
others to say each reason would at least somewhat limit their interactions with others.
35

Participation in Campus ActivitiesA sizeable number of undergraduates indicate they have never
engaged in certain aspects of campus life.
36

Participation in Campus Activities:Why Not?Undergrads rarely say they do not participate in campus activities
because they would be ‘uncomfortable’ doing so. Reasons for lack of participation vary by activity.
37

Number of Times Participated in Multicultural Activities on CampusHalf of undergraduate respondents have “never” participated in a
multicultural activity/event on campus
Subgroup differences Whites, males, straight students, and non-traditional students
are most likely to have never participated
38

Trend: Number of Times Participated in Multicultural Activities on CampusParticipation in multicultural activities on campus has increased
across all groups of students.
39
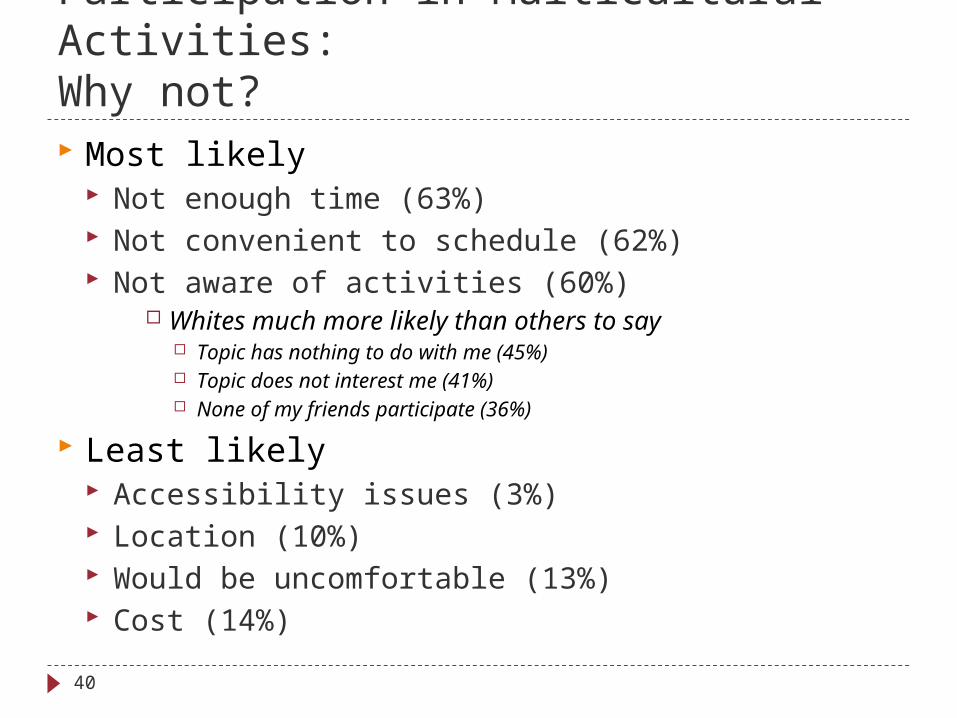
Participation in Multicultural Activities:Why not? Most likely
Not enough time (63%) Not convenient to schedule (62%) Not aware of activities (60%)
Whites much more likely than others to say Topic has nothing to do with me (45%) Topic does not interest me (41%) None of my friends participate (36%)
Least likely Accessibility issues (3%) Location (10%) Would be uncomfortable (13%) Cost (14%)
40

Connecting with Offices that Serve and Support Students
Diversity offices
Health and academic support services
41

Contacting “Diversity” OfficesAbout half or more undergraduates say they would never have a
reason to go to or contact staff from 6 of 7 “diversity” offices asked about that provide services and support to students.
42

Contacting “Diversity” Offices cont.
About half or fewer students (excluding those saying ‘would never have a reason’) say they would ‘very likely’ or ‘definitely’ contact a ‘diversity’ office.
Most likely Office of International Services (53% ‘very likely’ or definitely’) Women’s Center (52%) Multicultural Student Affairs (51%)
Least likely GLBT Center (23% ‘extremely unlikely’ or ‘not very likely’)
43
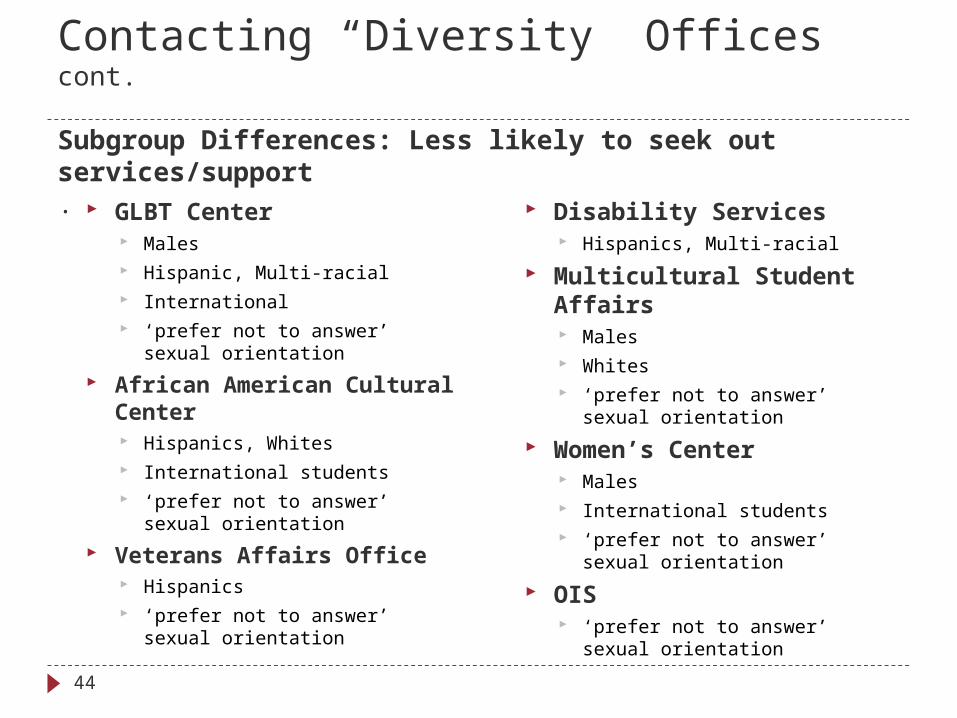
Contacting “Diversity” Offices cont.
Subgroup Differences: Less likely to seek out services/support. GLBT Center
Males Hispanic, Multi-racial International ‘prefer not to answer’ sexual
orientation
African American Cultural Center Hispanics, Whites International students ‘prefer not to answer’ sexual
orientation
Veterans Affairs Office Hispanics ‘prefer not to answer’ sexual
orientation
Disability Services Hispanics, Multi-racial
Multicultural Student Affairs Males Whites ‘prefer not to answer’ sexual
orientation
Women’s Center Males International students ‘prefer not to answer’ sexual
orientation
OIS ‘prefer not to answer’ sexual
orientation
44

Contacting “Diversity” Offices : Why Not?The most common reason offered for not contacting ‘diversity’
offices (among those saying they would not do so) was the perception that the student would never have a need to do so, with one-half of students giving such a response.
Other reasons Disliking, having no interest, or not believing in such offices (14%) Feeling uncomfortable or unwelcome (10%) Being unaware/unfamiliar with such offices (9%)
45

Contacting Health/Academic Support ServicesAlthough the large majority of undergrads say it is at least
‘somewhat likely’ that they would seek out various services if needed/recommended, 1-in-5 are unlikely to go to the Counseling Center.
46

Contacting Health/Academic Support Services cont.
Subgroup differences Undergrads who ‘prefer not to answer’ the question about their sexual
orientation are consistently less likely to say they would seek out services. Also less likely to seek our particular services are Counseling Center
Males
Tutorial Services International Students
Student Health Services GLB Students 1st Generation Students Non-traditional students
University/College Career Center Hispanics International students
47

Contacting Health/Academic Support Services: Why Not?The most common reason offered for not seeking out services
(among those saying they would not do so) was the perception that the student would never have a need for such services, with about one-third of students giving such a response.
Other reasons A preference to get such services elsewhere (16%) Beliefs about the quality of services (13%) Being unaware/unfamiliar with such services (13%) Personal reasons/preferences (e.g., ‘don’t like counseling,’ ‘am a private
person’) (13%)
48

Questions? Comments? Discussion?
49