2010-sustainable urban energy
TRANSCRIPT
7/28/2019 2010-Sustainable Urban Energy
http://slidepdf.com/reader/full/2010-sustainable-urban-energy 1/9
Sustainable urban energy: Development of a mesoscale assessment model for
solar reflective roof technologies
J.H. Jo a, J. Carlson b, J.S. Golden c,n, H. Bryan d
a School of Technology, Illinois State University, USAb School of Sustainable Engineering and the Built Environment, Arizona State University, USAc Nicholas Institute for Environmental Policy Solutions, Pratt School of Engineering, Duke University, USAd School of Architecture, Arizona State University, USA
a r t i c l e i n f o
Article history:
Received 3 February 2010
Accepted 14 September 2010
Keywords:
Cool roof systems
Remote sensing
Energy modeling
a b s t r a c t
Buildings and other engineered structures that form cities are responsible for a significant portion of the
global and local impacts of climate change. Consequently, the incorporation of building design
strategies and materials such as the use of reflective roof materials, or ‘cool’ roofs, are being widely
investigated. However, although their benefits for individual buildings have been studied, as yet there is
little understanding of the potential benefits of urban scale implementation of such systems. Here we
report the development of a new methodology for assessing the potential capacity and benefits of
installing reflective roofs in an urbanized area. The new methodology combines remote sensing image
data with a building energy computer simulation to quantify the current rooftop reflectivity and predict
the potential benefits of albedo improvement. In addition to the direct electricity savings, cool roof
systems reduce peak electrical demand in the month of August when the peak demand is at its highest
in the case study area. Environmental benefits associated with lowering greenhouse-gas emissions are
also substantial. The new methodology allows the calculation of payback periods to assist planners to
evaluate the potential economic benefits of the widespread installation of cool roof systems.
& 2010 Elsevier Ltd. All rights reserved.
1. Introduction
For the first time in history more than half of the planet’s
population lives in cities and by the year 2030 this will have
climbed to 60% (UN, 2008). The expansion of cities resulting from
population and economic growth will have a major impact on
global and local climates due to the increased energy use and
emissions associated with urban environments (Yang et al., 2005).
The buildings and other structures that form cities are responsible
for a significant portion of these impacts. The location, material
selection and spacing of buildings directly affect local climates at
the neighborhood and street level, while the emissions associated
with energy consumed in building operations contribute to global
warming (Graham, 2002). Building design strategies and materi-
als that address both the energy use and microclimate altering
effects of buildings thus have the potential to achieve a significant
reduction in a building’s overall environmental impact ( Jo et al.,
2010). Reflective roof materials, also known as ‘cool’ roofs, are
widely recommended as a design feature that can address both
the energy use and microclimate impacts of building. The
potential benefits of cool roofing product applications for at a
single building are well documented (Akbari, 2003; Jo et al.,
2010). Determining the potential application and aggregated
benefits of implementing and incentivizing certain building
technologies is a growing concern for power utilities providers
and urban planners. There is a need for improved analysis
methods that provide fast, reliable and relative inexpensive
results for cool roof application at the city scale. Here we report
the development and validation of a new methodology for
assessing the potential capacity and benefits of installing
reflective roofs in an urbanized area and provide a real-world
case study demonstrating its use.
1.1. Energy and buildings
Buildings are responsible for 72% of the electrical energy used
in the US every year (EIA, 2007). Of the many sources of electrical
energy demand within buildings, the electricity used for cooling
and lighting is among the largest. Although an average building in
the US consumes 14% of its energy in cooling ( EIA, 2007), the
energy demand for cooling is inevitably higher in warmer
climates such as that in Phoenix, Arizona (Michael, 2008).
The cooling load within a building is influenced by its total
heat gain, a large portion of which comes from solar heat gain
Contents lists available at ScienceDirect
journal homepage: www.elsevier.com/locate/enpol
Energy Policy
0301-4215/$- see front matter & 2010 Elsevier Ltd. All rights reserved.
doi:10.1016/j.enpol.2010.09.016
n Corresponding author. Tel.: +1 919 613 3646; fax: +1 919 613 8712.
E-mail address: [email protected] (J.S. Golden).
Please cite this article as: Jo, J.H., et al., Sustainable urban energy: Development of a mesoscale assessment model for solar reflectiveroof technologies. Energy Policy (2010), doi:10.1016/j.enpol.2010.09.016
Energy Policy ] (]]]]) ]]]–]]]
7/28/2019 2010-Sustainable Urban Energy
http://slidepdf.com/reader/full/2010-sustainable-urban-energy 2/9
through building surfaces. Especially in hot climates, the solar
heat gain through walls, floors and ceilings is significant. Some
commonly used asphalt-based roofing materials readily absorb
solar radiation and reflect only a small portion of the incident
energy. During clear sky conditions up to about 1 kW/m2 of solar
radiation can be incident on a roof surface, and between 20% and
95% of this radiation is typically absorbed (Suehrcke et al., 2008).
Dark roofs can reach temperatures of over 140 1F (60 1C) on sunny
summer days in many urban regions of the US, resulting insignificant heat conduction into the building through the roof
surface ( Jo et al., 2010).
Reducing the heat gain through roofs not only has a significant
effect on energy costs for the building owners but also leads to
decreased production needs by power utilities if implemented
throughout a service area. The roof heat gain can be reduced in
the following ways: (1) increase the insulation between the
exterior and interior of the building, (2) shade the roof surface
from direct sun exposure, and (3) use reflective roofing materials,
also known as ‘cool roof systems’, that reflect ambient solar
radiation more efficiently than conventional roofing materials
(Golden et al., 2007).
Most US cities have significant opportunities to utilize cool
roof systems and thus gain substantial benefits from the resulting
reduction in energy demands and the mitigation of the UHI effect,
since in urban regions roofs account for 20–25% of all urban land
cover (Rose et al., 2003). This strategy is supported by many state
and federal government organizations. For example, President
Obama used the example of ‘reflective and vegetated roofs’ as one
cost-effective strategy that could be implemented to reduce
energy use in federal buildings in a recent Executive Order 13514
(Federal Register, 2009). Many states actively support cool roof
programs by offering voluntary incentives and/or by imposing
mandatory requirements, such as the programs in Georgia and
California (US EPA, 2009). Many city governments have also
required the use of cool roof system as part of their building and
planning regulations. For example, Chicago amended its energy
code requirements for low-sloped roofs to include cool roof
systems in 2003 (US EPA, 2009).
1.2. Research objective
Although a series of research studies have examined the
benefits of cool roof systems for individual buildings, few have
examined the potential benefits on an urban scale. Simpson and
McPherson (1997) reported air conditioning energy savings in the
range of 5–28% in several 1/4-scale models in Tucson, AZ, while Jo
et al. (2010) quantified the financial and environmental benefits
of a cool roof application at a large commercial facility with
experimental results for real-world cool roof applications. Jo et al.
reported that cool roof applications can reduce electricity demand
by up to 5% with a payback period in 8–9 years, and went on toevaluate the potential reduction of GHG emissions and financial
benefits from environmental cost avoided.
A few studies have attempted to evaluate the urban scale
benefits of sustainable technologies applicable on urban surfaces.
Konopacki et al. (1997) developed a model to simulate the effects
of cool roof system applications to compute potential energy
savings in 11 metropolitan areas across the US, predicting savings
of $37 million (M) for Phoenix and $35 M in Los Angeles. Rose
et al. (2003) stressed the need to apply urban fabric data to
evaluate the benefits of albedo improvement in urban areas. They
visually inspected aerial orthophotos and grouped the types of
surface materials, and then extrapolated the collected sampling
data to quantify potential city wide implementation benefits.
Sailor and Dietsch (2007) developed a web-based screening tool,
the mitigation impact screening tool (MIST), to assess the
potential of urban heat island mitigation strategies such as albedo
and vegetation modification. The results presented by MIST
include a high degree of uncertainty and are intended only as a
first-order estimate that urban planners can use to assess the
viability of heat island mitigation strategies for their city (Sailor
and Dietsch, 2007). Akbari et al. (2009) estimated that increasing
the world-wide albedos of urban roofs and paved surfaces will
induce a negative radiative forcing on the earth equivalent tooffsetting about 44 Gt of CO2 emissions on a global basis. This
estimated CO2 offsets from albedo modifications are dependent
on assumptions used in their study, but nevertheless demonstrate
remarkable global cooling potentials that may be obtained from
cooler roofs and pavements. Lemp and Weidner (2005) presented
a method for roof surface classification using hyperspectral and
laser scanning data, analyzing slope, exposition, size and surface
material of urban roof surfaces to examine the ecological impacts
of rain run-offs’ first flush. None of these studies, however, has
developed a method that adequately quantifies the effect of the
actual surface reflectivity of rooftop surfaces or that evaluates
both the direct and indirect benefits that could be gained due to
reflectivity improvement.
Our preliminary analysis found that these prior works can be
improved to give more accurate results. Konopacki et al. (1997)
attempted to quantify the energy savings from cool roof
applications based on simulation results for the number of kWh
per 1000 ft2 (92.9 m2), which were then multiplied by the total
building rooftop area to calculate the total electricity consump-
tion of the entire building stock. However, the use of standardized
energy consumption per square area is incorrect because it
assumes the energy per square area to be uniform, which is rarely
the case. This assumption increases the uncertainty of the
aggregated results because it fails to recognize that the energy
consumption of buildings varies depending on the building use
and size.
The objective of this research is therefore to develop and
validate a new methodology to assess city scale cool roof
application feasibility and potential energy saving benefits using
remote sensing, geographical information systems (GIS) and
building energy simulation modeling tools. This study developed
a method to address uncertainties in the energy savings
achievable, specifically the quantification of current building
rooftop reflectivity as well as reflectivity improvement potential,
in order to gain a more reliable estimate of the potential energy
savings from urban scale cool roof applications.
2. Experimental site description
The site selected for this case study was a four-square-mile
block (10.36 km2) located in Chandler, Arizona (latitude 3311802400
and longitude 11115003000), part of the Phoenix Metropolitan Area(PMA). Electricity is provided by a single utility company and the
electricity consumption data were collected for the three year
period from 2006 to 2008. The total electricity consumption
figures were 183, 198, and 182 GWh for 2006, 2007, and 2008,
respectively.
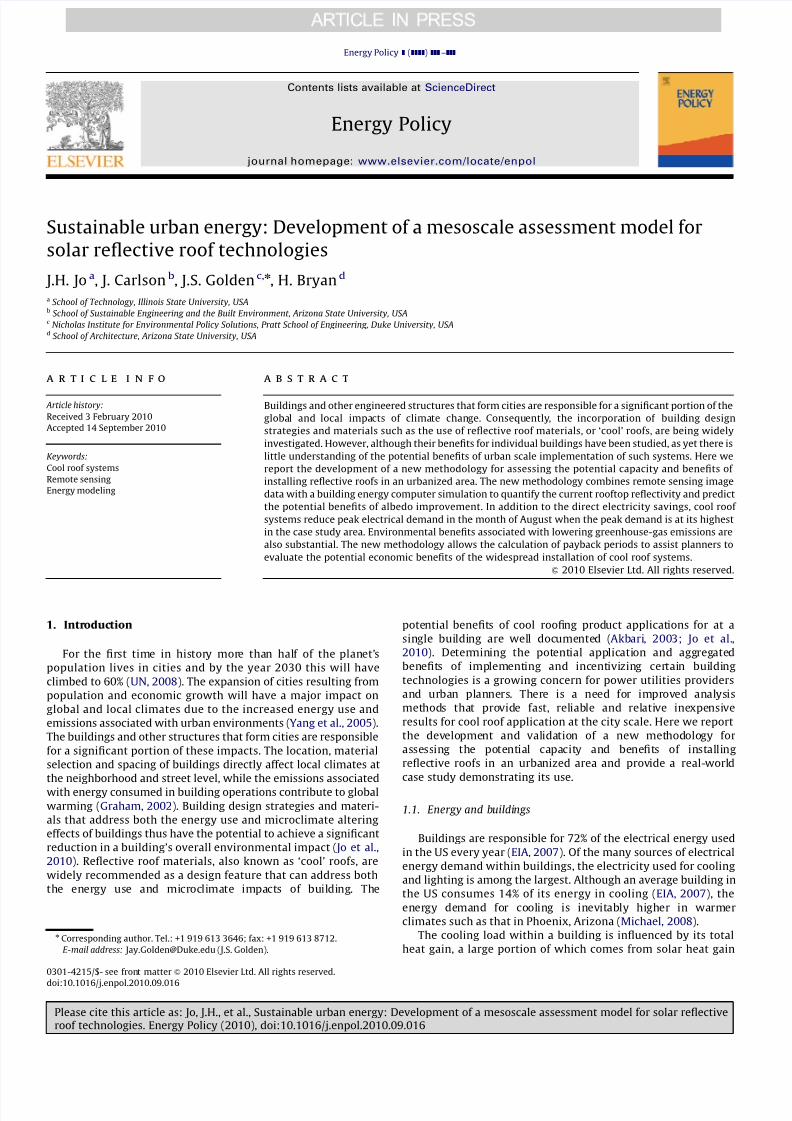
Government and commercial buildings in the boundary area
were targeted for the study (Fig. 1). Although these 932
governmental and commercial buildings make up 33% of the
total 2800 buildings within the study boundaries, they comprise
68% of the rooftop surface area and 4% of the land cover.
The Phoenix Metropolitan Area (PMA)’s climate is character-
ized by high average temperatures and low humidity throughout
the year (ASMET, 2008). During the summer, the mean daily
maximum temperature ranges from 951F (35
1C) in May to
J.H. Jo et al. / Energy Policy ] (]]]]) ]]]–]]]2
Please cite this article as: Jo, J.H., et al., Sustainable urban energy: Development of a mesoscale assessment model for solar reflectiveroof technologies. Energy Policy (2010), doi:10.1016/j.enpol.2010.09.016
7/28/2019 2010-Sustainable Urban Energy
http://slidepdf.com/reader/full/2010-sustainable-urban-energy 3/9
105.8 1F (41 1C) in August; the mean daily maximum relative
humidity over the same period ranges from 59% to 75%. During
the winter, the mean daily minimum temperature ranges from
62.2 1F (17 1C) in January, to 64.4 1F (18 1C) in December; the
mean daily maximum relative humidity over the same period
ranges from 66% to 69%. The daily solar irradiation in the region is
very high, ranging from a minimum of 9.0 MJmÀ2 (day)À1 in
January to a maximum of 30.9 MJ mÀ2 (day)À1 in June. The
average annual wind speed is quite low, at around 0.68 msÀ1.
The majority of the precipitation occurs in the winter and late
summer: 1.1 in (28.7 mm) in January, 0.11 in (2.9 mm), in April,
and 1.35 in (34.2 mm), in July.
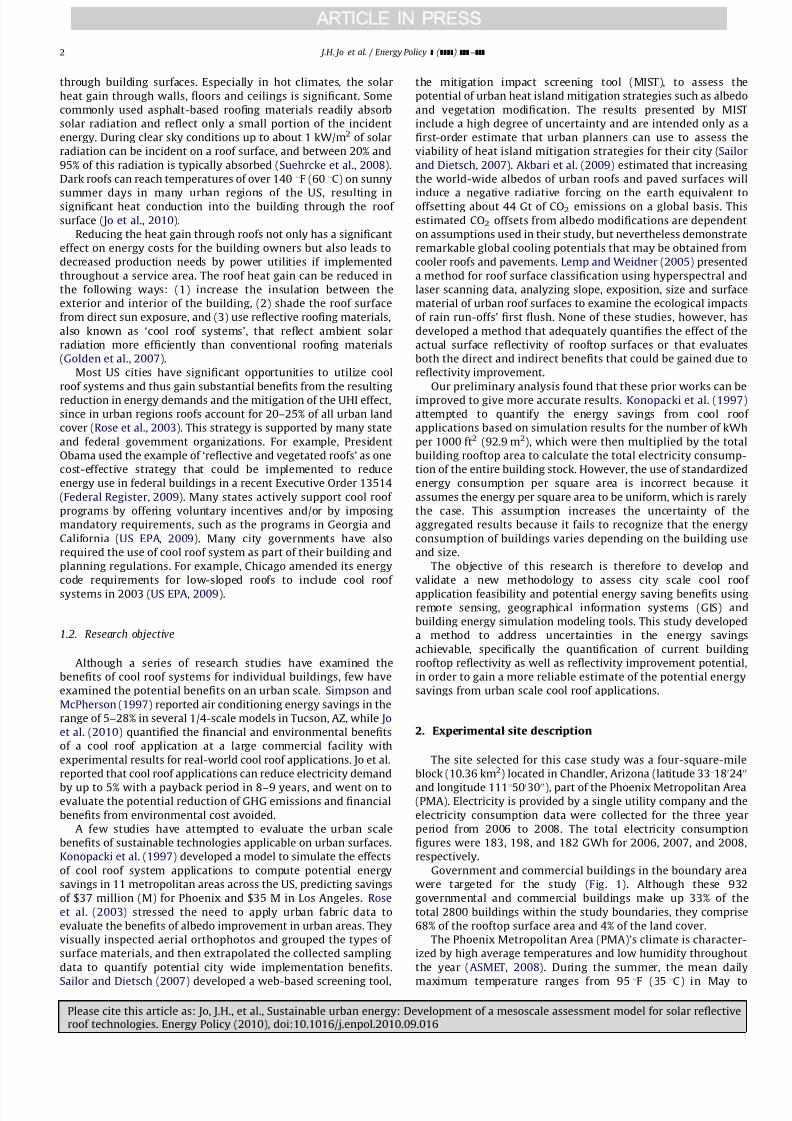
3. Methodology
A hierarchical methodology was devised to estimate the
potential benefits of urban scale cool roof applications. The
research method incorporated both remotely sensed image data
and geographical information system (GIS) analyses to measure
building rooftop reflectivity and integrate this information into a
building energy simulation. The US Department of Energy’s
building energy simulation software program, EnergyPlusTM,
was used to evaluate benefits from energy savings when cool
roof technology is applied on those rooftops where reflectivity can
be improved. Fig. 2 presents a flow diagram of the methodological
approach used to model the urban scale application benefits of
cool roof technology.
3.1. Albedo measurement through remote sensing data analysis
Surface reflectivity, commonly referred to as albedo, can be
measured either directly in the field with a pyranometer or
indirectly with remotely sensed image data appropriately pro-
cessed for reflectivity analysis. The solar reflectivity of surface
material can be measured using a pyranometer according to
ASTM E1918-06 Standard Test Method for Measuring Solar
Reflectance of Horizontal and Low-Sloped Surfaces in the Field
(ASTM, 2006). Jo et al. (2010) measured the solar reflectivity of
roof surfaces that were both dark and cool with a pyranometer,
Hukseflux NR01 4 component net-radiation sensor. This type of
device has a published error of 72.5% in the solar wavelength
range. Other sources of uncertainty in albedo measurement
include the time of day, the time of year and sky conditions. By
following the ASTM method, these sources of uncertainty can beminimized ( Jo et al., 2010).
Solar reflectance for large areas is often estimated using
remotely sensed orthophotos captured from satellites. Remotely
sensed image data sets from the Advanced Spaceborne Thermal
Emission and Reflection Radiometer (ASTER) and the Moderate
Resolution Imaging Spectroradiometer (MODIS) can be processed
to estimate albedo (USGS, 2009). Albedo is defined as the ratio of
the amount of electromagnetic radiation reflected by an object to
the amount of radiation incident upon it (USGS, 2009). Its value is
between 0 and 1, where 0 indicates NO reflectivity and higher
values of albedo represent a higher fraction of reflected solar
energy.
An object that has a low albedo is likely to have higher heat
absorption capacities and retain higher temperatures. Using
Fig. 1. Commercial and government buildings in the case study area.
Albedo calculation on
the rooftops
(Definiens Developer)
Quickbird
image with
spectral
information
(RGB+NIR)
GIS data
Building
shpefile
Building rooftops
indentified within GIS
building shapefile
Energy and environmental
benefits in the region
Building energy
modeled with albedo
improvement potential(EnergyPlus)
Building Information:
use, size, and year built
Fig. 2. Methodology applied to estimate the urban area benefits of cool roof
systems.
J.H. Jo et al. / Energy Policy ] (]]]]) ]]]–]]] 3
Please cite this article as: Jo, J.H., et al., Sustainable urban energy: Development of a mesoscale assessment model for solar reflectiveroof technologies. Energy Policy (2010), doi:10.1016/j.enpol.2010.09.016
7/28/2019 2010-Sustainable Urban Energy
http://slidepdf.com/reader/full/2010-sustainable-urban-energy 4/9
brightly colored material or coating the surface with a white
finish, will decrease its surface temperature significantly. When
white paint is applied to a rooftop, this will help to reduce the
cooling demand of the entire building structure ( Jo et al., 2010).
Surface emissivity is another factor which can affect the ability of
a material to hold or release heat. For example, a material with
low emittance ($0.1) traps the heat in, while a material with high
emittance ($0.9) allows the heat to escape.
The albedo measurements given in prior works such as Goldenet al.’s (2007) studies in the Phoenix Metropolitan Area in Arizona
and Jo et al.’s (2010) study of the Seoul Metropolitan Area in South
Korea, both of which were derived from data captured by ASTER,
provide useful insights into the relationship between the albedo
and the surface temperature, as well as the resulting impact
on the UHI effect. The resolution of the data images from ASTER
(15 m for visible bands to near infra red), however, cannot
accurately capture albedo on rooftops where the rooftop area
is smaller than the resolution of the data image. Even where
it is possible to capture the surface reflectivity on relatively
large rooftops, currently ASTER data must be processed manually.
When dealing with a large number of buildings, it is processed
through visual inspection of each individual building, requiring
a great deal of human intervention and imposing practical
limits on the number of building rooftops that can be included
in a study.
Consequently, none of these prior methods can be utilized to
rapidly quantify urban scale building rooftop surface albedo,
especially when dealing with the large number of buildings in
urban areas. To measure the albedos of the 932 commercial and
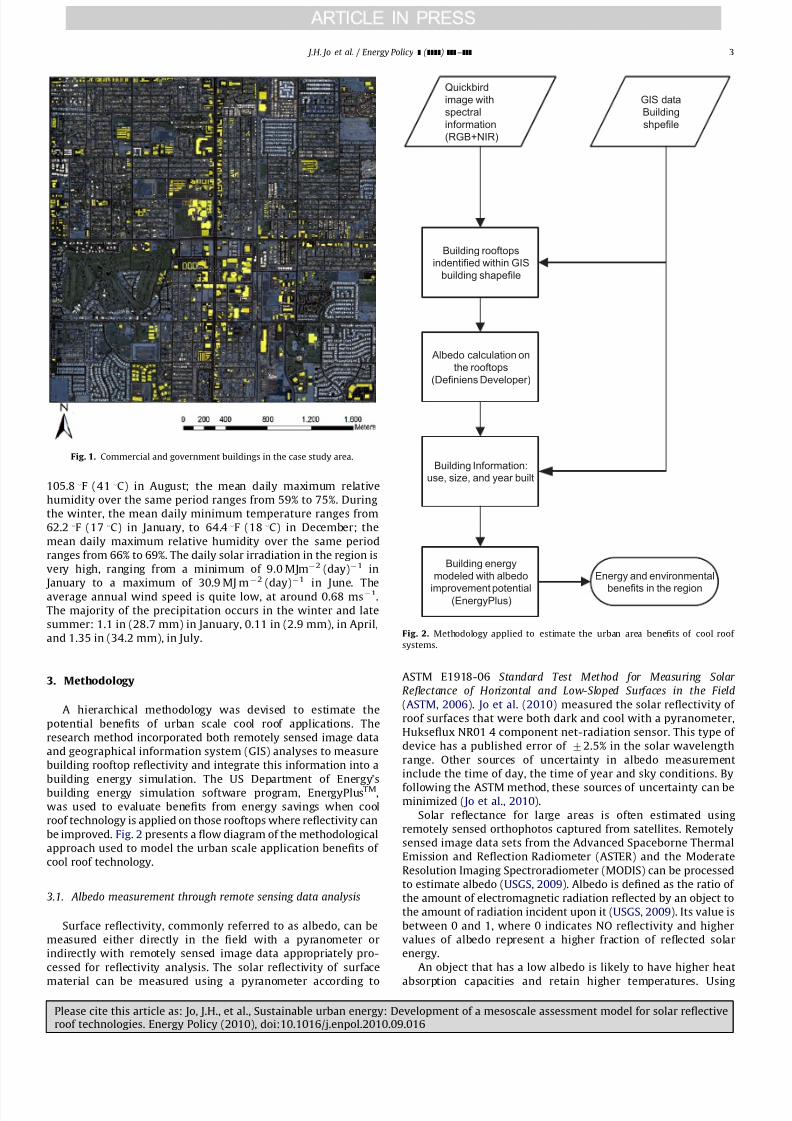
governmental buildings in the case study area, the GIS building
shapefile of the city was integrated into high resolution
QuickbirdTM imagery in the Definiens DeveloperTM software
package to quantify reflectivity inside the building shapefile,
which is confined to the building rooftop areas as shown in Fig. 3.
Quickbird remote sensing data images were processed by
Definiens Developer software to identify reflectivity on the
rooftops and the results were exported into ArcGIS (geographical
information system) to recognize building rooftop availability for
cool roof system applications based on the current reflectivity of
the exiting rooftops. Incorporating remote sensing data derived
from satellite platforms with software such as Definiens Devel-
oper that can analyze an image not by single pixels but through
image objects and their mutual relations and attributes, makes it
possible to derive a higher quality urban land cover classification
compared to single-pixel approaches (Digital Globe, 2010).
The remotely sensed data used was obtained by the Quickbird
satellite on September 28, 2008. Imagery is recorded in four
spectral bands: blue (0.45–0.52 mm), green (0.52–0.60 mm), red
(0.63–0.69 mm), and near-infrared (0.76–0.90mm) by a multi-
spectral scanner with a spatial resolution of 2.4 m per pixel. In
addition, a panchromatic image was recorded within the wave-
length range of 0.44–0.90 mm with a spatial resolution of 0.6 m/pixel (Digital Globe, 2010). These four pixel values (red, green, blue,
and near infrared) represent about 50% of the solar energy over the
entire wavelength of the solar spectrum that reaches the Earth’s
surface according to ASTM G173standard (ASTM, 2008).
The spectral data from the Quickbird images, including RGB
(450–690 nm) and NIR (760–900 nm), were quantified and con-
verted to a number in the range from 0 to 1 that represented the
reflectivity of that surface. It was possible to quantify an individual
building’s rooftop reflectivity using the proposed method, as the
image data was confined within the building shapefile areas, which
excluded the rest of the surface area.
The rooftop albedo measured by the proposed method was
compared to the rooftop albedo processed with ASTER data. The
ASTER data was acquired from National Aeronautics and Space
Administration (NASA) and they report the accuracy of the surface
reflectivity data to be 70.5–5.0% (ASTER, 2010). One hundred and
fifty buildings with rooftops larger than 6500 ft2 (604 m2) were
selected to validate the ranges of reflectivity measurement
generated by the proposed method. Albedo estimates for these
150 buildings calculated using this new approach were compared
to the albedo results for the same rooftops using processed ASTER
image data, which is generally accepted as a proven method for
indirect surface reflectivity measurement. Fig. 4 shows that the
correlation of the proposed method is in an acceptable range, with
a regression data analysis (R2 value of 0.9746) for the albedo
measurements. This indicates that the proposed method based on
Quickbird and GIS data analysis will produce similar albedo
results to those obtained using the conventional ASTER approach,
but with a much higher resolution. The higher resolution made
possible by applying the GIS building shapefiles allows averaging
of only the area within building rooftops. By incorporating GIS
data in Definiens DeveloperTM, the captured rooftop surface
reflectivities can be exported to ArcGISTM for further analysis of
energy and financial benefits.
Fig. 3. Integrating GIS building shapefiles into a Quickbird image.
R2
= 0.9746
0.00
0.10
0.20
0.30
0.40
0.50
0.60
0.70
0.80
0.00 0.10 0.20 0.30 0.40 0.50 0.60 0.70 0.80
QuickBird Albedo
A S T E R A l b e d o
Fig. 4. Comparison of albedo measurements from Quickbird and ASTER data.
J.H. Jo et al. / Energy Policy ] (]]]]) ]]]–]]]4
Please cite this article as: Jo, J.H., et al., Sustainable urban energy: Development of a mesoscale assessment model for solar reflectiveroof technologies. Energy Policy (2010), doi:10.1016/j.enpol.2010.09.016
7/28/2019 2010-Sustainable Urban Energy
http://slidepdf.com/reader/full/2010-sustainable-urban-energy 5/9
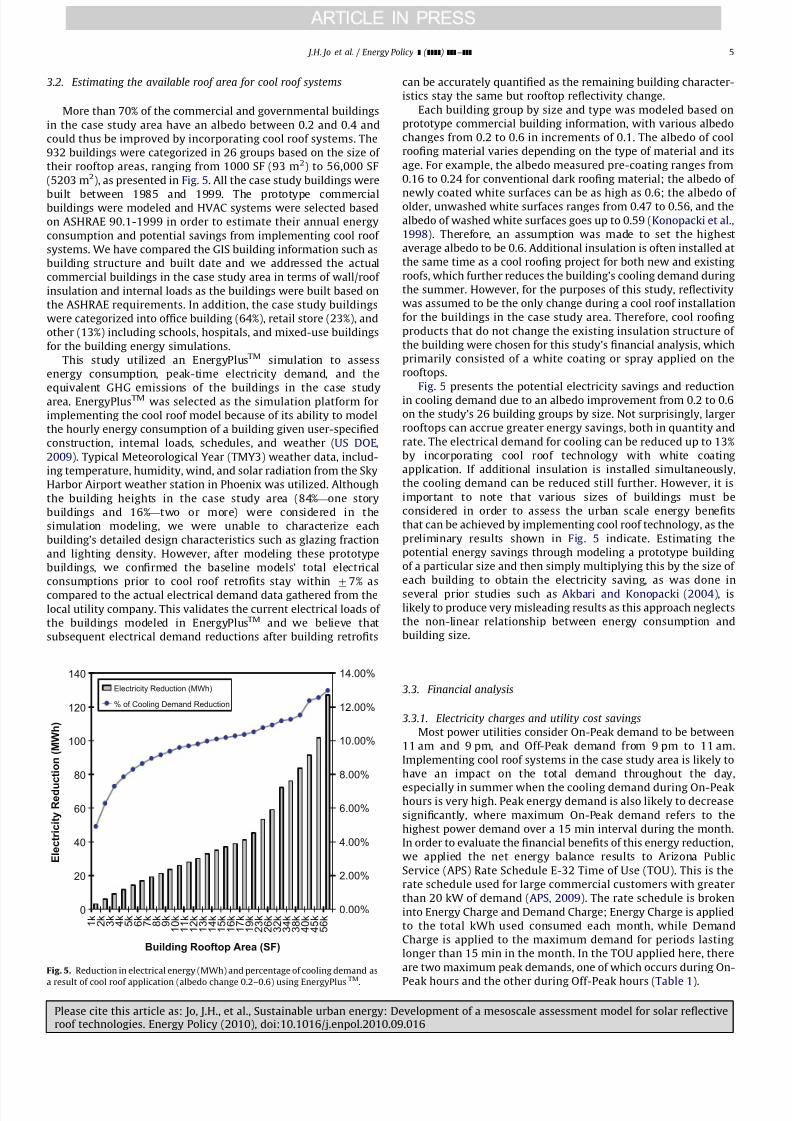
3.2. Estimating the available roof area for cool roof systems
More than 70% of the commercial and governmental buildings
in the case study area have an albedo between 0.2 and 0.4 and
could thus be improved by incorporating cool roof systems. The
932 buildings were categorized in 26 groups based on the size of
their rooftop areas, ranging from 1000 SF (93 m2) to 56,000 SF
(5203 m2), as presented in Fig. 5. All the case study buildings were
built between 1985 and 1999. The prototype commercialbuildings were modeled and HVAC systems were selected based
on ASHRAE 90.1-1999 in order to estimate their annual energy
consumption and potential savings from implementing cool roof
systems. We have compared the GIS building information such as
building structure and built date and we addressed the actual
commercial buildings in the case study area in terms of wall/roof
insulation and internal loads as the buildings were built based on
the ASHRAE requirements. In addition, the case study buildings
were categorized into office building (64%), retail store (23%), and
other (13%) including schools, hospitals, and mixed-use buildings
for the building energy simulations.
This study utilized an EnergyPlusTM simulation to assess
energy consumption, peak-time electricity demand, and the
equivalent GHG emissions of the buildings in the case studyarea. EnergyPlusTM was selected as the simulation platform for
implementing the cool roof model because of its ability to model
the hourly energy consumption of a building given user-specified
construction, internal loads, schedules, and weather (US DOE,
2009). Typical Meteorological Year (TMY3) weather data, includ-
ing temperature, humidity, wind, and solar radiation from the Sky
Harbor Airport weather station in Phoenix was utilized. Although
the building heights in the case study area (84%—one story
buildings and 16%—two or more) were considered in the
simulation modeling, we were unable to characterize each
building’s detailed design characteristics such as glazing fraction
and lighting density. However, after modeling these prototype
buildings, we confirmed the baseline models’ total electrical
consumptions prior to cool roof retrofits stay within 77% as
compared to the actual electrical demand data gathered from the
local utility company. This validates the current electrical loads of
the buildings modeled in EnergyPlusTM and we believe that
subsequent electrical demand reductions after building retrofits
can be accurately quantified as the remaining building character-
istics stay the same but rooftop reflectivity change.
Each building group by size and type was modeled based on
prototype commercial building information, with various albedo
changes from 0.2 to 0.6 in increments of 0.1. The albedo of cool
roofing material varies depending on the type of material and its
age. For example, the albedo measured pre-coating ranges from
0.16 to 0.24 for conventional dark roofing material; the albedo of
newly coated white surfaces can be as high as 0.6; the albedo of older, unwashed white surfaces ranges from 0.47 to 0.56, and the
albedo of washed white surfaces goes up to 0.59 ( Konopacki et al.,
1998). Therefore, an assumption was made to set the highest
average albedo to be 0.6. Additional insulation is often installed at
the same time as a cool roofing project for both new and existing
roofs, which further reduces the building’s cooling demand during
the summer. However, for the purposes of this study, reflectivity
was assumed to be the only change during a cool roof installation
for the buildings in the case study area. Therefore, cool roofing
products that do not change the existing insulation structure of
the building were chosen for this study’s financial analysis, which
primarily consisted of a white coating or spray applied on the
rooftops.
Fig. 5 presents the potential electricity savings and reduction
in cooling demand due to an albedo improvement from 0.2 to 0.6
on the study’s 26 building groups by size. Not surprisingly, larger
rooftops can accrue greater energy savings, both in quantity and
rate. The electrical demand for cooling can be reduced up to 13%
by incorporating cool roof technology with white coating
application. If additional insulation is installed simultaneously,
the cooling demand can be reduced still further. However, it is
important to note that various sizes of buildings must be
considered in order to assess the urban scale energy benefits
that can be achieved by implementing cool roof technology, as the
preliminary results shown in Fig. 5 indicate. Estimating the
potential energy savings through modeling a prototype building
of a particular size and then simply multiplying this by the size of
each building to obtain the electricity saving, as was done in
several prior studies such as Akbari and Konopacki (2004), is
likely to produce very misleading results as this approach neglects
the non-linear relationship between energy consumption and
building size.
3.3. Financial analysis
3.3.1. Electricity charges and utility cost savings
Most power utilities consider On-Peak demand to be between
11 am and 9 pm, and Off-Peak demand from 9 pm to 11 am.
Implementing cool roof systems in the case study area is likely to
have an impact on the total demand throughout the day,
especially in summer when the cooling demand during On-Peakhours is very high. Peak energy demand is also likely to decrease
significantly, where maximum On-Peak demand refers to the
highest power demand over a 15 min interval during the month.
In order to evaluate the financial benefits of this energy reduction,
we applied the net energy balance results to Arizona Public
Service (APS) Rate Schedule E-32 Time of Use (TOU). This is the
rate schedule used for large commercial customers with greater
than 20 kW of demand (APS, 2009). The rate schedule is broken
into Energy Charge and Demand Charge; Energy Charge is applied
to the total kWh used consumed each month, while Demand
Charge is applied to the maximum demand for periods lasting
longer than 15 min in the month. In the TOU applied here, there
are two maximum peak demands, one of which occurs during On-
Peak hours and the other during Off-Peak hours (Table 1).
0
20
40
60
80
100
120
140
1 k
2 k
3 k
4 k
5 k
6 k
7 k
8 k
9 k
1 0 k
1 1 k
1 2 k
1 3 k
1 4 k
1 5
k
1 6 k
1 7
k
1 9 k
2 3 k
2 6 k
3 2 k
3 4 k
3 8 k
4 0 k
4 5
k
5 6 k
Building Rooftop Area (SF)
E l e c t r i c i t y R e d u
c t i o n ( M W h )
0.00%
2.00%
4.00%
6.00%
8.00%
10.00%
12.00%
14.00%
Electricity Reduction (MWh)
% of Cooling Demand Reduction
Fig. 5. Reduction in electrical energy (MWh) and percentage of cooling demand as
a result of cool roof application (albedo change 0.2–0.6) using EnergyPlusTM
.
J.H. Jo et al. / Energy Policy ] (]]]]) ]]]–]]] 5
Please cite this article as: Jo, J.H., et al., Sustainable urban energy: Development of a mesoscale assessment model for solar reflectiveroof technologies. Energy Policy (2010), doi:10.1016/j.enpol.2010.09.016
7/28/2019 2010-Sustainable Urban Energy
http://slidepdf.com/reader/full/2010-sustainable-urban-energy 6/9
These numbers were then applied to the utility energy rate
section in the EnergyPlusTM simulation model for two cases:
(1) BASE CASE: Total buildings’ electricity consumption with
existing roof condition
(2) PROPOSED COOL ROOF APPLICATIONS: Total buildings’ elec-tricity consumption with cool roof applications.
The results of these simulation models reveal that the
implementation of cool roof systems has the potential to save
annual energy costs, considering both electricity for cooling and
gas for heating, by up to 4.5% of annual energy costs simply by
improving the reflectivity on rooftops. It is clear that a cool roof
system can reduce the utility costs, especially for regions where
cooling demand is dominant. Indirect benefits from shaving the
peak demand include reduced water consumption and GHG
emissions associated with the operation of conventional thermo-
dynamic power plants, and these are also quantified and
discussed below.
3.3.2. Construction cost of cool roof application
Lawrence Berkeley National Laboratory (LBNL, 2009) provides
a comprehensive database for cool roofing materials that includes
detailed technical information. However, it does not provide cost
information due to the uncertainties associated with product
pricing in different regions. We contacted 20 roofing contractors,
all of whom were members of the Arizona Cool Roofing Council, to
estimate the product and installation costs of various cool roofing
systems based on the availability of cool roofing systems in the
region. We then selected high-end and low-end prices for the
installation of white coating cool roof systems for the existing
buildings and these costs were incorporated as inputs into the
two cost benefit analysis (CBA) scenarios in the next section. As
mentioned in the technical potential assessment method section,we selected a white coating cool roof system that is not associated
with additional insulation in order to highlight the impact of
albedo change alone on the rooftops to avoid the added
complexity involved when cool roofing is applied with additional
insulation structure to the existing rooftops (Table 2).
3.3.3. Cost benefit analysis
A 20-year cost benefit analysis (CBA) was conducted to
determine the return on investment (ROI) for the new cool roof
construction on the commercial and governmental buildings in
the case study area. Electricity cost information from the local
utility provider and cool roofing system costs from roofing
contractors in the region were collected for the CBA inputs, as
presented in Table 3.
The CBA method applied here was adopted from that used in
the Life-Cycle Cost Analysis published by US Department of
Commerce (US DOC, 2008) and modified for buildings thatemploy cool roof systems. Software provided by the DOE Federal
Energy Management Program (FEMP) was used to calculate the
current nominal energy escalation rate (d) (US DOE, 2008). The
base-year energy costs were escalated from year to year at rates
projected by the Energy Information Administration (EIA, 2007) to
arrive at the total energy cost over a given period.
Two CBAs were conducted based on the low-end and high-end
costs for the cool roof system installation of white coating
material for this study.
It is important to note that several factors could change the
financial analysis over time. The cost of cool roofing systems ($/
SF) varies depending on the types of materials used, such as white
coating, form roofing, and single-ply membrane, as well as the
size of the project. There is also a tendency for the reflectivity of these roofs to degrade over time due to dirt build up and sun
damage, thus affecting the efficiency of the cool roof system.
Research, however, has shown that reflectivity can be restored up
to 90–100% of its original value by regular washing ( Akbari and
Konopacki, 2004), and this was therefore included as a main-
tenance cost in the CBA conducted for this study.
3.4. Evaluating indirect benefits related to urban sustainability
issues
The indirect benefits of cool roof regional application have
been extensively presented in prior works. Akbari and Konopacki
(2004) quantified the contribution of cool roof systems to UHI
mitigation, modeling changes in the air temperature at both the
Table 1
Time of use (TOU) utility electricity rate for large commercial buildings in the
study area.
Energy charge
On-Peak 11 am–9 pm Off-Peak 9 pm–11 am
Summer Winter Summer Winter
$0.063 per kWh $0.048 per kWh $0.050 per kWh $0.035 per kWh
Demand charge
$12.00 per kW for the first 100 On-Peak kW, plus
$8.17 per kW for all additional On-Peak kW
$4.26 per kW for first 100 Off-Peak kW, plus
$2.49 per kW for additional Off-Peak kW
Table 2
Typical cost of installing cool roof systems in Phoenix, Arizona.
Type of cool roof system System costs ($ per SF)a
White roof coatings 1.50–2.50
White roofing membranes 2.75–3.75
White asphalt shingles 3.00–4.50
White roofing tiles 5.50–7.50
a 1 SF¼0.093 m2.
Table 3
Cost benefit analysis inputs and variables.
Low end High end
Cost of cool roof retrofit ($/SF) $3,500,000
($1.50/SF)a$5,900,000
($2.50/SF)a
Retrofit area, 1000 SF
(92.9 m2)
2399 2399
Energy saved (MWh) 7830 7830
Operating weeks/year 52 52
Days/week 7 7
Hours/day 12 12
Annual savings $165,100 $165,100
Discount rate (DR)b b 0.03 0.03General inflations rate (GIR)c g 0.03 0.03
Energy inflation rate (EIR)b d 0.065 0.065
Study period (Years) 20 20
Annual maintenance (%) 1 1
a 1 SF¼0.093 m2.b Discount rate and energy escalation rate were calculated based on the
energy price indices and discount factors published by US Department of
Commerce (US DOC, 2008). Nominal escalation rate was used in the study, which
includes inflation. dnominal¼(1+ dreal)(1+ginflation)À1.c General inflation rate was adopted by the latest Consumer Price Index (CPI)
data published by the Bureau of Labor Statistics (US BLS, 2009).
J.H. Jo et al. / Energy Policy ] (]]]]) ]]]–]]]6
Please cite this article as: Jo, J.H., et al., Sustainable urban energy: Development of a mesoscale assessment model for solar reflectiveroof technologies. Energy Policy (2010), doi:10.1016/j.enpol.2010.09.016

7/28/2019 2010-Sustainable Urban Energy
http://slidepdf.com/reader/full/2010-sustainable-urban-energy 7/9
building and the regional level. Akbari et al. (2009) also examined
the effect of surface reflectivity change on global warming by
converting the energy savings into a reduction in carbon
emissions. Although our study focused primarily on the quanti-
fication of current albedo and the electricity savings that can be
achieved by installing a cool roof system for the buildings in the
case study area, the indirect benefits of a cool roof system such as
a decrease in the peak-time electricity demand and consequent
mitigation of environmental impacts such as GHG and reducedwater use were quantified based on the simulation results,
building on the findings in our prior cool roof study on a single
commercial building ( Jo et al., 2010).
4. Results
4.1. Current albedo and improvement potential
Reflectivity on the 932 building rooftops in the study area was
measured through the proposed method by integrating the
QuickBird image data with the building shapefile of the city. As
presented in Fig. 6, 677 buildings (73%) currently have rooftop
reflectivities below 0.4, and this can be improved to 0.6 by
applying a reflective roof coating product.
4.2. Energy reduction from cool roof applications
Fig. 5 shows the results of the EnergyPlusTM simulations of the
electricity reduction potential of the buildings in different size
groups by increasing roof surface albedo from 0.2 to 0.6. These
simulation results were used to quantify the energy savings that
could be achieved for 677 of the buildings in the study area by
applying reflective coating on their rooftops, and the results of
this calculation revealed a reduction in the total electricity
consumption of 7830 MWh. This amounts to a 4.3% decrease in
electricity demand in the case study area compared to the average
annual average electricity demand from 2006 to 2008 of 182,230 MWh.
4.3. Cost benefit analysis
By applying the estimated energy cost savings obtained from
the EnergyPlusTM simulation and the cool roof construction costs
provided by the roofing contractors in the study area, we
calculated the return on investment (ROI) based on the net
present value (NPV), taking into account the general inflation rate
(GIR), the energy escalation rate (EER), and the depreciation rate
(DR). The effect of electricity rate inflation was assumed to
encompass future price rate increases by including the energy
inflation rate (Black, 2008). Although annual savings can be
calculated from the EnergyPlusTM simulation results using current
electricity costs, the NPV was necessary in order to consider
actual savings in the future as it is a standard method for taking
into account the time value of money to assess long-term projects(US DOC, 2008). As shown in Table 4, the NPV will exceed the cost
for the white coating on the rooftops of the commercial and
governmental buildings in the case study area in 7 years with a
low-end cool roof cost assumption. This rises to 11 years with a
high-end cool roof cost assumption, which is still significantly less
than the 15–20 year life expectancy of a conventional roof
membrane.
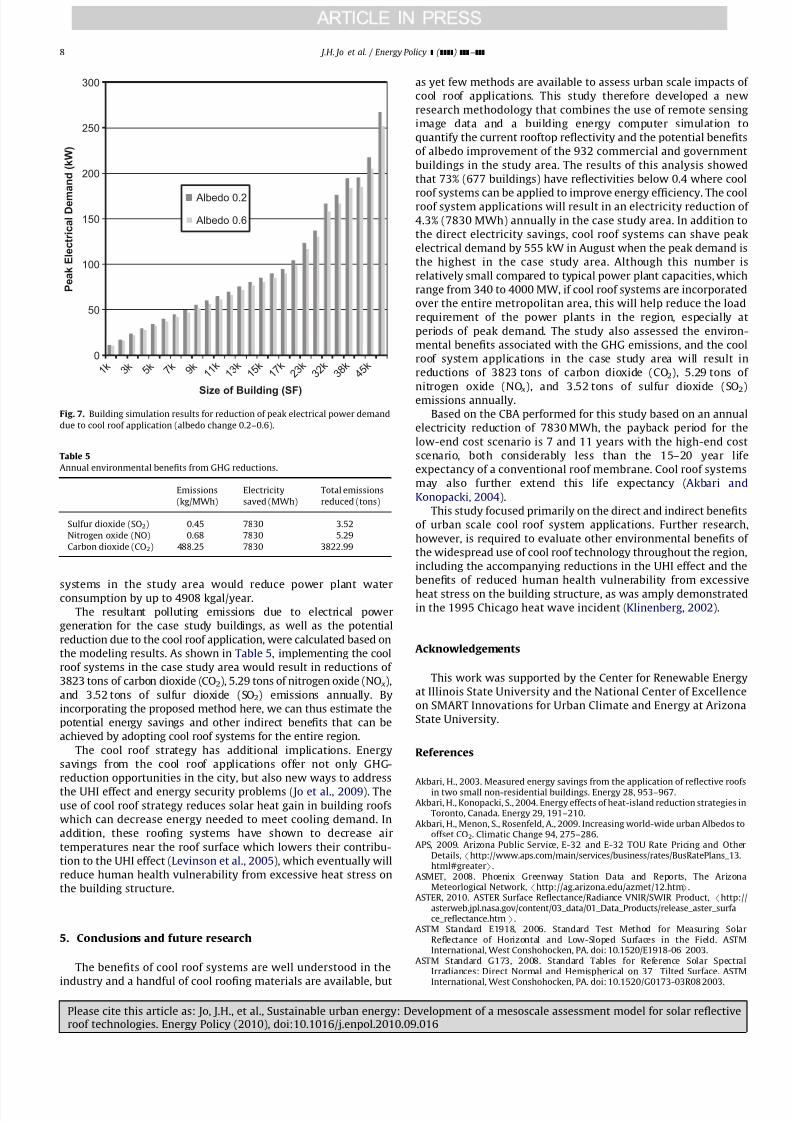
4.4. Indirect benefits
In addition to the direct benefit of electricity savings, several
indirect benefits result from the urban scale installation of cool
roof systems, including reductions in peak electrical demand and
GHG emissions, reduced water consumption at thermoelectric
power plants, and a prevention of new power plant need.
Fig. 7 represents the potential reductions in peak electrical
power demand of buildings grouped according to their different
sizes, ranging from 1000 SF (93 m2) to 56,000 SF (5203 m2).
Improving albedo from 0.2 to 0.6 can reduce peak electrical
demand by 0.3, 2.6, and 10.5 kW for buildings with footprints of
1000, 10,000, and 40,000 SF, respectively. When cool roof systems
are applied to the 677 commercial and governmental buildings
that have albedo improvement potential in the case study area,
peak-time electrical demand can be reduced by up to 555 kW.
In arid regions such as the desert Southwest in the US and in
regions across the globe that are facing multi-year droughts, an
assured water supply and good water quality are a high priority
(Golden et al., 2006). Based on actual figures for industryelectricity generation by energy source in Arizona (Sailor and
Pavlova, 2003) and Arizona thermoelectric mean water balance
data (Golden et al., 2006), implementation of the cool roof
Number of Buildings by Albedo
26 buildings(3%)49 buildings
(5%)
125 builidngs
(13%) 301 buildings(32%)
81 buildings(9%)
350 buildings(38%)
Below 0.2
0.2-0.3
0.3-0.4
0.4-0.5
0.5-0.6
Above 0.6
Fig. 6. Number of buildings by albedo classification in the case study area.
Table 4
Cost benefit analysis of cool roof construction with a low-end cost assumption.
Year Maint. Energy savings Net benefit NPVa
0
1 ($35,875) $506,791 $470,916 $457,200
2 ($36,951) $539,732 $502,781 $931,119
3 ($38,060) $574,815 $536,755 $1,422,326
4 ($39,202) $612,178 $572,976 $1,931,408
5 ($40,378) $651,969 $611,592 $2,458,973
6 ($41,589) $694,347 $652,758 $3,005,6487 ($42,837) $739,480 $696,643 $3,572,083
8 ($44,122) $787,546 $743,425 $4,158,949
9 ($45,445) $838,737 $793,291 $4,766,940
10 ($46,809) $893,255 $846,446 $5,396,776
11 ($48,213) $951,316 $903,103 $6,049,197
12 ($49,659) $1,013,152 $963,492 $6,724,971
13 ($51,149) $1,079,007 $1,027,857 $7,424,892
14 ($52,684) $1,149,142 $1,096,458 $8,149,780
15 ($54,264) $1,223,836 $1,169,572 $8,900,484
16 ($55,892) $1,303,386 $1,247,494 $9,677,880
17 ($57,569) $1,388,106 $1,330,537 $10,482,877
18 ($59,296) $1,478,333 $1,419,037 $11,316,412
19 ($61,075) $1,574,424 $1,513,349 $12,179,454
20 ($62,907) $1,676,762 $1,613,855 $13,073,006
a NPV (net present value) was calculated base on general inflation rate (GIR),
energy inflation rate (EIR), and discount rate (DR).
J.H. Jo et al. / Energy Policy ] (]]]]) ]]]–]]] 7
Please cite this article as: Jo, J.H., et al., Sustainable urban energy: Development of a mesoscale assessment model for solar reflectiveroof technologies. Energy Policy (2010), doi:10.1016/j.enpol.2010.09.016
7/28/2019 2010-Sustainable Urban Energy
http://slidepdf.com/reader/full/2010-sustainable-urban-energy 8/9
systems in the study area would reduce power plant waterconsumption by up to 4908 kgal/year.
The resultant polluting emissions due to electrical power
generation for the case study buildings, as well as the potential
reduction due to the cool roof application, were calculated based on
the modeling results. As shown in Table 5, implementing the cool
roof systems in the case study area would result in reductions of
3823 tons of carbon dioxide (CO2), 5.29 tons of nitrogen oxide (NO x),
and 3.52 tons of sulfur dioxide (SO2) emissions annually. By
incorporating the proposed method here, we can thus estimate the
potential energy savings and other indirect benefits that can be
achieved by adopting cool roof systems for the entire region.
The cool roof strategy has additional implications. Energy
savings from the cool roof applications offer not only GHG-
reduction opportunities in the city, but also new ways to address
the UHI effect and energy security problems ( Jo et al., 2009). The
use of cool roof strategy reduces solar heat gain in building roofs
which can decrease energy needed to meet cooling demand. In
addition, these roofing systems have shown to decrease air
temperatures near the roof surface which lowers their contribu-
tion to the UHI effect (Levinson et al., 2005), which eventually will
reduce human health vulnerability from excessive heat stress on
the building structure.
5. Conclusions and future research
The benefits of cool roof systems are well understood in the
industry and a handful of cool roofing materials are available, but
as yet few methods are available to assess urban scale impacts of
cool roof applications. This study therefore developed a new
research methodology that combines the use of remote sensing
image data and a building energy computer simulation to
quantify the current rooftop reflectivity and the potential benefits
of albedo improvement of the 932 commercial and government
buildings in the study area. The results of this analysis showed
that 73% (677 buildings) have reflectivities below 0.4 where cool
roof systems can be applied to improve energy efficiency. The coolroof system applications will result in an electricity reduction of
4.3% (7830 MWh) annually in the case study area. In addition to
the direct electricity savings, cool roof systems can shave peak
electrical demand by 555 kW in August when the peak demand is
the highest in the case study area. Although this number is
relatively small compared to typical power plant capacities, which
range from 340 to 4000 MW, if cool roof systems are incorporated
over the entire metropolitan area, this will help reduce the load
requirement of the power plants in the region, especially at
periods of peak demand. The study also assessed the environ-
mental benefits associated with the GHG emissions, and the cool
roof system applications in the case study area will result in
reductions of 3823 tons of carbon dioxide (CO2), 5.29 tons of
nitrogen oxide (NO x), and 3.52 tons of sulfur dioxide (SO2
)
emissions annually.
Based on the CBA performed for this study based on an annual
electricity reduction of 7830 MWh, the payback period for the
low-end cost scenario is 7 and 11 years with the high-end cost
scenario, both considerably less than the 15–20 year life
expectancy of a conventional roof membrane. Cool roof systems
may also further extend this life expectancy (Akbari and
Konopacki, 2004).
This study focused primarily on the direct and indirect benefits
of urban scale cool roof system applications. Further research,
however, is required to evaluate other environmental benefits of
the widespread use of cool roof technology throughout the region,
including the accompanying reductions in the UHI effect and the
benefits of reduced human health vulnerability from excessive
heat stress on the building structure, as was amply demonstrated
in the 1995 Chicago heat wave incident (Klinenberg, 2002).
Acknowledgements
This work was supported by the Center for Renewable Energy
at Illinois State University and the National Center of Excellence
on SMART Innovations for Urban Climate and Energy at Arizona
State University.
References
Akbari, H., 2003. Measured energy savings from the application of reflective roofsin two small non-residential buildings. Energy 28, 953–967.Akbari, H., Konopacki, S., 2004. Energy effects of heat-island reduction strategies in
Toronto, Canada. Energy 29, 191–210.Akbari, H., Menon, S., Rosenfeld, A., 2009. Increasing world-wide urban Albedos to
offset CO2. Climatic Change 94, 275–286.APS, 2009. Arizona Public Service, E-32 and E-32 TOU Rate Pricing and Other
Details,/http://www.aps.com/main/services/business/rates/BusRatePlans_13.html#greaterS.
ASMET, 2008. Phoenix Greenway Station Data and Reports, The ArizonaMeteorlogical Network,/http://ag.arizona.edu/azmet/12.htmS.
ASTER, 2010. ASTER Surface Reflectance/Radiance VNIR/SWIR Product, /http://asterweb.jpl.nasa.gov/content/03_data/01_Data_Products/release_aster_surface_reflectance.htmS.
ASTM Standard E1918, 2006. Standard Test Method for Measuring SolarReflectance of Horizontal and Low-Sloped Surfaces in the Field. ASTMInternational, West Conshohocken, PA. doi:10.1520/E1918-06 2003.
ASTM Standard G173, 2008. Standard Tables for Reference Solar SpectralIrradiances: Direct Normal and Hemispherical on 371 Tilted Surface. ASTM
International, West Conshohocken, PA. doi:10.1520/G0173-03R08 2003.
0
50
100
150
200
250
300
1 k 3 k 5 k 7 k 9 k 1 1 k
1 3 k
1 5 k
1 7 k
2 3 k
3 2 k
3 8 k
4 5 k
Size of Building (SF)
P e a k E l e c t r i c a l D e m
a n d ( k W )
Albedo 0.2
Albedo 0.6
Fig. 7. Building simulation results for reduction of peak electrical power demand
due to cool roof application (albedo change 0.2–0.6).
Table 5
Annual environmental benefits from GHG reductions.
Emissions
(kg/MWh)
Electricity
saved (MWh)
Total emissions
reduced (tons)
Sulfur dioxide (SO2) 0.45 7830 3.52
Nitrogen oxide (NO) 0.68 7830 5.29
Carbon dioxide (CO2) 488.25 7830 3822.99
J.H. Jo et al. / Energy Policy ] (]]]]) ]]]–]]]8
Please cite this article as: Jo, J.H., et al., Sustainable urban energy: Development of a mesoscale assessment model for solar reflectiveroof technologies. Energy Policy (2010), doi:10.1016/j.enpol.2010.09.016

7/28/2019 2010-Sustainable Urban Energy
http://slidepdf.com/reader/full/2010-sustainable-urban-energy 9/9
Black, A., 2008. Does it pay? Figuring the financial value of a solar or end energysystem. Solar Today 28.
Digital Globe, 2010. Products Overview, /http://www.digitalglobe.com/S.EIA, 2007. Energy Information Administration. Annual Energy Review.Federal Register, 2009. Federal Register, 74 (194), pp. 52115–52127, From the
Federal Register Online via GPO Access DOCID:fr08oc09-120, /http://wais.access.gpo.govS.
Golden, J.S., Brazel, A., Salmond, J., Laws, D., 2006. Energy and water sustainability:the role of urban climate change from metropolitan infrastructure. Journal of Green Building 1 (3), 124–138.
Golden, J.S., Carlson, J., Kaloush, K.E., Phelan, P., 2007. A comparative study of the
thermal and radiative impacts of photovoltaic canopies on pavement surfacetemperatures. Solar Energy 81, 872–883.
Graham, P., 2002. Building Ecology: First Principles for a Sustainable BuiltEnvironment. Blackwell Science, Oxford, UK.
Jo, J.H., Carlson, J.D., Golden, J.S., Bryan, H., 2010. An integrated empirical andmodeling methodology for analyzing solar reflective roof technologies oncommercial buildings. Building and Environment 45, 453–460.
Jo, J.H., Golden, J.S., Shin, S.W., 2009. Incorporating built environment factors intoclimate change mitigation strategies for Seoul, South Korea: a sustainableurban systems framework. Habitat International 33, 267–275.
Klinenberg, E., 2002. Heat Wave: A Social Autopsy of Disaster in Chicago. TheUniversity of Chicago Press, Chicago, USA.
Konopacki, S., Akbari, H., Pomerantz, M., Gabersek, S., Gartland, L., 1997. Coolingenergy savings potential of light-colored roofs for residential and commercialbuildings in 11 US metropolitan areas. Lawrence Berkeley National Laboratory.
Konopacki, S., Akbari, H., Gartland., L., Rainer, L., 1998. Demonstration of energysavings of cool roofs, Lawrence Berkeley National Laboratory Report LBNL-40673. Berkeley, CA.
LBNL, 2009. Cool Roofing Materials Database, /http://eetd.lbl.gov/coolroofs/S.Lemp, D., Weidner, U., 2005. Improvements of roof surface classification usinghyperspectral and laser scanning data. In: Moller, M., Wentz, E. (Eds.), IAPRSISVol. XXXVI-8/W27: ISPRS Joint Conferences Third International SymposiumRemote Sensing and Data Fusion Over Urban Areas (URBAN 2005)/FifthInternational Symposium Remote Sensing of Urban Areas (URS 2005).
Levinson, R., Akbari, H., Konopacki, S., Bretz, S., 2005. Inclusion of cool roofs innonresidential title 24 prescriptive requirements. Energy Policy 33, 151–170.
Michael, S., 2008. Where to live in the United States: combined energy demand forheating and cooling in the 50 largest metropolitan areas. Cities 25, 396–398.
Rose, L.S., Akbari, H., Taha, H., 2003. Characterizing the fabric of the urbanenvironment: a case study of Greater Houston, Texas. LBNL-51448.Berkeley, CA.
Sailor, D.J., Dietsch, N., 2007. The urban heat island mitigation impact screeningtool. Environmental Modelling and Software 22 (10), 1529–1541.
Sailor, D.J., Pavlova, A., 2003. Air conditioning market saturation and long termresponse of residential cooling energy demand to climate change. Energy—TheInternational Journal 28 (9), 941–951.
Simpson, J.R., McPherson, E.G., 1997. The effect of roof albedo modification oncooling loads of scale residences in Tucson, Arizona. Energy and Buildings 25,127–137.
Suehrcke, H., Peterson, E.L., Selby, N., 2008. Effect of roof solar reflectance on thebuilding heat gain in a hot climate. Energy and Buildings 40, 2224–2235.
United Nations, 2008. World Urbanization Prospects, The 2007 Revision, /http://www.un.org/esa/population/publications/wup2007/2007WUP_ExecSum_web.pdf S.
US BLS, 2009. Consumer Price Index Summary 2009, /http://www/bls.gov/cpi/S.
US DOE, 2009. Energy Efficiency and Renewable Energy, EnergyPlus EnergySimulation Software, /http://apps1.eere.energy.gov/buildings/energyplus/S.
US DOC, 2008. Energy Price Indices and Discount Factors for Life-Cycle CostAnalysis—April 2008, /http://www1.eere.energy.gov/femp/pdfs/ashb08.pdf S.
US DOE, 2008. Building Life-Cycle Cost (BLCC) Programs: The Energy EscalationRate Calculator, /http://www1.eere.energy.gov/femp/information/download_blcc.htmlS.
US EPA, 2009. Reducing Urban Heat Islands 2009: Compendium of Strategies, in:EPA (Ed.), United States Environmental Protection Agency.
USGS, 2009. ASTER Product Table, /https://lpdaac.usgs.gov/lpdaac/products/aster_products_tableS.
Yang, J., Brandon, P.S., Sidwell, A.C., 2005. Smart and Sustainable Built Environ-ments. Blackwell, Oxford, UK.
J.H. Jo et al. / Energy Policy ] (]]]]) ]]]–]]] 9
Please cite this article as: Jo, J.H., et al., Sustainable urban energy: Development of a mesoscale assessment model for solar reflectiveroof technologies Energy Policy (2010) doi:10 1016/j enpol 2010 09 016