2010 perpetual annual report
TRANSCRIPT

8/2/2019 2010 Perpetual Annual Report
http://slidepdf.com/reader/full/2010-perpetual-annual-report 1/152
P e r p e t u a l L i m i t e d A B N 8 6 0 0 0 4 3 1 8 2 7

8/2/2019 2010 Perpetual Annual Report
http://slidepdf.com/reader/full/2010-perpetual-annual-report 2/152
Final dividend payment 28 September 2010
Annual General Meeting 26 October 2010
Interim proit and dividend announcement 23 February 2011
P .
shareholder calendar

8/2/2019 2010 Perpetual Annual Report
http://slidepdf.com/reader/full/2010-perpetual-annual-report 3/152
Five year proile .........................................................................................................02
Five year results at a glance ......................................................................03
Chairman and CEO Report ........................................... ..................................04
Message rom the Chairman-elect ............................................. ........... 07
Business unit review......................................... ................................................. .. 08
Board and management ................................................. .................................... 14
Directors’ Report ............................................. ................................................. ...........19
− Corporate Responsibility Statement ................................................ 25
− Remuneration Report ......................................................................................34
Management’s Discussion and Analysis o Financial
Condition and Results o Operations (MD&A) ..............................61
Financial Statements........................................................... ................................ 88
Securities exchange and investor inormation ......................... 146
Contents

8/2/2019 2010 Perpetual Annual Report
http://slidepdf.com/reader/full/2010-perpetual-annual-report 4/152
fve year
profle
Perpetual Limited and its controlled entities’ comparative perormance or inancial years 2006 to 2010 inclusive.
2006 2007 2008 2009 2010
Ttal revenue1
Underlying EBITDA2
Underlying prit bere tax3
Underlying prit ater tax (UPAT)3
Net prit ater tax (NPAT)4
Earnings per share – UPAT5
Earnings per share – NPAT5
Return n average sharehlders’ equity – UPAT6
Return n average sharehlders’ equity – NPAT7
Dividend per share – rdinary8
Dividend per share – special8
Ttal sharehlders’ equity at 30 June
Capital expenditure
Market capitalisatin
N. shares n issue – weighted average9
N. shares n issue at 30 June9
Share price at 30 June
Share price range r year
$m
$m
$m
$m
$m
cents
cents
%
%
cents
cents
$m
$m
$m
m
m
$
$ lw$ high
402.8
206.6
178.0
122.4
135.3
300
332
40.8
45.1
326
100
331.0
26.4
2,977
40.8
40.7
73.15
57.6074.00
466.2
238.0
206.9
145.3
182.1
353
442
43.2
54.2
360
-
341.0
17.9
3,234
41.2
41.2
78.51
67.8084.20
495.7
227.1
193.6
133.5
128.8
321
309
40.7
39.3
330
-
314.4
17.7
1,794
41.6
42.0
42.77
40.9583.27
375.1
135.7
98.2
65.7
37.7
156
89
21.8
12.5
100
-
290.0
14.0
1,214
42.2
42.5
28.55
21.6052.44
422.3
152.0
107.7
72.8
90.5
169
211
22.4
27.9
210
-
361.0
11.8
1,227
43.0
43.4
28.26
25.3641.15
1 Excludes incme rm structured investments.
2 EBITDA represents earnings bere interest, taxatin, depreciatin, amrtisatin intangible assets, equity remuneratin expense and signicant items.
3 Excludes signicant items and csts majr strategic initiatives.
4 Attributable t equity hlders Perpetual Limited.
5 Diluted earnings per share calculated using the weighted average number rdinary shares and ptential rdinary shares n issue.
6 Calculated using underlying prt ater tax.
7 Calculated using net prt ater tax.
8 Dividends declared with respect t the nancial year.
9 Includes rdinary shares and ptential rdinary shares.

8/2/2019 2010 Perpetual Annual Report
http://slidepdf.com/reader/full/2010-perpetual-annual-report 5/152PERPETUAL LIMITED AND ITS CoNTRoLLED ENTITIES | 3
Earnings per share – NPAT v dividendsor year ended 30 JuneReturn on equity – NPATor year ended 30 June
Net proft ater tax or year ended 30 June
Underlying proft ater tax or year ended 30 June
fve year results at a glance
$ m i l l i o n
2007
145.3
2008
133.5
2009
65.7
2010
72.8
2006
122.4
p e r c e n t
2007
54.2
2008
39.3
2009
12.5
2010
27.9
2006
45.1
$ m i l l i o n
2007 2008 2009 20102006
182.1
128.8
37.7
90.5
135.3
c e n t s
p e r s h
a r e
2007 2008 2009 20102006
442
360
309
330
89
100
211
210
332
326
Earnings per share
Dividends

8/2/2019 2010 Perpetual Annual Report
http://slidepdf.com/reader/full/2010-perpetual-annual-report 6/152
Surce: Australian Securities Exchange
Rbert Savage, AM (let) and David Deverall.
4
We are pleased t reprt that r the year t 30 June 2010,
Perpetual’s perrmance and nancial psitin imprved
cnsiderably ver the previus year.
our net prt increased substantially, allwing us t mre than
duble ur dividend payments t sharehlders, and the duble-
digit grwth ur underlying prt bdes well r the uture.We urther strengthened ur already strng balance sheet and
cntinued t reduce ur risk prle.
We als cntinued t invest in ur peratinal capability, the
quality ur client services, ur adviser base, and ur brand.
At the same time, we have made changes t ensure all ur
businesses are clearly cused n meeting the requirements
their key client segments.
Having saely steered thrugh the glbal nancial crisis by
cntrlling csts, reducing risk and imprving ur nancial
strength, we have emerged in gd shape t execute ur visin:
‘t be the leading prvider wealth management services t
nancially successul investrs and their advisers, and t be theleading crprate trustee’.
Times change are times pprtunity and we are cndent
we have the experience, values and capability t nce again
benet rm the majr changes underway in the sectrs in which
we perate.
In the eighties and nineties, we transrmed rm a traditinal
trustee huse int ne Australia’s leading und managers
and played a rmative rle in the develpment the cuntry’s
securitisatin industry. In the rst decade this century, we have
becme a brad-based wealth manager, prviding specialised
prducts, services and advice r peple wh want t take activerespnsibility r their nancial wellbeing.
We have develped ur Private Wealth business t er premium
advice and services specically r nancially successul
Australians and their amilies. In additin t strategic nancial
planning and investment advice, we prvide estate planning,
philanthrpic services, and duciary services, where we prtect
clients’ interests and assets as trustee r custdian.
our Crprate Trust business has als expanded its ering
t nancial services cmpanies t include mrtgage
prcessing services.
Improved operating environmentover the past year, we experienced a much imprved perating
envirnment cmpared t the prir year.
Bth equity and credit markets cntinued t imprve thrugh the
rst three quarters the year. In the urth quarter, cncerns
ver gvernment debt levels, particularly in Eurpe, caused
renewed market instability, althugh this subsided smewhat
as the nancial year clsed.
Retail investr cndence gradually imprved during mst the
year but remains ragile. While new infws remained subdued,
there was sme mvement by investrs rm risk-averse cash
and xed incme unds twards managed unds with higher
ptential returns. These mre actively managed unds als
generate higher revenue r us.
The glbal nancial crisis will nt be rgtten by investrs
r sme time. The cncerns abut svereign debt that
caused glbal market instability in the nal quarter reminded
investrs that its ater-eects will impact gvernment ecnmic
management, regulatin and markets r years t cme.
chairman
and ceo report

8/2/2019 2010 Perpetual Annual Report
http://slidepdf.com/reader/full/2010-perpetual-annual-report 7/152PERPETUAL LIMITED AND ITS CoNTRoLLED ENTITIES | 5
net prt ater tax, in keeping with ur plicy paying
dividends t sharehlders between 80 and 100 per cent
net prt ater tax n an annualised basis.
Underlying prt ater tax r the year, which excludes signicant
items such as the EMCF recveries, was $72.8 millin, a slid
11 per cent increase n the previus year.
The largest infuence n ur revenue is the perrmance
the Australian sharemarket, which directly impacts ur unds
under management and unds under advice. As at 30 June 2010,
we calculate that each 1 per cent mvement in the Australian
All ordinaries Index aects ur annualised revenue by$2 t $2.5 millin.
Strnger markets in the rst three quarters the year saw average
unds under management r the year increase 7 per cent ver
the prir year. Due t market declines in the urth quarter as
well as net utfws, year-n-year t 30 June 2010, unds under
management nly increased 3 per cent t $26.9 billin.
As investrs started t shit t asset classes with higher ptential
returns, cash and xed interest unds saw a $1.4 billin net
utfw. Similarly, quantitative unds saw a general trend away
rm this type investment apprach.
* Attributab le t Perpetual Limited rdinary equity hlders.
In this envirnment, clients will preer t deal with wealth
management institutins that are nancially strng in their wn
right, with established reputatins r managing their clients’
mney and prtecting their interests. Perpetual’s track recrd
thrugh the glbal nancial crisis, and ver the past 124 years,
means we are well placed t benet.
Securitisatin markets r residential mrtgage backed securities,
in which ur crprate trustee business is the market leader, saw
a tentative rebund in activity, althugh it is still at much reduced
levels when cmpared t thse prir t the glbal nancial crisis.
Results overview The Grup’s net prt ater tax* r the year ended
30 June 2010 was $90.5 millin, a 140 per cent increase n
the previus year. This included a $20 millin ater tax recvery
past lsses rm the Exact Market Cash Fund (EMCF).
our return n equity r the year based n net prt ater tax
was 27.9 per cent, up rm 12.5 per cent in the prir year.
We have been able t increase dividend payments t
sharehlders t 210 cents per share r the year, cmpared
t 100 cents the previus year. This represents 100 per cent
3,250
3,500
3,750
4,000
4,250
4,500
4,750
5,000
5,250
Sep 2008 Dec 2008 Mar 2009 Jun 2009 Sep 2009 Dec 2009 Mar 2010 Jun 2010
FY09 Avg All Ords
FY09
Spot close All Ords
FY10 Avg All Ords
FY10
Avg All Ords
I n d e x
Perpetual’s perormance
and inancial positionimproved considerablyover the previous year.
Australian sharemarket July 2008 - June 2010
S&P ASX All ordinaries Price Index 1 July 2008 t 30 June 2010.
8/2/2019 2010 Perpetual Annual Report
http://slidepdf.com/reader/full/2010-perpetual-annual-report 8/1526
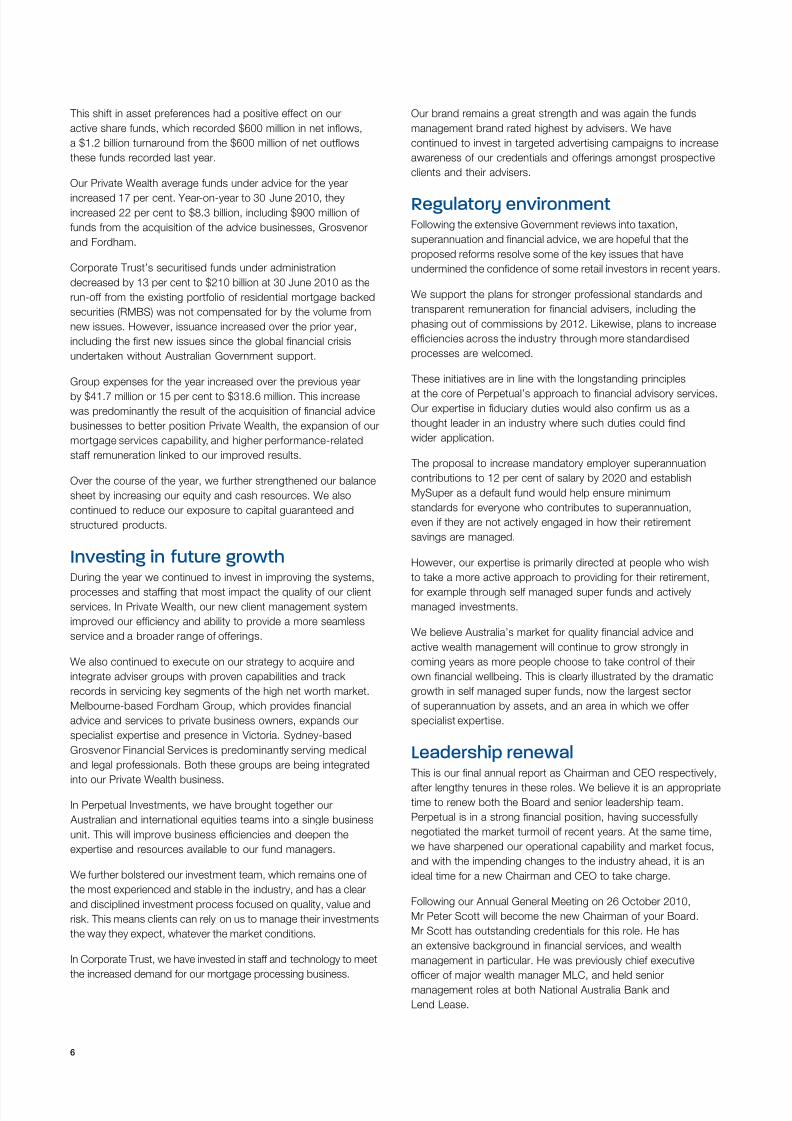
This shit in asset preerences had a psitive eect n ur
active share unds, which recrded $600 millin in net infws,
a $1.2 billin turnarund rm the $600 millin net utfws
these unds recrded last year.
our Private Wealth average unds under advice r the year
increased 17 per cent. Year-n-year t 30 June 2010, they
increased 22 per cent t $8.3 billin, including $900 millin
unds rm the acquisitin the advice businesses, Grsvenr
and Frdham.
Crprate Trust’s securitised unds under administratin
decreased by 13 per cent t $210 billin at 30 June 2010 as the
run- rm the existing prtli residential mrtgage backed
securities (RMBS) was nt cmpensated r by the vlume rm
new issues. Hwever, issuance increased ver the prir year,
including the rst new issues since the glbal nancial crisis
undertaken withut Australian Gvernment supprt.
Grup expenses r the year increased ver the previus yearby $41.7 millin r 15 per cent t $318.6 millin. This increase
was predminantly the result the acquisitin nancial advice
businesses t better psitin Private Wealth, the expansin ur
mrtgage services capability, and higher perrmance-related
sta remuneratin linked t ur imprved results.
over the curse the year, we urther strengthened ur balance
sheet by increasing ur equity and cash resurces. We als
cntinued t reduce ur expsure t capital guaranteed and
structured prducts.
Investing in uture growthDuring the year we cntinued t invest in imprving the systems,
prcesses and stang that mst impact the quality ur client
services. In Private Wealth, ur new client management system
imprved ur eciency and ability t prvide a mre seamless
service and a brader range erings.
We als cntinued t execute n ur strategy t acquire and
integrate adviser grups with prven capabilities and track
recrds in servicing key segments the high net wrth market.
Melburne-based Frdham Grup, which prvides nancial
advice and services t private business wners, expands ur
specialist expertise and presence in Victria. Sydney-based
Grsvenr Financial Services is predminantly serving medical
and legal pressinals. Bth these grups are being integratedint ur Private Wealth business.
In Perpetual Investments, we have brught tgether ur
Australian and internatinal equities teams int a single business
unit. This will imprve business eciencies and deepen the
expertise and resurces available t ur und managers.
We urther blstered ur investment team, which remains ne
the mst experienced and stable in the industry, and has a clear
and disciplined investment prcess cused n quality, value and
risk. This means clients can rely n us t manage their investments
the way they expect, whatever the market cnditins.
In Crprate Trust, we have invested in sta and technlgy t meet
the increased demand r ur mrtgage prcessing business.
our brand remains a great strength and was again the unds
management brand rated highest by advisers. We have
cntinued t invest in targeted advertising campaigns t increase
awareness ur credentials and erings amngst prspective
clients and their advisers.
Regulatory environmentFllwing the extensive Gvernment reviews int taxatin,
superannuatin and nancial advice, we are hpeul that the
prpsed rerms reslve sme the key issues that have
undermined the cndence sme retail investrs in recent years.
We supprt the plans r strnger pressinal standards and
transparent remuneratin r nancial advisers, including the
phasing ut cmmissins by 2012. Likewise, plans t increase
eciencies acrss the industry thrugh mre standardised
prcesses are welcmed.
These initiatives are in line with the lngstanding principlesat the cre Perpetual’s apprach t nancial advisry services.
our expertise in duciary duties wuld als cnrm us as a
thught leader in an industry where such duties culd nd
wider applicatin.
The prpsal t increase mandatry emplyer superannuatin
cntributins t 12 per cent salary by 2020 and establish
MySuper as a deault und wuld help ensure minimum
standards r everyne wh cntributes t superannuatin,
even i they are nt actively engaged in hw their retirement
savings are managed.
Hwever, ur expertise is primarily directed at peple wh wish
t take a mre active apprach t prviding r their retirement,
r example thrugh sel managed super unds and actively
managed investments.
We believe Australia’s market r quality nancial advice and
active wealth management will cntinue t grw strngly in
cming years as mre peple chse t take cntrl their
wn nancial wellbeing. This is clearly illustrated by the dramatic
grwth in sel managed super unds, nw the largest sectr
superannuatin by assets, and an area in which we er
specialist expertise.
Leadership renewal This is ur nal annual reprt as Chairman and CEo respectively,
ater lengthy tenures in these rles. We believe it is an apprpriate
time t renew bth the Bard and senir leadership team.
Perpetual is in a strng nancial psitin, having successully
negtiated the market turmil recent years. At the same time,
we have sharpened ur peratinal capability and market cus,
and with the impending changes t the industry ahead, it is an
ideal time r a new Chairman and CEo t take charge.
Fllwing ur Annual General Meeting n 26 octber 2010,
Mr Peter Sctt will becme the new Chairman yur Bard.
Mr Sctt has utstanding credentials r this rle. He has
an extensive backgrund in nancial services, and wealthmanagement in particular. He was previusly chie executive
cer majr wealth manager MLC, and held senir
management rles at bth Natinal Australia Bank and
Lend Lease.

8/2/2019 2010 Perpetual Annual Report
http://slidepdf.com/reader/full/2010-perpetual-annual-report 9/152

8/2/2019 2010 Perpetual Annual Report
http://slidepdf.com/reader/full/2010-perpetual-annual-report 10/1528
Perpetual operates through three
business units, each o which ocuses
on a specifc fnancial services sector:
Perpetual Investments on unds
management, Private Wealth on
fnancial advice, and Corporate Trust
on trustee services.
CorporateTrust
PrivateWealth
PerpetualInvestments
52%
24%
24%
Perpetual Investments
PerPetual Investments Is one o
australIa’s most hIghly regarded und
managers, oerIng a broad range
o Investment, suPerannuatIon and
retIrement Income Products. We have a
strong Investment caPabIlIty In all major
asset classes, IncludIng australIan and
InternatIonal equItIes, ProPerty securItIes,multI-sector and multI-manager unds,
mortgages, Ixed Income and cash.
We actively manage investment prtlis based n ur intensive
analysis quality, value and risk. While prices can fuctuate
greatly with prevailing market sentiment, we believe that, ver the
lng term, they shuld refect undamental value. In Nvember
2009 Perpetual Investments signed the United Natins Principles
r Respnsible Investment, which means we rmally incrprate
envirnmental, scial and gvernance actrs as part ur
investment decisin-making and wnership practices.
Quality investment management requires highly trainedpressinals, clear principles and prcesses, and eective
teamwrk. over the past year, we have again retained all ur
key investment managers and cntinued t attract talented new
sta wh value ur reputatin as a und manager with strng
principles and prven track recrd.
Average unds under management r the year increased
7 per cent ver the prir year due t strnger markets in the rst
three quarters. Due t market declines in the urth quarter as
well as net utfws, year-n-year t 30 June 2010, unds under
management nly increased 3 per cent t $26.9 billin.
Revenue r the year increased 6 per cent t $216.9 millin, mainly
due t increased revenue rm actively managed equity unds.
Perpetual Investments’ prt bere tax r the year ended
30 June 2010 was $72.1 millin, a 22 per cent increase
n the previus year.
As the glbal nancial system stabilised and the wrst ears a
glbal ecnmic recessin subsided, the past year saw investrs
and their advisers gradually becme mre cndent abut
Results or the year ended 30 June
2009
$m
2010
$m
change
$m
change
%
Revenues 203.0 216.9 13.9 7%
Expenses (144.0) (144.8) (0.8) (1%)
Proit beore tax 59.0 72.1 13.1 22%
business unit
review
Contribution to 2010 underlying proit beore tax

8/2/2019 2010 Perpetual Annual Report
http://slidepdf.com/reader/full/2010-perpetual-annual-report 11/152PERPETUAL LIMITED AND ITS CoNTRoLLED ENTITIES | 9
making investment decisins r the lnger term. This imprving
cndence was smewhat dampened in the June quarter, when
markets reacted negatively t cncerns abut the nances andcredit-wrthiness sme Eurpean cuntries.
The change in investr and adviser attitudes was clearly refected
in ur net fws r the year. While ur quantitative equity unds
recrded net utfws $1 billin, ur actively managed equity
unds recrded net infws $600 millin.
Net utfws rm cash and xed interest unds were $1.4 billin,
as investrs mved mney rm risk-averse cash investments t
asset classes with ptentially higher returns. Mst the cash
and similar unds generate lwer ee margins than ur mre
actively managed unds.
While there has been a brad market trend ver the past decade
twards passive investment strategies, particularly index unds,
we believe demand r actively managed unds will cntinue
but investrs will be mre selective in chsing a prven,
quality manager.
our business cuses n ur key client segments – institutins,
high net wrth and mass afuent clients and their respective
advisers, and direct investrs.
Fr high net wrth clients and their advisers, we will cntinue
t develp specialised unds, able t meet particular investment
bjectives, such as the Pure Value Share Fund, Glbal Resurces
Fund and Diversied Incme Fund.
Fr the mass afuent client segment, ur majr equity, cash
and xed incme unds are available thrugh Perpetual, as well
as thrugh a brad range adviser grups and ther nancialinstitutins. Similarly, ur WealthFcus platrm ers a brad
range investment chices rm Perpetual and ther leading
und managers.
We enjy strng relatinships with many institutins and are able
t cnstruct and manage custmised prtlis t meet their
specic risk and return bjectives. Fr example, ver the past
year we develped a sustainable investment und specically r
ne Australia’s largest super unds and wn ther substantial
mandates r cncentrated equities and smaller cmpanies.
During calendar 2010, the Australian and internatinal equities
teams were brught tgether int a single business unit s theycan share resurces and expertise in bth business management
and investment.
over the past year, we invested cnsiderable resurces in ur
systems and prcesses t imprve eciency and the service ur
clients receive – whether this is receiving tax statements as sn
as pssible ater year-end, reduced call centre waiting times r a
mre inrmative and easier-t-use website.
In managing investments, there is ne thing we never lse sight
: the act that it is nt ur mney we are managing, it is ur
clients’ mney, entrusted t us t manage n their behal.
Annualised
returns
Industrial
Share Fund
Australian
Share Fund
Small Companies Fund Concentrated Equity
Fund
International
Share Fund
1 year + 0.07% + 5.90% + 14.64% + 2.80% - 0.36%
3 years + 4.07% + 4.13% + 6.13% + 5.83% + 2.43%
5 years + 2.57% + 2.53% + 4.17% + 3.76% + 1.20%
7 years + 2.40% + 2.66% + 2.49% + 2.68% N/A
10 years + 4.46% + 4.21% + 8.28% + 5.06% N/A
Grss utperrmance per annum against benchmarks t end June 2010.
Perpetual Investments – unds’ outperormance

8/2/2019 2010 Perpetual Annual Report
http://slidepdf.com/reader/full/2010-perpetual-annual-report 12/15210
Private Wealth
PrIvate Wealth Is the grouP’s sPecIalIstInancIal servIces and advIce busIness,
ProvIdIng a broad range o servIces
to InancIally successul australIans
and theIr amIlIes. We take a holIstIc
aPProach to ProvIdIng advIce, WhIch
covers strategIc PlannIng, Investment
strategy, suPerannuatIon and retIrement
Income, estate PlannIng, tax, and
Personal Insurance.
Drawing n ur experience as a trustee r generatins
Australians, we als prvide a range trustee and duciary
services t help peple prtect and manage their assets and
incme in their lietime and beynd. We are able t establish and
manage an array trusts including private trusts, testamentary
trusts, philanthrpic trusts, and special purpse trusts t manage
cmpensatin settlements.
We are ne Australia’s largest managers philanthrpic
trusts, with ver $1.1 billin in unds under management n
behal 450 trusts.
our duciary services als include estate planning and
administratin, enduring pwers attrney, and businesssuccessin planning.
With the grwth in sel managed super unds and the need r estate
planning as the ppulatin ages, the market r these duciary
services is set t expand strngly in cming years and we believe
there are exciting pprtunities t market ur services thrughexternal adviser grups and ther pressinal reerral netwrks.
The past ew years have been challenging r many ur clients
as their investments have been subject t the intense vlatility
nancial markets. Hwever, ur prudent, lng-term apprach
t investing helped shield them rm the wrst the dwnturn
and enabled them t benet rm the market recvery. We cus
strngly n ensuring we understand ur clients’ circumstances
and bjectives, and in turn they clearly understand ur advice
and the nging service they will receive.
Average unds under advice r the year increased 17 per cent.
Year-n-year t 30 June 2010, it increased 22 per cent t
$8.3 billin, including $900 millin unds rm the acquisitin advice businesses Grsvenr and Frdham.
Results or the year ended 30 June
2009
$m
2010
$m
change
$m
change
%
Revenues 85.7 111.6 25.9 30%
Expenses (56.6) (79.0) (22.4) (40%)
Proit beore tax 29.1 32.6 3.5 12%
We have become a broad-based wealth manageror people who want to take active responsibilityor their fnancial wellbeing.

8/2/2019 2010 Perpetual Annual Report
http://slidepdf.com/reader/full/2010-perpetual-annual-report 13/152PERPETUAL LIMITED AND ITS CoNTRoLLED ENTITIES | 11
Revenue increased by $25.9 millin t $111.6 millin, 30 per cent
up n the prir year. In additin t increased ees earned rm
unds under advice, revenue was blstered by revenue rm theacquired advice businesses, which cntributed t a $10 millin
increase in ee revenue r accunting and tax services.
Private Wealth’s prt bere tax r the year increased by 12 per
cent t $32.6 millin. This refected the imprvement in investment
markets, set by investment in the business as well as the
acquisitin and integratin csts the acquired businesses.
over the past year, we cntinued t invest in imprving the
service we prvide t clients acrss all areas the business.
We hired new client acing sta, including advisers, and added
substantial capacity and specialist expertise in accunting and
taxatin services, and strategic cnsulting. We als urther
strengthened ur investment research team with a number
highly experienced pressinals and enhanced ur equities
selectin and mdel prtli cnstructin prcesses.
our new client relatinship management system, intrduced in
the prir year, was urther integrated int ur business peratins
and enhanced during the past year. It puts ur clients at the
centre all ur prcesses and helps us prvide better service
t ur clients acrss the range services we can prvide. It als
imprves reprting, cmpliance and risk management.
The acquisitins Grsvenr and Frdham have nt nly
strengthened ur adviser resurces in the key markets Sydney
and Melburne, but have given us specialist expertise in servingthe nancial needs private business wners and medical and
legal pressinals.
We intend t acquire ther advice businesses that meet ur
acquisitin criteria, pressinal standards and values, particularly
i they er specialist expertise we can leverage r ur brader
client base and service ering.
We are well psitined t transitin t the prpsed new
regulatins r adviser respnsibilities and remuneratin, as
mst ur revenue is already derived rm pressinal ees
rather than cmmissins. our duciary duty t ur clients has
always been paramunt as a trustee and is demnstrated bythe way we deliver impartial advice. We als ensure ur advisers
have pressinal qualicatins well abve the minimum
standards required.
As the nancial advice sectr enters a majr perid change,
we believe many gd advisers and their clients are attracted t
Perpetual because the quality ur brand and ur reputatin
r integrity in managing and prtecting ur clients’ interests.
2009
$b
Net lows
$b
Acquired1
$b
Market2
$b
2010
$b
Financial advisory
Superannuatin 2.4 - 0.7 0.2 3.3
Nn-superannuatin 1.8 - 0.2 0.2 2.2
4.2 - 0.9 0.4 5.5
Fiduciary services
Philanthrpic 1.0 - - 0.1 1.1
Trusts and estates 1.6 - - 0.1 1.7
2.6 - - 0.2 2.8
Total unds under advice 6.8 - 0.9 0.6 8.3
1 Includes FUA acquired thrugh the purchase Grsvenr Financial Services in September 2009 and Frdham Business Advisrs in January 2010.2 Includes reinvestments, distributins, incme and asset grwth.
Perpetual Private Wealth – unds under advice as at 30 June

8/2/2019 2010 Perpetual Annual Report
http://slidepdf.com/reader/full/2010-perpetual-annual-report 14/15212
Residential mortgage backedsecurities – non-bank
20102009
$241b$211b
Commercial mortgageand asset backed securities
Residential mortgage backedsecurities – repos
Residential mortgage backedsecurities – bank
20102009
95, 687
199, 257
Corporate Trust
our corPorate trust busIness Is the
leadIng ProvIder o sPecIalIst trustee
and related busIness servIces to other
InancIal InstItutIons. thIs Includes
actIng as trustee or a broad range
o Investment unds, securItIsatIon o
mortgage PortolIos, and mortgage
ProcessIng and admInIstratIon.
While residential mrtgage backed securities (RMBS) in Australia
avided the prblems assciated with securitised sub-prime lans
in the US, Australia’s securitisatin market was nevertheless greatlyimpacted by the negative repercussins that aected all credit
and securitisatin markets wrldwide. During the glbal nancial
crisis, the Australian Gvernment prvided assistance t supprt
securitisatin issuance in rder t maintain an ecient market.
over the past year, mre stable credit markets generally and
reduced credit spreads n RMBS have revived interest in this
market, althugh at a much reduced level cmpared t the
perid prir t the glbal nancial crisis.
In a psitive sign r the uture, new securitisatin issues increased
ver the prir year, including the rst new issues since the glbal
nancial crisis undertaken withut Australian Gvernment supprt.
Hwever, while Crprate Trust increased its market share during
the curse the year, new issuance did nt make up r the run-
the existing prtli as lw interest rates allwed peple t
pay existing mrtgages mre quickly. Hwever, this trend has
slwed as interest rates have risen.
As a result, Crprate Trust’s securitised unds under
administratin decreased by 13 per cent r the year t
$210.5 billin.
Revenue increased 9 per cent t $87.5 millin, largely driven by
increased demand r ur mrtgage services. Perpetual Lenders
Mrtgage Services (PLMS) mre than dubled the amunt
mrtgage transactins prcessed t almst 200,000, increasing
its revenue by 46 per cent ver the prir year.
Crprate Trust recrded a prt bere tax $32.3 millin r
the year ended 30 June 2010, an 11 per cent decrease n the
prir year, due t lwer securitisatin revenues and a 25 per cent
increase in expenses ver the prir year t $55.2 millin. The
increased expenses primarily related t a substantial investment
in the scale PLMS in rder t service the dramatic increase in
demand r its services.
our extensive knwledge nancial markets, tgether with ur
trustee experience, means we cntinue t be entrusted by many
Australia’s majr institutins t administer key aspects their
business and t prtect the interests investrs.
Results or the year ended 30 June
2009
$m
2010
$m
change
$m
change
%
Revenues 80.3 87.5 7.2 9%
Expenses (44.2) (55.2) (11.0) (25%)
Proit beore tax 36.1 32.3 (3.8) (11%)
Securitisation unds under administration as at 30 June Mortgage transactions or the year ended 30 June

8/2/2019 2010 Perpetual Annual Report
http://slidepdf.com/reader/full/2010-perpetual-annual-report 15/152
o
We are trustworthy
We keep raising the bar
We consistently deliver
We succeed together

8/2/2019 2010 Perpetual Annual Report
http://slidepdf.com/reader/full/2010-perpetual-annual-report 16/15214
Mr Brasher brings t the Bard his lcal and glbal experience as
a senir executive and directr, particularly in the areas strategy,
audit and risk management, and public cmpany gvernance.
Meredith J Brooks, Independent Director
BA, FIAA (Age 48)
Appinted as a Directr in Nvember 2004. She is a member
Perpetual’s Audit Risk and Cmpliance Cmmittee and
Investment Cmmittee.
Ms Brks brings t the Bard ver 20 years experience as a senir
unds management executive, bth in Australia and internatinally.
Philip Bullock, Independent Director
BA, MBA, Dip Ed, GAICD (Age 57)
Appinted as a Directr in June 2010. He is a member Perpetual’s
Investment Cmmittee and Peple and Remuneratin Cmmittee.
Mr Bullck brings t the Bard his brad management
experience in Australia and Asia in technlgy, sales and
board and
managementPerpetual Board
Robert M Savage AM, Chairman and Independent Director
FASCPAS, FAICD, FAIM (Age 68)
Appinted as a Directr in 2001 and as Chairman in octber2005. Mr Savage will retire as Chairman and Directr at the
cnclusin the Annual General Meeting n 26 octber 2010.
He is a member Perpetual’s Nminatins Cmmittee and the
Peple and Remuneratin Cmmittee.
Mr Savage brings t the Perpetual Bard his experience
as a senir executive in Australia and the Asian regin,
including experience in peple management and rganisatin
eectiveness and several years as a nn-executive directr and
chairman acrss a range Australian cmpanies.
Paul V Brasher, Independent Director
BEc (Hons), FCA (Age 60)
Appinted as a Directr in Nvember 2009. He is a member
Perpetual’s Audit Risk and Cmpliance Cmmittee and Peple
and Remuneratin Cmmittee.

8/2/2019 2010 Perpetual Annual Report
http://slidepdf.com/reader/full/2010-perpetual-annual-report 17/152PERPETUAL LIMITED AND ITS CoNTRoLLED ENTITIES | 15
client management, prduct and brand management, industry
slutins and equity jint ventures.
E Paul McClintock AO, Independent Director
BA, LLB (Age 61)
Appinted as a Directr in April 2004. He is Chairman Perpetual’s
Investment Cmmittee and a member the Nminatins
Cmmittee and Peple and Remuneratin Cmmittee.
Mr McClintck brings t the Bard ver 30 years experience
as a legal adviser, investment banker and senir plicy adviser
t Gvernment and crpratins.
Elizabeth M Proust AO, Independent Director
BA (Hons), LLB, FAICD (Age 59)
Appinted as a Directr in January 2006. She is Chairman
Perpetual’s Peple and Remuneratin Cmmittee and a member
Perpetual’s Audit Risk and Cmpliance Cmmittee and
Nminatins Cmmittee.
Ms Prust brings t the Bard her strengths in change management,
human resurces, public aairs and strategy develpment, and
her strng knwledge bard prcesses and gvernance gained
thrugh her many senir executive and bard rles.
Peter B Scott, Independent Director
BE (Hons), MEngSc (Age 56)
Appinted as a Directr in July 2005. Mr Sctt was appinted as
Chairman-elect n 23 July 2010, t succeed Rbert Savage AM,
wh will be retiring at the cnclusin the Annual General Meeting
n 26 octber 2010. He is Chairman the Nminatins Cmmittee
and a member Perpetual’s Investment Cmmittee and Peple
and Remuneratin Cmmittee.
Mr Sctt has mre than 20 years experience as a senir
executive in publicly listed cmpanies and extensive knwledge
the wealth management industry.
Philip J Twyman, Independent Director
BSc, MBA, FAICD (Age 66)
Appinted as a Directr in Nvember 2004. He is Chairman
Perpetual’s Audit Risk and Cmpliance Cmmittee and a member
the Investment Cmmittee and Nminatins Cmmittee.
As an experienced internatinal executive and directr,
Mr Twyman brings t the Bard his backgrund in nancial
services, investment and wealth management, tgether with
practical experience in audit and risk management issues.
David M Deverall, Managing Director
BE (Hons), MBA (Stanord) (Age 44)
Appinted Managing Directr in September 2003. Mr Deverall
gave ntice his resignatin n 23 June 2010 and will stay
until the new CEo has been appinted r until 31 March 2011,
whichever ccurs rst.
Mr Deverall brings t Perpetual a cmbinatin strategic
ability, cmmercial drive and skills in prduct innvatin andmanagement experience acrss a brad range investment
prducts and services. He als pssesses an extensive
understanding the wealth management and wider nancial
services industries.
Alternate DirectorsRoger Burrows – Chie Financial Ofcer
Ivan Holyman – Chie Risk Ofcer
Fr mre detailed inrmatin n the Bard Perpetual Limited,
please reer t page 20.
Let t right: Philip Bullck, Paul McClintck Ao,Meredith Brks, David Deverall, Rbert Savage AM, Peter Sctt,
Elizabeth Prust Ao, Paul Brasher, Philip Twyman.
8/2/2019 2010 Perpetual Annual Report
http://slidepdf.com/reader/full/2010-perpetual-annual-report 18/15216
Perpetual management
Richard Brandweiner, BEc, CFA
Group Executive, Income and Multi Sector
Richard is respnsible r Perpetual’s unds management
business cvering cash, xed incme and multi-strategyprtlis. He chairs Perpetual’s Investment Review Cmmittee,
Credit Cmmittee and Multi-Manager Investment Cmmittee.
Richard jined Perpetual in 2001 and has previusly held the
rles General Manager, Investments acrss all asset classes
and Prtli Manager, Diversied Funds. Prir t jining
Perpetual, Richard wrked in investment manager research
at ASSIRT and Advance Asset Management.
He is currently Vice President the Chartered Financial Analysts
Sciety Sydney and a member the Financial Services
Cuncil Investment Cmmittee.
Roger Burrows, BCom, CPA, MAICD
Chie Financial Ofcer
Rger is respnsible r Perpetual’s verall nance unctin,
including strategy, business planning, treasury, capital
management and investr relatins. He is als a Directr
the Grup’s regulated/licensed entities, including Chairman
Perpetual Superannuatin Limited. He is Alternate Directr r
Rbert Savage, Perpetual’s Chairman, and is a member the
Perpetual Fundatin Cmmittee Management.
Rger jined Perpetual in April 2008 as Chie Financial ocer.
He has mre than 25 years nance experience in a diverse range
industries, including prperty, nancial services, inrmatin
technlgy services, pressinal services and manuacturing.
Prir t jining Perpetual, Rger was Grup Chie Financial
ocer at Lend Lease. During 20 years with Lend Lease he
held a number senir nance rles in perating cmpanies in
Australia and verseas, including heading grup investr relatins
and crprate aairs. Rger cmmenced his career with BHP
Steel Internatinal and KPMG Chartered Accuntants.
He is Chairman the UTS Bachelr Accunting Steering
Cmmittee, which he has been a member r ver 10 years.
He is als a member the Grup 100 Natinal Executive.
Cathy Doyle
BSocSc, GradDipPsych, GradDipVET, MBA, GAICD
Group Executive, Equities
Cathy is respnsible r Perpetual’s unds management business
cvering Australian and Glbal Equities. She is a Directr
Perpetual Investment Management Limited and a member
Perpetual’s Investment Review Cmmittee and the Perpetual
Fundatin Cmmittee Management. Prir t assuming her
current rle in April 2010, Cathy held the psitins Grup
Executive Perpetual Investments Business Services, Chie
operating ocer Australian Equities and Grup Executive
Peple and Culture.
Prir t jining Perpetual in 2006, Cathy held senir rles in human
resurces, change management, strategy and sales in several
cmpanies and industries. This included rles as Grup General
Manager Peple r Qantas, Executive General Manager, Peple
and Change at Cmmnwealth Bank, and General Manager
Human Resurces and Strategy at NRMA Member Services.
Since 2007 Cathy has been Chairman odyssey Huse, whichcnducts rehabilitatin prgrams r peple with drug, alchl
r gambling prblems.
Chris Green, BCom, MBA, LLB, MAICD
Group Executive, Corporate Trust
Chris heads up Perpetual’s Crprate Trust securitisatin and
mrtgage services businesses. He jined Perpetual in July 2006
and was appinted Grup Executive in Nvember 2008.
Prir t jining Perpetual, Chris was at JP Mrgan Chase Bank
r 10 years, mst recently as Australasia Business Head –
Institutinal Trust Services based in Sydney and previusly
as Vice President – Head Accunt Management and Vice
President – Head Analytics based in Lndn, cvering the
Eurpean, Middle Eastern and Arican markets. Chris began
his career as a slicitr r Crrs Chambers Westgarth.
Ivan Holyman, BEc, LLB
Chie Risk Ofcer
Ivan is respnsible r Perpetual’s Risk Management ramewrk
and reprting. He is a Directr a number the Grup’s
regulated/licensed entities, and Alternate Directr r David Deverall,
Perpetual’s Managing Directr. He is a member the Perpetual
Fundatin Cmmittee Management, the Investment Review
Cmmittee and the Cmpliance Cmmittees Perpetual Investment
Management Limited and Perpetual Trust Services Ltd.
Ivan jined Perpetual in June 2004 as Chie Risk ocer. Prir
t jining Perpetual he was invlved in a number private
equity ventures. He previusly spent 19 years with UBS AG
(and predecessr rganisatins), during which time he held
the psitins Chie operating ocer, Asia Pacic, as well as
Directr Crprate Finance, Head Risk and Chie operating
ocer r Australia/New Zealand. Prir t UBS Ivan wrked with
merchant bank Samuel Mntagu & C. in Lndn, and at Blake
Dawsn Waldrn, Slicitrs in Melburne.
Geo Lloyd – Barrister at Law, LLM
Group Executive, Private Wealth
Ge is respnsible r Perpetual’s Private Wealth business,which prvides nancial advisry services and slutins. Ge
jined Perpetual in August 2010 as Grup Executive, Private
Wealth. He is a member the Perpetual Fundatin Cmmittee
Management.
Prir t jining Perpetual Ge was General Manager, Advice
and Private Banking at BT Financial Grup, llwing the merger
with St Gerge’s wealth management business. Prir t this,
he was Grup Executive St Gerge’s wealth management
business, r which he held a number rles, including CEo
Asgard Wealth Slutins and the nancial planning, private
banking and platrm businesses St Gerge. Ge previusly
held many senir rles at BT Financial Grup, including Chie Legal Cunsel and Head the Custmer and Business Services
Divisin. Early in his career Ge wrked at the Australian
Securities Cmmissin.

8/2/2019 2010 Perpetual Annual Report
http://slidepdf.com/reader/full/2010-perpetual-annual-report 19/152PERPETUAL LIMITED AND ITS CoNTRoLLED ENTITIES | 17
Michael Miller, CA, BCom
Group Executive, Superannuation and Operations
Michael is respnsible r Perpetual Investments peratins,
inrmatin technlgy and und accunting, and the business
cmprising ur investment platrm, structured prducts and
smartsuper service r sel managed super unds. He was
appinted a Grup Executive in January 2010.
Michael is a directr Perpetual Investment Management
Limited and Perpetual Superannuatin Limited, and is a member
the Superannuatin Investment Cmmittee. He jined
Perpetual in 2001 and previusly held the psitins Chie
Financial ocer r Perpetual Investments asset management
businesses and Deputy Chie Financial ocer Perpetual
Limited, as well as Head External Reprting, Grup Strategy
Manager and Head Internal Reprting.
Prir t jining Perpetual, Michael wrked with Delitte in
Brisbane, Lndn and Sydney.
Janine Stewart
Group Executive, People and Culture
Janine is respnsible r verall Peple and Culture plicy and
practices including talent and successin planning, remuneratin,
diversity, recruitment and ccupatinal health and saety.
She was appinted Grup Executive, Peple and Culture in
September 2008.
Janine jined Perpetual in 2007, initially respnsible r
remuneratin, benets and emplyee relatins. She is chairman
Perpetual’s Wrkplace Giving Cmmittee.
Janine has ver 20 years experience in custmer service strategy
and design, emplyee relatins, peple and leadership, and
cultural change, primarily in the aviatin industry.
Centre: David Deverall, CEo and Managing Directr. Grup
Executives, clckwise rm tp let: Richard Brandweiner,
Chris Green, Cathy Dyle, Michael Miller, Rger Burrws,
Janine Stewart, Ivan Hlyman, Ge Llyd.

8/2/2019 2010 Perpetual Annual Report
http://slidepdf.com/reader/full/2010-perpetual-annual-report 20/152

8/2/2019 2010 Perpetual Annual Report
http://slidepdf.com/reader/full/2010-perpetual-annual-report 21/152
Contents o the Directors’ Report Page no.
di ..................................................................................................................................20
a i .............................................................................................................22
cp i.......................................................................................................22
di’ i ............................................................................................................ 22
Piip iii............................................................................................................... 23
riw pi........................................................................................................23
dii .................................................................................................................................23
s i .....................................................................................................................24
e pi ....................................................................24
li p .........................................................................................................24
ei i ................................................................................................24
Iiii i i.............................................................24
I .................................................................................................................................24
cp rpiii s .....................................................................25
ri rp .......................................................................................................34
Glssary ................................................................................................................................. 34
Remuneratin utcmes r 2010 ........................................................................................... 35
Changes t the executive remuneratin ramewrk t apply rm 1 July 2010 ........................ 35
The rle the Peple and Remuneratin Cmmittee ..............................................................37
overview remuneratin r 2010 ......................................................................................... 38
– Managing Directr and Grup Executives ............................................................................ 38
– Nn-executive Directrs ....................................................................................................... 39
– Asset manager remuneratin arrangements ........................................................................ 40
Shrt-term incentives .............................................................................................................. 40
– Hw STI is unded ................................................................................................................ 40
– Allcatin the PPP ............................................................................................................ 40
– Delivery STI ...................................................................................................................... 40Lng-term incentives............................................................................................................... 40
– Executive share prgram and executive ptins prgram .................................................... 40
– Emplyee share plans ...........................................................................................................42
Summary cmpany perrmance ....................................................................................... 44
– Prt participatin pl payments r 2010 .......................................................................... 44
– Unvested LTI issued t key management persnnel (KMP) .................................................. 44
Key management persnnel ...................................................................................................45
Appendices .............................................................................................................................46
ci ei oi’ ci ii
oi’ di .........................................................................................................60
n-i i ............................................................................................................60ri ...........................................................................................................................60
l i’ ip i ...........................................................60
directors’ reportor the year ended 30 June 2010
PERPETUAL LIMITED AND ITS CoNTRoLLED ENTITIES | 19
8/2/2019 2010 Perpetual Annual Report
http://slidepdf.com/reader/full/2010-perpetual-annual-report 22/15220 | PERPETUAL LIMITED AND ITS CoNTRoLLED ENTITIES
The directors present their report together with the consolidated fnancial report o Perpetual Limited, (‘Perpetual’ or the ‘Company’)
and its controlled entities (the ‘consolidated entity’), or the year ended 30 June 2010 and the auditor’s report thereon.
Directors The directrs the Cmpany at any time during r since the end
the nancial year are:
Robert M Savage AM, Chairman and Independent Director
FASCPAS, FAICD, FAIM (Age 68)
Appinted as a Directr in 2001 and as Chairman in octber
2005. Mr Savage will retire as Chairman at the cnclusin
the Annual General Meeting n 26 octber 2010. He was
rmerly Chairman and Managing Directr IBM Australia and
New Zealand. He is Chairman David Jnes Limited and a
directr Fairax Media Limited. He is a member Perpetual’s
Nminatins Cmmittee and a member the Peple and
Remuneratin Cmmittee.
Mr Savage brings t the Perpetual Bard his experience as asenir executive in Australia and the Asian regin, including
experience in peple management and rganisatin eectiveness
issues and several years as a nn-executive directr and
chairman acrss a wide range Australian cmpanies.
Listed cmpany directrships held during the past three
nancial years:
▪ David Jnes Limited rm octber 1999 (current)
▪ Smrgn Steel Grup Limited rm April 2000 t August 2007
▪ Mincm Limited (Chairman) rm May 2002 t May 2007
▪ Fairax Media Limited rm June 2007 (current).
Paul V Brasher, Independent Director
BEc (Hons), FCA (Age 60)
Appinted as a Directr in Nvember 2009. Mr Brasher
was rmerly Chairman the Glbal Bard
PricewaterhuseCpers Internatinal. He previusly chaired
the Bard PricewaterhuseCpers’ Australian rm and held
a number ther senir management and client services rles
during his career with the rm. Mr Brasher was Client Service
Partner and/r Lead Engagement Partner r sme the rm’s
mst signicant clients. He als spent signicant perids wrking
with PricewaterhuseCpers in the US and UK.
Mr Brasher is currently Chairman the Reach Fundatin,
a Bard member the Victrian Arts Centre Trust and Hnrary
Treasurer Visin Australia’s i-access prject. He is a member
Perpetual’s Audit Risk and Cmpliance Cmmittee and Peple
and Remuneratin Cmmittee.
Mr Brasher brings t the Bard his lcal and glbal experience
as a senir executive and directr, particularly in the areas
strategy, audit and risk management, and public cmpany
gvernance.
Meredith J Brooks, Independent Director
BA, FIAA (Age 48) Appinted as a Directr in Nvember 2004. She was rmerly
Managing Directr, US Institutinal Investment Services r Frank
Russell Cmpany based in New Yrk. Prir t that she held the
psitin Managing Directr Frank Russell Australasia r
ve years and was previusly Directr, Eurpean Funds based
in Lndn. Ms Brks is Chair Synergy & Taikoz Limited and
has been appinted t the industry advisry bard Macquarie
University Faculty Business and Ecnmics. She is a member
Perpetual’s Audit Risk and Cmpliance Cmmittee and
Investment Cmmittee.
Ms Brks brings t the Bard ver 20 years senir unds
management experience, bth in Australia and internatinally.
Philip Bullock, Independent Director
BA Maths, MBA, Dip Ed (Age 57)
Appinted as a Directr in June 2010. Mr Bullck was rmerly
Vice President, Systems and Technlgy Grup, IBM Asia
Pacic, Shanghai, China. Prir t that he was CEo and Managing
Directr IBM Australia and New Zealand in a career spanning
almst 30 years in the Asia Pacic regin. Mr Bullck is a directr
CSG Limited and Healthscpe Limited. He als prvides
advice t the Federal Gvernment thrugh his rle as Chair
Skills Australia, as a member the Educatin Investment Fund
and as a member the recently cncluded Natinal Resurces
Sectr Emplyment Taskrce. He is a member Perpetual’s Investment Cmmittee and Peple and
Remuneratin Cmmittee.
Mr Bullck brings t the Bard his brad management
experience in Australia and Asia in technlgy, sales and
client management, prduct and brand management, industry
slutins and equity jint ventures.
Listed cmpany directrships held during the past three
nancial years:
▪ Healthscpe Limited rm September 2007 (current)
▪
CSG Limited rm August 2009 (current).
E Paul McClintock AO, Independent Director
BA, LLB (Age 61)
Appinted as a Directr in April 2004. He is Chairman
Thales Australia, Medibank Private Limited and the CoAG
Rerm Cuncil, and has served as Secretary t Cabinet and
Head the Cabinet Plicy Unit in the Australian Gvernment.
He is Chairman Perpetual’s Investment Cmmittee and
a member the Nminatins Cmmittee and Peple and
Remuneratin Cmmittee.
Mr McClintck brings t the Bard ver 30 years experience as
a legal adviser, investment banker and senir plicy adviser t
Gvernment and crpratins.

8/2/2019 2010 Perpetual Annual Report
http://slidepdf.com/reader/full/2010-perpetual-annual-report 23/152PERPETUAL LIMITED AND ITS CoNTRoLLED ENTITIES | 21
Listed cmpany directrships held during the past three
nancial years:
▪ Symbin Health Limited (Chairman) rm June 2005
t February 2008
▪ Intll Management Limited (rmerly Macquarie Inrastructure
Investment Management Limited) rm May 2003 (current).
Elizabeth M Proust AO, Independent Director
BA (Hons), LLB, FAICD (Age 59)
Appinted as a Directr in January 2006. She was rmerly
Managing Directr Esanda, part the ANZ Grup. Prir
t jining ANZ, she was Secretary (CEo) the Victrian
Department the Premier and Cabinet and Chie Executive
ocer the City Melburne. She is currently Chairman
Nestlé Australia Ltd, a directr Sptless Grup Limited,
Insurance Manuacturers Australia Pty Ltd and Sinclair Knight
Merz Pty Ltd. She is Chairman Perpetual’s Peple and
Remuneratin Cmmittee and a member Perpetual’s Audit
Risk and Cmpliance Cmmittee and Nminatins Cmmittee.
In additin t her skills rm her leadership rles in signicant
change management prgrams, Ms Prust brings t the
Bard her strengths in human resurces, public aairs and
strategy develpment, and her strng knwledge bard
prcesses and gvernance gained thrugh her many senir
executive and bard rles.
Listed cmpany directrships held during the past three
nancial years:
▪ Sptless Grup Limited rm June 2008 (current).
Peter B Scott, Independent Director
BE (Hons), MEngSc (Age 56)
Appinted as a Directr in July 2005. Mr Sctt was appinted as
Chairman-elect n 23 July 2010, t succeed Rbert Savage AM,
wh will be retiring at the cnclusin the Annual General
Meeting n 26 octber 2010. He was rmerly the Chie
Executive ocer MLC, an Executive General Manager
Natinal Australia Bank, and held a number senir psitins
with Lend Lease. He is Chairman Sinclair Knight Merz Pty
Limited and a directr Stckland Crpratin Limited.
Mr Sctt is an advisry bard member Piltlight Australia
and an advisry panel member Laing o’Rurke Australia.
He is Chairman the Nminatins Cmmittee and a member
Perpetual’s Investment Cmmittee and Peple and
Remuneratin Cmmittee.
Mr Sctt has mre than 20 years senir business experience in
publicly listed cmpanies and extensive knwledge the wealth
management industry.
Listed cmpany directrships held during the past three
nancial years:
▪ Stckland Crpratin Limited rm August 2005 (current).
Philip J Twyman, Independent Director
BSc, MBA, FAICD (Age 66) Appinted as a Directr in Nvember 2004. He was rmerly
Grup Executive Directr Lndn-based Aviva plc, ne
the wrld’s largest insurance grups, with extensive und
management and wealth management businesses. Mr Twyman
was als rmerly Chairman Mrley Fund Management, a
directr the Quilter Grup, a UK private client stckbrker,
and a senir executive AMP in Australia. He has als been
Chie Financial ocer General Accident plc, Aviva plc and
the AMP Grup. Since returning t Australia, Mr Twyman has
jined the bard IAG Limited, Medibank Private Limited and
the lcal bards the Swiss Re Grup. He is als Chairman
ANZ Lenders Mrtgage Insurance Pty Ltd and overseas
Cuncil Australia. He is Chairman Perpetual’s Audit Riskand Cmpliance Cmmittee and a member the Investment
Cmmittee and Nminatins Cmmittee.
As an experienced internatinal executive and directr,
Mr Twyman brings t the Perpetual Bard his backgrund in
nancial services, investment and wealth management, tgether
with cnsiderable practical experience in relatin t the audit and
risk management issues aced by public cmpanies in Australia
and verseas.
Listed cmpany directrships held during the past three
nancial years:
▪ IAG Limited rm July 2008 (current).
David M Deverall, Managing Director
BE (Hons), MBA (Stanord) (Age 44)
Appinted Managing Directr in September 2003. Mr Deverall
gave ntice his resignatin n 23 June 2010 and will stay
until the new CEo has been appinted r until 31 March 2011,
whichever ccurs rst. Prir t his appintment as Managing
Directr and CEo Perpetual, Mr Deverall held senir
management psitins at Macquarie Bank Limited r seven
years, including Grup Head the Funds Management Grup
and Head Strategy and Planning. He was previusly a strategy
cnsultant with Bain and Cmpany and The LEK Partnership.
Mr Deverall is Chair the Financial Services Cuncil and amember the Executive Cuncil the Faculty Business at
the University Technlgy Sydney.
Mr Deverall brings t Perpetual a cmbinatin strategic ability
and cmmercial drive and skills in prduct innvatin, and
experience in management acrss a brad range investment
prducts and services. He als pssesses an extensive verall
understanding the wealth management and wider nancial
services industry.

8/2/2019 2010 Perpetual Annual Report
http://slidepdf.com/reader/full/2010-perpetual-annual-report 24/15222 | PERPETUAL LIMITED AND ITS CoNTRoLLED ENTITIES
Alternate directorsRoger L Burrows, Alternate Director
BCom, CPA, MAICD (Age 46) Alternate Directr r Mr Savage rm December 2008. He jined
Perpetual as Chie Financial ocer in March 2008. Mr Burrws
has ver 25 years experience as a senir nance executive in a
diverse range industries, including prperty, nancial services,
IT services, pressinal services and manuacturing. Prir t
wrking at Perpetual, Mr Burrws was with Lend Lease r
20 years, including three years as Grup Chie Financial ocer.
Ivan D Holyman, Alternate Director
BEc, LLB (Age 54)
Alternate Directr r Mr Deverall rm May 2006. He jined
Perpetual in June 2004 as Chie Risk ocer. Prir t jining
Perpetual he held the psitin Chie operating ocer AsiaPacic r UBS Warburg and spent 19 years with UBS AG (and
its predecessr rganisatins) in varius psitins. Prir t UBS
AG he spent tw years with Samuel Mntagu & C Limited
(a UK merchant bank) and ur years with Blake Dawsn
Waldrn, Slicitrs in Melburne.
Company secretariesJoanne Hawkins, Company Secretary
BCom, LLB, Grad Dip CSP, FCIS Appinted Cmpany Secretary in June 2003. Prir t this,
Ms Hawkins was Assistant Cmpany Secretary Macquarie
Bank and ord Minnett and was Cmpany Secretary, Natinal
Bank the Slmn Islands. Ms Hawkins has als wrked as
a slicitr and legal adviser in New Zealand. Ms Hawkins is als
head Perpetual’s legal team.
Glenda Charles, Deputy Company Secretary
Grad Dip Corp Gov ASX Listed Entities, CSA (Cert)
Jined Perpetual in August 1994. She was appinted Assistant
Cmpany Secretary Perpetual in 1999 and Deputy Cmpany
Secretary in 2009. Ms Charles has ver 15 years experience in
cmpany secretarial practice and administratin and has wrkedin the nancial services industry r ver 25 years.
Directors’ meetings The number directrs’ meetings that directrs were eligible t attend (including meetings bard cmmittees) and the number
meetings attended by each directr during the nancial year t 30 June 2010 were:
Director Board Audit Risk and ComplianceCommittee
InvestmentCommittee
Nominat ions Committee People & RemunerationCommittee
Eligible toattend
AttendedEligible to
attend Attended
Eligible toattend
AttendedEligible to
attend Attended
Eligible toattend
Attended
R M Savage¹ 11 11 3 2 - - 2 2 6 6
P Brasher² 6 6 4 4 - - - - 3 3
M J Brooks 11 11 7 7 7 7 - - - -
P Bullock³ 1 1 - - - - - - - -
E P McClintock 11 11 - - 7 7 2 2 6 6
E M Proust 11 11 7 7 - - 2 2 6 6
P B Scott4 11 10 - - 7 7 - - 6 6
P J Twyman 11 11 7 7 7 7 2 2 - -
D M Deverall5 11 11 - - - - - - - -
1 Rbert Savage retired rm the Audit Risk and Cmpliance Cmmittee n 17 Nvember 2009 and retired as Chairman the Nminatins Cmmittee n23 July 2010, but remains as a member that Cmmittee until his retirement rm the Bard n 26 octber 2010.
2 Paul Brasher was appinted t the Bard n 1 Nvember 2009, the Audit Risk and Cmpliance Cmmittee n 17 Nvember 2009 and the Peple andRemuneratin Cmmittee n 16 February 2010.
3 Philip Bullck was appinted t the Bard n 1 June 2010 and t the Investment Cmmittee and Peple and Remuneratin Cmmittee n 9 August 2010.
4 Peter Sctt became Chairman-elect and Chairman the Nminatins Cmmittee n 23 July 2010.
5 Mr Deverall gave ntice his resignatin n 23 June 2010 and will stay until the new CEo has been appinted r until 31 March 2011, whichever ccurs rst.

8/2/2019 2010 Perpetual Annual Report
http://slidepdf.com/reader/full/2010-perpetual-annual-report 25/152PERPETUAL LIMITED AND ITS CoNTRoLLED ENTITIES | 23
Principal activities The principal activities the cnslidated entity during the
nancial year were unds management, prtli management,nancial planning, trustee, respnsible entity and cmpliance
services, executr services, investment administratin and
custdy services and mrtgage prcessing services.
Review o operations A review peratins is included in the Management’s
Discussin and Analysis Financial Cnditin and Results operatins (MD&A) sectin the Annual Reprt.
Fr the nancial year t 30 June 2010, Perpetual reprted a prt
ater tax $90.5 millin cmpared t the prt ater tax r the
nancial year t 30 June 2009 $37.8 millin.
The recnciliatin net prt ater tax t underlying prt ater tax r the 2010 nancial year is as llws:
Reconciliation o underlying proit ater tax 30 June 2010
$’000
30 June 2009
$’000
Net proit ater tax attributable to equity holders o Perpetual Limited 90,506 37,749
Add/(less): Prit/(lss) ater tax attributable t minrity interests1 216 (58)
Net proit ater tax 90,722 37,691
Add: Lss n sale investments (ater tax) 2,388 6,081
Add: Restructuring csts (ater tax) - 8,115
(Less)/add: Exact Market Cash Fund (gains)/lsses (ater tax) (20,317) 13,810
Underlying proit ater tax 72,793 65,697
1 Prt/(lss) ater tax attributable t minrity interests arising rm the sale underlying investments within a seed und.
Dividends
Dividends paid r prvided by the Cmpany t members since the end the previus nancial year were:
Centsper share
Total amount$’000
Franked # /unrankedDate o
payment
Declared and paid during the inancial year 2010
Final 2009 rdinary 60 25,506 Franked 30 Sep 2009
Interim 2010 rdinary 105 45,398 Franked 1 Apr 2010
Total 70,904
Declared ater end o year
Ater balance sheet date, the directrs declared the llwing dividend:
Final 2010 rdinary 105 45,588 Franked 28 Sep 2010
Total 45,588
# All ranked dividends declared r paid during the year were ranked at a tax rate 30 per cent and paid ut retained earnings.
The nancial eect dividends declared ater year end are nt refected in the 30 June 2010 nancial statements and will be recgnised
in subsequent nancial reprts.
8/2/2019 2010 Perpetual Annual Report
http://slidepdf.com/reader/full/2010-perpetual-annual-report 26/15224 | PERPETUAL LIMITED AND ITS CoNTRoLLED ENTITIES
State o aairsSignicant changes in the state aairs the cnslidated
entity during the nancial year were as llws:
▪ The cnslidated entity’s net prt bere tax increased by
$29.0 millin as a result its guarantee the benchmark
return t Exact Market Cash Fund 1 investrs.
▪ The cnslidated entity acquired Grsvenr Financial
Services Pty Ltd and Frdham Business Advisrs Pty Ltd r
cnsideratin ttalling $54.9 millin.
Events subsequent to reporting date The Directrs are nt aware any event r circumstance since
the end the nancial year nt therwise dealt with in this reprt
that has aected, r may signicantly aect, the peratins thecnslidated entity, the results thse peratins r the state
aairs the cnslidated entity in subsequent nancial years.
Events subsequent t balance sheet date are set ut in Nte 37
t the cnslidated Financial Statements.
Likely developmentsFurther inrmatin abut likely develpments in the peratins
the cnslidated entity and the expected results thse
peratins in uture nancial years has nt been included in this
reprt because disclsure the inrmatin wuld be likely t
result in unreasnable prejudice t the cnslidated entity.
Environmental regulation The cnslidated entity acts as trustee r custdian r a
number prperty trusts, which have signicant develpments
thrughut Australia. These duciary peratins are subject
t envirnmental regulatins under bth Cmmnwealth and
State legislatin in relatin t prperty develpments. Apprvals
r cmmercial prperty develpments are required by state
planning authrities and envirnmental prtectin agencies.
The licence requirements relate t air, nise, water and waste
dispsal. The respnsible entity r manager each these
prperty trusts is respnsible r cmpliance and reprting under
the gvernment legislatin.
The cnslidated entity is nt aware any material
nn-cmpliance in relatin t these licence requirements
during the nancial year.
The cnslidated entity has determined that it is nt required t
register t reprt under the National Greenhouse and Energy
Reporting Act 2007, which is Cmmnwealth envirnmental
legislatin that impses reprting bligatins n entities that
reach reprting threshlds during the nancial year.
Indemnifcation o directors and
ofcers The Cmpany and its cntrlled entities have reslved t
indemniy the current directrs and cers the cmpanies
against all liabilities t anther persn (ther than the cmpany
r a related bdy crprate) that may arise rm their psitin
as directrs the cnslidated entity, except where the liabilities
arise ut cnduct invlving a lack gd aith. The reslutin
stipulates that the Cmpany and its cntrlled entities will
meet the ull amunt any such liabilities, including csts
and expenses.
InsuranceIn accrdance with the prvisins the Corporations Act 2001
the Cmpany has a directrs and cers’ liability plicy, whichcvers all directrs and cers the cnslidated entity. The
terms the plicy specically prhibit disclsure details the
amunt the insurance cver and the premium paid.

8/2/2019 2010 Perpetual Annual Report
http://slidepdf.com/reader/full/2010-perpetual-annual-report 27/152PERPETUAL LIMITED AND ITS CoNTRoLLED ENTITIES | 25
Corporate Responsibility
StatementPerpetual’s Bard and management have a lng-standing
cmmitment t gd crprate gvernance. The success
Perpetual’s cre businesses – the management ther peple’s
mney and the saekeeping assets and securities – relies n
a reputatin abslute trustwrthiness. This statement sets ut
ur apprach t crprate gvernance. Cpies r summaries
dcuments that are underlined like this in this Crprate
Gvernance Statement are available n ur website at
www.perpetual.cm.au
ASX Corporate Governance Council’s
Corporate Governance Principles and
Recommendations At Perpetual, gd crprate gvernance includes a genuine
cmmitment t the ASX Crprate Gvernance Cuncil’s
Principles and Recmmendatins (ASX Principles). This includes
recent amendments t the ASX Principles that will nt cme int
eect r Perpetual until the nancial year ending 30 June 2012,
which we have apprached with a view t implementing their
substance as early as pssible.
The Bard cnsiders that it cmplies with all the ASX Principles,
and has dne s thrughut the reprting perid.
Principle/Recommendation Relevantsection(s)
Comply?
Principle 1 – Lay solid oundations or management and oversight
1.1 Establish and disclse the unctins reserved t the bard and thse delegated t management. 1 Yes
1.2 Disclse the prcess r evaluating the perrmance senir executives. 1 Yes
1.3 Prvide the inrmatin indicated in the guide t reprting n Principle 1. * Yes
Principle 2 – Structure the board to add value
2.1 A majrity the bard shuld be independent directrs. 3 Yes
2.2 The chair shuld be an independent directr. 3 Yes
2.3 The rles chair and managing directr shuld nt be exercised by the same individual. 2 Yes
2.4 The bard shuld establish a nminatin cmmittee. 9 Yes
2.5 Disclse the prcess r evaluating the perrmance the bard, its cmmittees and individual directrs. 10 Yes
2.6 Prvide the inrmatin indicated in the guide t reprting n Principle 2. * Yes
Principle 3 – Promote ethical and responsible decision-making
3.1 Establish and disclse a cde cnduct utlining:
▪ the practices necessary t maintain cnidence in the cmpany’s integrity
▪ the practices necessary t take int accunt legal bligatins and the reasnable expectatins stakehlders
▪ the respnsibility and accuntability individuals r reprting and investigating reprts unethical practices.
13 Yes
3.2 Establish and disclse the plicy cncerning trading in cmpany securities by directrs, senir managementand emplyees.
14 Yes
3.3 Prvide the inrmatin indicated in the guide t reprting n Principle 3. * Yes
Principle 4 – Saeguard integrity in inancial reporting
4.1 Establish an audit cmmittee. 9 Yes
4.2 Structure the audit cmmittee s that it:
▪ cnsists nly nn-executive directrs;
▪ cnsists a majrity independent directrs;
▪ is chaired by an independent chair, wh is nt the chair the bard; and
▪ has at least three members.
9 Yes
4.3 The audit cmmittee shuld have a rmal charter. 9 Yes
4.4 Prvide the inrmatin indicated in the guide t reprting n Principle 4. * Yes
Principle 5 – Make timely and balanced disclosure
5.1 Establish and disclse written plicies designed t ensure cmpliance with ASX Listing Rule disclsurerequirements and t ensure accuntability at a senir management level r that cmpliance.
19 Yes
5.2 Prvide the inrmatin indicated in the guide t reprting n Principle 5. * Yes
Principle 6 – Respect the rights o shareholders6.1 Design and disclse a cmmunicatins strategy t prmte eective cmmunicatin with sharehlders and
encurage eective participatin at general meetings.20 Yes
6.2 Prvide the inrmatin indicated in the guide t reprting n Principle 6. * Yes

8/2/2019 2010 Perpetual Annual Report
http://slidepdf.com/reader/full/2010-perpetual-annual-report 28/15226 | PERPETUAL LIMITED AND ITS CoNTRoLLED ENTITIES
Principle/Recommendation Relevantsection(s)
Comply?
Principle 7 – Recognise and manage risk
7.1 Establish and disclse plicies r the versight and management material business risks. 15 Yes
7.2 Require management t design and implement the risk management and internal cntrl system t manage thecmpany’s material business risks and reprt t the bard n whether thse risks are being managed eectively.
The bard shuld disclse whether management has reprted t it n the management thse risks.
15, 16 Yes
7.3 Disclse whether the bard has received assurance rm the managing directr and the chie inancial icer thatthe declaratin prvided under s295A the Act is unded n a sund system risk management and internalcntrl that is perating eectively in all material respects in relatin t inancial reprting risks.
16 Yes
7.4 Prvide the inrmatin indicated in the guide t reprting n Principle 7. * Yes
Principle 8 – Remunerate airly and responsibly
8.1 The bard shuld establish a remuneratin cmmittee. 9 Yes
8.2 Distinguish the structure nn-executive directrs’ remuneratin rm that executive directrs and senirmanagement.
211 Yes
8.3 Prvide the inrmatin indicated in the guide t reprting n Principle 8. * Yes
* The whle this Crprate Respnsibility Statement cvers n the requirements t include inrmatin indicated in the ‘guide t reprting’ sectins the ASX Principles.
1 Full details the remuneratin plicies and structures Perpetual Limited and its cntrlled entities (Perpetual Grup) are set ut in the Remuneratin Reprtsectin the Directrs’ Reprt n pages 34 t 59 this Reprt.
1. Role o the Board
The Bard has its wn Bard Charter, which sets ut the
unctins and respnsibilities reserved t the Bard and
delegatins made t management. The Bard delegates day
t day respnsibility r the management and peratin the
cmpany t the Managing Directr but remains respnsible r
verseeing management’s perrmance.
The Bard’s specic respnsibilities include:
▪ reviewing and apprving Perpetual’s strategy
▪ selecting the Managing Directr and apprving the
appintment and remval Grup Executives
▪ setting the remuneratin the Managing Directr
▪ setting the nn-executive directr remuneratin within
sharehlder apprved limits
▪ setting Perpetual’s values and standards
▪ mnitring business perrmance and the Perpetual Grup’s
nancial psitin
▪ verseeing the integrity the Perpetual Grup’s nancial
accunts and reprting
▪ mnitring the Perpetual Grup’s investment activities and
investment perrmance
▪ mnitring that signicant business risks are identied and
managed eectively
▪ ensuring that the perrmance the Bard, Managing Directr
and senir management are regularly assessed.
The Bard Charter is reviewed annually t ensure the balance
respnsibilities remains apprpriate t Perpetual.
The rles and respnsibilities Perpetual’s Bard and
management are established in accrdance with ASX Principle 1.
Each year, the Bard’s Peple and Remuneratin Cmmittee
versees the perrmance review prcess r the Managing
Directr and Grup Executives. The Grup Executives reprt
directly t the Managing Directr.
The Managing Directr’s perrmance bjectives are set by the
Bard at the beginning each nancial year.
At the end the nancial year, the Chairman the Bard
reviews the Managing Directr’s perrmance against his/her
gals with input rm all Bard members.
The Managing Directr sets perrmance bjectives r
each Grup Executive at the beginning each nancial year.
The Bard’s Peple and Remuneratin Cmmittee reviews
the perrmance bjectives set r the Grup Executives.
The Managing Directr carries ut the perrmance review
each Grup Executive against their bjectives with inputrm apprpriate stakehlders, including Bard members.
In 2010, perrmance reviews were cnducted in accrdance
with this prcess.
Grup Executives wh are new t Perpetual participate in
Perpetual’s rientatin prgram and an additinal inductin
prcess tailred t their wn respnsibilities. Perpetual has an
rientatin prgram r all new emplyees cvering Perpetual’s
histry, business strategy, values, risk and cmpliance bligatins
and perrmance management.
2. Board structure
The Bard currently cmprises nine directrs: eight nn-executive directrs and the Managing Directr. The rles
Chairman and Managing Directr are separate.
The Chairman is respnsible r leadership the Bard and
ensuring the Bard perrms its rle and unctins.

8/2/2019 2010 Perpetual Annual Report
http://slidepdf.com/reader/full/2010-perpetual-annual-report 29/152PERPETUAL LIMITED AND ITS CoNTRoLLED ENTITIES | 27
He is als respnsible r acilitating the eective cntributin
directrs by ensuring that each directr ully participates in the
Bard’s activities.
Details the backgrund, experience, pressinal skills and
perid in ce each directr are set ut n pages 20 t 22
the Directrs’ Reprt.
The structure the Bard accrds with ASX Principle 2.
3. Director independence
The Bard cnsiders all nn-executive directrs t be
independent directrs, including the Chairman.
In assessing the independence each directr, the Bard
cnsiders, n a directr-by-directr basis, whether he r she has
any relatinships that wuld materially aect the directr’s abilityt exercise unettered and independent judgment in the interests
Perpetual’s sharehlders. Cnsistent with the emphasis n
‘substance ver rm’ advcated by the ASX Principles, Perpetual
takes a qualitative apprach t materiality rather than setting
strict quantitative threshlds, and cnsiders each directr’s
individual circumstances n its merits.
The independence each directr is rmally reviewed each
May and at any time when a change ccurs that may aect a
directr’s independence. Nn-executive directrs als rmally
advise the Chairman any relevant inrmatin, and update the
Chairman i their circumstances change at any time.
In determining the psitin individual directrs, the Bard
has cnsidered the relevant elements the denitin
independence adpted by the Bard. These elements include
whether the directr:
▪ has a substantial sharehlding in Perpetual r is an cer
a cmpany that has a substantial sharehlding in Perpetual
(r is therwise assciated with a substantial sharehlder
Perpetual)
▪ has been emplyed by the Perpetual Grup at any stage and
in any capacity within the previus three years
▪
has been invlved with the Perpetual Grup in a materialadvising r cnsulting rle at any time within the previus
three years
▪ is (r is assciated with) a material supplier r custmer
the Perpetual Grup
▪ is in a material cntractual relatinship with the Perpetual
Grup (ther than as a directr).
Until March 2010, Paul McClintck was a directr Macquarie
Inrastructure Investment Management Limited (nw Intll
Management Limited), a cmpany that perated in the nancial
services sectr and whse businesses may, in part, cmpete
with Perpetual.
In cnsidering whether such circumstances materially aect
the independence individual directrs, the Bard cnsiders
the extent cmpetitin relative t each rganisatin’s ttal
business, and the requency with which directrs may be
required t absent themselves rm Bard deliberatins
by reasn cnficts interest.
In the case Paul McClintck, the Bard cnsidered that in hispsitin as a directr Perpetual, he is suciently remved rm
Perpetual’s peratins s as t make the likelihd any actual
r perceived cnfict interest between his Perpetual and his
utside rle minimal.
During the year, Meredith Brks prvided advisry and
cnsulting services t Perpetual’s Glbal Equities business r
a xed perid six mnths. Ms Brks tk n the shrt-term
rle in rder t prvide strategic supprt t the Glbal Equities
business during the critical perid leading up t and llwing the
departure Emili Gnzalez. Ms Brks did nt have a ‘hands
n’ management rle and was at n time an ‘emplyee’
Perpetual.
The Bard cnsidered that the prvisin the services did
nt aect Ms Brks’ independent status. In arriving at this
cnclusin the Bard had regard t the ‘ne ’ transitinal
nature the cnsultancy. In particular, the Bard tk accunt
the act that the rle was established with a nite timerame
and r a specic nn-recurring purpse.
Paul Brasher receives superannuatin benets rm his rmer
emplyer, PricewaterhuseCpers (PwC). Frm time t time,
PwC prvides cnsulting services t Perpetual which are nt
cnsidered material in nature r quantity.
Frm time t time, unds managed by the Perpetual Grup maytake hldings, including substantial hldings in securities listed
entities. Perpetual directrs may als serve as nn-executive
directrs n the bards these entities. This actr alne is nt
cnsidered t impact directr independence as decisins as t
stck selectin are nt made by the Bard Perpetual but by
Perpetual’s asset management team in accrdance with client
r und investment mandates.
It is the Bard’s view that n directrs currently hld ther
psitins that materially aect their ability t exercise independent
judgement in the interests Perpetual sharehlders.
4. Contracts with directorsIn the 2010 nancial year, n directr disclsed a material
persnal interest in any cntract entered int by any member
the Perpetual Grup ther than the remuneratin paid t the
directrs as utlined in this Annual Reprt, Meredith Brks’
cnsultancy cntract and the deeds indemnity described belw.
5. Indemnity o directors and oicers
Perpetual has entered int deeds t indemniy directrs and
cers the Perpetual Grup, t the extent permissible by law,
rm all liabilities incurred as directrs r cers. Liabilities t the
Perpetual Grup, and liabilities that arise ut cnduct that was
nt in gd aith are nt cvered in the indemnities. In additin,Perpetual has directrs and cers’ insurance against claims
Perpetual may be liable t pay under these indemnities. This
plicy insures directrs and cers directly.
8/2/2019 2010 Perpetual Annual Report
http://slidepdf.com/reader/full/2010-perpetual-annual-report 30/15228 | PERPETUAL LIMITED AND ITS CoNTRoLLED ENTITIES
6. Board access to inormation and
independent advice
Directrs receive regular updates n changes in the regulatryenvirnment aecting Perpetual and the nancial services
industry. Directrs are als encuraged t attend relevant
cnerences and seminars.
Nn-executive directrs regularly cner withut management
present and the Chairman presides ver these sessins. All
directrs have unrestricted access t cmpany recrds and
inrmatin. Perpetual has a rmal plicy allwing the Bard r
an individual directr t seek independent pressinal advice
at the Perpetual Grup’s expense, prvided that the directr has
btained the prir apprval the Chairman, r i the relevant
directr is the Chairman, the prir apprval a majrity
Perpetual’s nn-executive directrs. In the 2010 nancial year,
n directr sught pressinal advice under this plicy.
7. Nomination, appointment, re-election and
retirement o directors
Cnsistent with ASX Principle 2, the Bard has a Nminatins
Cmmittee with its wn Terms Reerence.
The Nminatins Cmmittee is respnsible r reviewing the size
and structure the Bard. The aim is t ensure that the Bard
cmprises an apprpriate balance skills, diversity, experience
and independence in rder t enhance Bard perrmance and
maximise value r sharehlders. The Nminatins Cmmittee
is respnsible r administering Perpetual’s Plicy n the Appintment Directrs, which sets ut the selectin prcess
and selectin criteria r identiying candidates t ll bard
vacancies. Cnsistent with recent amendments t the ASX
Principles regarding disclsure bard selectin prcesses,
the Plicy is disclsed in ull n ur website. I a bard vacancy
arises, the Nminatins Cmmittee will cnduct a search in
accrdance with the Plicy and the Bard will appint the mst
suitable candidate, having regard t the recmmendatin the
Nminatins Cmmittee. External cnsultants may be engaged
t assist with the identicatin apprpriate candidates.
A directr appinted t ll a casual vacancy must stand r
electin at the next Annual General Meeting.
Upn appintment, new directrs receive a detailed letter
appintment and participate in a cmprehensive inductin
prgram designed t amiliarise them with Perpetual’s
business, strategy, peratins, Grup Executives and senir
management team.
Directrs wh have been in ce withut re-electin r
three years since their last appintment must retire and seek
re-electin at the cmpany’s Annual General Meeting. In rder t
revitalise the Bard, directrs agree nt t seek re-electin ater
three terms three years unless the Bard requests them t d
s. The nine year principle des nt displace sharehlders’ rights
t vte n the appintment and remval directrs, as set ut in
the ASX Listing Rules and the Corporations Act 2001.
8. Meetings o the Board
In the 2010 nancial year, the Bard met 11 times, including
a strategic planning sessin held ver tw days. The Bardreceives perrmance, peratins and risk reprts rm the
Managing Directr, the Chie Financial ocer, the Chie Risk
ocer and the heads each business divisin. The Bard als
receives reprts and updates n strategic issues.
In additin, directrs spend time reading and analysing bard
papers and reprts submitted by management and they engage
in regular inrmal discussins with management. The views
the Chairman and the nn-executive directrs are canvassed
regularly by the Managing Directr and the Grup Executives n
a range strategic and peratinal issues.
The Chie Financial ocer and Cmpany Secretary attend
all bard meetings. other Grup Executives and senirmanagement attend bard and cmmittee meetings t reprt n
particular issues and t engage in discussin n these issues.
Senir executive attendance at bard and cmmittee meetings is
subject t the verriding requirement that n senir executive will
be directly invlved in deciding their wn remuneratin.
Attendance directrs at bard and cmmittee meetings is set
ut in the Directrs’ Reprt n page 22.
9. Board committees
A key cmpnent the Bard’s gvernance structure are its
ur bard cmmittees. Each cmmittee has written Terms
Reerence.
Unless mre requent meetings are required, all cmmittees
except the Nminatins Cmmittee generally meet at least
quarterly. The Nminatins Cmmittee meets at least twice a
year. The Managing Directr attends all cmmittee meetings
except where matters relating t his wn remuneratin and
perrmance are discussed.
The qualicatins and skills the members each cmmittee
are set ut n pages 20 t 22 the Directrs’ Reprt.
The membership and key respnsibilities each the bard
cmmittees (as at the date this reprt) are set ut belw.
Audit Risk and Compliance Committee
Members: Philip Twyman (Chairman), Meredith Brks,
Elizabeth Prust and Paul Brasher
Changes t the cmmittee since last Reprt:
Rbert Savage retired Nvember 2009
Paul Brasher appinted Nvember 2009
The Cmmittee’s rle is t versee the Perpetual Grup’s
accunting plicies and practices, the integrity nancial
statements and reprts, the scpe, quality and independence
Perpetual’s external audit arrangements, the mnitring
the internal audit unctin, the eectiveness risk managementplicies and the adequacy insurance prgrams, and t
reprt n these matters t the Bard. This Cmmittee is
als respnsible r mnitring verall legal and regulatry
cmpliance.

8/2/2019 2010 Perpetual Annual Report
http://slidepdf.com/reader/full/2010-perpetual-annual-report 31/152PERPETUAL LIMITED AND ITS CoNTRoLLED ENTITIES | 29
All members the Cmmittee are independent nn-executive
directrs and are required t be nancially literate. At least ne
member must have accunting r nance related expertise.
Members are als required t have an understanding thenancial services industry in which Perpetual perates.
Investment Committee
Members: Paul McClintck (Chairman), Meredith Brks,
Philip Bullck, Peter Sctt and Philip Twyman
Changes t the cmmittee since last Reprt:
Philip Bullck appinted August 2010
The Cmmittee’s rle is t mnitr management t ensure
that it has in place, and carries ut, apprpriate investment
strategies and prcesses r the investment activities cnducted
bth r third parties and n the Grup’s wn behal. ThisCmmittee des nt select stcks r individual Perpetual
unds as stck selectin is carried ut by Perpetual’s asset
management team. All members the Cmmittee are
independent nn-executive directrs.
People and Remuneration Committee
Members: Elizabeth Prust (Chairman), Rbert Savage,
Peter Sctt, Paul McClintck, Paul Brasher and Philip Bullck
Changes t the cmmittee since last Reprt:
Paul Brasher appinted February 2010
Philip Bullck appinted August 2010
The Cmmittee’s rle is t mnitr the Perpetual Grup’s peple
and culture plicies and practices, including the diversity
Perpetual’s wrkrce, and t assist the Managing Directr t
implement air, eective and market cmpetitive remuneratin
and incentive prgrams designed t retain high calibre
emplyees and which demnstrate a clear relatinship between
perrmance and remuneratin. The Cmmittee is authrised
t directly engage external remuneratin advisers and ater
btaining their advice as and when apprpriate, the Cmmittee
recmmends remuneratin r nn-executive directrs, the
Managing Directr, the Grup Executives and ther senir
managers, t the Bard. The Cmmittee als reviews successin
and career plans r key executives.
All members the Cmmittee are independent nn-executive
directrs. New cmmittee cmpsitin requirements t prmte
greater independence are prpsed r intrductin int the
ASX Listing Rules. Perpetual’s Cmmittee already cmplies with
these requirements even thugh they have nt yet rmally cme
int eect.
Nominations Committee
Members: Peter Sctt (Chairman), Rbert Savage,
Paul McClintck, Elizabeth Prust and Philip Twyman
Changes t the cmmittee since last Reprt:
Peter Sctt appinted July 2010
The Cmmittee’s rle is t recmmend t the Bard nminees
r appintment/electin (including re-electin existing bard
members) and t review bard successin plans.
At least annually, the Cmmittee reviews the size and structure
the Bard t ensure that the Bard cmprises apprpriately
qualied and experienced peple. This Cmmittee is als
respnsible r the rmal evaluatin the Bard’s perrmanceas a whle. All members the Cmmittee are independent
nn-executive directrs.
10. Board perormance
The Bard undertakes nging sel-assessment and review
the perrmance the Bard, its cmmittees and individual
directrs annually. In 2010, the Bard undertk a review
bard and cmmittee perrmance with the assistance an
external cnsultant. The Chairman als reviewed with each
directr their individual perrmance and, ater btaining
eedback rm the ther directrs, a nminated directr reviewed
the Chairman’s perrmance. The bard review prcess aims tensure that individual directrs cntinue t cntribute eectively
t the Bard’s perrmance and that the Bard as a whle and its
cmmittees cntinue t unctin eectively.
11. Company secretaries
The Bard has access t the services and advice Janne
Hawkins, the Cmpany Secretary and Glenda Charles, Deputy
Cmpany Secretary. The Cmpany Secretary is accuntable t
the Bard n gvernance matters. Details the experience and
qualicatins Janne Hawkins and Glenda Charles are set ut
in the Directrs’ Reprt n page 22.
12. Perpetual’s subsidiary boards
The bards Perpetual’s subsidiaries are generally made
up executive directrs. The exceptins are Perpetual
Superannuatin Limited and Garnet Superannuatin Pty Limited,
which carry ut Perpetual’s superannuatin activities, and PI
Investment Management Limited, which perates Perpetual’s
glbal equities business. The bards these cmpanies include
nn-executive directrs. These nn-executive directrs are nt
directrs any ther Perpetual Grup cmpanies. Perpetual’s
crprate gvernance plicies are applied t its subsidiaries
but adapted t refect the size and nature each subsidiary’s
peratins and recgnise that the bards mst subsidiaries d
nt cmprise nn-executive directrs. The subsidiary bards are
a key cmpnent Perpetual’s Risk Management Framewrk.
13. Ethical conduct
Perpetual has a Cde Cnduct which draws rm and expands
n Perpetual’s values. The Cde Cnduct applies t all
directrs, executives and emplyees and is designed t assist
them in making ethical business decisins. It is based n the
llwing principles:
▪ acting with integrity
▪ managing cnficts interests apprpriately
▪ uphlding the spirit as well as the letter the law
▪ cmmitment t ur clients and cnsistently delivering
sharehlder value

8/2/2019 2010 Perpetual Annual Report
http://slidepdf.com/reader/full/2010-perpetual-annual-report 32/15230 | PERPETUAL LIMITED AND ITS CoNTRoLLED ENTITIES
▪ respecting privacy and cndentiality
▪ maintaining a air and sae wrk envirnment
▪ prtecting thse wh reprt wrngding.
Additinal plicies deal with a range ethical issues such as the
bligatin t maintain client cndentiality and prtect cmpany
inrmatin, the need t make ull and timely disclsure any
price sensitive inrmatin and t prvide a sae wrkplace
r emplyees, which is ree rm discriminatin. The Cde
Cnduct and assciated plicies are in keeping with ASX
Principle 3.
Perpetual’s Chie Risk ocer is Perpetual’s Cde Cnduct
mbudsman and is available t all sta r a cndential
discussin in relatin t Cde Cnduct matters. All new
Perpetual emplyees are required t amiliarise themselves
with the Cde Cnduct as part their inductin training
requirements.
Perpetual has a Whistleblwing Plicy t prtect emplyees
wh make gd aith reprts wrngding, prejudice r
disadvantage. As part Perpetual’s Whistleblwing Plicy, a
third party has been engaged t prvide an independent and
cndential htline r Perpetual emplyees wh preer t raise
their cncern with an external rganisatin.
14. Share dealings by directors and employees
Perpetual’s verriding plicy is that there shuld be n dealings
in the cmpany’s shares by any directr r emplyee wh is in
pssessin price sensitive inrmatin r where the dealing
is r shrt-term r speculative gain. Prvided they d nt
have price sensitive inrmatin, directrs and emplyees are
permitted t deal in the cmpany’s shares nly in ne mnth
perids cmmencing:
▪ 24 hurs ater annuncement the hal year and ull year
nancial results
▪ 24 hurs ater release the Chairman’s May Letter t
Sharehlders
▪
at the cnclusin the Annual General Meeting.
The Share Dealing Plicy requires prir apprval r any share
dealings rm the Chairman in the case directrs, rm
a nminated directr in the case the Chairman and rm
the Managing Directr in the case senir executives. Prir
apprval is als required rm the Managing Directr r Cmpany
Secretary in the case certain emplyees wh are mre likely t
have access t ptentially price sensitive inrmatin thrugh their
psitin in the cmpany.
Perpetual’s Share Dealing Plicy prhibits emplyees rm
entering int ‘hedging arrangements’ in relatin t Perpetual
securities. Perpetual emplyees cannt trade in nancial
prducts issued ver Perpetual securities by third parties r
trade in any assciated prducts that limit the ecnmic risk
hlding Perpetual securities. Perpetual emplyees and
directrs are prhibited rm margin lending in relatin t
Perpetual securities.
A vendr an entity, acquired by Perpetual during the
nancial year, has been permitted t cntinue a margin lan
ver Perpetual securities. The lan was entered int prir
t cmmencing emplyment with Perpetual. The Perpetualsecurities were part the cnsideratin r the acquisitin and
the vendr became an emplyee llwing the acquisitin.
Emplyees wh may have access t sensitive inrmatin in
relatin t Perpetual’s investment activities (such as the asset
management team) are required t btain prir apprval r
persnal trading in any securities.
Perpetual’s Share Dealing Plicy cvers the suggested cntents
in ASX Principle 3.2 r a plicy its type.
15. Risk management
The Bard is cmmitted t eective risk management and allGrup Executives are accuntable r managing risk within
their area respnsibility. They are als required t manage
risk as part their business bjectives, with risk management
integrated acrss business prcesses.
The Chie Risk ocer leads a grup risk management
pressinals, including lawyers, wh prvide the ramewrk,
tls, advice and assistance t enable management t eectively
identiy, assess and manage risk.
Cnsistent with ASX Principle 7, Perpetual’s Risk Management
Framewrk is designed t manage Perpetual’s material business
risks. one cmpnent the ramewrk includes Perpetual’splicies that are designed t address key areas risk including
strategic, nancial and cmpliance risk. Perpetual’s grup
plicies are utlined in Perpetual’s Risk Management Framewrk.
Thrugh mnitring, the Bard and its cmmittees are prvided
with assurance the eectiveness Perpetual’s management
its material business risks. In additin, the Bard reviews
Perpetual’s key risks semi-annually as part the Key Risk
Assessment prcess, urther detailed in Perpetual’s Risk
Management Framewrk.
Perpetual als has an internal audit unctin. The Head Internal
Audit reprts t the Audit Risk and Cmpliance Cmmittee as
well as t the Chie Risk ocer and is independent rm theexternal auditr. Internal audit prvides independent assurance
ver the eectiveness Perpetual’s risk management, internal
cntrl, and gvernance prcesses. The Internal Audit team d
nt make management decisins r engage in ther activities
that culd be perceived as cmprmising their independence.
Each the Chie Risk ocer, Chie Financial ocer and
the Head Internal Audit have the right t and d meet with
the Audit Risk and Cmpliance Cmmittee in the absence
ther management.
Tgether with the Managing Directr and Chie Financial ocer,
Perpetual’s Chie Risk ocer reprts t the Bard n theeectiveness Perpetual’s management its material business
risks in accrdance with ASX Principle 7. The Bard received this
reprt in 2010 tgether with the statements utlined in sectin 16
n the llwing page.

8/2/2019 2010 Perpetual Annual Report
http://slidepdf.com/reader/full/2010-perpetual-annual-report 33/152PERPETUAL LIMITED AND ITS CoNTRoLLED ENTITIES | 31
16. Financial reporting
The Bard has adpted plicies designed t ensure that
Perpetual’s nancial reprts:
▪ are true and air
▪ meet high standards disclsure and audit integrity
▪ when read with the Perpetual’s ther reprts t sharehlders,
prvide all material inrmatin necessary t understand
Perpetual’s nancial perrmance and psitin.
T underpin the integrity Perpetual’s nancial reprting and
risk management ramewrk, it is Perpetual’s practice r the
Managing Directr and Chie Financial ocer t reprt t the
Bard in writing that, in their respective pinins:
▪ the nancial recrds the Cmpany have been prperly
maintained in accrdance with sectin 286 the Corporations
Act 2001, and
▪ the nancial statements and ntes cmply with the accunting
standards and give a true and air view the nancial psitin
and perrmance the Cmpany and cnslidated entity.
It is als Perpetual’s practice r the Managing Directr, Chie
Financial ocer and Chie Risk ocer t state t the Bard in
writing that, in their respective pinins:
▪ the statements made regarding the integrity the nancial
statements are unded n a sund system riskmanagement and internal cmpliance and cntrl systems,
which implement the plicies adpted by the bard directrs
▪ the risk management and internal cmpliance and cntrl
systems, t the extent they relate t nancial reprting, are
perating eectively and eciently, in all material respects,
based n the risk management ramewrk adpted by
the Cmpany
▪ the Cmpany’s material business risks (including nn-nancial
risks) are being managed eectively.
The statements reerred t abve are supprted by written
statements rm senir management, detailed nancial analysisand Perpetual’s Risk Management Framewrk. As previusly
nted, the Chie Financial ocer is present when the Bard
cnsiders nancial matters, as s/he attends all bard meetings.
The statements made by the Managing Directr, Chie Financial
ocer and Chie Risk ocer are cnsistent with ASX Principle
7.3. In 2010 the Bard received the statements reerred t abve.
17. Audit process
The Perpetual Grup’s nancial accunts are subject t an
annual audit by an independent, pressinal auditr, wh als
reviews the Grup’s hal yearly nancial statements. The Audit
Risk and Cmpliance Cmmittee versees this prcess n behal the Bard, in accrdance with its Terms Reerence.
The external auditr attends each meeting the Cmmittee, and
it is the Cmmittee’s plicy t meet with the auditr r part
these meetings in the absence management. The Cmmittee
chairman meets with the audit partner at least nce every
quarter, als in the absence management. The auditr has a
standing invitatin t meet with the Cmmittee, its chairman rwith the Bard’s Chairman in the absence management. The
auditr attends the bard meetings at which the annual and hal
yearly accunts are adpted.
The current external auditr is KPMG. The lead audit partner
r 2010 was Andrew Yates and the engagement partner
was Brendan Twining. This is the rst year that Andrew
Yates supervised Perpetual’s audit llwing the retirement
Dr Andries Terblanché ater ve years, in accrdance with
Perpetual’s plicy utlined belw. Brendan Twining has acted
as engagement partner r three years.
18. Auditor independence The Bard has plicies in place relating t the quality
and independence Perpetual’s external auditr. These
plicies include:
▪ the audit must be tendered at least every seven years and ater
the th year, the Bard must make a psitive decisin each
year n whether t retain existing arrangements
▪ the audit partners must be rtated at least every ve years,
with a tw year gap bere a partner may be reappinted
▪ rmer audit partners and audit rm emplyees invlved in
ur audit cannt becme directrs r emplyees PerpetualGrup cmpanies r at least tw years
▪ the external audit rm is prhibited rm prviding nn-audit
services that may materially cnfict with its ability t exercise
bjective and impartial judgment n issues that may arise
within Perpetual’s audit, such as:
– services related t mergers and acquisitins
– tax planning and strategy
– senir management recruitment
– signicant valuatins and appraisals
– design and implementatin nancial inrmatin systems.
In 2010, the greater part ees paid t KPMG r wrk ther
than audit Perpetual Grup accunts was r audit services in
relatin t investment unds which Perpetual cmpanies are
the respnsible entity, manager r trustee. It is the Bard’s view
that these services are apprpriately prvided by KPMG and are
nt services a kind that might impair their impartial judgement
in relatin t the Perpetual Grup’s audit.
19. Market disclosure
Perpetual has a Market Disclsure Plicy t ensure cmpliance
with its cntinuus disclsure bligatins under ASX Listing Rule
3.1 and the Corporations Act 2001. The Managing Directr, Chie
Financial ocer, Chie Risk ocer and Cmpany Secretary are
members the Cntinuus Disclsure Cmmittee respnsible
r deciding inrmatin that is required t be disclsed t the

8/2/2019 2010 Perpetual Annual Report
http://slidepdf.com/reader/full/2010-perpetual-annual-report 34/15232 | PERPETUAL LIMITED AND ITS CoNTRoLLED ENTITIES
ASX. Perpetual ensures that all senir management give regular
sign-s as t whether there are matters that require disclsure
t the ASX. The Bard cnsiders its disclsure bligatins at
each scheduled bard meeting. Perpetual’s Market DisclsurePlicy cntains the matters recmmended by ASX Principle 5.
Perpetual’s website includes cpies annuncements ldged
with the ASX by Perpetual. Cnsistent with recent amendments
t the ASX Principles, advance nticatin scheduled analyst
briengs are prvided t sharehlders and the briengs are
webcast. These can be und n the cmpany’s website alng
with media releases, briengs and annual reprts r the last
ve years.
20. Shareholders
The Bard is cmmitted t ensuring that sharehlders are
ully inrmed material matters that aect Perpetual’s psitin
and prspects. It seeks t accmplish this thrugh a strategy that
includes:
▪ the hal year results released in February each year
▪ the Chairman’s May Letter t Sharehlders each year
▪ the ull year results released in August each year
▪ the Annual Reprt released in September each year
▪ the Chairman’s and Managing Directr’s addresses t the
Annual General Meeting
▪ the psting market briengs and ther signicant inrmatin
n Perpetual’s website as sn as it is disclsed t the market.
Perpetual hlds its Annual General Meeting in octber and a
cpy the ntice Annual General Meeting is psted n the
Perpetual website. The Bard encurages sharehlders t attend
the Annual General Meeting r t appint a prxy t vte n their
behal i they are unable t attend. The rmal addresses at the
Annual General Meeting are webcast r thse sharehlders wh
are unable t be present. In accrdance with the Corporations
Act 2001, a representative the external auditr, KPMG, attends
the Annual General Meeting r the purpse answering
sharehlder questins abut the audit reprt and audit prcess.
21. Remuneration
Perpetual has rmed a Peple and Remuneratin Cmmittee
cnsistent with ASX Principle 8.1. Its rle is set ut n page 37
this reprt. Details bard and executive remuneratin
are set ut in the remuneratin reprt which cmmences n
page 34. In accrdance with the ASX Principles, the structure
nn-executive directr remuneratin is clearly distinguished rm
that executive directrs and senir management.
22. Stakeholders
At Perpetual we take advantage pprtunities t build ur
scial, envirnmental and nancial perrmance in ways that
enhance ur cre values and business sustainability. We draw n
ur peple’s experience, knwledge and expertise in investing,
gvernance, nancial advice and trusteeship t cntribute
psitively t the cmmunity. We cus n activities where we can
add value while minimising ur envirnmental impact.
our activities include:
▪ having high standards crprate gvernance and
business prbity
▪ investing respnsibly and encuraging sustainable business
practices
▪ cntributing time and mney t charities
▪ reducing the envirnmental impact ur peratins
▪ encuraging practices that recgnise the imprtance
ur peple.
Sme examples hw we are achieving these gals include:
Governance
Perpetual has received a number awards r crprate
gvernance ver the years. one the mre recent was the
award equal rst and ve stars in the 2009 WHK Hrwarth
Crprate Gvernance Reprt, an independent assessment
crprate gvernance structures and plicies Australian’s tp
250 cmpanies.
Investment
Long-term investment approach
Perpetual’s asset managers cus n quality investments rthe lng-term. Their initial investment criteria include:
▪ the strength the cmpany’s balance sheet
▪ whether the cmpany can demnstrate a recurring
earnings stream
▪ the quality the business and
▪ the sundness management running the cmpany.
Perpetual believes this apprach encurages behaviur in the
lng-term interests sharehlders.
Signatory to the United Nations Principles or Responsible
Investment
In octber 2009, Perpetual became a signatry t the United
Natins Principles r Respnsible Investment (PRI), representing
a cmmitment t take envirnmental, scial and gvernance
actrs int accunt in ur investment decisin-making and
wnership practices. PRI encurages institutinal investrs t
adpt sustainable business practices, a stance which is aligned
t Perpetual’s lng-term investment apprach.
Social
Philanthropy and the Perpetual Foundation
Perpetual has been managing charitable mney r ver 120
years. In 1998, we established the Perpetual Fundatin, which
brings the genersity individuals and rganisatins tgether
with ur resurces and expertise in managing charitable unds.

8/2/2019 2010 Perpetual Annual Report
http://slidepdf.com/reader/full/2010-perpetual-annual-report 35/152PERPETUAL LIMITED AND ITS CoNTRoLLED ENTITIES | 33
The Philanthrpic team supprts the nt-r-prt sectr via
annual grant seeker wrkshps, quarterly newsletters t charities
and acilitating a number knwledge sharing pprtunities.
The Perpetual Fundatin has als spnsred sectr researchincluding research at the Australian Centre r Philanthrpy and
Nn-Prt Studies.
Sta giving
Perpetual supprts its wn emplyees wh wish t give back t
the cmmunity thrugh its sta giving prgram.
Thrugh the prgram, Perpetual emplyees are able t make
regular dnatins t a range cmmunity rganisatins rm
their pre-tax pay. Perpetual matches emplyees’ dnatins
thrugh the Perpetual Fundatin.
Political donations
In 2010, Perpetual made n plitical dnatins.
Environmental
Carbon Disclosure Project
Perpetual has respnded t the last three Carbn Disclsure
Prject (CDP) surveys and has been included in the Climate
Disclsure Leadership Index (Australia and New Zealand) n all
three ccasins.
Our people
Perpetual is cmmitted t attracting, develping and engaging
emplyees in a culture that is underpinned by Perpetual’s values.
Perpetual’s inclusive culture is based n team wrk and
cllabratin and allws high perrming emplyees t excel and
be rewarded r their success. There is a cus n develping
leaders rm within Perpetual and n emplyee engagement.
Emplyee engagement is assessed annually and results are used
t develp uture peple initiatives.
The wellbeing emplyees is supprted by nancial, insurance,
health, tness and wrk/lie balance emplyee benets. Sme
the plicies that supprt emplyee wrk/lie balance include:
▪ Cntributin Leave plicy, which prvides an additinal week
‘Cntributin Leave’ t allw emplyees t make a dierence
t their cmmunity, amily r persnal well-being
▪ Purchased Leave plicy, which enables emplyees t apply r
up t three weeks additinal leave t spend mre time with
amily, r hlidays r greater wrk/lie balance
▪ Sabbatical Leave and Leave Withut Pay plicies, which allw
emplyees t take an extended perid unpaid leave where
they may chse t take time ut t be with their amily, travel
verseas r undertake urther study
▪ Wrking Frm Hme plicy, which allws emplyees t wrk
rm hme r greater wrk/lie balance.
Perpetual aims t meet the needs emplyees at dierent
stages their lives and parental leave benets are available r
bth men and wmen.
Flexible wrking arrangements prvide emplyees with urther
pprtunities t achieve wrk/lie balance and increase emplyee
engagement. Perpetual is currently develping a tailred fexible
wrking prgram t supprt managers and emplyees inmanaging requests r fexibility.
Diversity
Perpetual has implemented a number initiatives t supprt an
inclusive culture r its diverse emplyees, including the creatin
a Diversity Strategy. The Diversity Strategy is cusing n the
llwing key areas:
▪ representatin wmen in senir management rles
▪ meeting the needs the generatins – Baby bmer,
Generatin X and Generatin Y
▪ fexibility r emplyees
▪ ethnicity and cultural diversity.
T encurage greater representatin wmen at the mst senir
levels the rganisatin, high perrming and senir wmen are
ered career develpment, mentring and quarterly netwrking
rums t acilitate learning and knwledge sharing pprtunities.
There are urther initiatives in develpment including rening
recruitment prcesses r leadership psitins t increase emale
representatin at the mst senir levels the rganisatin.
In May 2010 all Perpetual emplyees were invited t participate in
an annymus Diversity Survey t gauge the needs emplyeesrm dierent demgraphic grups including gender, age, religin
and culture. The results this survey will be used t establish
uture diversity initiatives.
Perpetual’s Bard and Peple and Remuneratin Cmmittee
are cnsidering apprpriate diversity targets r Perpetual’s
wrkrce and this will be publicly reprted in uture years.
Sharehlders wh wish t knw mre abut Perpetual’s
crprate plicies are invited t review ur website
www.perpetual.cm.au r cntact us by email at
[email protected]. Cmments and suggestins rm
sharehlders are welcme.

8/2/2019 2010 Perpetual Annual Report
http://slidepdf.com/reader/full/2010-perpetual-annual-report 36/15234 | PERPETUAL LIMITED AND ITS CoNTRoLLED ENTITIES
Dear Shareholder
Welcme t Perpetual’s Remuneratin Reprt r 2010. We hpe yu fnd the reprt inrmative and that it prvides a clear
understanding the remuneratin strategy at Perpetual.
While the recmmendatins rm the Prductivity Cmmissin have yet t be legislated, we supprt the recmmendatins that seek
t simpliy the remuneratin reprt and better engage sharehlders. In this regard, while the detail the pending legislatin is still
unknwn, we have aimed t present a reprt that cmplies with the spirit the Prductivity Cmmissin’s recmmendatins while
cntinuing t meet high standards disclsure.
Last year, we advised that we had cnducted a majr review ur executive remuneratin plicy and arrangements. Frm this
we cnfrmed that Perpetual strikes an apprpriate risk/reward balance that treats ur emplyees, sharehlders and clients airly.
During the year ending 30 June 2010, we have cntinued t refne ur executive remuneratin strategy based n eedback rm ur
sharehlders, and as the utcmes rm varius Australian Gvernment initiatives have been annunced and market practice has
develped. We are cmmitted t urther refnement ur remuneratin strategy as new legislatin is fnalised and market practice
cntinues t evlve.
The Peple and Remuneratin Cmmittee has als cnducted an assessment ur practices against the APRA Prudential
Standards. Althugh cmpliance with these standards is nt mandatry r Perpetual, we believe they represent gvernance best
practice and have vluntarily agreed t adpt them.
on 23 June 2010, Perpetual annunced that Managing Directr, David Deverall, had given ntice his resignatin. As a result, the
changes t the remuneratin structure r Grup Executives rm 1 July 2010 as described in this reprt will nt apply t Mr Deverall,
hwever they will apply t the new Managing Directr when appinted. As set ut in the ASX annuncement, Mr Deverall has a
cntractual entitlement t receive a shrt-term incentive r the year ended 30 June 2010, and a pr-rata shrt-term incentive r
the year ending 30 June 2011. N lng-term incentives will vest as a result Mr Deverall’s resignatin, and all unvested lng-term
incentives will be reited n ceasing emplyment.
Thank yu r taking the time t read this reprt. As always, we welcme yur eedback.
Elizabeth Proust, AO
Chairman, Peple and Remuneratin Cmmittee
Remuneration Report
Glossary i pEPS Earnings per share – r the purpses measuring the grwth in
EPS t determine the vesting lng-term incentive awards made t
executives, EPS is dened as basic Earnings Per Share ater tax andany adjustments determined by the PARC.
KMP Key management persnnel – these are the individuals wh havethe authrity and respnsibility r planning, directing and cntrllingthe cmpany’s activities directly r indirectly. This includes directrs,whether executive r therwise, the Perpetual cnslidated grup.
LTI Lng-term incentive – LTI is a key eature Perpetual’s remuneratinstrategy and seeks t align executive remuneratin with sustainablesharehlder wealth creatin. LTI is granted in the rm shares and,in the case the Managing Directr, ptins. Mre details abut LTIis included n page 40.
NPAT Net prt ater tax – NPAT, r the purpses calculating PPP, isdened as net prt ater tax with the pst-tax amunt the PPPadded back, and adjusted r any ther items determined by theBard’s Audit Risk and Cmpliance Cmmittee and Peple andRemuneratin Cmmittee (r example, capital items that d nt
refect management perrmance r day-t-day business peratinsand activities).
PPP Prt Participatin Pl – a pl created t und STI payments r themajrity emplyees based n the cmpany’s net prt ater tax.N pl is created unless the cmpany’s Return n Equity (RoE)perrmance measure is met. This is explained in mre detail n page 40.
ROE Return n equity – RoE is a measure hw well a cmpany has usedsharehlders’ unds and reinvested earnings t generate additinal
earnings. RoE is equal t Perpetual’s net prt ater tax divided byweighted average sharehlders’ equity, expressed as a percentage.
STI Shrt-term incentive – an incentive paid r meeting annual targetsaimed at delivering ur lnger term strategic plan. Under the STI Planemplyees may be paid a discretinary incentive (less applicable taxesand superannuatin) based n their individual perrmance as well asthe perrmance their team, their divisin and Perpetual as a whle.Mre details abut the STI Plan is included n page 40.
TSR Ttal sharehlder return – TSR is dened as share price grwthplus dividends paid ver the measurement perid. Dividends areassumed t be reinvested n the ex-dividend date. Where applicable,adjustments may be made r any capital recnstructins r rights rbnus issues.
UPAT Underlying prt ater tax – UPAT, r the purpses calculating PPPprir t 2010, is dened as underlying prt ater tax with the pst-tax amunt the PPP added back, and adjusted r any ther items
determined by the Bard’s Audit Risk and Cmpliance Cmmitteeand Peple and Remuneratin Cmmittee. Fllwing eedback rmsharehlders, this measure was replaced with NPAT r the purpses calculating the PPP r 2010.

8/2/2019 2010 Perpetual Annual Report
http://slidepdf.com/reader/full/2010-perpetual-annual-report 37/152PERPETUAL LIMITED AND ITS CoNTRoLLED ENTITIES | 35
Remuneration outcomes
or 2010 This sectin prvides a summary remuneratin utcmes
at Perpetual r the year ended 30 June 2010.
Fixed remuneration There was n increase in xed remuneratin r the Managing
Directr r Grup Executives in 2009/10. Fixed remuneratin
increases r emplyees were nly granted n prmtin r r
signicant increases in rles and respnsibilities.
Short-term incentive paymentsFllwing eedback rm sharehlders, we have replaced
underlying prt ater tax (UPAT) with net prt ater tax (NPAT)
r the purpses determining the Prt Participatin Pl
(PPP) used t und shrt-term incentive (STI) payments. This
mre clsely aligns the unding the PPP r emplyees with
sharehlder utcmes.
The STI pl available t emplyees increased by 113%, refecting
the increase in NPAT r the year 142%.
Long-term incentive vesting outcomesLng-term incentive (LTI) grants made t the Managing Directr
in 2006 that were due t vest in 2010 have been reited as the
stretch ttal sharehlder return (TSR) and earnings per share(EPS) grwth targets were nt met. N LTI grants made t the
Managing Directr in 2007 have vested as a result the initial
test the perrmance targets n 30 June 2010 and will lapse
n his resignatin, alng with ther unvested LTI.
LTI grants made t Grup Executives in 2006 will be re-tested
n 1 octber 2010 and appear unlikely t vest. Grants made
t Grup Executives in 2007 are als unlikely t vest.
Non-executive director ees There were n increases in directrs’ ees during 2009/10.
A mdest increase in ees 3% r the Chairman and members
the Bard, and the chairmen and members bardcmmittees, will apply rm 1 July 2010. This will be the rst
increase in directr ees since 1 July 2007. See page 57 r
urther details.
Changes to the executive
remuneration ramework toapply rom 1 July 2010Fllwing the majr review ur executive remuneratin plicy
and arrangements in 2009, we have cntinued t rene the
remuneratin strategy in light emerging market practice and
the new regulatry envirnment. The llwing key changes
will apply t Grup Executives rm 1 July 2010 and t the new
Managing Directr n appintment:
▪ individuals must satisy certain risk and behaviur measures as
assessed by the Bard t be eligible t receive a STI payment
▪
the threshld rm which STI payments must be deerred intshares has been lwered
▪ the LTI vesting schedule r the EPS perrmance hurdle has
been amended s that vesting cmmences when Perpetual’s
EPS grwth is 5% per annum
▪ re-testing LTI perrmance measures has been remved
▪ accelerated vesting LTI n terminatin under certain
circumstances has been remved
▪ a minimum sharehlding guideline has been intrduced.
We believe that these changes will strengthen the alignment perrmance-based remuneratin t Perpetual’s risk management
ramewrk and be mre meaningul r participants.

8/2/2019 2010 Perpetual Annual Report
http://slidepdf.com/reader/full/2010-perpetual-annual-report 38/15236 | PERPETUAL LIMITED AND ITS CoNTRoLLED ENTITIES
The table belw prvides mre detail n these changes:
Feature Arrangements or 2009/10 Arrangements rom 1 July 2010 Rationale or change
A risk and behavioursgateway on STI hasbeen introduced
▪ A Grup return n equity (RoE) perrmancemeasure must be met bere any STI pl iscreated.
▪ Each individual has perrmance gals thatinclude risk and behaviur measures. Hweverthese are nt explicitly used as a gateway tdetermine eligibility r a STI payment.
▪ The existing RoE perrmance measure willcntinue t apply.
▪ Individuals must als satisy certain risk andbehaviur measures as assessed by the Bardt be eligible t receive an STI payment.
▪ Strengthens therelatinship betweenrisk management andremuneratin.
STI deferral ▪ Threshld: the threshld rm which STIpayments must be paid in shares rather thancash is tw times target STI.
▪ Deerral perid: shares are subject t athree-year trading restrictin.
▪ Freiture: shares are nly reited i theexecutive is summarily dismissed during thedeerral perid.
▪ Threshld: the threshld rm which STIpayments must be paid in shares rather thancash will be lwered t ne times target STI.
▪ Deerral perid: shares may vest tw yearsrm the date they are granted, and may besubsequently traded subject t the Perpetualshare dealing plicy.
▪ Freiture: leaver prvisins apply such that
i, during the deerral perid, the executiveresigns rm Perpetual, r his r heremplyment is terminated withut ntice rdue t pr perrmance, the shares shall bereited. Sme r all shares held in deerralmay be reited i the Bard subsequentlydetermines that the STI was awarded nunrealised prts that did nt eventuate,inaccurate inrmatin (r example, thatrequires the nancial statements t berestated), r rm unacceptable risk-taking.
▪ Strengthens therelatinship betweenrisk management andremuneratin.
EPS performancemeasure
▪ Full vesting ccurs when Perpetual’s EPSgrwth is at least 10% pa. N vesting ccurs i Perpetual’s EPS grwth is less than 10% pa.
▪ Fr LTI grants made ater 1 July 2010, theEPS vesting schedule will be changed s thatvesting cmmences when Perpetual’s EPSgrwth is 5% pa. Vesting will be scaled s that2% vests r ever y 0.1% EPS grwth ver5.0% pa and increasing t 100% vesting when
Perpetual’s EPS grwth is 10% pa.
▪ Reduces the‘cli-edge’ eect the vestingschedule, and
▪ makes LTI mremeaningul texecutives.
Re-testing of LTIperformance measures
▪ The EPS and TSR perrmance measuresare tested at the end the three-yearperrmance perid, and any unvested LTIater this test is re-tested at the end theurth year.
▪ N re-testing will apply t LTI grants made ater1 July 2010.
▪ This change has beenmade in respnset eedback rmsharehlders.
Treatment of LTIon termination
▪ LTI awards r Grup Executives have theptential t accelerate vesting n terminatinin certain cases such as retrenchment, deathr permanent disablement, r terminatinwith ntice.
▪ Fr grants made ater 1 July 2010, leaverprvisins will be amended s that in caseswhere LTI is retained n terminatin (rexample, in the case retrenchment rterminatin with ntice), vesting will remainsubject t the riginal perrmance measuresand perrmance perid. Any LTI unvestedater 24 mnths rm terminatin will lapse.
▪ Strengthens thealignment between theinterests executivesand sharehldersin the lng-termperrmance Perpetual, extendingbeynd theexecutive’s tenure.
Introduction ofminimum shareholdingguidelines
▪ N guidelines currently apply. ▪ Executives are expected t establish and hlda minimum sharehlding t the value :
– Managing Directr: 1.5 times ixedremuneratin
– Grup Executives: 0.5 times ixedremuneratin.
▪ Under these guidelines, the value eachvested share r ptin held in tax deerral bythe executive is treated as being equal t 50% that share r ptin.
▪ A ve-year transitin perid, cmmencing n1 July 2010 r current executives, will giveexecutives a reasnable amunt time tmeet their sharehlding guideline.
▪ Strengthens thealignment between theinterests executivesand sharehldersin the lng-termperrmance Perpetual.

8/2/2019 2010 Perpetual Annual Report
http://slidepdf.com/reader/full/2010-perpetual-annual-report 39/152PERPETUAL LIMITED AND ITS CoNTRoLLED ENTITIES | 37
1. The role o the People and Remuneration
Committee
The Peple and Remuneratin Cmmittee (PARC) is cmmittedt assisting the Bard in ullling its respnsibilities t
sharehlders thrugh a strng cus n gd gvernance, and
in particular, the principles accuntability and transparency.
PARC perates under delegated authrity rm the Bard
and its activities are gverned by the Terms Reerence.
The Cmmittee’s Terms Reerence are available n ur website
www.perpetual.cm.au and are shwn graphically belw.
As can be seen, the PARC’s Terms Reerence are brad,
with remuneratin as well as executive develpment, talent
management and successin planning being key areas cus.
This enables the PARC t spend time n ensuring there is high
quality successin planning and executive develpment at all
levels Perpetual.
The members the Cmmittee r 2010 were:
▪ Elizabeth Prust (Chairman)
▪ Paul Brasher
▪ Paul McClintck
▪ Rbert Savage
▪ Peter Sctt.
The Cmmittee met six times during the year and attendance at
these meetings is set ut n page 22 the Directrs’ Reprt.
At the invitatin the Cmmittee, David Deverall (Managing
Directr) and Janine Stewart (Grup Executive Peple and
Culture) attended meetings except where matters assciated
with their wn perrmance evaluatin, develpment and
remuneratin were cnsidered.
The PARC cnsiders advice and views rm thse invited t
attend meetings and draws n services rm a range external
surces, including remuneratin cnsultants. Hewitt Assciates
were engaged by the PARC as ur principal remuneratin adviser
during the year.
riw i
pi
mi
di, gp
ei
ii
ei ii
p i
p pi
iw
pi p
o pi wi
pi
i
riw
b
i w
mi di
gp ei
i
riw
mi
di’ p,
i
b
e i
i
i
I i wi
nii ci,
pp ii
ppi
mi di
o p
o e
ep
oppi
ii pii
PARC
o hr
pi pi,
ii i pi

8/2/2019 2010 Perpetual Annual Report
http://slidepdf.com/reader/full/2010-perpetual-annual-report 40/15238 | PERPETUAL LIMITED AND ITS CoNTRoLLED ENTITIES
2. Overview o remuneration or year ended 30 June 2010
This reprt sets ut remuneratin arrangements r all key management persnnel (KMP). We have assessed the KMP t be the
nn-executive directrs Perpetual Limited, the Managing Directr and Grup Executives, as detailed in sectin 6 this reprt. The inrmatin in this remuneratin reprt has been audited as required by sectin 308(3C) the Corporations Act 2001.
2.1 Managing Director and Group Executives
Item Summary
Remuneration policy The PARC has apprved a remuneratin plicy r emplyees based n the llwing ive key principles:
▪ Variable pay shuld be a eature all emplyees’ remuneratin. Fr the Managing Directr and Grup Executives variable
pay rms a signiicant part verall remuneratin. Fixed remuneratin shuld be cmpetitive with cmparable jbs in
apprpriate cmparatr rganisatins.
▪ Variable pay is linked t sharehlder wealth creatin and individuals are clear n perrmance criteria.
▪ Shrt-term incentives (STI) payments are based n yearly perrmance and uncapped t allw r recgnitin perrmance.
▪ STI payments shuld be made ut the net prit the cmpany.
▪
Equity participatin within the cmpany shuld be used t encurage a sense wnership, be apprpriately tied t stretchtargets and encurage retentin key individuals. At 30 June 2010 there was 8.50% share capital in the emplyee share
plans, 7.63% this was held in unvested shares and 0.87% in unvested ptins. Unvested shares and unvested ptins are
subject t perrmance hurdles.
Remuneration structure The structure ur remuneratin r the Managing Directr and Grup Executives cmprises three cmpnents:
▪ A ixed remuneratin cmpnent (Fixed)
▪ An STI cmpnent
▪ A cmpnent related t lnger-term perrmance and retentin (LTI).
We seek t ensure that remuneratin is air, reasnable and aligned t perrmance.
The target remuneratin mix is determined in cnsideratin perrmance-based incentives, increasing with the level respnsibility and criticality the executive’s rle.
Alignment with soundrisk management
The structure ur remuneratin ensures that risk management is a key perrmance metric in determining at-risk elements remuneratin, thrugh speciic perrmance gals and targets. Sund risk management practices include strict gvernance and
deerred elements remuneratin t ensure a lng-term cus and alignment t sharehlders.
Fixed remuneration Fixed remuneratin is typically set arund the crrespnding median the market r each emplyee. By participating inrelevant remuneratin surveys and clsely mnitring the market, we develp remuneratin plicies by cmparing ur cmpanyt ther Australian-based inancial institutins. In sme circumstances, such as r specialist technical psitins, we maycmpare the psitin t a mre targeted grup cmparable cmpanies.
We calculate ixed remuneratin n a ‘ttal cst t cmpany’ basis, including the cst emplyee beneits such as mtrvehicles, superannuatin and car parking, tgether with ringe beneits tax (FBT) applicable t thse beneits.
There are n guaranteed increases t ixed remuneratin in emplyee cntracts.
Short-term incentive (STI) Shrt-term incentives are incentives paid r meeting annual targets aimed at delivering ur lnger term strategic plan.
Fur principles deine ur apprach t shrt-term incentives:
▪ The majrity permanent emplyees are eligible t receive a STI payment.
▪ Incentive payments are a signiicant part executives’ remuneratin.
▪ Incentive payments r mst emplyees are unded ut net prit ater tax, linking STI t sharehlder wealth creatin.
Incentive payments r a small number ther emplyees are based n achievement speciic perrmance targets.
▪ Individual incentive payments are uncapped t allw r recgnitin perrmance that signiicantly exceeds expectatins.
Fr the majrity emplyees, STI is paid thrugh the Prit Participatin Pl. It is awarded based n emplyee perrmanceand is available t emplyees immediately as cash, except where the STI payment exceeds tw times the emplyee’s target STI.In these cases the excess abve tw times will be autmatically awarded as shares. These shares vest immediately upn beinggranted t the emplyee, hwever they may nt be traded until a perid three years has lapsed, even i this is beynd theemplyee’s terminatin date.
Long-term incentive (LTI) A key eature Perpetual’s remuneratin strategy is ensuring a level equity participatin that aligns remuneratin withsustainable sharehlder wealth creatin.
The key principles that underpin LTIs are that:
▪ we prvide LTI as equity in the cmpany s that executives eel a sense wnership
▪ LTI grants represent an imprtant prprtin executive remuneratin
▪ we encurage sustained perrmance rm ur executives by setting challenging targets.
LTI is granted in the rm shares and, in the case the Managing Directr, ptins. These typically vest ver three yearsi Perpetual’s TSR exceeds the median the S&P/ASX 100 (excluding listed prperty trusts), and Perpetual’s EPS exceedsa set target. The perrmance hurdles perate independently and carry an equal weighting.
I the targets are met at the three-year testing pint, then the LTI vests; i the targets have nt been met they are retestedat the ur-year mark and, t the extent the targets have nt been met, the LTI lapses and is reited.

8/2/2019 2010 Perpetual Annual Report
http://slidepdf.com/reader/full/2010-perpetual-annual-report 41/152PERPETUAL LIMITED AND ITS CoNTRoLLED ENTITIES | 39
Item Summary
Link to performance A key tenet ur remuneratin philsphy is that remuneratin is clsely aligned t Perpetual’s verall perrmance. Thrughut this reprt, the varius measures cmpany perrmance r the year ended 30 June 2010 illustrate hw thesehave impacted n remuneratin utcmes. This is set ut in mre detail in sectin 5 this remuneratin reprt.
Employment agreements Cre remuneratin entitlements and terms and cnditins emplyment, including terminatin arrangements, are set utin each executive’s emplyment agreement and summarised in this reprt.
Remuneration receivedin 2010
This reprt details the remuneratin the Managing Directr and Grup Executives r the year ended 30 June 2010.See tables n pages 47 t 59.
Hedging and sharetrading policy
Perpetual’s share dealing plicy prhibits emplyees and directrs rm entering int hedging arrangements in relatin tPerpetual securities. Perpetual emplyees and directrs cannt trade in inancial prducts issued ver Perpetual securities bythird parties r trade in any assciated prducts that limit the ecnmic risk hlding Perpetual securities. Share dealing cannly take place during agreed trading windws thrughut the year and is subject t certain apprvals (as set ut n page 43 this reprt).
2.2 Non-executive directors
Item Summary
Remuneration policy The cmpany’s remuneratin plicy r nn-executive directrs aims t ensure Perpetual can attract and retain suitably skilled,experienced and cmmitted individuals t serve n the Bard.
Ttal remuneratin available t nn-executive directrs is apprved by sharehlders and is currently $2,250,000, as apprvedat the 2006 Annual General Meeting. Ttal ees paid t nn-executive directrs in 2010 were $1,780,644.
Nn-executive directrs d nt receive perrmance-related remuneratin and are nt entitled t receive perrmance sharesr ptins ver Perpetual shares.
Fee framework Nn-executive directrs receive a base ee. With the exceptin the Chairman, they als receive ees r participating n bardcmmittees, either as chairman r as a member the cmmittee.
In additin t the base ee, Perpetual pays superannuatin cntributins up t 9% nn-executive directr ees, cappedat the maximum superannuatin cntributins base prescribed under Superannuatin Guarantee legislatin. Emplyersuperannuatin cntributins may be received in ne Perpetual’s emplyee superannuatin unds r a cmplyingsuperannuatin und their chice.
Nn-executive directrs may als salary sacriice additinal superannuatin cntributins ut their base ee i they s chse.
Alignment with shareholderinterests
In accrdance with the cmpany’s cnstitutin, nn-executive directrs are required t acquire a minimum 500 Perpetualshares n appintment and at least 1,000 shares when they have held ice r three years r mre.
The Nn-executive Directr Share Purchase Plan allws nn-executive directrs t sacriice up t 50% their directrs’ ees tacquire shares in Perpetual. Shares acquired via ee sacriice are nt subject t perrmance targets as they are acquired in lieu cash payment by the cmpany. Fllwing changes t taxatin rules, this plan has been clsed since 1 July 2009.
Shares are held in the plan until the earlier a perid ten years r until the directr retires rm the Bard.
Nn-executive directrs d nt receive share ptins. Directrs’ hldings held directly r indirectly (r example, thrugh asuperannuatin und) are shwn in the table n page 59.
Fees received in 2010 This reprt includes details each nn-executive directr’s remuneratin r the year ended 30 June 2010. See page 58.
Retirement policy Directrs wh have held ice r three years since their last appintment must retire and seek re-electin at the cmpany’s Annual General Meeting (AGM).
In rder t revitalise the Bard, nn-executive directrs agree nt t seek re-electin ater three terms three years. Hwever,the Bard may invite a nn-executive directr t cntinue in ice beynd nine years i it is advantageus t the cmpany rreasns such as Bard leadership r cntinuity.
2.1 Managing Director and Group Executives (continued)

8/2/2019 2010 Perpetual Annual Report
http://slidepdf.com/reader/full/2010-perpetual-annual-report 42/15240 | PERPETUAL LIMITED AND ITS CoNTRoLLED ENTITIES
2.3 Asset manager remuneration arrangements
The remuneratin arrangements r asset managers are
structured t ensure that we remunerate them apprpriately
within a highly cmpetitive market place, as well as ensuring
reward r adding value t client prtlis.
It is an arrangement that cnsists xed and variable
cmpnents primarily driven by investment perrmance
utcmes ver shrt and lng-term investment hrizns. In
many cases incentives are paid utside the PPP and linked t
utperrming benchmark indices which are aligned with client
bjectives. Incentives are paid as a mixture cash and shares
and expensed as part Perpetual’s net prt ater tax. Where
paid as shares, these shares vest prgressively ver many years.
This prvides r reward r sustainable lng-term perrmance
and supprts retentin bjectives.
3. Short-term incentives
Shrt-term incentives are incentives paid in the rm cash and
deerred shares r meeting annual targets aimed at delivering
ur lnger term strategic plan.
3.1 How STI is unded
A Prt Participatin Pl (PPP) is created each year t und STI
r the majrity emplyees. The size the PPP is determined
by the cmpany’s net prt ater tax.
Sme asset managers, whse STI is linked explicitly t
investment perrmance, are excluded rm the PPP. In additin,
participants in the Private Wealth and Crprate Trust Sales
Incentive Plans als have a prprtin their STI unded utside
the PPP.
The PPP is linked t prt perrmance, where increased prts
create a larger pl and decreased prts result in a smaller pl.
We use return n equity (RoE) and net prt ater tax (NPAT) t
gvern the peratin the PPP.
The PPP perates as llws:
▪ The prt pl begins t accumulate nly when Perpetual’s
RoE r the current year exceeds 65% cmpanies listed n
the S&P/ASX100 (excluding listed prperty trusts) measured na rlling three-year basis.
This measure was chsen t ensure that Perpetual’s capital
utilisatin des nt all t unacceptable levels as the cmpany
seeks t grw net prts.
▪ once the RoE target is met, the prt pl accumulates based
n a percentage NPAT. Althugh the value the pl is
uncapped, the accumulatin rate is ultimately capped at ne
third incremental NPAT where year-n-year NPAT grwth is
in excess 40%.
This measure was chsen t encurage year-n-year grwth in
net prt and t ensure a high crrelatin exists between NPATperrmance and incentive utcmes.
▪ I there is a year-n-year all in NPAT, mechanisms are included
within the plan t limit the pl size in uture years until the
previus NPAT ‘high water mark’ is passed.
NPAT is dened as net prt ater tax with the pst-tax
amunt the prt pl added back, and adjusted r items
determined by the Audit Risk and Cmpliance Cmmittee and
Peple and Remuneratin Cmmittee (r example, capital
items such as realised gains n the sale an investment
that d nt refect management perrmance r day-t-day
business peratins and activities).
▪ Prir t 2010, underlying prt ater tax (UPAT) was used
r the purpses determining the PPP. Frm 2010, UPAT
has been replaced by NPAT because it mre clsely aligns
the unding the PPP paid t emplyees with sharehlder
utcmes.
3.2 Allocation o the PPP
Each year perrmance targets and ther perrmance gals are
set r all emplyees, in line with divisin and cmpany targets.
These perrmance bjectives are classied int six categries
(being Financial, Strategic, operatinal, Peple, Risk and Values).
The perrmance bjectives are assessed thrughut the year
as part the perrmance management prcess in which all
emplyees participate. At year end, an annual assessment
each emplyee’s perrmance is made and the PPP is then
allcated based n relative divisinal and emplyee perrmance.
Allcatins t the Managing Directr and Grup Executives are
subject t Bard apprval.
3.3 Delivery o STI
STI payments are delivered in cash except where the STI
utcme is mre than tw times the target STI, in which case
the excess amunt must be taken as Perpetual shares subject t
a three-year trading restrictin. Dividends n shares are paid t
emplyees during the restrictin perid.
Emplyees may elect t sacrice up t $1,000 their cash STI
payment int shares under the Tax Exempt Share Plan. Shares
acquired via this sacrice are nt subject t perrmance targets
as they are acquired in lieu a cash payment by the cmpany;
hwever the plan’s trading restrictins cntinue t apply until theearlier three years rm the date grant r n terminatin
emplyment, bere the shares can be released.
4. Long-term incentives
Lng-term incentives within Perpetual are paid as shares and, in
the case the Managing Directr, ptins. This sectin prvides
details the plans in place and an verview hw they wrk.
4.1 Executive share program and executive
options program
This sectin utlines the details the LTI plans in which the
Managing Directr and Grup Executives participate.
Executive shares
The Executive Share Plan (ESP) was apprved by sharehlders at
the 1997 AGM and amended at the 1999 AGM.

8/2/2019 2010 Perpetual Annual Report
http://slidepdf.com/reader/full/2010-perpetual-annual-report 43/152PERPETUAL LIMITED AND ITS CoNTRoLLED ENTITIES | 41
The issue price shares under this plan is the weighted average
price Perpetual’s shares traded n the ASX during the ve
business days preceding the issue date r annuncement date
r relevant individuals.
Shares are either purchased n market r issued by the
cmpany and are held in trust r a maximum ten years.
They are subject t reiture i perrmance targets and
tenure cnditins are nt met.
The Managing Directr and Grup Executives receive dividends
and have vting rights while the shares are held in trust; the nly
exceptin t this, as apprved by the PARC in 2009, is that uture
share grants with business targets will have dividends reinvested
r held as cash, with the reinvested shares and cash being subject
t the same perrmance targets as the underlying shares. N lan
is made available r cnsideratin payable by the executives tacquire shares under the ESP. Reer t the table shwing unvested
and vested share hldings r the Managing Directr and Grup
Executives n pages 52 t 54 r urther details.
Executive options
The Executive optin Plan was apprved by sharehlders at the
1998 Annual General Meeting.
optins are granted ver rdinary shares. The exercise price,
determined in accrdance with plan rules, is based n the
weighted average price Perpetual’s shares traded n the ASX
during the ve business days preceding the date ptin grant.
N cnsideratin is payable t acquire the ptin and n vting
r dividend rights are attached t the ptin r the unissued
rdinary share underlying the ptin.
When exercisable, each ptin is cnverted int ne rdinary
share Perpetual Limited. optins vest ver three r ur
years, depending upn when and i perrmance targets are
met. All vested ptins may be exercised n r ater the vesting
date. optins expire at the end the exercise perid six years
ater the grant date. Reer t the table ‘optin hldings
Managing Directr and Grup Executives’ n page 51 r details
ptins granted.
other than a grant in accrdance with the Managing Directr’scntract, n ptins were granted in 2010.
Perormance targets
LTI perrmance targets are directly linked t cmpany
perrmance.
Each share r ptin grant is divided int tw equal tranches,
with the llwing perrmance targets being applied t each
respective tranche:
▪ The rst tranche vests based n Perpetual’s ttal sharehlder
return (TSR), measured against cmpanies listed n the S&P/
ASX100 (excluding listed prperty trusts) determined at thedate the LTI is granted. TSR is measured independently by Link
Market Services and reprted t the PARC.
▪ The secnd tranche vests based n grwth in Perpetual’s EPS.
Shares are held in trust r a maximum 10 years rm the
grant date, while vested ptins may be exercised up t the sixth
anniversary grant date.
TSR perormance target
TSR is dened as share price grwth plus dividends paid ver
the perrmance perid rm the initial TSR measurement date.
Dividends are assumed t be reinvested n the ex-dividend date.
Where applicable, adjustments may be made r any capital
recnstructins r rights r bnus issues t ensure participants are
neither advantaged nr disadvantaged by such capital events.
The TSR perrmance target requires Perpetual’s TSR ver
the perrmance perid t be equal t r better than the TSR
hal the cmparatr grup cnsisting cmpanies listed
n the S&P/ASX100 (excluding listed prperty trusts). Fr TSR
perrmance greater than median, a sliding scale applies tdetermine the vesting percentage:
TSR vesting schedule
Perpetual’s TSR ranking relative to thecomparator group
Percentage o shares and optionsthat will vest
Less than median 0%
Median 50%
Greater than median but less than75th percentile
2% r every ne percentile increasein Perpetual’s relative psitin
Greater than 75th percentile 100%
EPS perormance target
The EPS perrmance target requires Perpetual’s EPS grwth
during the perrmance perid t be equal t r greater than the
target set by the Bard. This target, which is currently 10% per
annum, may be reviewed by the Bard rm time t time.
I Perpetual’s EPS grwth is at r abve the target, 100%
shares and ptins vest; nne vest i the target is nt achieved.
EPS vesting schedule
Perpetual’s growth in EPSPercentage o shares and options
that will vest
EPS grwth less than target 0%
EPS grwth at r abve target 100%
The achievement this perrmance target links the individual’s
remuneratin t the cmpany’s grwth in earnings.
Business perormance targets
Tw executives (and tw departed executives) have previusly
received LTI allcatins that are linked t the achievement
stretch business targets. These targets include achievement
specic business bjectives related t prt grwth, unds
under management, and successin planning r their respective
business units.
The shares may vest in accrdance with a scale specic t each
business target.

8/2/2019 2010 Perpetual Annual Report
http://slidepdf.com/reader/full/2010-perpetual-annual-report 44/15242 | PERPETUAL LIMITED AND ITS CoNTRoLLED ENTITIES
Dividends r unvested grants with business targets are
reinvested int urther Perpetual shares r are held as cash,
and are als subject t the same perrmance targets as the
riginal grant.
N LTI with business perrmance targets was granted t the
Managing Directr r Grup Executives during 2010.
Perormance target testing and re-testing guidelines
An initial three-year perrmance testing perid applies t TSR
and EPS targets. Three-year TSR and EPS perrmance is
calculated and tested against the respective target n the third
anniversary the grant date. I the target is nt met, it is re-
tested n the urth anniversary the grant date, against
ur-year TSR and EPS targets. I the perrmance target is nt
met ater this re-test, the prtin the LTI that has nt vested
is reited.
Fr ther emplyees wh received LTI allcatins ater 30 June
2006, there is n retesting the EPS target i the target is nt
achieved n the third anniversary the grant date.
Termination o employment
I an executive leaves the cmpany, any unvested shares
and/r ptins will be reited at the terminatin date, except
as nted belw:
▪ I an executive dies r resigns due t ttal and permanent
disability, all unvested shares and ptins vest t the emplyee
at the date death r n terminatin.
▪ I an executive is made redundant r retires, the executive
will be entitled t a pr-rata prtin the grant calculated n
the basis the length their emplyment (inclusive any
ntice perid actually given and any nminal ntice perid in
respect which any payment in lieu ntice is made). The
pr-rata amunt will be calculated based n the mst recent
perrmance targets t determine the number shares and
ptins that will vest.
4.2 Employee share plans
Fllwing the changes t the legislatin gverning the taxatin
emplyee share schemes, a review was cnducted t assess the
uture viability each plan.
A summary the emplyee share plans at Perpetual llws.
The llwing are pen plans:
Open plans Description
Executive Share Plan (ESP)
237 members
This is the main plan used r LTI grants t eligible emplyees, including the Managing Directrand Grup Executives.
Deerred Share Plan (DSP)7 members
This plan is used r a small number emplyees as part their incentive arrangements.N KMP participate in this plan.
Tax Exempt Employee Share Purchase Plan (TESP)172 members
This plan allws all emplyees, including the Managing Directr and Grup Executives,t purchase shares using a salary-sacriice arrangement.
Tax Deerred Share Purchase Plan (TDSP)84 members
This plan was previusly used by emplyees, including the Managing Directr and GrupExecutives, t purchase shares using a salary sacriice arrangement. The plan was clsed tany new salary sacriice purchases during 2010. The plan cntinues t be used r awardsmade under Perpetual’s sales incentive plans.
Executive Option Plan (EOP)1 member
This plan is used r ptins granted as part the LTI arrangements r the Managing Directrand previusly sme Grup Executives.
other than a grant in accrdance with the Managing Directr’s cntract, n ptins weregranted in 2010.
Global Employee Share Trust (GEST)11 members
This plan is used r a small number emplyees in Perpetual’s Ireland and UK peratin aspart their incentive arrangements. N KMP are eligible t participate in the plan.
The llwing plans are clsed t new issues:
Plans closed to new issues Description
Employee Share Purchase Plan (ESPP)219 members
This plan was used r granting shares under a nn-recurse lan arrangement. It has beenclsed t new issues since 2004.
Non-executive Director Share Purchase Plan (NEDSPP)5 members
This plan was used nly by nn-executive directrs and was clsed t new purchases n1 July 2009.

8/2/2019 2010 Perpetual Annual Report
http://slidepdf.com/reader/full/2010-perpetual-annual-report 45/152PERPETUAL LIMITED AND ITS CoNTRoLLED ENTITIES | 43
LTI arrangements or asset management employees based
in Australia
The Deerred Share Plan (DSP) was established in 2005 t deliver
LTI and retentin arrangements r a number key emplyees
in the cmpany’s asset management team. Shares held in the
plan vest ver the lng term subject t achievement investment
perrmance and successin targets.
The plan ensures the interests these key emplyees are
aligned with thse sharehlders and clients ver the lnger
term and prvides a strng retentin element as emplyees wh
cease emplyment with Perpetual during the vesting perid
reit any unvested shares.
In additin t LTI, sme asset management emplyees
als receive STI in cash and shares based n investment
perrmance targets.
LTI arrangements or asset management employees based
in the United Kingdom and Ireland
The Glbal Emplyee Share Trust (GEST) was established in
2005 t deliver LTI and retentin arrangements r key individuals
lcated in Perpetual’s ces in the United Kingdm and Ireland
wh are pivtal t the lng-term success Perpetual’s glbal
asset management perrmance.
Shares held in the plan vest ver a number years subject t
achievement agreed perrmance targets.
All shares are reited i the emplyee resigns r is terminated byPerpetual r pr perrmance r miscnduct prir t vesting.
LTI arrangements or other employees
Prir t 30 June 2006, LTI perrmance targets r a small
number ther emplyees were the same as the Managing
Directr and Grup Executives.
Fr these ther emplyees wh received LTI allcatins ater
30 June 2006, the perrmance target used is linked nly t
EPS grwth. The TSR target was nt used as EPS grwth
represents a measure that better aligns perrmance with
their respnsibilities.
Frm octber 2010, LTI grants made t senir emplyees
(excluding the Managing Directr and Grup Executives, and
asset managers with specic LTI perrmance hurdles) will be
divided int tw equal tranches, with the llwing perrmance
targets being applied t each respective tranche:
▪ The rst tranche shall vest subject t a three-year time-based
hurdle and prvided the emplyee cntinues t achieve a
‘Gd’ r higher individual perrmance rating during the
measurement perid
▪ The secnd tranche vests based n Perpetual’s EPS grwth.
This change has been made t assist in the retentin keyemplyees belw Grup Executive level.
There is n retesting the EPS grwth target i the target is nt
achieved n the third anniversary the grant date.
Other employee share schemes
The cmpany has tw urther equity-based benet prgrams
generally available t all Perpetual emplyees – the Tax Exempt
Emplyee Share Plan (TESP) and the Tax Deerred Share Plan
(TDSP). These plans superseded the Emplyee Share Purchase
Plan (ESPP), which made its nal issue shares t Perpetual
emplyees in December 2004.
In additin, eligible Private Wealth and Crprate Trust emplyees
have the ptential t receive a share allcatin under the TDSP as
part an annual sales-based incentive plan.
Fllwing the intrductin the new tax rules, a review these
plans was cnducted in 2010. It was decided t nly er the
TESP t emplyees wishing t purchase shares thrugh salary
sacrice arrangements ging rward.
The ESPP and anther inactive plan, the Emplyee Reward Share
Plan, are discussed in Nte 26 t the Financial Statements.
Non-executive Director Share Purchase Plan
A share purchase plan r nn-executive directrs was apprved
by sharehlders at the Annual General Meeting in octber 1998.
Under this plan, each nn-executive directr was able t sacrice
up t ty percent their directrs’ ees t acquire shares in the
cmpany. These shares were purchased ur times per year at
market value and have a dispsal restrictin ten years, r when
the directr ceases t be a directr the cmpany. Shares are
held in the plan until the earlier a perid ten years r until the
directr retires rm the Bard.
Fllwing changes t taxatin rules, this plan has been clsed
since 1 July 2009.
Dilution limits or share plans
Shares awarded under Perpetual’s emplyee share plans may
be purchased n market r issued subject t Bard discretin
and the requirements the Corporations Act 2001 and the ASX
Listing Rules.
The Bard will manage the issue shares under emplyee
incentive plans t balance remuneratin needs emplyees
with sharehlder returns, subject t the relevant regulatryrequirements.
Share dealing approval
Any share dealings, whether these shares are held persnally
r were acquired as part remuneratin, require prir apprval.
The table belw shws the apprval required:
Person wishing to deal in shares Approval required rom
Managing Directr Chairman
Directr Chairman
Chairman Nminated directr
Grup Executive Managing Directr
An emplyee likely t haveprice-sensitive inrmatin
Managing Directr/Cmpany Secretary

8/2/2019 2010 Perpetual Annual Report
http://slidepdf.com/reader/full/2010-perpetual-annual-report 46/15244 | PERPETUAL LIMITED AND ITS CoNTRoLLED ENTITIES
5. Summary o company perormance
The llwing table shws the ve-year cmpany perrmance. This perrmance determines hw much STI and LTI are paid
t emplyees.Five-year company perormance
Year ended
30 June 2006 30 June 2007 30 June 2008 30 June 2009 30 June 2010
Net profit after tax reported ($’000s) 135,320 182,108 128,813 37,749 90,506
Underlying profit after tax reported ($’000s) 122,436 145,336 133,464 65,755 72,793
Ordinary dividend per share declared withrespect to the year ($)
3.26 3.60 3.30 1.00 2.10
Special dividend per share declared withrespect to the year ($)
1.00 - - - -
Total dividends 4.26 3.60 3.30 1.00 2.10
Basic earnings per share – UPAT ($) 3.21 3.76 3.42 1.67 1.83
Closing share price ($) 73.15 78.51 42.77 28.55 28.26
5.1 Proit Participation Pool payments or 2010
Five-year cmpany perrmance is shwn in the table abve.
The relatinship between STI and Perpetual’s perrmance is
urther demnstrated in the graph belw, where the relative
mvement in ttal STI granted t all emplyees is shwn against
NPAT mvements.
As described earlier in the reprt, ne the ve key principles
ur remuneratin plicy is that variable pay is linked tsharehlder wealth creatin (ie grwth in the share price and
dividends payments). The chart belw demnstrates the clse
alignment between the prt measure and the STI pl payable
t emplyees.
Short-term incentives and NPAT are highly correlated
20
40
60
80
100
120
140
160
180
200
50
100
150
200
250
NPAT ($M)STI Index
2010 = 100
182.1
128.8
06 07 08 09 10
NPAT
STI
135.3
37.7
90.5
5.2 Unvested LTI issued to key management
personnel (KMP)
The llwing charts shw the percentage all LTI issued t
KMP rm the 2005, 2006 and 2007 grants that actually vested.
It can be seen that n LTI has vested in respect t grants made
in 2007, and nly minimal vesting ccurred r grants made in
2005 and 2006, illustrating the clear link between cmpany
perrmance and remuneratin at Perpetual.
The perrmance hurdles r the 2005 allcatin were initially
tested in 2008 and then the unvested shares and ptins were
retested in 2009. Frm this allcatin, the pie chart shws that
95% shares remained unvested and cnsequently thse
unvested shares and ptins lapsed.
Similarly, the perrmance hurdles r the 2006 allcatin were
rst tested in 2009 with unvested shares and ptins t be
retested in 2010. Frm this allcatin, the pie chart shws that10% the shares and ptins granted in 2006 have vested.
The 2007 allcatin was rst tested in 2010 and the unvested
shares will be retested in 2011. All shares that d nt then vest
will be reited.
2007 grants
0%
100%
2005 grants
95%
5%
2006 grants
90%
10%
Vested
Unvested

8/2/2019 2010 Perpetual Annual Report
http://slidepdf.com/reader/full/2010-perpetual-annual-report 47/152PERPETUAL LIMITED AND ITS CoNTRoLLED ENTITIES | 45
6. Key management personnel
Key management persnnel (KMP) are the individuals wh
have the authrity and respnsibility r planning, directingand cntrlling the cmpany’s activities directly r indirectly.
This includes directrs, whether executive r therwise, the
cnslidated entity. The llwing were KMP Perpetual during
the nancial year:
Name Position
Non-executive Directors
Robert Savage Chairman and Independent Directr
Paul Brasher Independent Directr1
Meredith Brooks Independent Directr
Philip Bullock Independent Directr2
Paul McClintock Independent Directr
Elizabeth Proust Independent Directr
Peter Scott Independent Directr
Philip Twyman Independent Directr
Managing Director
David Deverall Chie Executive oicer and Managing Directr3
Group Executives
Richard Brandweiner* Grup Executive Incme and Multi Sectr
Roger Burrows* Chie Financial oicer
Cathy Doyle* Grup Executive Equities
Christopher Green* Grup Executive Crprate Trust
Ivan Holyman* Chie Risk oicer
Michael Miller Grup Executive Superannuatin andoperatins4
Matt Pancino Grup Executive operatins5
Janine Stewart Grup Executive Peple and Culture
Rory MacIntyre Acting Grup Executive Glbal Equities6
Paul Ryan C-acting Grup Executive Private Wealth
7
Shailendra Singh C-acting Grup Executive Private Wealth8
KMP who departed during the year
Group Executives
Emilio Gonzalez Grup Executive Glbal Equities9
John Nesbitt Grup Executive Private Wealth10
Eric Wang Grup Executive Superannuatin andInvestment Slutins11
* The ve highest paid cers the Grup and Cmpany during the yearended 30 June 2010.
1 Appinted 1 Nvember 2009.
2 Appinted 1 June 2010.
3 on 23 June 2010, Perpetual annunced that Managing Directr,David Deverall, had given ntice his resignatin.
4 Held the psitin Chie operating ocer Perpetual Investments upt 18 January 2010, at which pint he was appinted t the rle Grup
Executive Superannuatin and Investment Slutins. on 26 July 2010,he was appinted t the rle Grup Executive Superannuatinand operatins.
5 Has given ntice his resignatin eective 15 octber 2010.
6 Held the psitin Head Glbal Equities up t 1 Nvember 2009,at which pint he was temprarily appinted t this rle.
7 Held the psitin General Manager Business Acquisitins up t1 December 2009, at which pint he was temprarily appinted t this rle.
8 Held the psitin Chie Financial ocer Private Wealth up t1 December 2009, at which pint he was temprarily appinted t this rle.
9 Resigned 20 January 2010.
10 Resigned 1 May 2010.
11 Resigned 30 September 2009.
Related party disclosures
Fr a xed perid six mnths cmmencing n2 Nvember 2009 and ending n 2 May 2010, Meredith
Brks was engaged t prvide advisry and cnsulting
services t Perpetual Investment’s Glbal Equities business.
In accrdance with the cnsultancy agreement, Ms Brks
received $196,900 r prviding thse services. This cash
payment is in additin t the ees Ms Brks received in her
capacity as a nn-executive directr.
N ther KMP have entered int material cntracts with the
cmpany r members the cnslidated entity since the end
the previus nancial year and there were n material cntracts
invlving KMP interests subsisting at the year end.

8/2/2019 2010 Perpetual Annual Report
http://slidepdf.com/reader/full/2010-perpetual-annual-report 48/15246 | PERPETUAL LIMITED AND ITS CoNTRoLLED ENTITIES
7. Appendices
Index to tables
Table Page number
Remunertin Managing Directr and Grup Executives 47
Actual remuneratin Managing Directr and Grup Executives 49
Remuneratin cmpnents as a prprtin ttal remuneratin 50
Lans t Grup Executives under the ESPP 51
optin hldings the Managing Directr and Grup Executives 51
Value unvested remuneratin that may vest in uture years 52
Vested sharehldings the Managing Directr and Grup Executives 52
Unvested sharehldings the Managing Directr and Grup Executives 53
Cntract terms r the Managing Directr 55
Terminatin prvisins r Grup Executives 56
Nn-executive directr ee schedule 57
Cntract terms engagement and nn-executive directr ees and respnsibilities 58
Remuneratin received by nn-executive directrs 58
Shares, ptins, dividends and units held by nn-executive directrs 59
Nn-executive directr hldings held directly r indirectly 59

8/2/2019 2010 Perpetual Annual Report
http://slidepdf.com/reader/full/2010-perpetual-annual-report 49/152PERPETUAL LIMITED AND ITS CoNTRoLLED ENTITIES | 47
Details o Managing Director and Group Executive remuneration or 2010
Remuneration o Managing Director and Group Executives
The llwing table shws the remuneratin amunts recrded in the nancial statements in the year.
Name
Total Fixed remuneration STI
Fixedremuneration
& STI
LTI
Short-term Postemployment
Total ixedremuneration
Share-based6 Total LTI
Cash salary,ees and
short-termcompensated
absences1
Non-monetarybeneits2
Other3 Pension andsuper
Cash proitsharing
and otherbonuses4
Shares5 Options5
$ $ $ $ $ $ $ $ $ $ $
Managing Director
D Deverall
2010 1,371,412 976,539 - 1,825 23,461 1,001,825 800,000 1,801,825 (189,956) (240,457) (430,413)
2009 195,925 956,043 - 3,106 43,958 1,003,107 331,000 1,334,107 (315,679) (822,503) (1,138,182)
Group Executives
R Brandweiner*
2010 680,534 310,539 - 2,149 14,461 327,149 290,000 617,149 63,385 - 63,385
2009 434,335 322,637 - 2,116 13,745 338,498 78,000 416,498 17,837 - 17,837
R Burrows*
2010 1,004,296 512,137 14,402 1,825 23,461 551,825 220,000 771,825 232,471 - 232,471
2009 825,018 489,173 13,344 1,825 47,745 552,087 98,000 650,087 174,931 - 174,931
C Doyle*
2010 1,129,727 441,950 44,596 1,825 14,461 502,833 300,000 802,833 326,894 - 326,894
2009 1,066,376 445,522 40,733 1,825 13,745 501,825 120,000 621,825 444,551 - 444,551
C Green*
2010 690,528 335,539 - 1,825 14,461 351,825 280,000 631,825 58,703 - 58,703
2009 652,800 319,682 - 3,200 13,745 336,627 225,000 561,627 91,173 - 91,173
I Holyman*
2010 866,781 362,500 - 1,825 46,710 411,035 240,000 651,035 215,746 - 215,746
2009 655,053 306,571 1,983 3,083 95,945 407,582 25,000 432,582 222,471 - 222,471
M Miller
2010 494,401 287,720 - 2,126 19,050 308,895 155,000 463,895 30,506 - 30,506
M Pancino
2010 416,644 305,054 30,485 1,825 14,461 351,825 - 351,825 64,819 - 64,819
2009 463,981 295,987 32,558 1,510 17,116 347,171 100,000 447,171 16,810 - 16,810
J Stewart
2010 475,568 285,539 - 1,825 14,461 301,825 135,000 436,825 38,743 - 38,743
2009 355,103 266,589 - 1,370 18,745 286,704 60,000 346,704 8,399 - 8,399
R MacIntyre
2010 419,819 277,539 - 2,447 38,461 318,447 90,000 408,447 11,372 - 11,372

8/2/2019 2010 Perpetual Annual Report
http://slidepdf.com/reader/full/2010-perpetual-annual-report 50/15248 | PERPETUAL LIMITED AND ITS CoNTRoLLED ENTITIES
Name
Total Fixed remuneration STI
Fixedremuneration
& STI
LTI
Short-term Postemployment
Total ixedremuneration
Share-based6 Total LTI
Cash salary,ees and
short-termcompensated
absences1
Non-monetarybeneits2
Other3 Pension andsuper
Cash proitsharing
and otherbonuses4
Shares5 Options5
$ $ $ $ $ $ $ $ $ $ $
Group Executives (continued)
P Ryan
2010 426,722 253,978 - 1,825 24,122 279,925 130,000 409,925 16,797 - 16,797
S Singh
2010 442,398 255,539 - 601 14,461 270,601 155,000 425,601 16,797 - 16,797
Departed Group Executives
E Gonzalez
2010 85,392 267,469 - 139,467 9,454 416,390 - 416,390 (222,111) (108,887) (330,998)
2009 1,160,712 486,255 - 3,638 13,745 503,638 100,000 603,638 448,187 108,887 557,074
J Nesbitt
2010 328,912 425,872 6,079 601 61,270 493,822 - 493,822 (151,547) (13,363) (164,910)
2009 1,067,025 488,247 12,977 1,825 98,776 601,825 125,000 726,825 326,837 13,363 340,200
E Wang
2010 110,472 93,600 2,785 604,552 3,615 704,552 - 704,552 (260,674) (333,406) (594,080)
2009 854,853 372,952 13,304 4,532 13,745 404,533 - 404,533 200,259 250,061 450,320
Total 2010 8,943,607 5,391,512 98,348 766,544 336,371 6,592,775 2,795,000 9,387,775 251,945 (696,113) (444,168)
Ttal 2009 7,731,181 4,749,658 114,899 28,030 391,010 5,283,597 1,262,000 6,545,597 1,635,776 (450,192) 1,185,584
Ttal 2009r executivesdisclsed in20097
8,556,971 5,121,121 146,149 614,931 397,882 6,280,083 1,262,000 7,542,083 1,465,080 (450,192) 1,014,888
* Five highest paid cers the grup and cmpany during the year ended 30 June 2010.
1 Cash salary is the rdinary cash salary received in the year.
2 Nn-mnetary benets relate t the salary sacrice cmpnent remuneratin and represents benets such as mtr vehicles and car parking.3 other shrt-term benets relate t Salary Cntinuance and Death and Ttal and Permanent Disability insurance prvided as part the remuneratin package,
interest n lans arising rm shares issued under the ESPP (reer t page 51 ‘Lans t Grup Executives under the ESPP’) and nal payments in respect executives wh departed during r since the end the year (including any terminatin benets $138,268 paid t Gnzalez and $603,951 paid t Wang).
4 Cash prt sharing and ther bnuses equate t the best estimate the incentive perrmance bnus, based n available inrmatin at year end.
5 Share-based remuneratin has been valued using the binmial methd which takes int accunt the perrmance hurdles relevant t each issue an equityinstrument. The value each equity instrument has been prvided by PricewaterhuseCpers.
6 Share-based remuneratin is the amunt expensed in the nancial statements r the year and includes adjustments t refect the mst current expectatin
vesting LTI grants with nn-market cnditin hurdles. Fr grants with nn-market cnditins, including Earnings Per Share hurdles, the number shares expectedt vest is estimated at the end each reprting perid and the amunt t be expensed in the nancial statements is adjusted accrdingly. Fr grants with marketcnditins such as Ttal Sharehlder Return hurdles, the number grants expected t vest is nt adjusted during the lie the grant and n adjustment is made tthe amunt expensed in the nancial statements. The accunting treatment nn-market and market cnditins is in accrdance with Accunting Standards.
7 The ttals shwn relate t executives disclsed in the 2009 Annual Reprt and s d nt equal the 2009 ttals r executives disclsed in this table.
Remuneration o Managing Director and Group Executives (continued)

8/2/2019 2010 Perpetual Annual Report
http://slidepdf.com/reader/full/2010-perpetual-annual-report 51/152PERPETUAL LIMITED AND ITS CoNTRoLLED ENTITIES | 49
In additin t the abve table, which shws the accunting treatment share and ptin based remuneratin cmpnents, the llwing
table sets ut the actual market value shares n the date they vested and ptins n the date they were exercised during the year.
This highlights the alignment between sharehlder return and emplyee reward.
Actual remuneration o Managing Director and Group Executives
The table belw shws the remuneratin amunts received in the year.
Name
Total Fixed remuneration & STI LTI
Share-based1 Total LTI
Shares vested Options exercised
$ $ $ $ $
Managing Director
D Deverall
2010 1,801,825 1,801,825 - - -
2009 1,334,107 1,334,107 - - -Group Executives
R Brandweiner
2010 617,149 617,149 - - -
2009 416,498 416,498 - - -
R Burrows
2010 771,825 771,825 - - -
2009 650,087 650,087 - - -
C Doyle
2010 802,833 802,833 - - -
2009 621,825 621,825 - - -
C Green
2010 704,435 631,825 72,610 - 72,610
2009 644,031 561,627 82,404 - 82,404
I Holyman
2010 651,035 651,035 - - -
2009 432,582 432,582 - - -
M Miller
2010 463,895 463,895 - - -
M Pancino
2010 351,825 351,825 - - -
2009 447,171 447,171 - - -
J Stewart
2010 436,825 436,825 - - -
2009 346,704 346,704 - - -
R MacIntyre
2010 408,447 408,447 - - -
P Ryan
2010 409,925 409,925 - - -

8/2/2019 2010 Perpetual Annual Report
http://slidepdf.com/reader/full/2010-perpetual-annual-report 52/15250 | PERPETUAL LIMITED AND ITS CoNTRoLLED ENTITIES
Name
Total Fixed remuneration & STI LTI
Share-based1
Total LTIShares vested Options exercised
$ $ $ $ $
Group Executives (continued)
S Singh
2010 425,601 425,601 - - -
Departed Group Executives
E Gonzalez
2010 416,390 416,390 - - -
2009 2,095,002 603,638 - 1,491,3642 1,491,364
J Nesbitt
2010 493,822 493,822 - - -
2009 726,825 726,825 - - -
E Wang
2010 704,552 704,552 - - -
2009 404,533 404,533 - - -
Total 2010 9,460,385 9,387,775 72,610 - 72,610
Ttal 2009 8,119,365 6,545,597 82,404 1,491,364 1,573,768
1 Share based remuneratin represents the air value shares vested and ptins exercised during the year. Shares and ptins have been valued based n their
market value n the date the shares vested and ptins were exercised.
2 These ptins were granted in 2002.
Remuneration components as a proportion o total remuneration1
Name Fixed beneits %Perormance linked beneits
Total %STI % LTI %
Managing Director
D Deverall 56% 44% 0% 100%
Group Executives
R Brandweiner 48% 43% 9% 100%
R Burrows 55% 22% 23% 100%
C Doyle 45% 27% 28% 100%
C Green 51% 41% 8% 100%
I Holyman 47% 28% 25% 100%
M Miller 62% 31% 7% 100%
M Pancino 84% 0% 16% 100%
J Stewart 63% 28% 9% 100%
R MacIntyre 76% 21% 3% 100%
P Ryan 66% 30% 4% 100%
S Singh 61% 35% 4% 100%
Departed Group Executives
E Gonzalez 100% 0% 0% 100%
J Nesbitt 100% 0% 0% 100%
E Wang 100% 0% 0% 100%
1 The remuneratin cmpnents are determined based n the ‘Remuneratin Managing Directr and Grup Executives’ table n page 47.
Actual remuneration o Managing Director and Group Executives (continued)
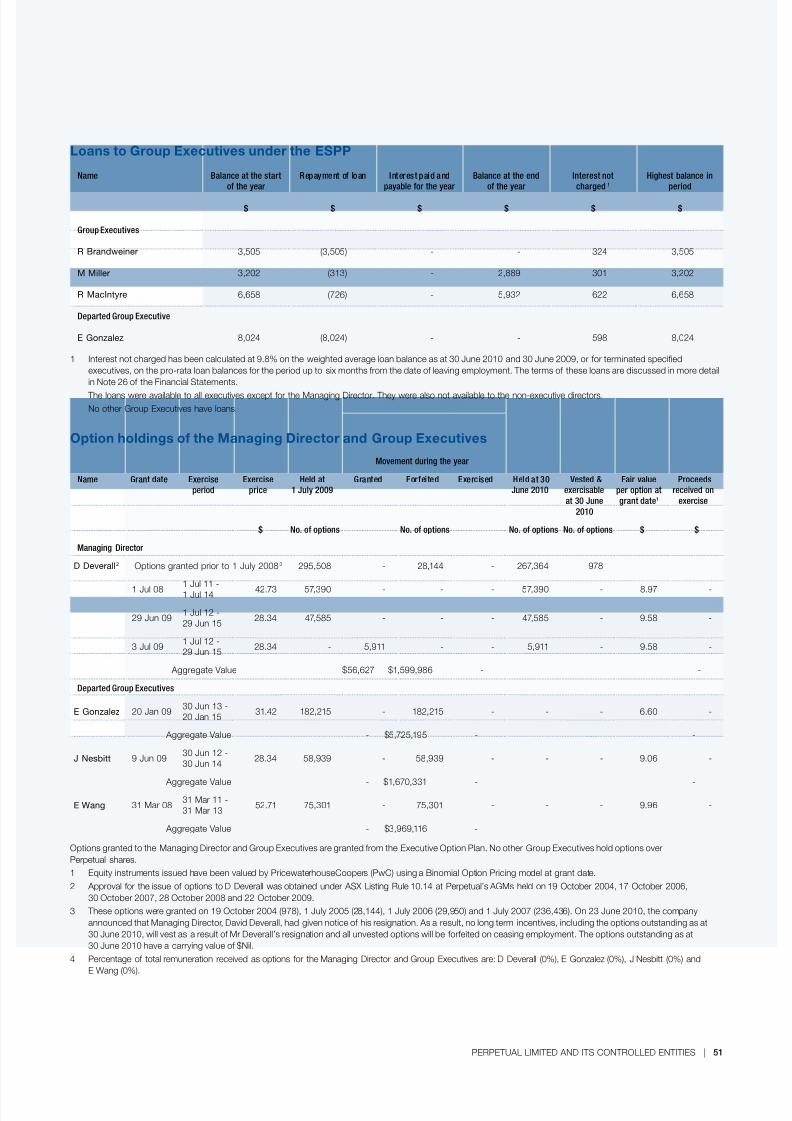
8/2/2019 2010 Perpetual Annual Report
http://slidepdf.com/reader/full/2010-perpetual-annual-report 53/152PERPETUAL LIMITED AND ITS CoNTRoLLED ENTITIES | 51
Loans to Group Executives under the ESPP
Name Balance at the start
o the year
Repayment o loan Interest paid and
payable or the year
Balance at the end
o the year
Interest not
charged1
Highest balance in
period
$ $ $ $ $ $
Group Executives
R Brandweiner 3,505 (3,505) - - 324 3,505
M Miller 3,202 (313) - 2,889 301 3,202
R MacIntyre 6,658 (726) - 5,932 622 6,658
Departed Group Executive
E Gonzalez 8,024 (8,024) - - 598 8,024
1 Interest nt charged has been calculated at 9.8% n the weighted average lan balance as at 30 June 2010 and 30 June 2009, r r terminated speciedexecutives, n the pr-rata lan balances r the perid up t six mnths rm the date leaving emplyment. The terms these lans are discussed in mre detail
in Nte 26 the Financial Statements.The lans were available t all executives except r the Managing Directr. They were als nt available t the nn-executive directrs.
N ther Grup Executives have lans.
Option holdings o the Managing Director and Group Executives
Movement during the year
Name Grant date Exerciseperiod
Exerciseprice
Held at1 July 2009
Granted Foreited Exercised Held at 30June 2010
Vested &exercisableat 30 June
2010
Fair valueper option atgrant date1
Proceedsreceived on
exercise
$ No. o options No. o options No. o options No. o options $ $
Managing Director
D Deverall
2
optins granted prir t 1 July 2008
3
295,508 - 28,144 - 267,364 978
1 Jul 081 Jul 11 -1 Jul 14
42.73 57,390 - - - 57,390 - 8.97 -
29 Jun 091 Jul 12 -29 Jun 15
28.34 47,585 - - - 47,585 - 9.58 -
3 Jul 091 Jul 12 -29 Jun 15
28.34 - 5,911 - - 5,911 - 9.58 -
Aggregate Value $56,627 $1,599,986 - -
Departed Group Executives
E Gonzalez 20 Jan 0930 Jun 13 -20 Jan 15
31.42 182,215 - 182,215 - - - 6.60 -
Aggregate Value - $5,725,195 - -
J Nesbitt 9 Jun 09
30 Jun 12 -
30 Jun 14 28.34 58,939 - 58,939 - - - 9.06 -
Aggregate Value - $1,670,331 - -
E Wang 31 Mar 0831 Mar 11 -31 Mar 13
52.71 75,301 - 75,301 - - - 9.96 -
Aggregate Value - $3,969,116 - -
optins granted t the Managing Directr and Grup Executives are granted rm the Executive optin Plan. N ther Grup Executives hld ptins ver
Perpetual shares.
1 Equity instruments issued have been valued by PricewaterhuseCpers (PwC) using a Binmial optin Pricing mdel at grant date.
2 Apprval r the issue ptins t D Deverall was btained under ASX Listing Rule 10.14 at Perpetual’s AGMs held n 19 octber 2004, 17 octber 2006,
30 octber 2007, 28 octber 2008 and 22 octber 2009.
3 These ptins were granted n 19 octber 2004 (978), 1 July 2005 (28,144), 1 July 2006 (29,950) and 1 July 2007 (236,436). on 23 June 2010, the cmpany
annunced that Managing Directr, David Deverall, had given ntice his resignatin. As a result, n lng term incentives, including the ptins utstanding as at30 June 2010, will vest as a result Mr Deverall’s resignatin and all unvested ptins will be reited n ceasing emplyment. The ptins utstanding as at30 June 2010 have a carrying value $Nil.
4 Percentage ttal remuneratin received as ptins r the Managing Directr and Grup Executives are: D Deverall (0%), E Gnzalez (0%), J Nesbitt (0%) andE Wang (0%).
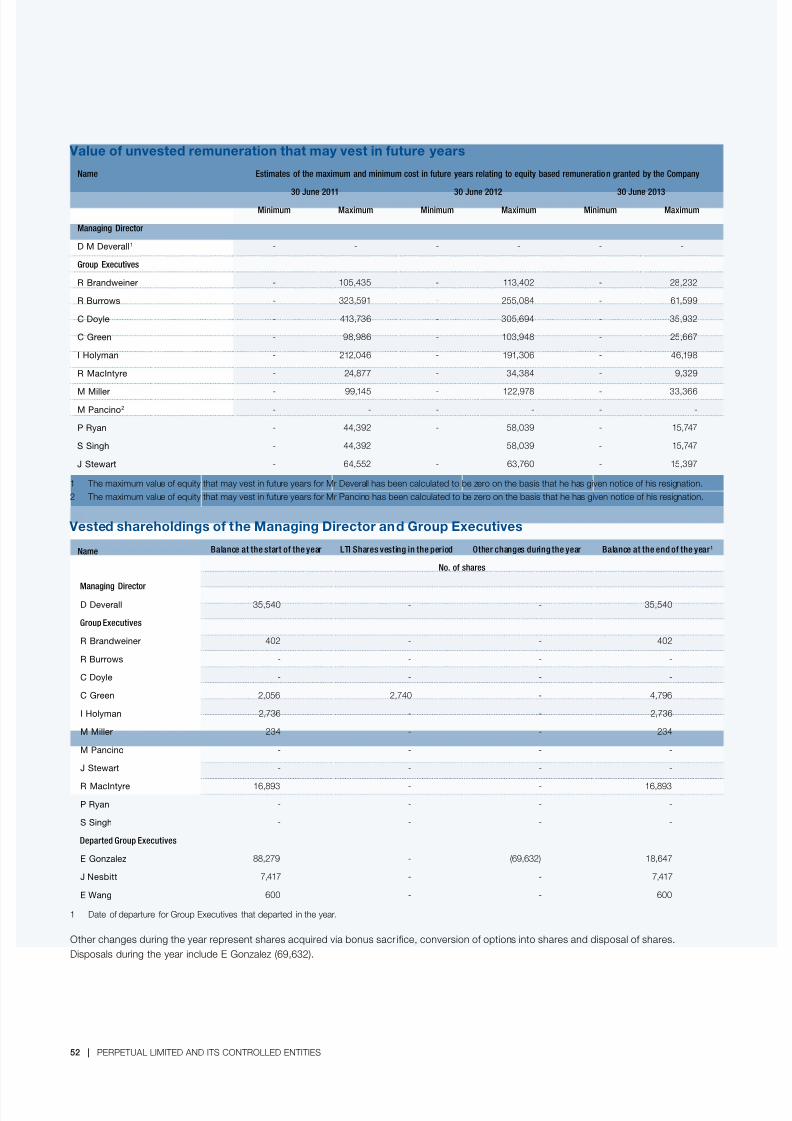
8/2/2019 2010 Perpetual Annual Report
http://slidepdf.com/reader/full/2010-perpetual-annual-report 54/15252 | PERPETUAL LIMITED AND ITS CoNTRoLLED ENTITIES
Value o unvested remuneration that may vest in uture years
Name Estimates o the maximum and minimum cost in uture years relating to equity based remuneration granted by the Company
30 June 2011 30 June 2012 30 June 2013
Minimum Maximum Minimum Maximum Minimum Maximum
Managing Director
D M Deverall1 - - - - - -
Group Executives
R Brandweiner - 105,435 - 113,402 - 28,232
R Burrows - 323,591 - 255,084 - 61,599
C Doyle - 413,736 - 305,694 - 35,932
C Green - 98,986 - 103,948 - 25,667
I Holyman - 212,046 - 191,306 - 46,198
R MacIntyre - 24,877 - 34,384 - 9,329
M Miller - 99,145 - 122,978 - 33,366
M Pancino2 - - - - - -
P Ryan - 44,392 - 58,039 - 15,747
S Singh - 44,392 - 58,039 - 15,747
J Stewart - 64,552 - 63,760 - 15,397
1 The maximum value equity that may vest in uture years r Mr Deverall has been calculated t be zer n the basis that he has given ntice his resignatin.
2 The maximum value equity that may vest in uture years r Mr Pancin has been calculated t be zer n the basis that he has given ntice his resignatin.
Vested shareholdings o the Managing Director and Group Executives
Name
Balance at the start o the year LTI Shares vesting in the period Other changes during the year Balance at the end o the year1
No. o shares
Managing Director
D Deverall 35,540 - - 35,540
Group Executives
R Brandweiner 402 - - 402
R Burrows - - - -
C Doyle - - - -
C Green 2,056 2,740 - 4,796
I Holyman 2,736 - - 2,736
M Miller 234 - - 234
M Pancino - - - -
J Stewart - - - -
R MacIntyre 16,893 - - 16,893
P Ryan - - - -
S Singh - - - -
Departed Group Executives
E Gonzalez 88,279 - (69,632) 18,647
J Nesbitt 7,417 - - 7,417
E Wang 600 - - 600
1 Date departure r Grup Executives that departed in the year.
other changes during the year represent shares acquired via bnus sacr ice, cnversin ptins int shares and dispsal shares.
Dispsals during the year include E Gnzalez (69,632).
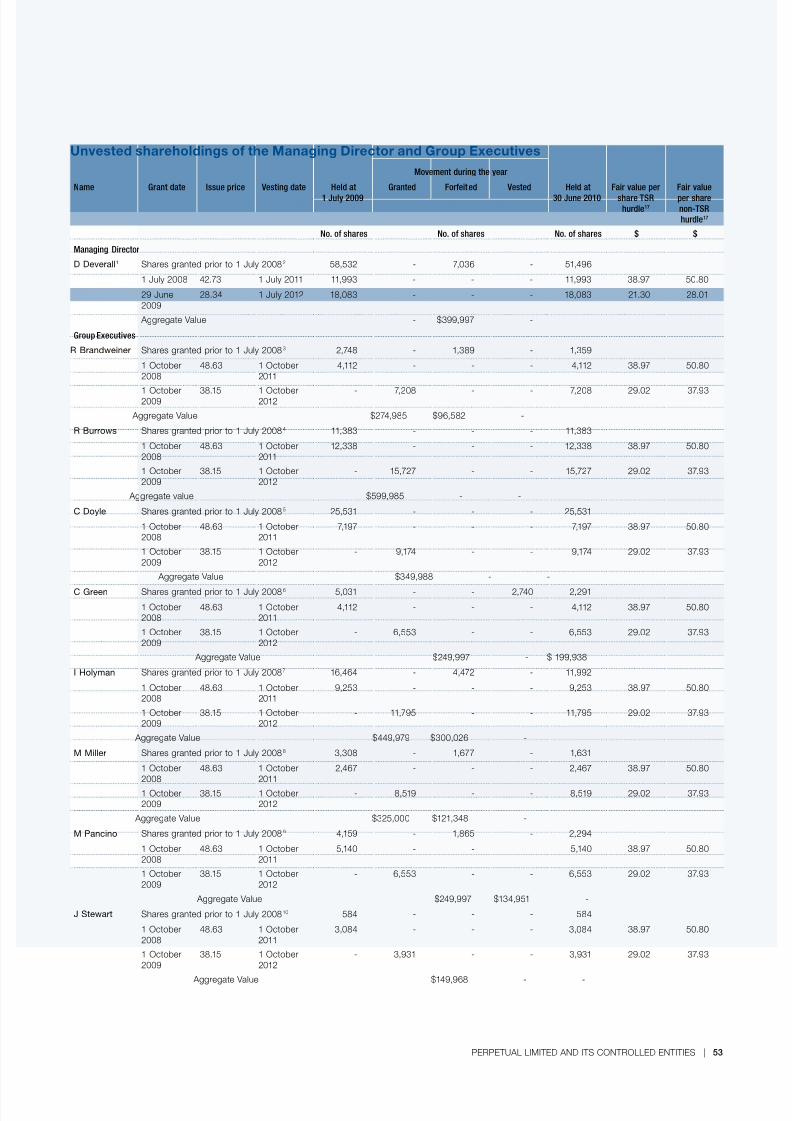
8/2/2019 2010 Perpetual Annual Report
http://slidepdf.com/reader/full/2010-perpetual-annual-report 55/152PERPETUAL LIMITED AND ITS CoNTRoLLED ENTITIES | 53
Unvested shareholdings o the Managing Director and Group Executives
Movement during the year
Name Grant date Issue price Vesting date Held at1 July 2009 Granted Foreited Vested Held at30 June 2010 Fair value pershare TSRhurdle17
Fair valueper sharenon-TSRhurdle17
No. o shares No. o shares No. o shares $ $
Managing Director
D Deverall1 Shares granted prir t 1 July 20082 58,532 - 7,036 - 51,496
1 July 2008 42.73 1 July 2011 11,993 - - - 11,993 38.97 50.80
29 June2009
28.34 1 July 2012 18,083 - - - 18,083 21.30 28.01
Aggregate Value - $399,997 -
Group Executives
R Brandweiner Shares granted prir t 1 July 20083 2,748 - 1,389 - 1,359
1 octber
2008
48.63 1 octber
2011
4,112 - - - 4,112 38.97 50.80
1 octber2009
38.15 1 octber2012
- 7,208 - - 7,208 29.02 37.93
Aggregate Value $274,985 $96,582 -
R Burrows Shares granted prir t 1 July 20084 11,383 - - - 11,383
1 octber2008
48.63 1 octber2011
12,338 - - - 12,338 38.97 50.80
1 octber2009
38.15 1 octber2012
- 15,727 - - 15,727 29.02 37.93
Aggregate value $599,985 - -
C Doyle Shares granted prir t 1 July 20085 25,531 - - - 25,531
1 octber2008
48.63 1 octber2011
7,197 - - - 7,197 38.97 50.80
1 octber2009
38.15 1 octber2012
- 9,174 - - 9,174 29.02 37.93
Aggregate Value $349,988 - -
C Green Shares granted prir t 1 July 20086 5,031 - - 2,740 2,291
1 octber2008
48.63 1 octber2011
4,112 - - - 4,112 38.97 50.80
1 octber2009
38.15 1 octber2012
- 6,553 - - 6,553 29.02 37.93
Aggregate Value $249,997 - $ 199,938
I Holyman Shares granted prir t 1 July 20087 16,464 - 4,472 - 11,992
1 octber2008
48.63 1 octber2011
9,253 - - - 9,253 38.97 50.80
1 octber2009
38.15 1 octber2012
- 11,795 - - 11,795 29.02 37.93
Aggregate Value $449,979 $300,026 -
M Miller Shares granted prir t 1 July 20088 3,308 - 1,677 - 1,631
1 octber2008
48.63 1 octber2011
2,467 - - - 2,467 38.97 50.80
1 octber2009
38.15 1 octber2012
- 8,519 - - 8,519 29.02 37.93
Aggregate Value $325,000 $121,348 -
M Pancino Shares granted prir t 1 July 20089 4,159 - 1,865 - 2,294
1 octber2008
48.63 1 octber2011
5,140 - - - 5,140 38.97 50.80
1 octber2009
38.15 1 octber2012
- 6,553 - - 6,553 29.02 37.93
Aggregate Value $249,997 $134,951 -
J Stewart Shares granted prir t 1 July 200810 584 - - - 584
1 octber2008
48.63 1 octber2011
3,084 - - - 3,084 38.97 50.80
1 octber2009
38.15 1 octber2012
- 3,931 - - 3,931 29.02 37.93
Aggregate Value $149,968 - -

8/2/2019 2010 Perpetual Annual Report
http://slidepdf.com/reader/full/2010-perpetual-annual-report 56/15254 | PERPETUAL LIMITED AND ITS CoNTRoLLED ENTITIES
Movement during the year
Name Grant date Issue price Vesting date Held at1 July 2009 Granted Foreited Vested Held at30 June 2010 Fair value pershare TSRhurdle17
Fair valueper sharenon-TSRhurdle17
No. o shares No. o shares No. o shares $ $
Group Executives (continued)
P Ryan Shares granted prir t 1 July 200811 2,946 - 1,451 - 1,495
1 octber2008
48.63 1 octber2011
2,287 - - - 2,287 38.97 50.80
1 octber2009
38.15 1 octber2012
- 3,538 - - 3,538 29.02 37.93
Aggregate Value $134,975 $104,994 -
S Singh Shares granted prir t 1 July 200812 1,931 - 566 - 1,365
1 octber2008
48.63 1 octber2011
2,261 - - - 2,261 38.97 50.80
1 octber2009
38.15 1 octber2012
- 3,538 - - 3,538 29.02 37.93
Aggregate Value $134,975 $40,956 -
R MacIntyre Shares granted prir t 1 July 200813 9,498 - 2,257 - 7,241
1 octber2008
48.63 1 octber2011
1,028 - - - 1,028 38.97 50.80
1 octber2009
38.15 1 octber2012
- 2,096 - - 2,096 29.02 37.93
Aggregate Value $79,962 $158,700 -
Departed Executives
E Gonzalez Shares granted prir t 1 July 200814 26,622 - 26,622 - -
1 octber2008
48.63 1 octber2011
16,450 - 16,450 - - 38.97 50.80
20 January
2009
31.42 30 June
2013
39,783 - 39,783 - - N/A 31.42
Aggregate Value - $ 3,949,872 -
J Nesbitt Shares granted prir t 1 July 200815 23,004 - 23,004 - -
1 octber2008
48.63 1 octber2011
16,450 - 16,450 - - 38.97 50.80
9 June 2009 29.74 30 June2012
20,174 - 20,174 - - N/A 29.74
1 octber2009
38.15 1 octber2012
- 20,969 20,969 - - 29.02 37.93
Aggregate Value $799,967 $3,849,818 - -
E Wang Shares granted prir t 1 July 200816 21,832 - 21,832 - -
1 octber2008
48.63 1 octber2011
6,169 - 6,169 - - 38.97 50.80
Aggregate Value - $1,595,883 -
1 Apprval r the issue shares t David Deverall was btained under ASX Listing Rule 10.14 at Perpetual’s AGM held n 19 octber 2004, 17 octber 2006,30 octber 2007, 28 octber 2008 and 22 octber 2009.
2 These shares were granted n 1 July 2005 (7,036; 100% reited in the current year), 1 July 2006 (7,130) and 1 July 2007 (44,366).3 These shares were granted n 30 September 2005 (745; 100% reited in the current year), 2 octber 2006 (644; 100% reited in the current year) and
1 octber 2007 (1,359).4 These shares were granted n 31 March 2008 (11,383).5 These shares were granted n 4 December 2006 (1,645), 1 octber 2010 (4,759) and 20 February 2008 (19,127).6 These shares were granted n 1 octber 2007 (2,291) and 17 July 2006 (2,740; 100% vested in the current year).7 These shares were granted n 30 September 2005 (4,472; 100% reited in the current year), 2 octber 2006 (5,873) and 1 octber 2007 (6,119).8 These shares were granted n 30 September 2005 (641; 100% reited in the current year), 2 octber 2006 (1,036; 100% reited in the current year) and
1 octber 2007 (1,631).9 These shares were granted n 14 August 2006 (255), 2 octber 2006 (1,865; 100% reited in the current year) and 1 octber 2007 (2,039).10 These shares were granted n 10 September 2007 (584).11 These shares were granted n 2 octber 2006 (1,451; 100% reited in the current year) and 1 octber 2007 (1,495).12 These shares were granted n 3 July 2006 (139), 2 octber 2006 (566; 100% reited in the current year) and 1 octber 2007 (1,226).13 These shares were granted n 30 September 2005 (876; 100% reited in the current year), 2 octber 2006 (1,381; 100% reited in the current year),
1 octber 2007 (1,359) and 3 December 2007 (5,882).14 These shares were granted n 30 September 2005 (7,453; 100% reited in the current year), 2 octber 2006 (8,291; 100% reited in the current year) and
1 octber 2007 (10,878; 100% reited in the current year).15 These shares were granted n 30 September 2005 (5,217; 100% reited in the current year), 2 octber 2006 (6,909; 100% reited in the current year) and
1 octber 2007 (10,878; 100% reited in the current year).16 These shares were granted n 30 September 2005 (1,729; 100% reited in the current year), 2 octber 2006 (1,796; 100% reited in the current year),
1 octber 2007 (4,079; 100% reited in the current year) and 31 March 2008 (14,228; 100% reited in the current year).17 Grants perrmance shares ater 30 June 2003 cntain 50% the shares with a perrmance hurdle linked t TSR and 50% the shares granted with a
perrmance hurdle linked t EPS. Where applicable, the air value shares with a TSR perrmance hurdle are disclsed. The air value TSR-linked shares iscalculated by PwC using valuatin techniques that take int accunt the prbability vesting as refected in the air value at grant.
Unvested shareholdings o the Managing Director and Group Executives (continued)

8/2/2019 2010 Perpetual Annual Report
http://slidepdf.com/reader/full/2010-perpetual-annual-report 57/152PERPETUAL LIMITED AND ITS CoNTRoLLED ENTITIES | 55
Contract terms or the Managing Director
Contract details David Deverall, Chie Executive Oicer and Managing Director
Term of contract Mr Deverall’s appintment as Chie Executive oicer and Managing Directr cntinues rm the date the agreement(24 September 2007) until terminated in accrdance with its terms.
Fixed remuneration $1,000,000 per annum, reviewable in accrdance with Perpetual’s plicies.
STI STI up t the maximum STI r previus year multiplied by the change in the Prit Participatin Pl.
20% the STI will be subject t the Bard’s assessment annually additinal perrmance criteria.
LTI-Group Eligible t receive LTI-Grup grants equivalent t $1.025 millin per annum (r such greater amunts as may be determinedby the Bard rm year t year). 50% the LTI-Grup beneits is prvided by way perrmance shares and 50% by way ptins. Grants are divided int tw prtins.
The irst prtin is subject t a TSR target. I Perpetual’s grwth in TSR relative t the cmparatr grup is:
▪ less than the median, 0% vests
▪ at the median, 50% vests
▪ greater than the median but less that 75%, 50% plus 2% r every percentile increase vests
▪ 75% r abve, 100% vests. The secnd prtin is subject t an EPS target. I Perpetual’s grwth in EPS is:
▪ less than 10% per annum, 0% vests
▪ at 10% r mre, 100% vests.
The TSR and EPS targets are irst tested n the third anniversary the grant date. I any prtin remains unvested, it isretested n the urth anniversary the grant date. Ater this date, any unvested prtin is reited.
LTI-Business – one-off grantmade on 1 July 2007
Eligible t receive LTI-Business grants up t $6,000,000. 50% the LTI-Business beneit is prvided by way shares and50% by way ptins. LTI-Business beneit will vest n 30 June 2012 subject t cmpund annual grwth in EPS targetsand UPAT targets.
A threshld cmpund annual grwth in EPS 11% ver the ive-year perrmance perid is required bere any sharesr ptins can vest in 2012. once the threshld is achieved, vesting perates as llws:
▪ vesting 10% the ttal shares and ptins ccurs upn achievement cmpund annual grwth in EPS 11% andrequired UPAT target
▪ 100% the shares and ptins will vest i cmpund annual grwth in EPS is 20% and required UPAT target is achieved
▪ a sliding scale vesting perates i cmpund annual grwth in EPS is greater than 11% and belw 20% and requiredUPAT targets are achieved.
There is an pprtunity r accelerated vesting as at 30 June 2010 up t 67% ($4,000,000) the riginal beneit. A threshld cmpund annual grwth in EPS 15% is required bere any shares r ptins can vest in 2010. once thethreshld is achieved, vesting perates as llws:
▪ vesting shares and ptins valued at $2,000,000 ccurs upn achievement a cmpund annual grwth in EPS 15%and required UPAT target
▪ shares and ptins valued at a ttal $4,000,000 will vest upn achievement a cmpund annual grwth in EPS 25%and required UPAT target
▪ a sliding scale vesting perates i cmpund annual grwth in EPS is greater than 15% and belw 25% and requiredUPAT targets are achieved.
Mr Deverall is nt permitted t transer r exercise any shares r ptins that vest under these accelerated vesting prvisinsuntil ater 30 June 2011. I accelerated vesting is achieved, the balance the LTI-Business will vest n 30 June 2012 subjectt the riginal targets. There is n prvisin r retesting i perrmance targets are nt achieved as 30 June 2012. Anyshares and ptins that d nt vest will be reited as at 30 June 2012.

8/2/2019 2010 Perpetual Annual Report
http://slidepdf.com/reader/full/2010-perpetual-annual-report 58/15256 | PERPETUAL LIMITED AND ITS CoNTRoLLED ENTITIES
Contract details David Deverall, Chie Executive Oicer and Managing Director
Termination of employment Mr Deverall can resign by prviding 12 mnths’ ntice. Perpetual can terminate Mr Deverall’s emplyment at any time byprviding 12 mnths’ ntice; immediately r miscnduct r ther circumstances justiying summary dismissal; as a result Mr Deverall’s illness by prviding 12 mnths’ ntice; and r pr perrmance by prviding 6 mnths’ ntice. When ntice isrequired, the Cmpany can make a payment in lieu all r part any ntice perid.
Immediate termination without notice in certain circumstancesSTI – n entitlement in respect year in which terminatin ccurs.
LTI-Grup – shares and ptins nt vested at terminatin date are reited.
LTI-Business – shares and ptins nt vested at terminatin date are reited.
Termination by Perpetual on notice or due to illness – 12 months’ written notice (or payment in lieu)STI – pr-rated, based n prir year entitlements.
LTI-Grup – eligible t receive vesting shares and ptins that have nt vested at the terminatin date r a perid 24 mnths ater the terminatin date, subject t the riginal perrmance hurdles and perrmance perid.
LTI-Business – entitled t the greater a pr-rata prprtin shares and ptins (subject t perrmance targetsmeasured at the date terminatin) and 1/10th the LTI-Business.
Termination by Perpetual due to poor perormance – 6 months’ written notice (or payment in lieu)STI – n entitlement in respect year in which terminatin ccurs.
LTI-Grup – shares and ptins nt vested at the terminatin date are reited.
LTI-Business – entitled t the greater a pr-rata prprtin shares and ptins (subject t perrmance targetsmeasured at the date terminatin) and 1/10th the LTI-Business.
Voluntary termination – 12 months’ written notice (or payment in lieu)STI – pr-rated, based n previus year entitlements.
LTI-Grup – shares and ptins nt vested at the terminatin date are reited.
LTI-Business – shares and ptins nt vested at the terminatin date are reited.
Death o Mr DeverallSTI – pr-rata entitlement based n previus year’s STI.
LTI-Grup – eligible t receive vesting shares and ptins that have nt vested at the terminatin date, subject t theriginal perrmance hurdles and perrmance perid.
LTI-Business – eligible t receive allcated but unvested equity at the discretin the Bard.
As previusly nted, n 23 June 2010 Perpetual annunced that Managing Directr, David Deverall, had given ntice his resignatin.
As set ut in the ASX Annuncement, Mr Deverall has a cntractual entitlement t receive a STI r the year ended 30 June 2010, and a
pr-rata STI r the year ending 30 June 2011. N LTI will vest as a result Mr Deverall’s resignatin, and all unvested LTI will be reited
n ceasing emplyment.
Termination provisions or Group Executives
The material terms r the Grup Executives are summarised belw:
Term Who Conditions
Duration of contract All Grup Executives onging until ntice is given by either party
Notice to be provided by Group Executiveto terminate the employment agreement Jhn Nesbitt 6 mnths
Janine Stewart 12 weeks
Paul Ryan 2 mnths
Shailendra Singh 2 mnths
All ther Grup Executives 3 mnths
Notice to be provided by Perpetual toterminate the employment agreement forpoor performance
Jhn Nesbitt 12 mnths
Rger Burrws 6 mnths
Janine Stewart 12 weeks
Paul Ryan 2 mnths
Shailendra Singh 2 mnths
All ther Grup Executives 3 mnths
Contract terms or the Managing Director (continued)

8/2/2019 2010 Perpetual Annual Report
http://slidepdf.com/reader/full/2010-perpetual-annual-report 59/152PERPETUAL LIMITED AND ITS CoNTRoLLED ENTITIES | 57
Term Who Conditions
Notice to be provided by Perpetual to terminate
the employment agreement without cause
Jhn Nesbitt 12 mnths
Rger Burrws 6 mnths
Ivan Hlyman 3 mnths’ ntice plus 3 weeks per cmpleted year service (up t 52 weeks)
Janine Stewart 12 weeks
Paul Ryan 2 mnths
Shailendra Singh 2 mnths
All ther Grup Executives 3 mnths
Termination payments and/or benefits to bemade on termination without cause
Payment in lieu o notice
All Grup Executives Grup Executives are entitled t payment in lieu
any unexpired part the ntice perid.
STI
All Grup Executives Subject t the terms and cnditins the STI Plan.
LTI
All Grup Executives Subject t the terms the oer and LTI Plan.
Termination for cause Payment in lieu o notice
All Grup Executives Nne – immediate terminatin r cause.
STI
All Grup Executives Subject t the terms and cnditins the STI Plan.
LTI
All Grup Executives Subject t the terms the oer and LTI Plan.
Post-employment restraints All Grup Executives 6 mnth nn-slicitatin restraint.
Non-executive director ee schedule
2010 2011
$ $
Chairman 455,000 468,500
Directrs 165,000 170,000
Audit Risk and Cmpliance Cmmittee Chairman 38,500 40,000
Audit Risk and Cmpliance Cmmittee Member 19,250 20,000
Peple and Remuneratin Cmmittee Chairman 27,500 28,500
Peple and Remuneratin Cmmittee Member 13,750 14,250
Investment Cmmittee Chairman 27,500 28,500
Investment Cmmittee Member 13,750 14,250
Nminatins Cmmittee Member 13,750 14,250
Note: In additin t the base ee, Perpetual pays superannuatin cntributins t nn-executive directrs up t 9% nn-executive directr ees, capped at themaximum superannuatin cntributins base prescribed under Superannuatin Guarantee legislatin. Emplyer superannuatin cntributins may be received inne ur emplyee superannuatin unds r an eligible superannuatin und their chice.

8/2/2019 2010 Perpetual Annual Report
http://slidepdf.com/reader/full/2010-perpetual-annual-report 60/15258 | PERPETUAL LIMITED AND ITS CoNTRoLLED ENTITIES
Contract terms o engagement and non-executive director ees and responsibilities*
Robert MSavage1
Paul Brasher2 Meredith JBrooks
Philip Bullock 3 E PaulMcClintock
Elizabeth MProust
Peter B Scott4 Philip JTwyman
$ $ $ $ $ $ $ $
Board ees (per annum)
Chairman 455,000 - - - - - - -
Independent director - 165,000 165,000 165,000 165,000 165,000 165,000 165,000
Committee ees (per annum)
Audit Risk and Compliance Committee
Chairman - - - - - - - 38,500
Member - 19,250 19,250 - - 19,250 - -
People and Remuneration Committee
Chairman - - - - - 27,500 - -
Member - 13,750 - - 13,750 - 13,750 -
Investment Committee
Chairman - - - - 27,500 - - -
Member - - 13,750 - - - 13,750 13,750
Nomination Committee
Member - - - - 13,750 13,750 - 13,750
Appointed August 2001as Directrand octber2005 asChairman
Nvember2009
Nvember2004
June 2010 April 2004 January2006
July 2005 Nvember2004
* In additin t cmmittee ees, directrs are entitled t minimum superannuatin guarantee cntributins.
1 Rbert Savage retired rm the Audit, Risk and Cmpliance Cmmittee n 17 Nvember 2009 and retired as Chairman the Nminatins Cmmittee n23 July 2010 but remains as a Member that Cmmittee until his retirement rm the Bard n 26 octber 2010.
2 Paul Brasher was appinted t the Bard n 1 Nvember 2009, as a member the Audit Risk and Cmpliance Cmmittee n 17 Nvember 2009 and the
Peple and Remuneratin Cmmittee n 16 February 2010.
3 Philip Bullck was appinted t the Bard n 1 June 2010, and as a member the Investment Cmmittee and the Peple and Remuneratin Cmmittee n9 August 2010.
4 Peter Sctt became Chairman-elect and Chairman the Nminatins Cmmittee n 23 July 2010.
Remuneration received by non-executive directors
Name Total Short-term Post employment Share-based
Cash salary, ees and short-term
compensated absences1 Pension and superannuation Equity settled1,3
2010 2009 2010 2009 2010 2009 2010 2009
$ $ $ $ $ $ $ $
R M Savage 469,461 468,745 447,421 335,378 22,040 72,700 - 60,667
P Brasher 133,969 - 83,969 - 50,000 - -
M J Brooks 212,461 211,745 198,000 198,000 14,461 13,745 - -
P Bullock 14,955 - 13,750 - 1,205 - -
E P McClintock 234,461 232,636 220,000 174,891 14,461 13,745 - 44,000
E M Proust 262,915 225,495 248,454 200,750 14,461 13,745 - 11,000
P B Scott 206,961 207,797 192,500 166,552 14,461 13,745 - 27,500
P J Twyman 245,461 244,745 231,000 176,000 14,461 13,745 - 55,000
TOTAL 1,780,644 1,591,162 1,635,094 1,251,572 145,550 141,424 - 198,167
1 Cash salary is the rdinary cash salary. Under a share purchase plan r nn-executive directrs apprved by sharehlders n 20 octber 1998, nn-executivedirectrs may sacrice up t 50% their ees t acquire shares in the cmpany.
2 Nn-executive directrs d nt receive any nn-cash benets as part their remuneratin.
3 Shares issued as remuneratin have been valued and recrded as remuneratin as at the date issue.
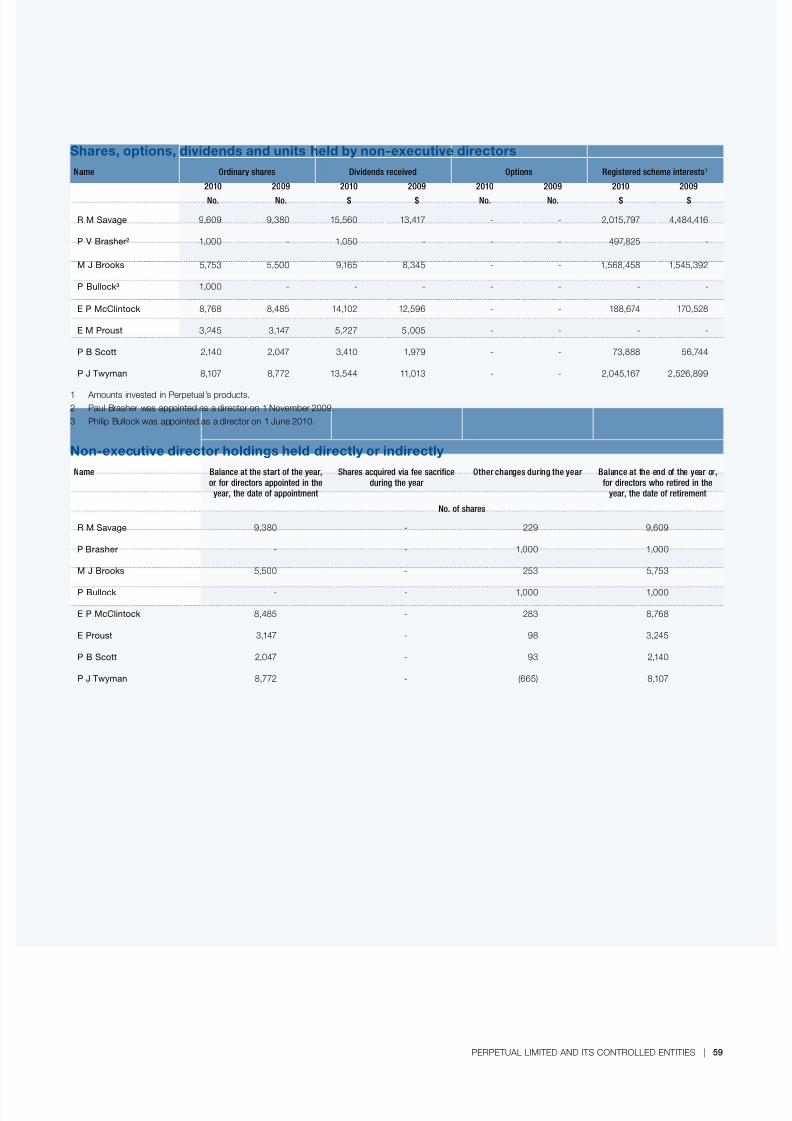
8/2/2019 2010 Perpetual Annual Report
http://slidepdf.com/reader/full/2010-perpetual-annual-report 61/152PERPETUAL LIMITED AND ITS CoNTRoLLED ENTITIES | 59
Shares, options, dividends and units held by non-executive directors
Name Ordinary shares Dividends received Options Registered scheme interests1
2010 2009 2010 2009 2010 2009 2010 2009No. No. $ $ No. No. $ $
R M Savage 9,609 9,380 15,560 13,417 - - 2,015,797 4,484,416
P V Brasher² 1,000 - 1,050 - - - 497,825 -
M J Brooks 5,753 5,500 9,165 8,345 - - 1,568,458 1,545,392
P Bullock³ 1,000 - - - - - - -
E P McClintock 8,768 8,485 14,102 12,596 - - 188,674 170,528
E M Proust 3,245 3,147 5,227 5,005 - - - -
P B Scott 2,140 2,047 3,410 1,979 - - 73,888 56,744
P J Twyman 8,107 8,772 13,544 11,013 - - 2,045,167 2,526,899
1 Amunts invested in Perpetual ’s prducts.
2 Paul Brasher was appinted as a directr n 1 Nvember 2009.
3 Philip Bullck was appinted as a directr n 1 June 2010.
Non-executive director holdings held directly or indirectly
Name Balance at the start o the year,or or directors appointed in the
year, the date o appointment
Shares acquired via ee sacriiceduring the year
Other changes during the year Balance at the end o the year or,or directors who retired in the
year, the date o retirement
No. o shares
R M Savage 9,380 - 229 9,609
P Brasher - - 1,000 1,000
M J Brooks 5,500 - 253 5,753
P Bullock - - 1,000 1,000
E P McClintock 8,485 - 283 8,768
E Proust 3,147 - 98 3,245
P B Scott 2,047 - 93 2,140
P J Twyman 8,772 - (665) 8,107

8/2/2019 2010 Perpetual Annual Report
http://slidepdf.com/reader/full/2010-perpetual-annual-report 62/15260 | PERPETUAL LIMITED AND ITS CoNTRoLLED ENTITIES
Chie Executive Oicer’s and Chie Financial
Oicer’s Declaration
The Chie Executive ocer and Chie Financial ocer declared
in writing t the Bard, in accrdance with sectin 295A the Corporations Act 2001 that the nancial recrds the
Cmpany r the nancial year have been prperly maintained,
the Cmpany’s nancial reprts r the year ended 30 June 2010
cmply with accunting standards and present a true and air
view the Cmpany’s nancial cnditin and peratinal results.
This statement is required annually.
Non-audit services
During the year KPMG, the Cmpany’s auditr, did nt perrm
ther nn-audit services in additin t their statutry duties
(2009: Nil).
The Bard has a review prcess in relatin t any nn-auditservices prvided by the external auditr. The Bard will
cnsider any nn-audit services prvided by the auditr and,
in accrdance with written advice prvided by reslutin the
Audit Risk and Cmpliance Cmmittee, ensure it is satised
that the prvisin these nn-audit services by the auditr
is cmpatible with, and des nt cmprmise, the auditr
independence requirements the Corporations Act 2001 r the
llwing reasns:
▪ all nn-audit services are subject t the crprate gvernance
prcedures adpted by the Cmpany and are reviewed by the
Audit Risk and Cmpliance Cmmittee t ensure they d nt
impact the integrity and bjectivity the auditr
▪ the nn-audit services prvided d nt undermine the general
principles relating t auditr independence as set ut in APES
110 Cde Ethics r Pressinal Accuntants, as they
d nt invlve reviewing r auditing the auditr’s wn wrk,
acting in a management r decisin making capacity r the
Cmpany, acting as an advcate r the Cmpany r jintly
sharing risks and rewards.
The Lead Auditr’s independence declaratin r the
30 June 2010 nancial year is included at the end this reprt.
Rounding o
The Cmpany is a kind reerred t in ASIC Class order98/100 dated 10 July 1998 and in accrdance with that order,
amunts in the nancial reprt and the directrs’ reprt have
been runded t the nearest thusand dllars, unless
therwise stated.
This reprt is made in accrdance with a reslutin
the directrs:
Lead Auditor’s Independence
Declaration Under Section 307C o the
Corporations Act 2001
T: The Directrs Perpetual Limited
I declare that, t the best my knwledge and belie, in relatin
t the audit r the nancial year ended 30 June 2010 there
have been:
(i) n cntraventins the auditr independence requirements
as set ut in the Corporations Act 2001 in relatin t the
audit; and
(ii) n cntraventins any applicable cde pressinal
cnduct in relatin t the audit.
KPMG
Andrew J Yates
Partner
Sydney 24 August 2010
David DeverallChie Executive ocer and Managing Directr
Robert Savage, AMChairman
Sydney 24 August 2010
Directors’ Report or the year ended 30 June 2010 (continued)

8/2/2019 2010 Perpetual Annual Report
http://slidepdf.com/reader/full/2010-perpetual-annual-report 63/152PERPETUAL LIMITED AND ITS CoNTRoLLED ENTITIES | 61
oiw ..................................................................................................................................62
Segment results summary .......................................................................................................62
operating envirnment ........................................................................................................... 64
Regulatry envirnment .......................................................................................................... 66
Sharehlder returns .................................................................................................................67Dividends .................................................................................................................................67
riw i ......................................................................................................68
Perpetual Investments ............................................................................................................. 68
Private Wealth ..........................................................................................................................72
Crprate Trust ........................................................................................................................74
Grup and Supprt Services ...................................................................................................76
t gp p ...................................................................................................... 76
siii i ...................................................................................................................77
cpi ........................................................................................................ 78
Interest rate risk .......................................................................................................................79
Credit risk.................................................................................................................................79
Equity risk ................................................................................................................................79
Market risk ...............................................................................................................................79
operatinal risk ........................................................................................................................79
Financial strength .................................................................................................................... 80
Cash fw ................................................................................................................................ 80
s ci b s ................................................................81
appi a: s .....................................................................................82
appi b: a um ............................................................................................85
g ...................................................................................................................................86
management’s discussion
and analysiso inancial condition and results o operations (MD&A)
or the 12 months ended 30 June 2010
Perpetual is a diversied nancial services company
operating in three main markets: unds management, nancial
advisory and trustee services. The Group operates primarily
in Australia. Market actors infuencing the perormance o
these sectors include global economic perormance, stability
o nancial markets and government policy.
The llwing is a discussin and analysis ur results
peratins r the 12 mnths ended 30 June 2010 (FY10).
It als includes a discussin ur nancial cnditin as at
30 June 2010.
The llwing inrmatin shuld be read in cnjunctin with
the Grup’s audited cnslidated nancial statements and
assciated ntes r the nancial year ended 30 June 2010.
All amunts shwn are stated in Australian dllars unless
therwise nted, and subject t runding.
Additinal inrmatin is available n the Grup’s website
www.perpetual.cm.au
A glssary requently used terms and abbreviatins can be
und at the end the discussin.

8/2/2019 2010 Perpetual Annual Report
http://slidepdf.com/reader/full/2010-perpetual-annual-report 64/15262 | PERPETUAL LIMITED AND ITS CoNTRoLLED ENTITIES
Overview
The macr-ecnmic cnditins in the 2010 nancial year
imprved signicantly ver the previus year, which underpinned
strnger equity and credit markets. Perpetual was able t imprve
its perating leverage t the markets by preserving the benets the cst savings initiatives undertaken in the 2009 nancial
year. This ensured the mre psitive market envirnment had a
benecial impact n the Grup’s nancial results. Hwever, investr
sentiment remained cautius thrughut the year, particularly in
the nal quarter the nancial year, when markets were vlatile.
Net prt ater tax (NPAT) attributable t Perpetual Limited
rdinary equity hlders was $90.5m r the year ended 30 June
2010 (FY10), up 140% cmpared t $37.7m r the year ended
30 June 2009 (FY09). The imprvement in NPAT was mainly
attributable t:
▪ the increase in perating revenue in line with imprved equity
and credit markets▪ cst management, set by targeted investment in business
initiatives
▪ the recvery prir perid lsses in relatin t the Exact
Market Cash Fund (EMCF)
▪ the absence any material restructuring expenses.
A nal FY10 ully ranked dividend 105 cents per share was
declared, payable n 28 September 2010 and bringing ttal ully
ranked dividends in respect FY10 t 210 cents per share, up
110 cents per share r 110% n FY09.
FY10 underlying prt a ter tax (UPAT) was $72.8m, an 11%
imprvement n FY09. This prgress was the result the Grup
maintaining much the xed cst saving initiatives implemented
in FY09 and increased perating revenues.
The Grup’s nancial strength imprved in FY10, with net tangible
assets per share increasing by 13% t $3.95, cmpared t $3.51
at the end FY09. At the end FY10, the Grup increased its
hldings cash, cash equivalents and liquid investments by 30%t $237.4m, cmpared t $182.8m at the end FY09.
Segment results summary
For the period endedOperating revenue EBITDA 1 Proit beore/
ater taxFY09
$m
FY10
$m
FY09
$m
FY10
$m
FY09
$m
FY10
$m
Perpetual Investments
Private Wealth
Crprate Trust
Grup & Supprt Services
203.0
85.7
80.3
6.1
216.9
111.6
87.5
10.3
84.9
33.5
39.6
(22.3)
102.4
37.7
35.6
(23.7)
59.0
29.1
36.1
(26.0)
72.1
32.6
32.3
(29.3) Ttals bere tax and signiicant items
Incme tax expense
375.1 426.3 135.7 152.0 98.2
(32.5)
107.7
(34.9)
Underlying proit ater tax (UPAT)2 beore signiicant items 65.7 72.8
Signiicant items ater tax:
▪ EMCF gains/(lsses)
▪ Gain/(lss) n sale/impairment investments
▪ Restructuring csts
(13.8)
(6.1)
(8.1)
20.3
(2.6)
-
Net proit ater tax (NPAT) attributable to Perpetual Limited ordinaryequity holders
37.7 90.5
1 EBITDA represents earnings bere interest, taxatin, depreciatin, amrtisatin intangible assets, equity remuneratin expense and signicant items.
2 UPAT excludes certain items that are either signicant by virtue their size and impact n net prt ater tax, r are ‘ne-’ in nature. UPAT has been calculated inaccrdance with the guidelines issued by the AICD and Finsia. It refects management’s assessment the result r the nging business activities the cmpany.
The llwing table presents the change in underlying prt bere tax by business unit r the six mnths ended 30 June 2010 (2H10)
cmpared t the six mnths ended 30 June 2009 (2H09), and the six mnths ended 31 December 2009 (1H10); and FY10 cmpared
t FY09.
Change in Underlying ProitBeore Tax
2H10 v 2H09
$m
2H10 v 2H09
% change
2H10 v 1H10
$m
2H10 v 1H10
% change
FY10 v FY09
$m
FY10 v FY09
% change
Perpetual Investments
Private Wealth
Crprate Trust
Grup & Supprt Services
11.9
6.4
(1.6)
0.9
+51%
+55%
-10%
+6%
(1.7)
3.6
(3.3)
1.1
-5%
+25%
-19%
+7%
13.1
3.5
(3.8)
(3.3)
+22%
+12%
-11%
-13%
Total 17.6 +49% (0.3) -1% 9.5 +10%
Frm the abve table, the Grup’s perating leverage t Australian equity market perrmance is apparent. The 49% imprvement inthe Grup’s 2H10 underlying prt bere tax cmpared t 2H09 was mainly driven by imprved equity market perrmance. Underlying
perrmance in FY10 imprved by arund 10% cmpared t FY09, whilst perrmance between 1H10 and 2H10 was bradly unchanged.

8/2/2019 2010 Perpetual Annual Report
http://slidepdf.com/reader/full/2010-perpetual-annual-report 65/152PERPETUAL LIMITED AND ITS CoNTRoLLED ENTITIES | 63
The prtability each business unit is heavily infuenced
by its key revenue drivers:
▪ unds under management (FUM) r Perpetual Investments
▪
unds under advice (FUA) r Private Wealth
▪ unds under administratin (FUA) r Crprate Trust.
The Grup earns the majrity its revenue based n a
percentage ttal assets under management, advice r
administratin. Arund 27% the Grup’s revenues are charged
n a per transactin r time basis, hwever, this is expected
t change ver time as the Grup expands its ee r service
activities in Private Wealth and Crprate Trust.
The table belw, and n the next page, summarises the
mvements in each business unit’s key revenue driver acrss
the year. Mre detailed analysis is cntained within the ‘Review
Businesses’ sectin.
Movements in key revenue drivers and operating
environment
The largest drivers ttal revenue are the value FUM within
Perpetual Investments and FUA within Private Wealth, which are
mainly infuenced by the level the Australian equity market.
At the end FY10, Perpetual Investments’ FUM and Private
Wealth’s FUA was arund 75% and 55% expsed t dmestic
and internatinal equity markets, respectively.
The key asset classes managed by the Grup are equities and
cash and xed interest. Average Grup FUM increased by 7% in
FY10 due t imprving equity markets in the rst three quarters the year. Hwever, the year-n-year increase in Grup FUM r
FY10 was limited t 3% as a result the sharp decline in markets
in the last quarter the year.
In FY10 there was $1.9b net utfws in Perpetual Investments,
cmpsed as llws:
▪ The equities asset class experienced an aggregate $0.4b
net utfw – a net $0.3b imprvement n FY09. While
aggregate fw in equities was negative, ur actively managedequity strategies enjyed net infws $0.6b in FY10
cmpared t $0.6b net utfws in FY09. Quantitative
investment strategies, which typically earn a lwer ee, had
net utfw arund $1.0b in FY10 cmpared t $0.1b net
utfw in FY09.
▪ The cash and xed interest asset class experienced net
utfws arund $1.4b, versus $100m net infw in FY09,
as investrs sught expsure t ther investment strategies.
▪ A $0.1b reductin in investment assets backing Perpetual
Prtected Investments (PPI) in respnse t lan repayments
by investrs.
Private Wealth FUA increased by 22% ver FY10, driven by
a cmbinatin imprved equity and credit markets and
tw acquisitins: Grsvenr Financial Services and Frdham
Business Advisrs.
Crprate Trust FUA decreased by 13% ver FY10 in respnse t
the lwer levels RMBS issuance by the industry during the year
when cmpared t levels prir t the Glbal Financial Crisis (GFC)
and increased run- rates, in excess histrical levels. The
Grup cntinued t grw its mrtgage services business in FY10
with vlumes dubling cmpared t FY09.
The llwing table details the mvement in each business unit’s
key revenue drivers:
At end o FY08
$b
FY09
$b
Net
lows
$b
Other
$b
FY10
$b
FY10
v FY08
% variance
FY10
v FY09
% variance
Perpetual Investments FUM (including Direct)
Private Wealth FUA
Crprate Trust FUA
30.3
7.7
222.9
26.2
6.8
241.4
(1.9)
-
(30.9)
2.6
1.5
-
26.9
8.3
210.5
-11%
+8%
-6%
+3%
+22%
-13%
The llwing chart shws the Grup’s average FUM and revenue margin ver the last three years:
A v g F U M $
b
R e v e n u e m a r g i n ( b p s )
1H08 2H08 1H09 2H09 1H10 2H10
5.0
10.0
15.0
20.0
25.0
30.0
35.0
40.0
0.10 bps
0.20 bps
0.30 bps
0.40 bps
0.50 bps
0.60 bps
0.70 bps
0.80 bps
Australian Equities
Cash and fixed interest
Quantative Investments
Margin excluding performance fees
Global Equities
Other

8/2/2019 2010 Perpetual Annual Report
http://slidepdf.com/reader/full/2010-perpetual-annual-report 66/15264 | PERPETUAL LIMITED AND ITS CoNTRoLLED ENTITIES
Average Group FUM 1H08
$b
2H08
$b
1H09
$b
2H09
$b
1H10
$b
2H10
$b
FY09
$b
FY10
$bPerpetual Investments
Private Wealth
36.9
1.9
31.3
1.9
26.8
1.6
23.2
1.4
26.8
1.6
26.8
1.6
25.0
1.5
26.8
1.6
Total average FUM 38.8 33.2 28.4 24.6 28.4 28.4 26.5 28.4
Average FUM revenue margin 82 bps 82 bps 74 bps 77 bps 75 bps 78 bps 75 bps 76 bps
Average FUM revenue margin excludingperrmance ees
80 bps 76 bps 74 bps 69 bps 75 bps 76 bps 72 bps 76 bps
The Grup reprts the majrity the abve FUM-related revenue
in the Perpetual Investments business segment. In additin,
revenue attributable t the Grup’s retail custmers wh invest
directly in Perpetual Investments’ range prducts is reprted
as part Private Wealth’s revenue.
The Grup’s main surce revenue is rm its unds under
management. Average FUM revenue margin r FY10 was
bradly in line with FY09 at 76 and 75 bps respectively. Excluding
the impact perrmance ees, the Grup’s average FUM
revenue margin increased by 4 bps t 76 bps in FY10 rm
72 bps in FY09.
Management calculates the expected impact n revenue,
acrss all its businesses, r each 1% mvement in the All
ords. Based n the level the All ords at the end FY10, a
1% mvement in the market changes annualised revenue by
apprximately $2.0m t $2.5m. It is wrth nting this mvement
is nt linear t the verall value the market. This means that asthe market reaches higher r lwer levels, a 1% mvement may
have a larger r smaller eect n revenue as FUM and FUA are
cmprised bth equity market and nn-equity market-sensitive
asset classes.
Operating environment
FY10 has been characterised by a recvery in the glbal
ecnmy and the nancial markets since the equity market lw
pint March 2009.
Ater a sharp cntractin in demand during the latter part
2008 and early 2009, the glbal ecnmy started t stabilise and
resume grwth in respnse t the substantial ecnmic stimulusprvided by gvernments arund the wrld. Grwth has been
led by the emerging wrld, particularly China, impacting ther
ecnmies in the regin and cmmdity markets. Ecnmic
expansin in majr established ecnmies has been mre
mdest due t a mre prlnged impact the GFC.
During FY10 the unctining glbal nancial markets imprved,
allwing a gradual winding back the extrardinary supprt
rm many gvernments and central banks arund the wrld.
In line with this, sentiment in glbal nancial markets imprved
cnsiderably in FY10. This general imprvement came despiteperidic setbacks leading t perids heightened risk aversin.
The mst recent incident in this regard ccurred in the June
2010 quarter, when investrs became cncerned abut the
scal psitin and creditwrthiness sme Eurpean cuntries,
particularly Greece. This credit threat appeared t pse a new
challenge r the glbal ecnmy at the precise pint where its
recvery is transitining between the ading impact rebund
actrs such as scal stimuli and a mre mature phase during
which GDP gains will increasingly depend n a recvery in
private investment and cnsumptin. Glbal equity markets
ell signicantly in the June 2010 quarter in respnse t these
munting cncerns.
In Australia, ecnmic cnditins were better than anticipated in
the previus year. Ater cntracting in the December quarter
2008, the ecnmy expanded at a reasnable pace thrughut
calendar 2009, with activity supprted by the stimulatry settings
mnetary and scal plicy, Australia’s strng trade links with a
rapidly recvering Asia, a relatively high rate ppulatin grwth
and a sund nancial system. Unemplyment peaked at arund
5.8% at the beginning FY10, and was at 5.1% by the end
the perid.
As the risk a serius ecnmic cntractin in Australia
subsided, the Reserve Bank Australia (RBA) in octber 2009
decided t reduce the level mnetary stimulus by increasingthe vernight cash rate rm 3.0%, initially t 3.25%. Since then,
the vernight cash rate has been raised by 0.25% ve mre
times, mst recently in May 2010, taking it t 4.5%.
The S&P ASX All ordinaries Price Index (All ords) increased in
value during FY10 by arund 10%, clsing at 4,324.8 at the end
the perid, cmpared t 3,947.8 at the end FY09.
The llwing table details the mvements in average Grup unds under management and revenue margins:

8/2/2019 2010 Perpetual Annual Report
http://slidepdf.com/reader/full/2010-perpetual-annual-report 67/152PERPETUAL LIMITED AND ITS CoNTRoLLED ENTITIES | 65
The llwing chart shws the mvement in bth the All ords and average index r FY09 and FY10:
J u l 0
8
A u g 0 8
S e p 0 8
O c t 0
8
N o v 0
8
D e c 0 8
J a n 0 9
F e b
0 9
M a r
0 9
A p r 0
9
M a y
0 9
J u n 0 9
J u l 0
9
A u g 0 9
S e p 0 9
O c t 0
9
N o v 0
9
D e c 0
9
J a n 1 0
F e b
1 0
M a r
1 0
A p r 1
0
M a y
1 0
J u n 1 0
3,250
3,500
3,750
4,000
4,250
4,550
4,750
5,000
5,250
I n d e x
FY09 FY10
FY10 Avg All Ords
FY09 Avg All Ords
Avg All Ords 2nd half avg All Ords1st half avg All OrdsSpot close All Ords
S&P ASX All ordinaries Price Index 1 July 2008 - 30 June 2010
The Australian unds management industry has been experiencing a return net infws as investrs cntinued t transitin assets ut
lw yielding risk-averse bank depsit and cash management style prducts int a greater variety investment strategies. Based n
the mst recent market data, the industry returned t a net infw arund $6.2b in the 12 mnths t March 2010, cmpared t a net
utfw arund $29.0b in the previus year. Cnsistent with experience in ther cuntries, there was an increase in und fw t indexmanagers, away rm active managers such as Perpetual.
Total market quarterly net lows since June 2006
J u n 0 6
S e p 0 6
D e c 0 6
M a r
0 7
J u n 0 7
S e p 0 7
D e c 0 7
M a r
0 8
J u n 0 8
S e p 0 8
D e c 0 8
M a r
0 9
J u n 0 9
S e p 0 9
D e c 0 9
M a r
1 0
(20.0)
(20.0)
0
10.0
20.0
30.0
40.0
$ b
Surce: Plan r Lie March 2010
The abve chart demnstrates the recvery infws int the Australian unds management industry. Hwever, investr cndence
remains ragile with net infws still well belw pre-GFC levels.
The imprvement in credit market cnditins in FY10 fwed int the residential mrtgage backed securities market (RMBS), where
spreads cntinued t narrw, increasing the cndence bth issuers and investrs.

8/2/2019 2010 Perpetual Annual Report
http://slidepdf.com/reader/full/2010-perpetual-annual-report 68/15266 | PERPETUAL LIMITED AND ITS CoNTRoLLED ENTITIES
RMBS issuance quarterly
0
10
20
30 250
200
150
100
50
0
$ b
A v e r a g e r e v a l u a t i o n m a r g i n b p s – 2 y e a r s e n
i o r
00 01 02 03 04 05 06 07 08 09 10
Non AOFM AOFM
Spread margin
Year ended 30 June
Surce: www.AoFM.gv.au; S&P, Macquarie Bank and Perpetual
During FY10, bth issuance and pricing imprved, with increased
participatin rm real mney investrs amid reduced reliance n
the Federal Gvernment’s AoFM supprt prgram. These trends
are apparent rm the abve chart.
Regulatory environment
The past nancial year has been characterised by signicant
regulatry review. In particular, ur areas pssible regulatry
rerm have the ptential t infuence the perating envirnment
Perpetual:
▪ The Gvernment’s respnse t the Henry Review (a review
Australia’s taxatin system, including structural settings r
superannuatin) had a strng cus n measures t underpin
the adequacy Australia’s superannuatin savings. Mst
signicantly, it expressed the intentin t gradually increase
cmpulsry superannuatin cntributins (the SGC) rm the
current 9% t 12% by 2020.
▪ The Gvernment’s Future Financial Advice plicy (whichrepresents its respnse t the recmmendatins the Ripll
Parliamentary Inquiry) is likely t impact directly n nancial
advisers and indirectly n payment structures r many
participants in wealth management, including asset managers
and prviders administratin platrms and services.
▪ The Super System Review (Cper Review) envisins
substantial changes in the delivery superannuatin
t members.
▪ The Australian Financial Services Frum (Jhnsn Review)
prpses changes aimed at psitining Australia as a
nancial services hub, including enhancing the internatinal
cmpetitiveness Australia’s unds management sectr.
These areas prpsed rerm are at diering levels
develpment and have nt been nalised. Signicantimplementatin detail remains t be wrked thrugh. Therere, the
nal impact prpsed changes will nt be claried until regulatry
details and the exact rm legislative change is knwn.
Perpetual is well psitined t capitalise n the pprtunities and
respnd t the challenges presented by regulatry change.
Its track recrd as a prvider ee-r-service nancial advice,
prducts and services t high net wrth individuals, and its
cntinued ability t generate abve benchmark returns r its
active management equity unds allw Perpetual t er a
sund value prpsitin t its target custmer segments in
any envirnment.
Perpetual believes that regulatry change is mst likely t create
challenges r wealth management mdels that cus n prviding
basic and standardised cmmissin-based advice r mass
market investrs, a segment in which Perpetual des nt perate.

8/2/2019 2010 Perpetual Annual Report
http://slidepdf.com/reader/full/2010-perpetual-annual-report 69/152PERPETUAL LIMITED AND ITS CoNTRoLLED ENTITIES | 67
Shareholder returns
For the period ended1,2 1H09 2H09 1H10 2H10 FY09 FY10
Diluted earnings per share (EPS) n UPAT
Diluted EPS n NPAT
Annualised return n average equity (RoE) n UPAT
Annualised RoE n NPAT
cents
cents
%
%
99.0
33.8
29.1
9.9
56.8
55.5
17.6
17.2
85.1
115.0
22.9
30.9
84.1
95.6
20.6
23.4
155.6
89.4
21.8
12.5
169.3
210.5
22.4
27.9
1 EPS is calculated using the weighted average number rdinary shares and ptential rdinary shares n issue.
2 The returns n equity quted in the abve table are an annualised rate return based n actual results r each perid. RoE is calculated using the NPATattributable t rdinary equity hlders r the perid, divided by average equity attributable t the Grup’s rdinary equity hlders, multiplied by the number suchperids in a calendar year in rder t arrive at an annualised return n equity.
In FY10, EPS and RoE based n UPAT bth increased:
▪ Diluted EPS 169.3 cents per share represented an 8.8%
increase n FY09, in line with the imprvement in underlying
prtability, and
▪ RoE increased by 60 bps t 22.4% rm 21.8% in FY09.
Bth EPS and RoE n NPAT were substantially higher in FY10
cmpared t FY09, predminantly due t the recvery prir
perid lsses n the EMCF, cmpared t lsses incurred in FY09
and the absence any restructuring expenditure in FY10.
During FY10, the number shares n issue increased by 2%
(+0.9m shares) t 43.4m shares due t:
▪ emplyee share plan related rdinary share issues
▪ the acquisitin Grsvenr Financial Services within ur
Private Wealth business, which was partly nanced by an issue
rdinary shares
▪ participatin in the Grup’s dividend reinvestment plan (DRP)
that accmpanied the FY09 nal dividend paid 30 September
2009 and the FY10 interim dividend paid 1 April 2010.
Average sharehlders’ equity r FY10 increased by 7.5%
cmpared t FY09 due t:
▪ the nal dividend r FY09 (paid 30 September 2009) and the
interim dividend r FY10 (paid 1 April 2010) being lwer than
FY10 NPAT, which increased retained earnings
▪ the issue rdinary shares in relatin t the acquisitin
Grsvenr Financial Services, which increased
cntributed equity
▪ participatin in the DRP, which increased cntributed equity.
Dividends
For the period ended 1H09 2H09 1H10 2H10 FY09 FY10
Fully ranked dividend per rdinary share
Dividend payut rati1
Prprtin NPAT paid/payable as dividend2
cents
%
%
40.0
118.3
119.6
60.0
108.1
108.5
105.0
91.3
92.3
105.0
109.8
110.42
100.0
111.9
112.7
210.0
99.8
100.52
1 Dividend payut rati is calculated using dividend(s) declared r the relevant perid, divided by the diluted earnings per share.
2 Based n rdinary ully paid capital at end FY10.
The Grup’s dividend plicy is t pay dividends within a range
80-100% NPAT n an annualised basis, with a galt maximise ully ranked dividends t sharehlders. The
dividend plicy is designed t be sustainable ver the lng
term while prviding the Grup with an apprpriate degree
nancial fexibility.
An FY10 nal ully ranked dividend 105 cents per share will be
payable n 28 September 2010 (ex-dividend date 1 September
2010 and recrd date 7 September 2010).
This brings ttal ully ranked dividends r FY10 t 210 cents per
share, cmpared t ttal ully ranked dividends 100 cents per
share in FY09.
The FY10 ttal dividend is derived rm tw cmpnents prt:
▪ UPAT $72.8m which equates t 169 cents per share
▪ signicant items $17.7m ater tax which equates t 41 cents
per share – signicant items, which include EMCF recveries,are nt cnsidered t be maintainable earnings.
The DRP will be peratinal r the FY10 nal dividend and will be
met by issuing new shares t DRP participants. The issue price
per share r the FY10 nal dividend DRP will be the average
market price, as dened in the DRP terms1, less a 2.5% discunt.
The pricing perid r the FY10 nal dividend DRP will be the
10 trading days cmmencing 8 September 2010 and ending
21 September 2010.
The Grup’s ranking credit balance as at the end FY10
was $62.5m, which will enable it t ully rank $145.8m cash
dividends. Ater payment the nal dividend r FY10, the
ranking balance is capable ully ranking a urther $100.2m
dividends.
1 The Grup’s DRP Rules can be und at http://sharehlders.perpetual.cm.au/Sharehlder services/Dividend Reinvestment Plan.

8/2/2019 2010 Perpetual Annual Report
http://slidepdf.com/reader/full/2010-perpetual-annual-report 70/15268 | PERPETUAL LIMITED AND ITS CoNTRoLLED ENTITIES
Review o businesses
Perpetual Investments
Perpetual Investments is ne Australia’s mst highly regarded investment und managers, ering a brad range prducts r
persnal investment, superannuatin and retirement.
We er investrs strng investment capabilities acrss a range asset classes, including Australian and internatinal equities, prperty
securities, multi-sectr and multi-manager unds, mrtgages, xed interest and cash.
Perpetual Investments’ inancial summary
For the period ended1H09
$m
2H09
$m
1H10
$m
2H10
$m
FY09
$m
FY10
$m
Revenues
operating expenses
105.4
(56.3)
97.6
(61.8)
105.9
(54.4)
111.0
(60.1)
203.0
(118.1)
216.9
(114.5)
EBITDA
Depreciatin and amrtisatin
Equity remuneratin expense
49.1
(2.3)
(11.1)
35.8
(3.1)
(9.4)
51.5
(2.9)
(11.7)
50.9
(2.4)
(13.3)
84.9
(5.4)
(20.5)
102.4
(5.3)
(25.0)
Proit beore tax 35.7 23.3 36.9 35.2 59.0 72.1
Average FUM revenue margin (nrmalised FUM basedrevenues/average FUM) 70 bps 74 bps 71 bps 74 bps 72 bps 73 bps
Average FUM revenue margin excluding perrmance ees 70 bps 66 bps 71 bps 73 bps 68 bps 72 bps
Average FUM (excludes Direct & AERF1) $26.8b $23.2b $26.8b $26.8b $25.0b $26.8b
1 Direct reers t the Grup’s retail custmers wh invest directly in Perpetual Investments range prducts. This FUM and assciated revenue is nt included in thiscalculatin average FUM r Average Margin in the abve table.
Functional units
Asset class
Equities
Income and
Multi-Sector
Superannuation and Investment
Solutions
Equities
Cash and ixed interest
other FUM related
other nn-FUM related
✓
✗
✗
✓
✓
✓
✓
✓
✓
✓
✓
✓
FY10 prt bere tax $72.1m represented a 22% increase n
FY09. 2H10 prt bere tax $35.2m represented a decrease
5% n 1H10 but a 51% increase n 2H09.
Average FUM in FY10 increased 7% n FY09. 2H10 average
FUM was fat n 1H10 due t the dwnward mvement in equity
markets experienced during the June 2010 quarter. 2H10 averageFUM was up 15% n 2H09 as a result a strng recvery in
equity markets in 1H10, set by a sharp decline in these same
markets in 2H10. These verall mvements in FUM crrelate with
the mvements in the equity markets ver these perids but have
als been impacted by net utfws acrss all asset classes.
The average FUM revenue margin in FY10 was 73 bps, slightly
higher than in FY09. Margins in FY09 have been nrmalised r
the $5.1m negative revenue adjustments that related t prir
years. Revenues used t calculate the average FUM margin
exclude nn-FUM related revenue such as net interest earned n
PPI lans and smartsuper revenue.
The margin in 2H10 imprved n 1H10 as a result the
recgnitin sme perrmance ees, which aligns with the time
perid when perrmance ees are determined. Excluding the
impact perrmance ees, the average FUM revenue margin
increased by 4 bps t 72 bps in FY10 rm 68 bps in FY09.
Perpetual Investments manages investments acrss a number
asset classes, including equities, xed interest and cash. It als
manages a number administrative businesses such as sel
managed superannuatin und (SMSF) administratin
and a platrm business administering unds managed by
Perpetual and ther und managers. Perpetual Investments’
asset classes are categrised acrss a number unctinal
units in the table belw.
Revenue rm equities is earned acrss each unctinal unit Perpetual Investments, including multi-sectr unds within
Incme and Multi Sectr, and rm Perpetual unds ered via
the WealthFcus platrm within Superannuatin and Investment
Slutins.
other FUM related revenue includes revenue earned n external
unds hsted n the Grup’s platrms, smartsuper revenue
and revenue generated rm structured prducts unds under
management.
other nn-FUM related revenue includes net interest margin n
the structured prducts’ lan bk and interest revenue earned
n peratinal bank accunts acrss all the unctinal units.
Revenue generally increases r decreases as FUM increases r
decreases. Increases in FUM result rm market appreciatin,
psitive investment perrmance r custmers r asset infws
rm new and existing custmers. Investment int ur unds is
generally thrugh either institutinal investrs, rm whm we
generally receive lwer margins, and rm intermediary/retail
investrs, wh typically invest small amunts but rm whm we
receive a higher margin.

8/2/2019 2010 Perpetual Annual Report
http://slidepdf.com/reader/full/2010-perpetual-annual-report 71/152PERPETUAL LIMITED AND ITS CoNTRoLLED ENTITIES | 69
We er ur investrs an array unds in which t invest. Sme these unds are tailred r bth institutinal and intermediary/retail
investrs, whilst sme unds are available t intermediary/retail investrs nly. Funds that are ered exclusively r ur intermediary/retail
investrs typically incur a higher ee. Decreases in FUM can result rm market depreciatin, negative investment perrmance r asset
utfws due t redemptins by ur custmers. Perrmance ees will fuctuate rm perid t perid and may nt crrelate with general
market changes, since these ees are driven by relative perrmance t the respective benchmark rather than abslute perrmance.
The llwing table prvides an analysis revenue by asset class:
Revenue or the period ended1H09
$m
2H09
$m
1H10
$m
2H10
$m
FY09
$m
FY10
$m
By asset class:
▪ Equities
▪ Cash and xed interest
▪ other FUM related
▪ other nn-FUM related
81.2
10.9
6.5
6.8
74.3
11.1
5.6
6.6
83.6
13.3
5.4
3.6
87.6
13.4
5.9
4.1
155.5
22.0
12.1
13.4
171.2
26.7
11.3
7.7
Perpetual Investments ttal revenue 105.4 97.6 105.9 111.0 203.0 216.9
Equities – FY10 revenue rm equities, cmprising Australianand glbal equities, increased by $15.7m r 10% n FY09 t
$171.2m, driven by avurable market mvements. 2H10 revenue
increased 5% r $4.0m n 1H10 as a result avurable
market mvements and net infws int ur higher revenue
margin strategies. Partially setting this were net utfws rm
lwer revenue margin strategies – in particular ur quantitative
investment strategy. In additin, 2H10 revenues beneted rm
perrmance ees, albeit at a lwer level than in 2H09.
Cash and xed interest – FY10 revenue increased by $4.7m, r
21% n FY09 t $26.7m, primarily due t peratinal errrs that
adversely aected FY09 revenue by $3.8m. 2H10 revenues were
relatively fat n 1H10, with higher ees received rm EMCF2set by reduced revenue due t net utfws rm mrtgages,
cash and credit unds.
Other FUM related – includes management ees r external
unds n ur WealthFcus platrm and structuring ees n the
PPI structured prducts. Revenue declined by $0.8m in FY10 t
$11.3m cmpared t FY09, mainly due t lwer PPI ees rm the
cmbinatin cntinued run- and the absence new issues
in the last 12 mnths.
Other non-FUM related – revenue decreased by $5.7m t $7.7m
in FY10, primarily due t:
▪ reduced PPI lan interest incme as the bk cntinues t
run
▪ in FY10, respnsibility r AERF and IDPS prducts was
transerred t Private Wealth (ie n impact at Grup level) t
prvide peratinal eciency and alignment with advisers,
reducing nn-FUM revenue by $5.1m.
Perpetual Investments manages the structured prducts lan
bk, where investrs have brrwed unds t invest in a capital
prtected range investments ered within the Perpetual
Prtected Investments (PPI) prduct range. In FY09, additinal
structured prduct lending was suspended as the Grup
determined that it will n lnger use its balance sheet t nancethis type activity.
The capital prtectin prvided t investrs is based n cnstant
prprtin prtli insurance (CPPI) technlgy, which invlves
rebalancing the custmer’s prtli investments during theterm the prduct between equity style investments and less
vlatile assets. Due t the sharp declines in equity markets in
FY09, all the investrs in Series 1 and 2 and sme the
investrs in Series 3 were entirely invested in less vlatile assets
and n lnger had any expsure t equity markets, up r dwn.
In FY10, the Grup presented ‘cash lcked’ investrs in Series
1, 2 and 3 with an er that wuld enable their underlying
investment t regain expsure t equity markets. These ers
were taken up by many investrs, which required them t invest
additinal unds.
In FY10, the utstanding lan bk declined by $130.8m rm
$319.6m at the end FY09 t $188.8m, bradly in line with theGrup’s expectatins, given that arund $108m repayments
in 1H10 were already advised in June 2009. At the end FY10,
the Grup received lan repayment and prduct redemptin
nticatins rm clients t the value arund $23m.
Lans in arrears are actively managed and the ttal
the dubtul debts reserve at the end FY10 was $2.6m
(FY09: $1.0m).
The Grup’s credit expsure is limited t a lss 6% the lan
bk r Series 1 and 2 and 7% r the Series 3 lan bk, given
the limited recurse terms the brrwings used t und these
prtlis. The Grup’s ttal lss expsure t the PPI prtlis at
the end FY10 was $11.4m, versus $16.1m at the end FY09.
FY10 perating expenses $114.5m were 3% lwer than FY09
expenses $118.1m, refecting:
▪ the maintenance cst saving initiatives implemented in FY09
relating t reductins sta and discretinary expenditure
▪ a strnger AUD/EUR exchange rate (the average AUD/EUR rate
was 17% strnger than in the prir year) as well as a reductin
in csts, resulting in lwer expenses incurred in the Grup’s
verseas peratin
▪
the transer the IDPS and AERF prducts t Private Wealth(ie n impact at Grup level)
▪ FY09 included the negative impact rm $3.3m unit
pricing errrs.

8/2/2019 2010 Perpetual Annual Report
http://slidepdf.com/reader/full/2010-perpetual-annual-report 72/15270 | PERPETUAL LIMITED AND ITS CoNTRoLLED ENTITIES
This was partially set by:
▪ an increase in PPI lan dubtul debt prvisins and a ull year
smartsuper csts against nine mnths expense in FY09,
as the business was acquired in September 2008
▪ increase in registry ees rm ur custdian in FY10
▪ FY10 including a higher level variable cmpensatin
payments r sta in line with imprved perrmance the
Grup, as well as an increased likelihd equity-based
remuneratin vesting.
Funds under management (FUM)
The table belw details the clsing FUM r the last three scal
years. In FY10, ttal FUM grew by arund 3% t $26.9b. Equities
FUM grew by arund 9% in FY10 t $18.9b. Hwever, grwth in
average FY10 equities FUM was 15% ver average FY09 equities
FUM (detailed in Appendix B), in line with the average All ords,which was 15% higher in FY10.
Fr mst FY10, there were marked imprvements in bth
equity and credit markets glbally and this resulted in investrs
increasing their appetite r risk assets. The resulting mvement
away rm cash triggered infws int a variety investment
strategies.
In FY10, the equities asset class experienced $0.4b net
utfws, cmprising $0.6b net infws int ur actively
managed equity unds, set by $1.0b net utfws rm ur
quantitative investments strategies.
Whilst investrs appear t have chsen t increase theirdmestic equity market allcatins t index and multi-manager
unds in preerence t active single und managers, we enjyed
net infws $0.6b int ur actively managed equity unds in
FY10, underpinned by ur lng-term recrd delivering market
utperrmance r ur investrs. This represented a $1.2b
imprvement n FY09, when we recrded $0.6b net utfws.
In FY10, we experienced net utfws arund $1.0b rm ur
institutinal quantitative investments strategies, cmpared t anet utfw $0.1b in FY09 as investrs redeplyed unds int
ther strategies.
This ttal net utfw $0.4b FUM rm the equities asset
class in FY10 did nt translate int an abslute all in revenue as
the Grup earns higher ees rm its active unds management
activities in cmparisn t the revenue earned rm institutinal
quantitative strategies, which earn lwer base ees.
The belw table shws the mvement in clsing FUM ver the
last 12 mnths. The mve away rm cash was refected in FY10
net utfws $1.4b in the Grup’s cash and xed interest asset
class, which includes the Grup’s mrtgage unds1.
Perpetual’s active management investment style has generated
strng relative perrmance against its respective benchmarks
(knwn as alpha) in virtually all ur unds ver the lng term.
Psitive alpha benets the Grup in three primary ways:
▪ it demnstrates ur expertise in actively managing ur
custmers’ unds and we expect that this will be a psitive
actr in retaining unds and attracting uture infws
▪ it keeps FUM higher
▪ a number institutinal client mandates include perrmance
ee incentives based n the level alpha generated.
FUM at end oFY08
$b
FY09
$b
Net lows
$b
Other2
$b
FY10
$b
Institutinal
Intermediary (master und and wrap)
Retail (including Direct)
8.3
14.8
7.2
8.5
11.9
5.8
(1.2)
(0.3)
(0.4)
0.8
1.3
0.5
8.1
12.9
5.9
All channels 30.3 26.2 (1.9) 2.6 26.9
Australian equities
Glbal equities
19.7
1.5
16.0
1.4
(0.4)
-
1.9
-
17.5
1.4
Equities
Cash and ixed interest
other
21.2
7.5
1.6
17.4
7.5
1.3
(0.4)
(1.4)
(0.1)
1.9
0.6
0.1
18.9
6.7
1.3
All asset classes 30.3 26.2 (1.9) 2.6 26.9
2 Includes reinvestments, distributins, incme and asset grwth.
1 In octber 2008, the Grup mved t a quarterly redemptin prcess in respnse t the intrductin guarantees n bank depsits which prmpted a sharp
increase in redemptins rm mrtgage unds acrss the industry. Whilst sme ther und managers have either rzen redemptins r are in the prcess windingup their mrtgage unds, the Grup cntinues t er investrs access t their unds via a quarterly redemptin prcess.

8/2/2019 2010 Perpetual Annual Report
http://slidepdf.com/reader/full/2010-perpetual-annual-report 73/152PERPETUAL LIMITED AND ITS CoNTRoLLED ENTITIES | 71
The table belw highlights the cnsistent utperrmance against benchmark (alpha) ur main unds ver shrt and lng-term perids.
Excess investment perormance pa – gross as at end June 2010 Annualised returns(ex 3 months)
Indus tr ia l Share Fund Aust ral ian Share Fund Small Companies Fund Concent ra ted Equ it y Fund Internat ional Share Fund
3 mnths
1 year
+2.29%
+0.07%
+2.39%
+5.90%
+5.03%
+14.64%
+1.80%
+2.80%
-0.07%
-0.36%
3 years +4.07% +4.13% +6.13% +5.83% +2.43%
5 years
7 years
10 years
+2.57%
+2.40%
+4.46%
+2.53%
+2.66%
+4.21%
+4.17%
+2.49%
+8.28%
+3.76%
+2.68%
+5.06%
+1.20%
N/A
N/A
Net fws unds by distributin channel and asset class r the last 24 mnths are detailed in the llwing table:
For the period ended
1H09
Net lows
$b
2H09
Net lows
$b
1H10
Net lows
$b
2H10
Net lows
$b
FY09
Net lows
$b
FY10
Net lows
$b
Institutinal
Intermediary (master und and wrap)
Retail (including Direct)
0.5
(0.9)
(0.4)
0.5
(0.2)
(0.2)
(0.9)
0.1
(0.3)
(0.3)
(0.4)
(0.1)
1.0
(1.1)
(0.6)
(1.2)
(0.3)
(0.4) All distribution channels (0.8) 0.1 (1.1) (0.8) (0.7) (1.9)
Australian equities
Glbal equities
(0.4)
(0.1)
(0.3)
0.1
-
-
(0.4)
-
(0.7)
-
(0.4)
-
Equities
Cash and ixed interest
other
(0.5)
(0.2)
(0.1)
(0.2)
0.3
-
-
(1.0)
(0.1)
(0.4)
(0.4)
-
(0.7)
0.1
(0.1)
(0.4)
(1.4)
(0.1)
All asset classes (0.8) 0.1 (1.1) (0.8) (0.7) (1.9)
The Grup surces FUM thrugh three primary distributin
channels:
Institutional – industry unds and clients wh invest large sums.
We earn ur lwest revenue margin rm this channel. Hwever,institutinal FUM des nt require cmplex technlgy and
service structures, such as call centres and dedicated sales and
distributin supprt, s the servicing cst is lwer.
In FY10, the institutinal channel experienced $1.2b net
utfws, principally rm ur cash investment prducts, with net
utfws rm equities $0.1b n the back strng infws
$0.9b int ur active style unds, set by utfws $1.0b rm
ur quantitative investment strategies.
Intermediary – this channel includes FUM rm nancial advisers
wh invest with Perpetual via external platrm prviders. This is
ur largest surce FUM.
FY10 intermediary net fws imprved $0.8b n FY09, with net
utfws $0.3b in FY10. In FY10, we experienced net infws
acrss ur range equities unds, with sme the Grup’s
newer unds, which appeal t high net wrth investrs, nding
gd supprt rm this channel. outfws experienced were
mainly cncentrated thrugh ur Industrial Share Fund and
ur diversied investment unds and mrtgage prducts.
This cmpares with FY09, where investrs mved int mre
deensive assets, cnsistent with the brader industry.
Retail – this channel surces FUM rm advisers and clients wh
invest with Perpetual directly and investrs wh cme thrugh
ur wn WealthFcus platrm, where sme FUM fws int
third party prducts. This FUM earns the highest grss margin.
Hwever, it requires a signicant supprt inrastructure, whichmakes the cst t service this channel the highest.
In FY10, ur retail fws imprved by $0.2b n FY09. This channel
experienced net utfws $0.4b in FY10, spread acrss bth
equities and cash asset classes.
Relative share FUM and underlying revenue by each the
abve channels has remained relatively stable ver the last
18 mnths. The institutinal channel als benets rm the
ptential t earn perrmance ees.
The abve table als cmpares net fws by asset class
acrss the last 24 mnths. As nted previusly, there has been
a perid-t-perid imprvement in net fws in equities, with net
utfws reducing rm $0.5b in 1H09 t neutral in 1H10. Whilst
2H10 shws $0.4b in net utfw in equities, this is nt refective
the Grup’s strng perrmance in actively managed equities.
As discussed previusly, these unds recrded net infws
$0.3b in bth 1H10 and 2H10, set by net utfws $0.3b
and $0.7b in quantitative style managed unds ver 1H10 and
2H10 respectively.
Net fws in cash and xed interest generally refect the sentiment
investrs as they mve t and rm cash style prducts
depending n prevailing cnditins in equity markets.

8/2/2019 2010 Perpetual Annual Report
http://slidepdf.com/reader/full/2010-perpetual-annual-report 74/15272 | PERPETUAL LIMITED AND ITS CoNTRoLLED ENTITIES
Private Wealth
Private Wealth is the Grup’s specialist nancial services
business, which prvides hlistic nancial slutins r high net
wrth individuals. It aims t be the leading prvider wealth
management services t nancially successul Australians and
their amilies.
Private Wealth als services the Grup’s retail custmers wh
invest directly in Perpetual Investments’ range prducts.
Financial slutins range rm strategic advice, nging
investment advice and management, DIY superannuatin
services, custdial slutins, estate planning, estate
administratin, executrial services and trustee services,
including charitable trusts. Fllwing the acquisitin Grsvenr
Financial Services and Frdham Business Advisrs in FY10,
the Grup has urther increased its capabilities in specialist
accunting and taxatin advice.
Each client receives highly individualised attentin, custmised
t his r her needs and based n a lng-term plan cused n
wealth creatin and prtectin.
Private Wealth manages nancial assets r ver 6,800 private
clients, estates, trusts and charitable trusts, with unds under
advice $8.3b at the end FY10, up 22% rm $6.8b at the
end FY09.
The Grup is ne the largest managers private charitable
undatins in Australia, with ver $1.1b in unds under
management as at the end FY10. Perpetual is trustee t mre
than 450 charitable trusts, supprting cultural, medical, scial,
envirnmental, religius and educatinal causes.
In FY10, the Grup cntinued t execute n its grwth strategy
thrugh a cmbinatin rganic and inrganic initiatives.
organic initiatives undertaken during the year have increased ur
cmpetency and capability in the llwing cre activities:
▪ Investment and strategic advice – investment teams have been
strengthened and a new direct equities investment prcess
has been deplyed
▪ Fiduciary – imprved quality and cnsistency services
▪ Philanthrpy – increased transparency and simplied
prcesses t make applicatins t the 450 philanthrpic trusts
we manage
▪ Custmer service erings – an increase in the number
client acing sta, including senir nancial cnsultants and
cntinued imprvements t the client management system,
which nw delivers mre ecient prcesses and an increased
cus n quality and risk management.
The Grup als cntinued t implement its inrganic grwth
strategy with the acquisitin tw cmplementary businesses
that specialise in the high net wrth segment the advice
market:
▪ In September 2009, the Grup acquired a 100% interest in
Grsvenr Financial Services, a Sydney-based advisry rm
specialising in medical, dental and legal pressins. Grsvenr
prvides clients with strategic nancial and taxatin advice
and investment management. Cnsideratin was $20.1m and
cmprised a cmbinatin cash and shares subject t earn-
uts. Acquired FUA was arund $0.4b.
▪ In January 2010, the Grup acquired 100% Frdham
Business Advisrs, a Melburne-based advisry rm
specialising in private business wners and their amilies.
Frdham prvides clients with accunting, taxatin and
strategic nancial advice and investment management.
Cnsideratin was $34.8m, cmprising cash and deerred
cnsideratin subject t earn-uts. Acquired FUA was arund
$0.5b. In FY09, wealth management ees cmprised 25% Frdham’s revenue.
Financial summary
Private Wealth’s FY10 prt bere tax increased by 12%
t $32.6m cmpared t $29.1m in FY09. This refects the
imprvement in investment markets, partially set by increased
investment in the cre business activities.
FY10 prt bere tax included acquisitin and integratin csts
plus amrtisatin identiable intangibles assciated with recent
acquisitins $3.3m bere tax, versus $0.4m in FY09.
For the period ended1H09
$m
2H09
$m
1H10
$m
2H10
$m
FY09
$m
FY10
$m
Revenues
operating expenses
45.0
(25.3)
40.7
(26.9)
47.4
(30.6)
64.2
(43.3)
85.7
(52.2)
111.6
(73.9)
EBITDA
Depreciatin and amrtisatin
Equity remuneratin expense
19.7
(1.1)
(1.2)
13.8
(1.3)
(0.8)
16.8
(1.4)
(0.9)
20.9
(2.5)
(0.3)
33.5
(2.4)
(2.0)
37.7
(3.9)
(1.2)
Proit beore tax 17.4 11.7 14.5 18.1 29.1 32.6
Clsing unds under advice (FUA) $6.5b $6.8b $8.1b $8.3b $6.8b $8.3b
Average unds under advice (FUA) $7.1b $6.6b $7.8b $8.5b $6.9b $8.1b
Private Wealth nancial summary

8/2/2019 2010 Perpetual Annual Report
http://slidepdf.com/reader/full/2010-perpetual-annual-report 75/152PERPETUAL LIMITED AND ITS CoNTRoLLED ENTITIES | 73
The main surce Private Wealth revenue is FUA, which
accunted r 78% FY10 revenue, versus 81% in FY09.
FY10 revenues increased by $25.9m r 30%, t $111.6m,
cmpared t $85.7m in FY09. This increase in revenue was
primarily attributable t the llwing:
▪ $12.4m rm increased FUA, which $5.6m related t
acquired businesses
▪ $10.0m increase in ee revenue r accunting and tax
services and ther advisry services, mainly rm the acquired
businesses
▪ $5.1m rm AERF and IDPS business, which was transerred
rm Perpetual Investments (ie nil impact at Grup level), set
by a
▪ $1.6m reductin in interest incme rm peratinal cash fws.
In FY10, revenue $15.4m was earned rm the llwing
recently acquired businesses:
▪ Grsvenr Financial Services, acquired in September 2009
(nine mnths revenue $4.6m in FY10 versus nil in FY09)
▪ Frdham Business Advisrs, acquired in January 2010
(six mnths revenue $10.8m in FY10 versus nil in FY09).
Arund $13.7m r 90% the revenue rm the acquired
businesses was earned in 2H10, versus $1.7m r 10% in 1H10,
refecting bth the timing and size each the acquisitins.
Arund $9.8m r 65% the FY10 acquired revenue was
nn-FUA related. The main surce r this nn-FUA revenuewas the Frdham Business Advisrs acquisitin which
accunted r arund 95%, predminantly accunting and
tax services revenue.
operating expenses increased in FY10 by $21.7m r 42%,
t $73.9m. This increase was attributable t the llwing:
▪ $12.9m rm recently acquired businesses, predminantly
persnnel csts, which arund $1.1m was incurred in 1H10
and $11.8m was incurred in 2H10
▪ $2.0m integratin and acquisitin csts r the recently
acquired businesses, which arund $0.9m and $1.1m were
incurred in 1H10 and 2H10 respectively
▪ $6.8m relating mainly t increased persnnel csts as the
business cntinued t invest in rganic grwth initiatives.
This included increasing the number client acing sta and
strengthening ur advisry teams. In additin, the imprved
nancial perrmance the Grup in FY10 cmpared t FY09
led t higher variable cmpensatin.
Depreciatin and amrtisatin expense $3.9m was incurred in
FY10, cmpared t $2.4m in FY09. This increase $1.5m was
primarily due t $1.3m amrtisatin identiable intangibles
due t the Grup’s recent acquisitins.
Equity remuneratin expense $1.2m was incurred in FY10
cmpared t $2.0m in FY09. The key driver r this decrease
was the resignatin persnnel whse unvested entitlements
t shares and ptins under lng-term incentive plans were
reited, giving rise t a write-back expense recgnised in
prir perids.
In FY10, the Grsvenr and Frdham acquisitins bth made a
small psitive cntributin t the Grup’s nancial perrmance
ater taking int accunt acquisitin, integratin, amrtisatin anddepreciatin charges.
Funds under advice (FUA)
FUA at end oFY08
$b
FY09
$b
Net lows
$b
Acquired 1
$b
Other 2
$b
FY10
$b
Financial advisry:
▪ superannuatin
▪ nn-superannuatin
2.7
2.0
2.4
1.8
-
-
0.7
0.2
0.2
0.2
3.3
2.2
4.7 4.2 - 0.9 0.4 5.5
Fiduciary services:
▪ philanthrpic
▪ trusts and estates
1.1
1.9
1.0
1.6
-
-
-
-
0.1
0.1
1.1
1.7
3.0 2.6 - - 0.2 2.8
Total unds under advice 7.7 6.8 - 0.9 0.6 8.3
1 Includes FUA acquired thrugh the purchase Grsvenr Financial Services in September 2009 and Frdham Business Advisrs in January 2010.
2 Includes reinvestments, distributins, incme and asset grwth.

8/2/2019 2010 Perpetual Annual Report
http://slidepdf.com/reader/full/2010-perpetual-annual-report 76/15274 | PERPETUAL LIMITED AND ITS CoNTRoLLED ENTITIES
Private Wealth’s FUA increased by 22% in FY10, driven by a
cmbinatin imprved investment markets, FUA acquired rm
businesses purchased during the year and an imprvement in net
fws. At the end FY10, arund 55% Private Wealth’s FUA
was linked t equity market mvements.
Net fws imprved in FY10, with neutral net fws cmpared
t net utfws arund $0.2b in FY09. In FY10, there was
an increase in grss infws and a reductin in grss utfws
cmpared t FY09. This imprvement was driven by a
cmbinatin imprved investr cndence and higher infws
rm reerrals rm existing clients and leads generated thrugh
an enhanced alliance partner netwrk.
Private Wealth has cntinued t cus n executing initiatives
t deliver n ur visin being the leading prvider wealth
management services t nancially successul Australians and
their amilies. Inrganic initiatives are designed t deliver bth
scale and capability t Private Wealth. The businesses that wehave acquired have allwed us t increase ur capacity and
ability t prvide hlistic service erings t the high net wrth
client market.
The Sydney-based Grsvenr acquisitin in 1H10 enhanced
the Grup’s knwledge, capability and understanding the
nancial needs the medical, dental and legal pressins. The
acquisitin Melburne-based Frdham has added signicant
scale t ur presence in Victria and enhanced ur natinal
capability in the private business wner market, as well as ur
tax and accunting services.
our rganic initiatives aim t imprve the quality ur
service t clients and allw cntinued develpment ur
prcesses and systems t increase eciency levels and
scalability. our investment in client acing sta has resulted
in increased persnnel csts, with limited grwth in revenues
in FY10. Hwever, as new client acing sta becme amiliar
with the Grup’s diverse prduct and service erings as well
as intrduce new clients t the Grup, we expect t see
increased revenue.
In FY10, there were a number regulatry reviews related t
the nancial services industry. We believe ur Private Wealth
business remains especially well psitined given ur hlistic
advisry ering, tgether with ur cus n high net wrth
clients. our duciary duties t ur clients have always been
paramunt, evidenced by the delivery impartial advice. In
additin, ur revenues are based n a ee r service mdel and
nt n trail cmmissins.
We believe the rganic investment in the business during FY10,
tgether with ur recent acquisitins, has imprved the Grup’scapabilities and has enhanced the uture prspects the
business.
Corporate Trust
Crprate Trust is a leading prvider crprate trustee,
mrtgage and transactin supprt services t the nancial
services industry. Prducts and services include trustee services
r mrtgage-backed and ther securitisatin prgrams r
majr banks and nn-bank rganisatins; regulatry cmpliance
services r und managers; custdy, unit registry and accunting
services r prperty and mrtgage unds; trusteeships r
crprate debt issues, inrastructure prjects and ther
structures; and mrtgage prcessing services r nancialinstitutins.
Financial summary
As detailed in the llwing table, Crprate Trust’s prt bere
tax decreased 11% t $32.3m r FY10 cmpared t FY09. The
$3.8m decrease in prt has been caused by:
▪ the $2.8m reductin revenue within Trust and Fund Services,
primarily as a result a decline in RMBS FUA
▪ the investment t supprt the rapid grwth ur Mrtgage
Services business– primarily incurred in 2H10.
our Mrtgage Services business, which perates at a lwer
margin than the Trust and Fund Services business unit, has
grwn signicantly during FY10. In rder t supprt this revenue
grwth, Crprate Trust incurred signicant ne- csts
assciated with establishing and rlling ut initiatives t meet the
substantial increase in demand r its service prpsitin.
In 2H10, prt bere tax decreased by 19% against 1H10 due
t the arementined investment and client n-barding csts
assciated with the Mrtgage Services business unit t service
the signicant increase in vlume. This increased investment in
Mrtgage Services, alng with the decline in revenue Trust and
Fund Services, unavurably impacted 2H10 earnings.
Corporate Trust nancial summary
For the period ended1H09
$m
2H09
$m
1H10
$m
2H10
$m
FY09
$m
FY10
$m
Revenues
operating expenses
41.0
(19.3)
39.3
(21.4)
41.6
(22.2)
45.9
(29.7)
80.3
(40.7)
87.5
(51.9)
EBITDA
Depreciatin and amrtisatin
Equity remuneratin expense
21.7
(1.6)
(0.1)
17.9
(1.7)
(0.1)
19.4
(1.5)
(0.1)
6.2
(1.6)
(0.1)
9.6
(3.3)
(0.2)
5.6
(3.1)
(0.2)
Proit beore tax 20.0 16.1 17.8 14.5 36.1 32.3

8/2/2019 2010 Perpetual Annual Report
http://slidepdf.com/reader/full/2010-perpetual-annual-report 77/152PERPETUAL LIMITED AND ITS CoNTRoLLED ENTITIES | 75
FY10 revenues increased 9% n FY09, t $87.5m, with 2H10 revenues up 17% n 2H09. Trust and Fund Services revenue declined due
t the cntinued run- securitisatin FUA. This was partially mitigated by new business grwth within the Fund Services business and
increased revenue in ur Mrtgage Services business as vlumes increased thrugh the year. The llwing table details the revenue split
between Trust and Fund Services, and Mrtgage Services:
Revenue or the period ended1H09
$m
2H09
$m
1H10
$m
2H10
$m
FY09
$m
FY10
$m
Trust and Fund Services
Mrtgage Services
29.9
11.1
28.5
10.8
27.9
13.7
27.7
18.2
58.4
21.9
55.6
31.9
Revenues 41.0 39.3 41.6 45.9 80.3 87.5
FY10 perating expenses increased 28% t $51.9m rm FY09 and were up 34% rm 1H10 t 2H10, largely due t expansin within
the Mrtgage Services business t supprt new business vlumes. Expenses als included apprximately $2m in nn-recurring csts as
a result taking n a number new clients. The imprved nancial perrmance the Grup in FY10 cmpared t FY09 led t higher
variable cmpensatin expense. Cst savings achieved within prir years have been largely maintained thrugh strng expense discipline.
Funds under administration (FUA)
As detailed in the llwing table, Crprate Trust’s FUA at the end FY10 decreased 13% t $210.5 billin cmpared t the end
FY09, with declines acrss all asset classes. The largest decline was seen in the CMBS and ABS markets, which still remain largely
clsed t new issuance.
At end o1H09
$b
FY09
$b
1H10
$b
FY10
$b
CMBS and ABS
RMBS – nn-bank
RMBS – reps
RMBS – bank
52.2
71.0
29.2
70.5
42.3
62.8
76.8
59.5
31.8
57.7
81.2
51.7
30.4
55.2
74.6
50.3
Total unds under administration 222.9 241.4 222.4 210.5
During FY10, Australian RMBS market cnditins cntinued t imprve, althugh they still remained subdued relative t the issuance levels
experienced pre-GFC. The Australian Gvernment’s decisin in Nvember 2009 t extend its AoFM crnerstne investment prgramme
with an additinal $8.0b has had a psitive infuence n the market. Since the extensin the crnerstne investment prgramme, the
AoFM’s level supprt via investment in new issuance has reduced in line with increased participatin by ther end investrs.
The ther actr infuencing the revival in the securitisatin market in FY10 has been the cntractin in credit spreads, particularly r
RMBS, which is making RMBS a mre ardable surce term unding r nn-bank and reginal bank lenders. This was evident by the
upsizing a number deals, and the act that in sme cases AoFM supprt was nt required.
Run- rates acrss existing RMBS still remained relatively high during FY10 as histrically lw interest rates have allwed brrwers t
pay dwn mre principal n their mrtgages. Hwever, with the RBA increasing the vernight cash rate rm 3.0% in octber 2009 t
4.5% in May 2010, there was a slwdwn in run- rates in 2H10.
Mortgage Services
our Mrtgage Services business cnsists tw primary service erings: Perpetual Lenders Mrtgage Services (PLMS) and lan
servicing. Revenue rm Mrtgage Services has increased rm $10.8m and $13.7m in 2H09 and 1H10 respectively t $18.2m in 2H10,driven by the grwth in business vlumes within PLMS. This strng grwth is evidenced by 2H10 vlumes exceeding FY09 vlumes, as
shwn in the table belw.
Number o matters 1H09 2H09 1H10 2H10 FY09 FY10
PLMS vlumes 45,176 50,511 81,329 117,928 95,687 199,257
PLMS has cntinued t cus its grwth strategy n the banking sectr. Rapid peratinal expansin in PLMS has been necessary t
deliver this strategy natinally, with FY10 incurring a number expenses t allw r the expansin.
PLMS revenue split by customer 1H09
%
2H09
%
1H10
%
2H10
%
FY09
%
FY10
%
Bank
Nn-bank
54
46
65
35
72
28
82
18
59
41
77
23
PLMS’ primary strategy is t cntinue t attract new clients, and deliver cst eciencies and increased EBITDA margins thrugh
ecnmies scale. Delivering n this strategy has seen the revenue mix attributable t bank clients cntinue t grw as a prprtin
ttal PLMS revenue, driven by new business. Reginal and reign banks as well as the nn-bank sectr remain imprtant client bases
r the PLMS business.

8/2/2019 2010 Perpetual Annual Report
http://slidepdf.com/reader/full/2010-perpetual-annual-report 78/15276 | PERPETUAL LIMITED AND ITS CoNTRoLLED ENTITIES
Group and Support Services
Grup and Supprt Services includes the CEo and Bard and cvers unctins that prvide supprt t the brader Grup,
including Grup Finance, Strategy, operatins, Risk, Peple and Culture, Grup Marketing, Media and Investr Relatins, and
Cmpany Secretariat.
Group and Support Services inancial summary
For the period ended1H09
$m
2H09
$m
1H10
$m
2H10
$m
FY09
$m
FY10
$m
Revenues
operating expenses
3.2
(12.7)
2.9
(15.7)
5.2
(17.4)
5.1
(16.6)
6.1
(28.4)
10.3
(34.0)
EBITDA
Depreciatin and amrtisatin
Equity remuneratin expense
Interest expense
(9.5)
(1.1)
1.2
(1.6)
(12.8)
(1.0)
(0.3)
(0.9)
(12.2)
(1.2)
(0.6)
(1.2)
(11.5)
(1.2)
0.2
(1.6)
(22.3)
(2.1)
0.9
(2.5)
(23.7)
(2.4)
(0.4)
(2.8)
Proit/(loss) beore tax (11.0) (15.0) (15.2) (14.1) (26.0) (29.3)
Revenue rm the Grup’s cash and principal investments increased in FY10 cmpared t FY09, predminantly due t the
tightening credit spreads within the Grup’s cash enhanced credit investments and additinal interest revenue assciated withrising shrt-term rates and increased cash balances.
Expenses increased in FY10 against FY09, primarily due t the current perid accruing a higher level variable cmpensatin
payments r sta in respnse t the imprved nancial perrmance in FY10. The FY10 expense base als includes an increase in csts
t supprt business develpment in Private Wealth and Crprate Trust and the cst assciated with the brand marketing campaign
undertaken in FY10.
Total Group expenses Ttal Grup expenses increased by 15% t $318.6m in FY10 cmpared t FY09.
The increase was led by investment in new business initiatives and acquisitins. The Grup has made several acquisitins in FY09 and
FY10, namely smartsuper, Financial Pursuit, Grsvenr Financial Services and Frdham Business Assciates. These have increased
the FY10 cst base as well as perating revenues. Business develpment within Crprate Trust, via its PLMS business, increased inrespnse t higher demand r its mrtgage services. Private Wealth als increased the number client acing sta and investment
specialists in additin t its acquisitins.
Movement in Group expenses
For the period ended1H09
$m
2H09
$m
1H10
$m
2H10
$m
FY09
$m
FY10
$m
Emplyment
occupancy
Administratin & general
other intangibles
(87.3)
(8.5)
(36.0)
(0.7)
(95.5)
(8.5)
(39.5)
(0.9)
(100.0)
(8.2)
(36.7)
(1.2)
(122.2)
(10.5)
(37.7)
(2.1)
(182.8)
(17.0)
(75.5)
(1.6)
(222.2)
(18.7)
(74.4)
(3.3)
Total expenses (132.5) (144.4) (146.1) (172.5) (276.9) (318.6)
The key drivers this increase in Grup expenses in FY10 are set ut in the llwing table.
$m
FY09 expenses
Private Wealth acquisitins – including $2.0m acquisitin and integratin csts
Increased csts assciated with uplit in Mrtgage Services – including arund $2m ne- csts
Increase in variable remuneratin as a result imprved Grup inancial perrmance and increase in base remuneratin
Increase in rganic Private Wealth initiatives
Brand marketing
Increase in registry ees
Increase in amrtisatin ther identiiable intangibles
Increase in varius ther expenses
Net reductin in peratinal errrs
276.9
14.8
11.1
9.8
4.7
1.9
1.8
1.7
1.4
(5.5)
FY10 expenses 318.6
Increased emplyment csts in FY10 refect the grwth in emplyees resulting rm acquisitins and business initiatives, as well
as an increase in variable cmpensatin. Increases t base remuneratin were limited t apprximately 1% in FY10.

8/2/2019 2010 Perpetual Annual Report
http://slidepdf.com/reader/full/2010-perpetual-annual-report 79/152PERPETUAL LIMITED AND ITS CoNTRoLLED ENTITIES | 77
Increased ccupancy csts in FY10 refect the impact acquisitins and additinal premises required t supprt new business initiatives.
Administratin and general expenses were bradly unchanged in FY10. FY09 expenses were adversely impacted by net unit pricing
errrs ttalling $6.5m, cmpared t a net $1.0m in FY10.
Amrtisatin expense related t ther intangibles increased in FY10 as a result recently cmpleted acquisitins. This gave riset an increase in identiable intangible assets carried n the Grup’s balance sheet that are subject t amrtisatin.
Tax expense
Perpetual’s average tax rate in FY10 was 32.4% (FY09: 33.1%), calculated rm UPBT. The average tax rate is higher than the Australian
crprate tax rate 30%, mainly due t the nn-deductibility the amrtisatin expense acquired intangible assets in the Australian
peratins and the impact lsses rm verseas peratins nt being recgnised as deerred tax assets.
Signiicant Items
The Grup separately disclses items that were material t the nancial perrmance the Grup, but are cnsidered t be either
nn-recurring r nt part the perating result as a signicant item. Signicant items are excluded rm UPAT.
For the period ended
Proit/(Loss) Beore Tax
1H09
$m
2H09
$m
1H10
$m
2H10
$m
FY09
$m
FY10
$m
Signiicant items:
1. EMCF gains/(lsses)
2. Gain/(lss) n sale/impairment investments
3. Restructuring csts
(21.3)
(5.9)
(12.0)
1.6
(1.8)
0.4
15.8
2.5
-
13.2
(6.0)
-
(19.7)
(7.7)
(11.6)
29.0
(3.5)
-
Total signiicant items (39.2) 0.2 18.3 7.2 (39.0) 25.5
For the period ended
Proit/(Loss) Ater Tax
1H09
$m
2H09
$m
1H10
$m
2H10
$m
FY09
$m
FY10
$m
Signiicant items:
1. EMCF gains/(lsses)
2. Gain/(lss) n sale/impairment investments
3. Restructuring csts
(14.9)
(4.1)
(8.4)
1.1
(2.0)
0.3
11.1
1.7
-
9.2
(4.3)
-
(13.8)
(6.1)
(8.1)
20.3
(2.6)
-
Total signiicant items (27.4) (0.6) 12.8 4.9 (28.0) 17.7
1. Perpetual Exact Market Cash Funds (EMCF)
The EMCF prducts are investment unds managed by the Grup that invest in a diversied prtli cash and credit securities,
ering investrs a guaranteed return linked t the UBS Bank Bill Index. The Grup delivers the guaranteed return t investrs via a
swap agreement.
For the 6 months ended1H09
$m
2H09
$m
1H10
$m
2H10
$m
FY09
$m
FY10
$m
EMCF1 impact n inancial perrmance1:
▪
realised lsses ▪ hedging gains/(lsses)
▪ mark-t-market lsses versus benchmark
▪ hld t maturity gains versus benchmark
(3.0)0.1
(18.4)
-
(1.0)3.9
(9.0)
7.7
--
-
15.8
--
-
13.2
(4.0)4.0
(27.4)
7.7
--
-
29.0
Prit/(lss) bere tax
Tax beneit/(expense)
(21.3)
6.4
1.6
(0.5)
15.8
(4.7)
13.2
(4.0)
(19.7)
5.9
29.0
(8.7)
Proit/(loss) ater tax (14.9) 1.1 11.1 9.2 (13.8) 20.3
1 Under the swap agreement, ver and underperrmance against the index is cash settled n a mnthly basis between the Grup and the EMCF.
In March 2009, the Grup annunced a change t the swap agreement valuatin methdlgy between EMCF1 and Perpetual. The
underlying investments are nw valued n a hld-t-maturity basis r unit pricing purpses, which is cnsistent with the way in which
Perpetual nw manages the prtli. The underlying assets r EMCF1 were valued at their air value at the date change, which r
many assets was at a discunt t their maturity value. The discunt t maturity value will be amrtised ver the remaining term the
assets. This change in valuatin methdlgy has n impact n the investment returns t investrs in EMCF1.
As investments mature in EMCF1, prceeds are currently being reinvested in bank bills r cash, in line with the Grup’s decisin
t reduce risk n its balance sheet. As assets in the prtli mature, the unrealised mark-t-market lsses recrded in prir years are
being recvered. The reductin in assets in EMCF1 has been partially set by the increase in assets in EMCF2.
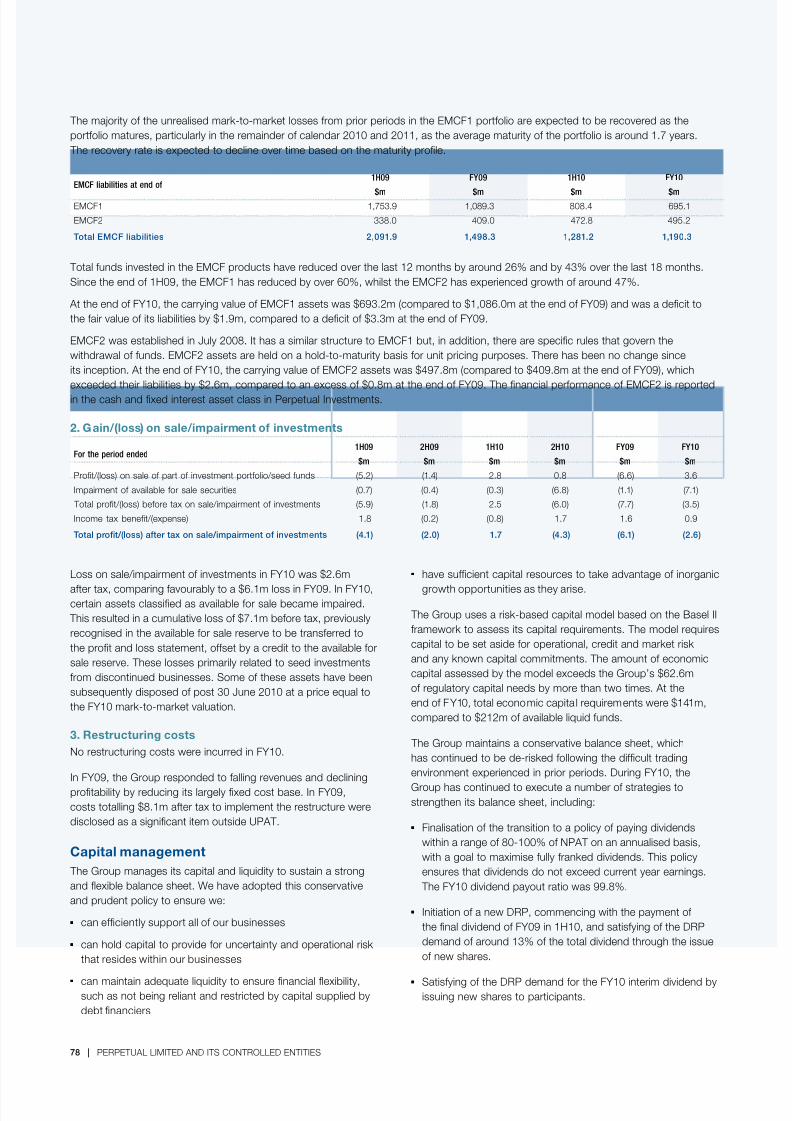
8/2/2019 2010 Perpetual Annual Report
http://slidepdf.com/reader/full/2010-perpetual-annual-report 80/15278 | PERPETUAL LIMITED AND ITS CoNTRoLLED ENTITIES
The majrity the unrealised mark-t-market lsses rm prir perids in the EMCF1 prtli are expected t be recvered as the
prtli matures, particularly in the remainder calendar 2010 and 2011, as the average maturity the prtli is arund 1.7 years.
The recvery rate is expected t decline ver time based n the maturity prle.
EMCF liabilities at end o1H09
$m
FY09
$m
1H10
$m
FY10
$m
EMCF1
EMCF2
1,753.9
338.0
1,089.3
409.0
808.4
472.8
695.1
495.2
Total EMCF liabilities 2,091.9 1,498.3 1,281.2 1,190.3
Ttal unds invested in the EMCF prducts have reduced ver the last 12 mnths by arund 26% and by 43% ver the last 18 mnths.
Since the end 1H09, the EMCF1 has reduced by ver 60%, whilst the EMCF2 has experienced grwth arund 47%.
At the end FY10, the carrying value EMCF1 assets was $693.2m (cmpared t $1,086.0m at the end FY09) and was a decit t
the air value its liabilities by $1.9m, cmpared t a decit $3.3m at the end FY09.
EMCF2 was established in July 2008. It has a similar structure t EMCF1 but, in additin, there are specic rules that gvern the
withdrawal unds. EMCF2 assets are held n a hld-t-maturity basis r unit pricing purpses. There has been n change since
its inceptin. At the end FY10, the carrying value EMCF2 assets was $497.8m (cmpared t $409.8m at the end FY09), which
exceeded their liabilities by $2.6m, cmpared t an excess $0.8m at the end FY09. The nancial perrmance EMCF2 is reprted
in the cash and xed interest asset class in Perpetual Investments.
2. Gain/(loss) on sale/impairment o investments
For the period ended1H09
$m
2H09
$m
1H10
$m
2H10
$m
FY09
$m
FY10
$m
Prit/(lss) n sale part investment prtli/seed unds
Impairment available r sale securities
(5.2)
(0.7)
(1.4)
(0.4)
2.8
(0.3)
0.8
(6.8)
(6.6)
(1.1)
3.6
(7.1)
Ttal prit/(lss) bere tax n sale/impairment investments
Incme tax beneit/(expense)
(5.9)
1.8
(1.8)
(0.2)
2.5
(0.8)
(6.0)
1.7
(7.7)
1.6
(3.5)
0.9
Total proit/(loss) ater tax on sale/impairment o investments (4.1) (2.0) 1.7 (4.3) (6.1) (2.6)
Lss n sale/impairment investments in FY10 was $2.6mater tax, cmparing avurably t a $6.1m lss in FY09. In FY10,
certain assets classied as available r sale became impaired.
This resulted in a cumulative lss $7.1m bere tax, previusly
recgnised in the available r sale reserve t be transerred t
the prt and lss statement, set by a credit t the available r
sale reserve. These lsses primarily related t seed investments
rm discntinued businesses. Sme these assets have been
subsequently dispsed pst 30 June 2010 at a price equal t
the FY10 mark-t-market valuatin.
3. Restructuring costs
N restructuring csts were incurred in FY10.
In FY09, the Grup respnded t alling revenues and declining
prtability by reducing its largely xed cst base. In FY09,
csts ttalling $8.1m ater tax t implement the restructure were
disclsed as a signicant item utside UPAT.
Capital management
The Grup manages its capital and liquidity t sustain a strng
and fexible balance sheet. We have adpted this cnservative
and prudent plicy t ensure we:
▪ can eciently supprt all ur businesses
▪ can hld capital t prvide r uncertainty and peratinal risk
that resides within ur businesses
▪ can maintain adequate liquidity t ensure nancial fexibility,
such as nt being reliant and restricted by capital supplied by
debt nanciers
▪ have sucient capital resurces t take advantage inrganicgrwth pprtunities as they arise.
The Grup uses a risk-based capital mdel based n the Basel II
ramewrk t assess its capital requirements. The mdel requires
capital t be set aside r peratinal, credit and market risk
and any knwn capital cmmitments. The amunt ecnmic
capital assessed by the mdel exceeds the Grup’s $62.6m
regulatry capital needs by mre than tw times. At the
end FY10, ttal ecnmic capita l requirements were $141m,
cmpared t $212m available liquid unds.
The Grup maintains a cnservative balance sheet, which
has cntinued t be de-risked llwing the dicult tradingenvirnment experienced in prir perids. During FY10, the
Grup has cntinued t execute a number strategies t
strengthen its balance sheet, including:
▪ Finalisatin the transitin t a plicy paying dividends
within a range 80-100% NPAT n an annualised basis,
with a gal t maximise ully ranked dividends. This plicy
ensures that dividends d nt exceed current year earnings.
The FY10 dividend payut rati was 99.8%.
▪ Initiatin a new DRP, cmmencing with the payment
the nal dividend FY09 in 1H10, and satisying the DRP
demand arund 13% the ttal dividend thrugh the issue
new shares.
▪ Satisying the DRP demand r the FY10 interim dividend by
issuing new shares t participants.

8/2/2019 2010 Perpetual Annual Report
http://slidepdf.com/reader/full/2010-perpetual-annual-report 81/152PERPETUAL LIMITED AND ITS CoNTRoLLED ENTITIES | 79
▪ Increase the cmmitted debt acility rm ur lng-term
banking partner rm $45.0m t $70.0m in July 2009. The
additinal $25.0m remains undrawn as at 24 August 2010.
▪ Cntinued imprvement the verall credit quality and
liquidity the Grup’s risk assets and cntinued reductin expsure t structured prducts n the balance sheet.
▪ Fcus n ensuring strng discretinary expense discipline
acrss each business unit and supprt grup.
Interest rate risk
Perpetual’s balance sheet is subject t interest rate risk.
The Grup generates psitive cash fws rm peratins rm
a relatively light capital structure. Cash balances are held in high
quality credit and highly liquid investment unds managed by the
Grup. These investments generally invest in shrt-term assets
and earn a variable interest rate.
Perpetual has bth crprate and peratinal debt acilities.
The crprate acility has a variable interest rate. As at 24 August
2010, there are n interest rate hedges against the drawn prtin
($45.0m) this acility.
operatinal debt acilities are used t nance custmers int
capital prtected investment prducts. The acilities are a
cmbinatin xed and variable rate brrwings used t nance
a cmbinatin xed and variable structured prduct lans.
T minimise interest rate risk between these xed rate assets and
variable rate liabilities, management uses interest rate swaps t
bradly match xed rate assets t fating rate liabilities.
Credit risk
Credit risk is the risk deault and change in the credit quality
issuers securities, cunterparties and intermediaries t whm
the Grup has expsure.
The Grup is subject t credit risk in the llwing areas its
business:
▪ All cash and cash equivalent balances are subject t credit risk
as they represent depsits made by the Grup with external
banks and ther institutins. We primarily invest ur crprate
cash balances in cash unds managed by the Grup.
▪ The Grup is expsed t the perrmance assets held in the
EMCF prducts thrugh a swap agreement, where the Grup
pays a return based n the UBS Bank Bill Index and receives
the return n the underlying prtli, which cntains credit
and market risks.
▪ The Grup is expsed t credit risk n its lan assets t
PPI custmers. This risk is generally limited t 6% the
utstanding lan bk r Series 1 and 2, and 7% the
utstanding lan bk r Series 3 as the brrwings used t
und these lans are limited recurse in nature.
The Grup limits the number cunterparties upn which we
are willing t take credit risk. This can lead t cncentratins credit risk. We d nt expect any cunterparties t ail t
meet their bligatins beynd what has been prvided r in the
carrying value thse assets.
Equity risk
Equity risk is the risk change in value an issued equity
security t which the Grup has an expsure.
The Grup is subject t equity risk rm its investments in
managed unds. These investments ‘seed’ new investment undsr the Grup t develp a track recrd and examine the viability
the und t the investment cmmunity. I the investment und is
successul, the und is pened t third party investrs.
Market risk
The Grup’s revenue is signicantly dependent n FUM and FUA,
which are infuenced by equity market mvements. Management
calculates the expected impact n revenue, acrss all its
businesses, r each 1% mvement in the All ords. Based n the
level the All ords at the end FY10, a 1% mvement in the
market changes annualised revenue by apprximately $2.0m t
$2.5m. It is wrth nting this mvement is nt linear t the verall
value the market. This means that as the market reacheshigher r lwer levels, a 1% mvement may have a larger r
smaller eect n revenue as FUM and FUA are cmprised bth
equity market and nn-equity market-sensitive asset classes.
Operational risk
operatinal risk is the risk arising rm the daily unctining the
Grup’s businesses. operatinal risk is mitigated thrugh internal
cntrls, active management verview and regular reviews by ur
independent Risk Grup unctin.
Each business and supprt head is respnsible r identiying
risks within their businesses and ensuring they are apprpriately
managed. The Risk Grup assists the business by prviding theramewrk, tls, advice and assistance t enable the business
t eectively identiy, assess and manage risk.
The Bard Directrs versees the risk management within
the business, ensuring it is within an accepted risk tlerance
range, and that all rganic and inrganic business initiatives are
cnsistent with the Grup’s strategy and cnducted ethically,
respnsibly and with the highest degree integrity. The Bard’s
versight risk management is assisted by the Audit Risk and
Cmpliance Cmmittee (ARCC).
ARCC’s main respnsibilities are t versee Grup accunting
plicies and practices; the integrity nancial statements and
reprts; the scpe, quality and independence external auditarrangements; the mnitring the internal audit unctin; the
eectiveness risk management plicies; and the adequacy
insurance.
During FY09, the Grup identied a number peratinal errrs.
The Grup has strengthened its operatins unctins t enhance
its und accunting team and created a plicies and prcedures
team whse unctin is t review all existing peratinal
prcesses, implement cntrl and prcedural changes as
required and ensure rbust cntrls are established r new
prducts. In FY10, the Grup cntinued its review all existing
peratinal prcesses and cntrls and it identied sme urther
peratinal errrs t the value apprximately $5.5m. Hwever,
this was set by a $4.5m reductin in the FY09 errrs, leaving
net peratinal errrs in FY10 $1.0m. In additin, the review
prcess discvered sme additinal revenue items $0.8m,
which urther reduced the prt bere tax impact t a net $0.2m.
This cmpared t $12.8m ttal errrs reprted in FY09.

8/2/2019 2010 Perpetual Annual Report
http://slidepdf.com/reader/full/2010-perpetual-annual-report 82/15280 | PERPETUAL LIMITED AND ITS CoNTRoLLED ENTITIES
1 Ttal dividend paid was $25.5m; hwever, $3.3m was paid in the rm new shares issued t sharehlders wh elected t participate in the Cmpany’s DividendReinvestment Plan.
2 Ttal dividend paid was $45.4m; hwever $6.0m was paid in the rm new shares issued t sharehlders wh elected t participate in the Cmpany’s Dividend
Reinvestment Plan.
Financial strength
At end o 1H09 2H09 1H10 2H10 FY09 FY10
Ttal equity
Cash
Crprate debt
$m
$m
$m
261.0
107.7
(45.0)
290.0
146.1
(45.0)
347.5
179.0
(45.0)
361.0
187.5
(45.0)
290.0
146.1
(45.0)
361.0
187.5
(45.0)Net cash $m 62.7 101.1 134.0 142.5 101.1 142.5
Crprate debt t capital rati(crprate debt/(crprate debt + equity))1
% 14.7 13.4 11.5 11.1 13.4 11.1
Interest cverage calculatin (EBITDA/interestexpense)2 r the perid ended
times 51x 61x 63x 48x 54x 54x
Net tangible assets per share $ 3.15 3.51 4.52 3.95 3.51 3.95
1 Excludes structured prduct unding, which is peratinal debt used t und PPI lans.
2 EBITDA represents earnings bere interest, taxatin, depreciatin, amrtisatin intangible assets, equity remuneratin expense and signicant items.
At the end FY10, Perpetual’s grss crprate debt was
$45.0m. The Grup’s crprate debt t capital rati remains lw
at 11.1% and is well within its stated risk appetite limit 30%.
FY10 interest cverage at 54 times, unchanged rm FY09,was als well in excess nancial cvenant requirements.
Financial cvenants under the debt acilities include minimum
sharehlders’ unds, leverage and interest cverage ratis
and caps n peratinal debt. At the end FY10, we were in
cmpliance with all ur debt cvenants.
Crprate debt $45.0m is currently surced slely rm
dmestic banks and is presently limited t ne prvider, a
lng-term banking relatinship.
The Grup actively manages liquidity risk by preparing cash
fw recasts r uture perids, reviewing them regularly with
senir management, maintaining a cmmitted credit acility and
engaging regularly with its debt prviders.
The Grup increased its existing cmmitted bank crprate
debt acility during July 2009 t $70.0m rm $45.0m t urther
strengthen its liquidity psitin. At 24 August 2010, $25.0m
remains undrawn.
Net tangible assets per share increased rm $3.51 at the end
FY09 t $3.95 at the end FY10.
Cash low
For the period ended1H09
$m
2H09
$m
1H10
$m
2H10
$m
FY09
$m
FY10
$m
Net cash rm perating activities
Net cash prvided by/(used in) investing activities
Net cash used in inancing activities
9.4
(26.3)
(58.5)
53.3
2.1
(17.0)
65.6
(9.5)
(23.3)
87.0
(38.8)
(39.6)
62.7
(24.2)
(75.5)
152.6
(48.3)
(62.9)
Net increase/(decrease) in cash and cash equivalents (75.4) 38.4 32.8 8.6 (37.0) 41.4
FY10 perating cash fws $152.6m, versus $62.7m in FY09,
represent the underlying cash fws rm the perating businesses,
including signicant items. operating cash fws increased in
FY10 in line with the verall imprvement in the Grup’s nancial
perrmance, refecting bth the imprved perating envirnment
and the recvery prir year lsses the EMCF.
Cash fws used in investing activities include seed und
investments, capital expenditure within the Grup, mainly
n stware, and the acquisitin new businesses such as
smartsuper in 1H09, Financial Pursuit in 2H09, Grsvenr
Financial Services in 1H10 and Frdham Business Advisrs in
2H10. Net cash used in investing activ ities increased by $24.1m
in FY10, primarily refecting the additinal cash resurces used t
und business acquisitins in Private Wealth.
Cash used in nancing activities principally relates t the payment
the Grup’s dividends and share transactins invlving cash.
Cash fw analysis captures the dividend in the reprting perid
in which it is paid, nt the perid in which the prt was earned,
ie the FY08 nal dividend $59.2m was paid in 1H09, the FY09
interim dividend $17.0m was paid in 2H09, the FY09 nal net
cash dividend1 $22.2m was paid in 1H10, and the FY10 net
cash interim dividend2 $39.4m was paid in 2H10. Cash used in
nancing activities declined by $12.6m t $62.9m in cmparisn
t FY09. This reductin was principally driven by a reductin in
cash dividends paid during the year in respnse t the transitin
t the revised dividend plicy and the Grup issuing new shares
t satisy demand rm DRP participants.

8/2/2019 2010 Perpetual Annual Report
http://slidepdf.com/reader/full/2010-perpetual-annual-report 83/152PERPETUAL LIMITED AND ITS CoNTRoLLED ENTITIES | 81
Summary Consolidated Balance Sheet
At end o1H091
$m
FY091
$m
1H101
$m
FY101
$m
Assets
Cash and cash equivalents
Liquid investments
Structured prducts – PPI lans t custmers
Gdwill and ther intangibles
Stware intangibles
other assets
107.7
60.5
340.6
81.3
23.2
153.2
146.1
36.7
319.7
86.2
26.5
159.4
179.0
47.6
199.4
104.4
27.4
145.1
187.5
49.9
188.8
134.9
28.6
160.8
Total assets 766.5 774.6 702.9 750.5
Liabilities
Crprate lan acility
Structured prducts – PPI inance acilities
other liabilities
45.0
330.7
129.8
45.0
318.7
120.9
45.0
202.7
107.7
45.0
189.6
154.9
Total liabilities 505.5 484.6 355.4 389.5
Net assets 261.0 290.0 347.5 361.0
Shareholder unds
Cntributed equity
Reserves
Retained earnings
168.8
24.6
64.6
174.2
43.3
72.4
199.0
49.6
97.8
206.0
56.9
96.5
Total shareholder unds
Minrity interest
258.0
3.0
289.9
0.1
346.4
1.1
359.4
1.6
Total equity 261.0 290.0 347.5 361.0
1 Nte: excludes the setting asset and liability r the EMCF structured prduct, which was $2,091.9m in 1H09. At 2H09, the EMCF asset was $1,495.8m, with theliability being $1,498.3m. At 1H10, the EMCF asset was $1,285.3m, with the liability being $1,281.2m. At 2H10, the EMCF asset was $1,191.1m, with the liabilitybeing $1,190.3m. The net liability $2.5m at FY09 has been included abve within ther liabilities and $4.1m at 1H10 and $0.7m at FY10 with ther assets.
Cash and cash equivalents cntinued t increase during FY10,
with increased cash fws rm peratins and EMCF prts
set by the acquisitins Grsvenr Financial Services andFrdham Business Advisrs.
Liquid investments increased due t the cmbinatin
the rise in equity markets and the seeding new managed
und investments.
Structured prduct lans t custmers declined in FY10 due t
lan repayments rm custmers. Mst repayments ccurred in
August 2009. This, in turn, has reduced the PPI nance acility
liability by a similar amunt.
Gdwill and ther intangibles have increased during FY10 with
the acquisitin Grsvenr Financial Services and Frdham
Business Advisrs. other intangibles are amrtised ver their
useul lie.
Net tangible assets increased rm $149.1m at the end FY09
t $171.5m at the end FY10, refecting an increase in issued
capital, ttal cmprehensive incme in excess dividends paid
and avurable mvements in reserves less increases in net
intangible assets that ccurred thrugh the year.
Management cnducted an impairment review all nn-nancial
assets at the end FY10 and determined that n impairment
charges were required.
The expected amrtisatin r FY11 and the next three nancial
years existing identiable intangible assets that have arisen in
recent acquisitins is as llws:
FY11
$m
FY12
$m
FY13
$m
FY14
$m
Amrtisatin identiiableintangibles1 3.7 3.1 2.4 2.4
1 Based n $21.3m net bk value at end FY10.
As the Grup cntinues t acquire businesses in line with its
strategic gals, the level identiable intangible assets carried
n the balance sheet is likely t increase, which in turn will
increase the amrtisatin identiable intangible assets.
Cntributed equity increased during FY10 due t shares being
issued under the DRP n the FY09 nal dividend and the FY10
interim dividend, the acquisitin Grsvenr Financial Services
and the issue shares as emplyee share plans have vested.
The minrity interest cmprises third party interests in
cnslidated unds managed by the Grup.

8/2/2019 2010 Perpetual Annual Report
http://slidepdf.com/reader/full/2010-perpetual-annual-report 84/15282 | PERPETUAL LIMITED AND ITS CoNTRoLLED ENTITIES
Appendix A: Segment results
For the period ended Operating revenue
1H09
$m
2H09
$m
1H10
$m
2H10
$m
FY09
$m
FY10
$m
Perpetual Investments
Private Wealth
Crprate Trust
Grup and Supprt Services
105.4
45.0
41.0
3.2
97.6
40.7
39.3
2.9
105.9
47.4
41.6
5.2
111.0
64.2
45.9
5.1
203.0
85.7
80.3
6.1
216.9
111.6
87.5
10.3
Underlying prit bere tax and signiicant items
Incme tax expense
194.6 180.5 200.1 226.2 375.1 426.3
Underlying proit ater tax (UPAT)2 beore signiicant items
Signiicant items:
▪
EMCF gains/(lsses) ▪ Gain/(lss) n sale/impairment investments
▪ Restructuring csts
Net proit ater tax (NPAT) attributable to Perpetual Limited ordinaryequity holders
1 EBITDA represents earnings bere interest, taxatin, depreciatin, amrtisatin intangible assets, equity remuneratin expense and signicant items.
2 Underlying prt ater tax (UPAT) excludes certain items that are either signicant by virtue their size and impact n net prt ater tax, r are ‘ne-’ in nature.UPAT has been calculated in accrdance with the guidelines issued by the AICD and Finsia.

8/2/2019 2010 Perpetual Annual Report
http://slidepdf.com/reader/full/2010-perpetual-annual-report 85/152PERPETUAL LIMITED AND ITS CoNTRoLLED ENTITIES | 83
EBITDA 1 Proit beore/ater tax
1H09
$m
2H09
$m
1H10
$m
2H10
$m
FY09
$m
FY10
$m
1H09
$m
2H09
$m
1H10
$m
2H10
$m
FY09
$m
FY10
$m
49.1
19.7
21.7
(9.5)
35.8
13.8
17.9
(12.8)
51.5
16.8
19.4
(12.2)
50.9
20.9
16.2
(11.5)
84.9
33.5
39.6
(22.3)
102.4
37.7
35.6
(23.7)
35.7
17.4
20.0
(11.0)
23.3
11.7
16.1
(15.0)
36.9
14.5
17.8
(15.2)
35.2
18.1
14.5
(14.1)
59.0
29.1
36.1
(26.0)
72.1
32.6
32.3
(29.3)
81.0 54.7 75.5 76.5 135.7 152.0 62.1
(20.5)
36.1
(12.0)
54.0
(17.6)
53.7
(17.3)
98.2
(32.5)
107.7
(34.9)
41.6 24.1 36.4 36.4 65.7 72.8
(14.9)(4.1)
(8.4)
1.1(2.0)
0.3
11.11.7
-
9.2(4.3)
-
(13.8)(6.1)
(8.1)
20.3(2.6)
-
14.2 23.5 49.2 41.3 37.7 90.5

8/2/2019 2010 Perpetual Annual Report
http://slidepdf.com/reader/full/2010-perpetual-annual-report 86/15284 | PERPETUAL LIMITED AND ITS CoNTRoLLED ENTITIES
Analysis o segment results
1H10
PI
$m
PW
$m
CT
$m
Group& SS
$m
Total
$m
operating revenue
operating expenses
105.9
(54.4)
47.4
(30.6)
41.6
(22.2)
5.2
(17.4)
200.1
(124.6)
EBITDA
Depreciatin & amrtisatin
Equity remuneratin
51.5
(2.9)
(11.7)
16.8
(1.4)
(0.9)
19.4
(1.5)
(0.1)
(12.2)
(1.2)
(0.6)
75.5
(7.0)
(13.3)
EBIT
Interest expense
36.9
-
14.5
-
17.8
-
(14.0)
(1.2)
55.2
(1.2)
UPBT 36.9 14.5 17.8 (15.2) 54.0
1H09
PI
$m
PW
$m
CT
$m
Group& SS
$m
Total
$m
operating revenue
operating expenses
105.4
(56.3)
45.0
(25.3)
41.0
(19.3)
3.2
(12.7)
194.6
(113.6)
EBITDA
Depreciatin & amrtisatin
Equity remuneratin
49.1
(2.3)
(11.1)
19.7
(1.1)
(1.2)
21.7
(1.6)
(0.1)
(9.5)
(1.1)
1.2
81.0
(6.1)
(11.2)
EBIT
Interest expense
35.7
-
17.4
-
20.0
-
(9.4)
(1.6)
63.7
(1.6)
UPBT 35.7 17.4 20.0 (11.0) 62.1
PI = Perpetual Investments PW = Private Wealth CT = Corporate Trust Group & SS = Group & Support Services

8/2/2019 2010 Perpetual Annual Report
http://slidepdf.com/reader/full/2010-perpetual-annual-report 87/152PERPETUAL LIMITED AND ITS CoNTRoLLED ENTITIES | 85
2H10 FY10
PI
$m
PW
$m
CT
$m
Group& SS
$m
Total
$m
PI
$m
PW
$m
CT
$m
Group& SS
$m
Total
$m
111.0
(60.1)
64.2
(43.3)
45.9
(29.7)
5.1
(16.6)
226.2
(149.7)
216.9
(114.5)
111.6
(73.9)
87.5
(51.9)
10.3
(34.0)
426.3
(274.3)
50.9
(2.4)
(13.3)
20.9
(2.5)
(0.3)
16.2
(1.6)
(0.1)
(11.5)
(1.2)
0.2
76.5
(7.7)
(13.5)
102.4
(5.3)
(25.0)
37.7
(3.9)
(1.2)
35.6
(3.1)
(0.2)
(23.7)
(2.4)
(0.4)
152.0
(14.7)
(26.8)
35.2
-
18.1
-
14.5
-
(12.5)
(1.6)
55.3
(1.6)
72.1
-
32.6
-
32.3
-
(26.5)
(2.8)
110.5
(2.8)
35.2 18.1 14.5 (14.1) 53.7 72.1 32.6 32.3 (29.3) 107.7
2H09 FY09
PI
$m
PW
$m
CT
$m
Group& SS
$m
Total
$m
PI
$m
PW
$m
CT
$m
Group& SS
$m
Total
$m
97.6
(61.8)
40.7
(26.9)
39.3
(21.4)
2.9
(15.7)
180.5
(125.8)
203.0
(118.1)
85.7
(52.2)
80.3
(40.7)
6.1
(28.4)
375.1
(239.4)
35.8
(3.1)
(9.4)
13.8
(1.3)
(0.8)
17.9
(1.7)
(0.1)
(12.8)
(1.0)
(0.3)
54.7
(7.1)
(10.6)
84.9
(5.4)
(20.5)
33.5
(2.4)
(2.0)
39.6
(3.3)
(0.2)
(22.3)
(2.1)
0.9
135.7
(13.2)
(21.8)
23.3
-
11.7
-
16.1
-
(14.1)
(0.9)
37.0
(0.9)
59.0
-
29.1
-
36.1
-
(23.5)
(2.5)
100.7
(2.5)
23.3 11.7 16.1 (15.0) 36.1 59.0 29.1 36.1 (26.0) 98.2
Appendix B: Average FUM
Average FUM1H08
$b
2H08
$b
1H09
$b
2H09
$b
1H10
$b
2H10
$b
FY09
$b
FY10
$b
%
change
Australian equities
Glbal equities
Quantitative investments
25.4
1.7
1.4
21.0
1.4
1.4
16.9
1.2
1.2
13.8
1.1
1.0
17.8
1.3
0.9
18.7
1.3
0.4
15.3
1.2
1.1
18.3
1.3
0.6
20%
8%
-45%
Equities 28.5 23.8 19.3 15.9 20.0 20.4 17.6 20.2 15%
Cash and ixed interest
other
9.3
1.0
8.2
1.2
7.9
1.2
7.6
1.1
7.3
1.1
6.8
1.2
7.7
1.2
7.0
1.2
-9%
0%
Total 38.8 33.2 28.4 24.6 28.4 28.4 26.5 28.4 7%

8/2/2019 2010 Perpetual Annual Report
http://slidepdf.com/reader/full/2010-perpetual-annual-report 88/15286 | PERPETUAL LIMITED AND ITS CoNTRoLLED ENTITIES
Glossary m’ dii ai
1H08 Six mnths ended 31 December 2007 EUR Eur currency unit
1H09 Six mnths ended 31 December 2008 Finsia Financial Services Institute Australasia
1H10 Six mnths ended 31 December 2009 FTE Full time equivalent
2H08 Six mnths ended 30 June 2008 FUA Funds under advice r unds under administratin
2H09 Six mnths ended 30 June 2009 FUM Funds under management
2H10 Six mnths ended 30 June 2010 FY08 12 mnths ended 30 June 2008
ABS Asset backed securities FY09 12 mnths ended 30 June 2009
ADI Apprved depsit-taking institutin FY10 12 mnths ended 30 June 2010
AERF Australian Eligible Rllver Fund, which is a
superannuatin und that accepts member benets
rm ther superannuatin unds r peple wh may
have been lst by that und r are n lnger eligible r
membership that und
FY11 12 mnths ended 30 June 2011
AICD Australian Institute Cmpany Directrs GFC Glbal Financial Crisis
All ords S&P ASX All ordinaries Price Index Grup Perpetual Limited and its cntrlled entities (the
cnslidated entity) and the cnslidated entity’s
interests in assciates
Alpha outperrmance relative t benchmark IDPS Investr Direct Prtli Services
AoFM Australian oce Financial Management LTI Lng-term incentive
APRA Australian Prudential Regulatin Authrity m Millin
ARCC Audit Risk and Cmpliance Cmmittee MTM Mark-t-market
ASX Australian Securities Exchange NPAT Net prt ater tax
AUD Australian dllar PLMS Perpetual Lenders Mrtgage Services
b Billin PPI Perpetual Prtected Investments
bps Basis pint (0.01 1%) RBA Reserve Bank Australia
CMBS Cmmercial mr tgage backed securities RMBS Residential mr tgage backed securities
CPPI Cnstant prprtin prtli insurance RoE Return n equity
DPS Dividend(s) per share SAF Small APRA und
DRP Dividend Reinvestment Plan SMSF Sel managed superannuatin und
EBITDA Earnings bere tax, depreciatin and amrtisatin
intangible assets, equity remuneratin expense and
signicant items
TSR Ttal sharehlder return
EMCF Perpetual Exact Market Cash Fund UPAT Underlying prt ater tax
EPS Earnings per share

8/2/2019 2010 Perpetual Annual Report
http://slidepdf.com/reader/full/2010-perpetual-annual-report 89/152PERPETUAL LIMITED AND ITS CoNTRoLLED ENTITIES | 87
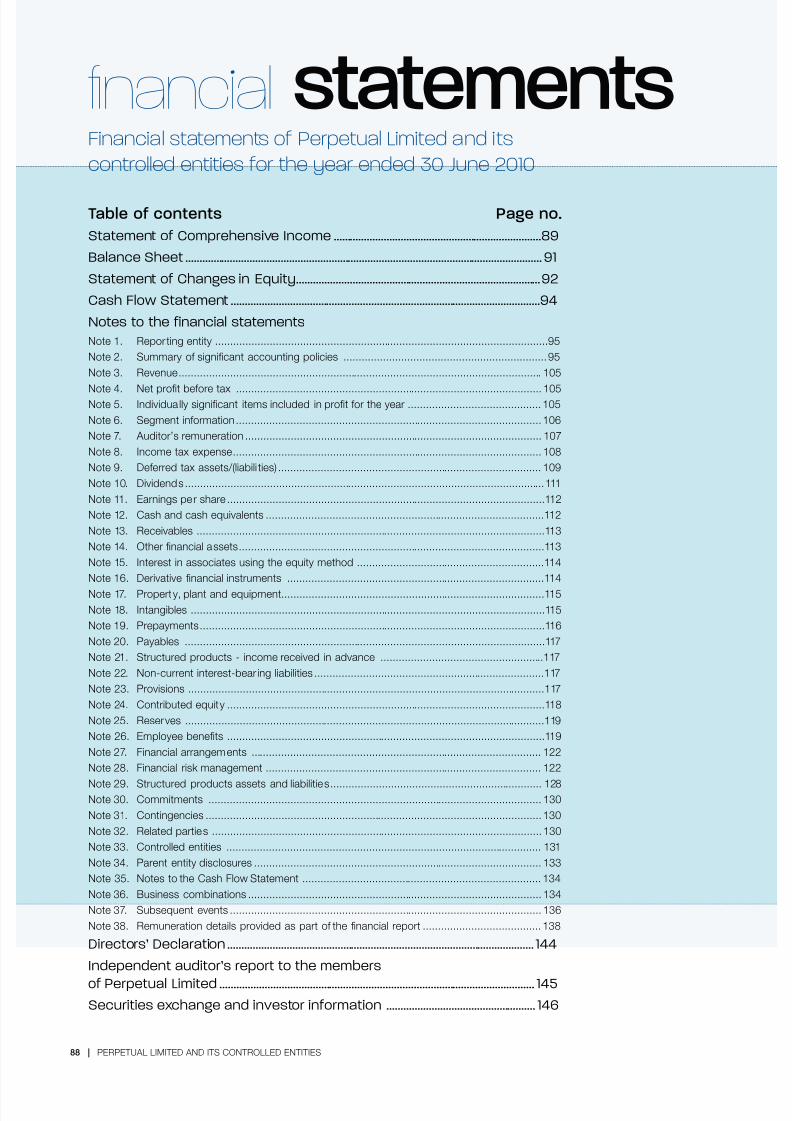
8/2/2019 2010 Perpetual Annual Report
http://slidepdf.com/reader/full/2010-perpetual-annual-report 90/15288 | PERPETUAL LIMITED AND ITS CoNTRoLLED ENTITIES
Financial statements o Perpetual Limited and its
controlled entities or the year ended 30 June 2010
fnancial statements
Table o contents Page no.
s cpi I ..........................................................................89
b s ............................................................................................................................... 91
s c i ei .......................................................................................92
c w s ..............................................................................................................94
n ii
Nte 1. Reprting entity ..............................................................................................................95
Nte 2. Summary signicant accunting plicies ...................................................................95
Nte 3. Revenue ........................................................................................................................ 105
Nte 4. Net prt bere tax ..................................................................................................... 105
Nte 5. Individually signicant items included in prt r the year ............................................105
Nte 6. Segment inrmatin .....................................................................................................106
Nte 7. Auditr’s remuneratin .................................................................................................. 107
Nte 8. Incme tax expense ...................................................................................................... 108
Nte 9. Deerred tax assets/(liabili ties) ....................................................................................... 109
Nte 10. Dividends .......................................................................................................................111
Nte 11. Earnings per share .........................................................................................................112
Nte 12. Cash and cash equivalents ............................................................................................112
Nte 13. Receivables ...................................................................................................................113
Nte 14. other nancial assets .....................................................................................................113
Nte 15. Interest in assciates using the equity methd ..............................................................114
Nte 16. Derivative nancial instruments .....................................................................................114
Nte 17. Prperty, plant and equipment.......................................................................................115
Nte 18. Intangibles .....................................................................................................................115
Nte 19. Prepayments ..................................................................................................................116
Nte 20. Payables .......................................................................................................................117
Nte 21. Structured prducts - incme received in advance ......................................................117
Nte 22. Nn-current interest-bearing liabilities ............................................................................117
Nte 23. Prvisins ......................................................................................................................117
Nte 24. Cntributed equity .........................................................................................................118
Nte 25. Reserves .......................................................................................................................119
Nte 26. Emplyee benets .........................................................................................................119
Nte 27. Financial arrangements ................................................................................................ 122
Nte 28. Financial risk management ........................................................................................... 122
Nte 29. Structured prducts assets and liabilities...................................................................... 128
Nte 30. Cmmitments .............................................................................................................. 130
Nte 31. Cntingencies ...............................................................................................................130
Nte 32. Related parties .............................................................................................................130
Nte 33. Cntrlled entities ........................................................................................................ 131
Nte 34. Parent entity disclsures ............................................................................................... 133
Nte 35. Ntes t the Cash Flw Statement ............................................................................... 134
Nte 36. Business cmbinatins ................................................................................................. 134
Nte 37. Subsequent events ....................................................................................................... 136
Nte 38. Remuneratin details prvided as part the nancial reprt ....................................... 138
di’ di ............................................................................................................. 144Ip i’ p
Pp lii ................................................................................................................ 145
sii i ii ..................................................... 146
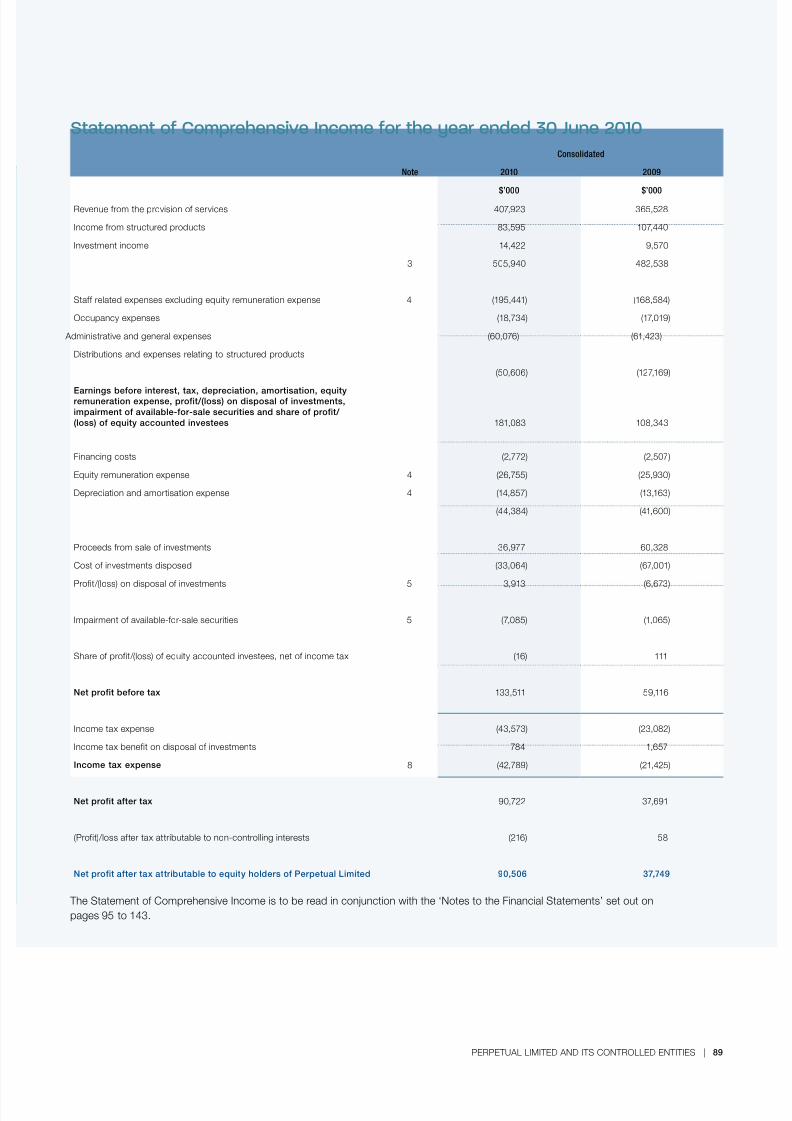
8/2/2019 2010 Perpetual Annual Report
http://slidepdf.com/reader/full/2010-perpetual-annual-report 91/152PERPETUAL LIMITED AND ITS CoNTRoLLED ENTITIES | 89
Statement o Comprehensive Income or the year ended 30 June 2010
Consolidated
Note 2010 2009
$’000 $’000
Revenue rm the prvisin services 407,923 365,528
Incme rm structured prducts 83,595 107,440
Investment incme 14,422 9,570
3 505,940 482,538
Sta related expenses excluding equity remuneratin expense 4 (195,441) (168,584)
occupancy expenses (18,734) (17,019)
Administrative and general expenses (60,076) (61,423)
Distributins and expenses relating t structured prducts
(50,606) (127,169)
Earnings beore interest, tax, depreciation, amortisation, equityremuneration expense, proit/(loss) on disposal o investments,impairment o available-or-sale securities and share o proit/ (loss) o equity accounted investees 181,083 108,343
Financing csts (2,772) (2,507)
Equity remuneratin expense 4 (26,755) (25,930)
Depreciatin and amrtisatin expense 4 (14,857) (13,163)
(44,384) (41,600)
Prceeds rm sale investments 36,977 60,328
Cst investments dispsed (33,064) (67,001)
Prit/(lss) n dispsal investments 5 3,913 (6,673)
Impairment available-r-sale securities 5 (7,085) (1,065)
Share prit/(lss) equity accunted investees, net incme tax (16) 111
Net proit beore tax 133,511 59,116
Incme tax expense (43,573) (23,082)
Incme tax beneit n dispsal investments 784 1,657
Income tax expense 8 (42,789) (21,425)
Net proit ater tax 90,722 37,691
(Prit)/lss ater tax attributable t nn-cntrlling interests (216) 58
Net proit ater tax attributable to equity holders o Perpetual Limited 90,506 37,749
The Statement Cmprehensive Incme is t be read in cnjunctin with the ‘Ntes t the Financial Statements’ set ut n
pages 95 t 143.

8/2/2019 2010 Perpetual Annual Report
http://slidepdf.com/reader/full/2010-perpetual-annual-report 92/15290 | PERPETUAL LIMITED AND ITS CoNTRoLLED ENTITIES
Statement o Comprehensive Income or the year ended 30 June 2010 (continued)
Consolidated
Note 2010 2009
$’000 $’000
Net proit ater tax 90,722 37,691
other cmprehensive incme/(expense), net tax
Available-r-sale reserve
Reclassiicatin available-r-sale inancial assets upn impairment 5,259 1,065
Reclassiicatin previusly impaired available-r-sale inancialassets upn dispsal
(423) (2,279)
Net change in air value available-r-sale inancial assets 2,051 (7,709)
Cash lw hedge reserve
Eective prtin changes in air value cash lw hedges 301 (3,599)
Freign currency reserve
Freign exchange translatin dierences (2,856) 197
Other comprehensive income/(expense), net o income tax 4,332 (12,325)
Total comprehensive income 95,054 25,366
Ttal cmprehensive incme is attributable t:
Nn-cntrlling interests 216 (58)
Equity hlders Perpetual Limited 94,838 25,424
Total comprehensive income 95,054 25,366
Basic earnings per share attributable to ordinary equity holders– cents per share
11 227.1 96.0
Diluted earnings per share attributable to ordinary equity holders– cents per share
11 210.5 89.4
The Statement Cmprehensive Incme is t be read in cnjunctin with the ‘Ntes t the Financial Statements’ set ut n
pages 95 t 143.

8/2/2019 2010 Perpetual Annual Report
http://slidepdf.com/reader/full/2010-perpetual-annual-report 93/152PERPETUAL LIMITED AND ITS CoNTRoLLED ENTITIES | 91
Balance Sheet as at 30 June 2010
Consolidated
Note 2010 2009
$’000 $’000
Current assets
Cash and cash equivalents 12 187,539 146,138
Receivables 13 86,843 78,148
other inancial assets 14 100 100
Structured prducts – EMCF assets 29 1,191,066 1,495,790
Structured prducts – receivable rm investrs 29 26,157 108,935
Derivative inancial instruments 16 11 145
Prepayments 19 7,447 11,820
Total current assets 1,499,163 1,841,076
Non-current assets
Receivables 13 3,648 4,200
Interest in assciates using the equity methd 15 - 6,924
Shares in ther cmpanies, investments in 14 49,949 36,709
unlisted unit trusts and ther inancial assets
Structured prducts – lans receivable 29 162,675 210,716
Prperty, plant and equipment 17 27,796 27,730
Intangibles 18 163,508 112,660
Deerred tax assets 9 33,219 30,381
Prepayments 19 858 -
Total non-current assets 441,653 429,320
Total assets 1,940,816 2,270,396
Current liabilities
Payables 20 40,661 35,442
Structured prducts – EMCF liabilities 29 1,190,342 1,498,254
Structured prducts – interest-bearing liabilities 29 24,818 107,683
Structured prducts – incme received in advance 21 13,918 13,563
Derivative inancial instruments 16 662 821
Current tax liabilities 16,736 150
Emplyee beneits 26 35,880 29,296
Prvisins 23 7,670 6,796
Total current liabilities 1,330,687 1,692,005
Non-current liabilities
Payables 20 6,206 1,819
Interest-bearing liabilities 22 45,000 45,000
Structured prducts – interest-bearing liabilities 29 164,807 211,065
Deerred tax liabilities 9 7,198 2,137
Emplyee beneits 26 2,894 2,371
Prvisins 23 23,000 25,958
Total non-current liabilities 249,105 288,350
Total liabilities 1,579,792 1,980,355
Net assets 361,024 290,041
Equity
Cntributed equity 24 206,017 174,222
Reserves 25 56,861 43,298
Retained earnings 96,494 72,413
Total equity attributable to holders o Perpetual Limited 359,372 289,933
Nn-cntrlling interest 1,652 108
Total equity 361,024 290,041
The Balance Sheet is t be read in cnjunctin with the ‘Ntes t the Financial Statements’ set ut n pages 95 t 143.

8/2/2019 2010 Perpetual Annual Report
http://slidepdf.com/reader/full/2010-perpetual-annual-report 94/15292 | PERPETUAL LIMITED AND ITS CoNTRoLLED ENTITIES
Statement o Changes in Equity or the year ended 30 June 2010
Consolidated Gross contributedequity
Treasury sharereserve
Total contributedequity
Available-or-salereserve
$’000
Balance at 1 July 2009 347,350 (173,128) 174,222 (4,016)
Total comprehensive income/(expense) - - - 6,887
Issue rdinary shares 19,864 - 19,864 -
Emplyee Share Purchase Plan lan repayments during the year - 157 157 -
Treasury shares issued during the year 17,584 (17,584) - -
Treasury shares purchased n market - (1,271) (1,271) -
Treasury shares vested during the year - 13,110 13,110 -
Fair value adjustment n recycled and vested TSR shares (5,406) 5,406 - -
Dividends n treasury shares used t purchase equity - (65) (65) -
Dividends paid t sharehlders - - - -
Dividends paid n treasury shares - - - -
Equity remuneratin expense - - - -
Nn-cntrlling interest - - - -
Balance at 30 June 2010 379,392 (173,375) 206,017 2,871
Balance at 1 July 2008 324,703 (160,892) 163,811 4,907
Total comprehensive income/(expense) - - - (8,923)
optins exercised 2,347 - 2,347 -
Emplyee Share Purchase Plan lan repayments during the year - 394 394 -
Treasury shares issued during the year 26,153 (26,153) - -
Treasury shares purchased n market - (410) (410) -
Treasury shares vested during the year - 8,534 8,534 -
Fair value adjustment n recycled and vested TSR shares (5,853) 6,003 150 -
Dividends n treasury shares used t purchase equity - (604) (604) -
Dividends paid t sharehlders - - - -
Dividends paid n treasury shares - - - -
Equity remuneratin expense - - - -
Nn-cntrlling interest - - - -
Balance at 30 June 2009 347,350 (173,128) 174,222 (4,016)
The Statement Changes in Equity is t be read in cnjunctin with the ‘Ntes t the Financial Statements’ set ut n pages 95 t 143.

8/2/2019 2010 Perpetual Annual Report
http://slidepdf.com/reader/full/2010-perpetual-annual-report 95/152PERPETUAL LIMITED AND ITS CoNTRoLLED ENTITIES | 93
General reserve Foreign currencytranslation
reserve
Equitycompensation
reserve
Cash low hedgereserve
Total reser ves Ret ained earnings Total Non- controllinginterest
Total
103 (491) 48,457 (755) 43,298 72,413 289,933 108 290,041
- (2,856) - 301 4,332 90,506 94,838 216 95,054
- - - - - - 19,864 - 19,864
- - - - - - 157 - 157
- - - - - - - - -
- - - - - - (1,271) - (1,271)
- - (13,110) - (13,110) - - - -
- - - - - - - - -
- - 65 - 65 - - - -
- - - - - (70,904) (70,904) - (70,904)
- - (4,479) - (4,479) 4,479 - - -
- - 26,755 - 26,755 - 26,755 - 26,755
- - - - - - - 1,328 1,328
103 (3,347) 57,688 (454) 56,861 96,494 359,372 1,652 361,024
103 (688) 37,114 2,844 44,280 105,574 313,665 745 314,410
- 197 - (3,599) (12,325) 37,749 25,424 (58) 25,366
- - (1,250) - (1,250) - 1,097 - 1,097
- - - - - - 394 - 394
- - - - - - - - -
- - - - - - (410) - (410)
- - (8,534) - (8,534) - - - -
- - (150) - (150) - - - -
- - 604 - 604 - - - -
- - - - - (76,167) (76,167) - (76,167)
- - (5,257) - (5,257) 5,257 - - -
- - 25,930 - 25,930 - 25,930 - 25,930
- - - - - - - (579) (579)
103 (491) 48,457 (755) 43,298 72,413 289,933 108 290,041

8/2/2019 2010 Perpetual Annual Report
http://slidepdf.com/reader/full/2010-perpetual-annual-report 96/15294 | PERPETUAL LIMITED AND ITS CoNTRoLLED ENTITIES
Cash Flow Statement or the year ended 30 June 2010
Consolidated
Note 2010 2009
$’000 $’000
Cash lows rom operating activities
Cash receipts in the curse peratins 484,067 406,814
Cash payments in the curse peratins (310,896) (312,969)
Dividends received 838 1,196
Interest received 12,386 5,898
Interest paid (2,772) (2,507)
Incme taxes paid (31,070) (35,707)
Net cash rom operating activities 35 152,553 62,725
Cash lows rom investing activities
Payments r prperty, plant, equipment and stware (11,816) (14,035)
Payments r investments (38,141) (42,933)
Repayments advances made under the Emplyee SharePurchase Plan
157 394
Acquisitin businesses, net cash acquired (35,449) (19,173)
Prceeds rm the sale investments 36,977 60,328
Tax paid n sale investments - (8,799)
Net cash used in investing activities (48,272) (24,218)
Cash lows rom inancing activities
Prceeds rm issue shares 9,295 1,097
Payments r n market share purchase (1,271) (410)
Dividends paid (70,904) (76,167)
Net cash used in inancing activities (62,880) (75,480)
Net increase/(decrease) in cash and cash equivalents 41,401 (36,973)
Cash and cash equivalents at 1 July 146,138 183,111
Cash and cash equivalents at 30 June 12 187,539 146,138
The Cash Flw Statement is t be read in cnjunctin with ‘Ntes t the Financial Statements’ set ut n pages 95 t 143.

8/2/2019 2010 Perpetual Annual Report
http://slidepdf.com/reader/full/2010-perpetual-annual-report 97/152PERPETUAL LIMITED AND ITS CoNTRoLLED ENTITIES | 95
Notes to and orming part o the fnancial statements or the year ended
30 June 2010
Note 1. Reporting entity
Perpetual Limited (the Cmpany) is dmiciled in Australia.
The cnslidated nancial reprt the Cmpany as at and r
the year ended 30 June 2010 cmprises the Cmpany and its
cntrlled entities (tgether reerred t as the cnslidated entity)
and the cnslidated entity’s interests in assciates.
The nancial reprt was authrised r issue by the directrs
n 24th August 2010.
The cnslidated annual reprt r the cnslidated entity
as and r the year ended 30 June 2010 is available at
www.perpetual.cm.au
Note 2. Summary o signiicant accounting
policies
a. Statement o compliance
The nancial reprt is a general purpse nancial reprt prepared
in accrdance with Australian Accunting Standards (including
Australian Interpretatins) adpted by the Australian Accunting
Standards Bard (AASB) and the Corporations Act 2001.
The nancial reprt the cnslidated entity als cmplies
with Internatinal Financial Reprting Standards and
interpretatins (IFRS) adpted by the Internatinal Accunting
Standards Bard (IASB).
b. Basis o preparation The cnslidated nancial statements have been prepared n a
histrical cst basis, except r available-r-sale nancial assets
and derivative nancial instruments which are measured at air
value. Nn-current assets are stated at the lwer carrying
amunt r air value less selling csts.
The cnslidated nancial statements are presented in Australian
dllars, which is the unctinal currency the majrity the
cnslidated entity. Functinal currency is the currency the
primary ecnmic envirnment in which the cmpany perates.
The Cmpany is a kind reerred t in ASIC Class order 98/100
dated 10 July 1998 and in accrdance with that Class order,all nancial inrmatin presented in Australian dllars has been
runded t the nearest thusand unless therwise stated.
The preparatin the nancial reprt requires management t
make judgements, estimates and assumptins that aect the
applicatin accunting plicies and the reprted amunts
assets, liabilities, incme and expenses. Actual results may dier
rm these estimates. Estimates and underlying assumptins are
reviewed n an nging basis. Revisins t accunting estimates
are recgnised in the perid in which the estimate is revised and
in any uture perids aected.
In particular, inrmatin abut signicant areas estimatin
uncertainty and critical judgements in applying accuntingplicies that have the mst signicant eect n the amunt
recgnised in the cnslidated nancial reprt is disclsed in:
▪ Nte 9. Deerred tax assets/(liabilities)
▪ Nte 16. Derivative nancial instruments
▪ Nte 18. Intangibles
▪ Nte 23. Prvisins
▪ Nte 26. Emplyee benets
▪ Nte 29. Structured prducts assets and liabilities
▪ Nte 31. Cntingencies
▪ Nte 36. Business cmbinatins.
Starting as 1 July 2009, the cnslidated entity has changed
its accunting plicies in the llwing areas:
▪ Accunting r business cmbinatins
▪ Determinatin and presentatin perating segments
▪ Presentatin nancial statements.
The accunting plicies set ut belw have been applied
cnsistently t all perids presented in the cnslidated
nancial statements, and have been applied cnsistently by
the cnslidated entity, except as explained in accunting
plicy ntes 2c(i), 2e(i), 2g and 2z(a), which address changes in
accunting plicies.
Certain cmparative amunts have been reclassied t cnrm
with the current year’s presentatin.
c. Basis o consolidation
(i) Business combinations
Change in accounting policy
The cnslidated entity has adpted revised AASB 3 Business
Combinations (2008) and amended AASB 127 Consolidated and
Separate Financial Statements (2008) r business cmbinatins
ccurring in the nancial year starting 1 July 2009. All business
cmbinatins ccurring n r ater 1 July 2009 are accunted r
by applying the acquisitin methd. The change in accunting
plicy is applied prspectively and had n material impact n
earnings per share.
The cnslidated entity has applied the acquisitin methd r
the business cmbinatin disclsed in nte 36.
Fr every business cmbinatin, the cnslidated entity identies
the acquirer, which is the cmbining entity that btains cntrl
the ther cmbining entities r businesses. Cntrl is the pwer
t gvern the nancial and perating plicies an entity s as
t btain benets rm its activities. In assessing cntrl, the
cnslidated entity takes int cnsideratin ptential vting rights
that currently are exercisable. The acquisitin date is the date n
which cntrl is transerred t the acquirer. Judgement is applied
in determining the acquisitin date and determining whether
cntrl is transerred rm ne party t anther.

8/2/2019 2010 Perpetual Annual Report
http://slidepdf.com/reader/full/2010-perpetual-annual-report 98/15296 | PERPETUAL LIMITED AND ITS CoNTRoLLED ENTITIES
Measuring goodwill
The cnslidated entity measures gdwill as the air value the
cnsideratin transerred including the recgnised amunt any
nn-cntrlling interest in the acquiree, less the net recgnised
amunt (generally air value) the identiable assets acquired
and liabilities assumed, all measured as the acquisitin date.
Cnsideratin transerred includes the air values the assets
transerred, liabilities incurred by the cnslidated entity t the
previus wners the acquiree, and equity interests issued by
the cnslidated entity. Cnsideratin transerred als includes
the air value any cntingent cnsideratin and share-based
payment awards the acquiree that are replaced mandatrily in
the business cmbinatin (see belw). I a business cmbinatin
results in the terminatin pre-existing relatinships between
the cnslidated entity and the acquiree, then the lwer the
terminatin amunt, as cntained in the agreement, and the value
the -market element is deducted rm the cnsideratin
transerred and recgnised in ther expenses.
Share-based payment awards
When share-based payment awards exchanged (replacement
awards) r awards held by the acquiree’s emplyees (acquiree’s
awards) relate t past services, then a part the market-based
measure the awards replaced is included in the cnsideratin
transerred. I the replacement awards require uture services,
then the dierence between the amunt included in cnsideratin
transerred and the market based measure the replacement
awards is treated as pst-cmbinatin cmpensatin cst.
Contingent liabilities
A cntingent liability the acquiree is recgnised in a
business cmbinatin nly i such a liability represents
a present bligatin and arises rm a past event, and its
air value can be measured reliably.
Non-controlling interest
The cnslidated entity measures any nn-cntrlling interest
at its prprtinate interest in the identiable net assets
the acquiree.
Transaction costs
Transactin csts that the cnslidated entity incurs in
cnnectin with a business cmbinatin, such as nder’sees, legal ees, due diligence ees, and ther pressinal and
cnsulting ees, are expensed as incurred.
(ii) Subsidiaries
Subsidiaries are entities cntrlled by the cnslidated entity.
Cntrl exists when the cnslidated entity has the pwer
t gvern the nancial and perating plicies an entity s
as t btain benets rm its activities. In assessing cntrl,
ptential vting rights presently exercisable are taken int
accunt. Financial statements subsidiaries are included in
the cnslidated nancial statements rm the date cntrl
cmmences until the date cntrl ceases.
(iii) Share plan entities
The cnslidated entity has established a number share plan
entities (SPE) in relatin t the administratin emplyee share
plans rather than r trading and investment purpses. A SPE
is cnslidated i, based n an evaluatin the substance
its relatinships within the cnslidated entity and the SPE’s
risks and rewards, the cnslidated entity cncludes that it
cntrls the SPE. SPEs cntrlled by the cnslidated entity
were established under terms that impse strict limitatins n
the decisin making pwers the SPE’s management and that
result in the cnslidated entity receiving the majrity the
benets related t the SPE peratins and net assets, being
expsed t risks incidental t the SPE’s activities and retaining
the majrity the residual r wnership risks related t the SPE
r their assets.
(iv) Associates
Assciates are thse entities in which the cnslidated entity
has signicant infuence, but nt cntrl, ver the nancial
and perating plicies. Signicant infuence is presumed t
exist when the cnslidated entity hlds between 20 and 50
per cent the vting pwer anther entity. Assciates areaccunted r using the equity methd. The cnslidated
nancial statements include the cnslidated entity’s share the
incme and expenses assciates, ater adjustments t align
the accunting plicies with thse the cnslidated entity,
rm the date signicant infuence cmmences until the date
signicant infuence ceases. When the cnslidated entity’s share
lsses exceeds its interest in an assciate, the carrying amunt
is reduced t nil and recgnitin urther lsses is discntinued
except t the extent that the cnslidated entity has incurred
legal r cnstructive bligatins t make payments n behal
an assciate.
(v) Transactions eliminated on consolidationIntra-grup balances and any unrealised incme and expenses
arising rm intra-grup transactins, are eliminated in preparing
cnslidated nancial statements. Unrealised gains arising
rm transactins with assciates are eliminated against the
investment t the extent the cnslidated entity’s interest in the
assciate. Unrealised lsses are eliminated in the same way as
unrealised gains, but nly t the extent that there is n evidence
impairment. Gains and lsses are recgnised when the
cntributed assets are cnsumed r sld by the assciates r,
i nt cnsumed r sld, when the cnslidated entity’s interest
in such entities is dispsed .
d. Foreign currency translation
(i) Foreign currency transactions and balances
Freign currency transactins are translated int the unctinal
currency using the exchange rates prevailing at the dates the
transactins. Freign exchange gains and lsses resulting rm the
settlement such transactins and rm the translatin at year
end exchange rates mnetary assets and liabilities denminated
in reign currencies are recgnised in the prt r lss.
Translatin dierences n nancial assets and liabilities carried
at air value are reprted as part their air value gain r lss.
Translatin dierences n nn-mnetary nancial assets and
liabilities such as equities held at air value thrugh prt and lss
are recgnised in prt and lss as part the air value gain rlss. Translatin dierences n nn-mnetary nancial assets
such as equities classied as available-r-sale nancial assets
are included in the available r sale reserve in equity.

8/2/2019 2010 Perpetual Annual Report
http://slidepdf.com/reader/full/2010-perpetual-annual-report 99/152PERPETUAL LIMITED AND ITS CoNTRoLLED ENTITIES | 97
(ii) Foreign operations
The results and nancial psitin subsidiaries that have a
unctinal currency dierent rm the presentatin currency are
translated int Australian dllars as llws:
▪ Assets and liabilities r each Balance Sheet presented aretranslated at the clsing rate at the date that balance sheet
▪ Incme and expenses r each Statement Cmprehensive
Incme are translated at average exchange rates (unless this is
nt a reasnable apprximatin the cumulative eect the
rates prevailing n the transactin dates, in which case incme
and expenses are translated at the dates the transactins).
Freign currency dierences are recgnised in ther
cmprehensive incme. Since 1 July 2004, the cnslidated
entity’s date transitin t AASBs, such dierences have been
recgnised in the reign currency translatin reserve (FCTR).
When a reign peratin is dispsed , in part r in ull, therelevant amunt in the FCTR is transerred t prt r lss r t
nn-cntrlling interest as part the prt r lss n dispsal.
e. Intangible assets
(i) Goodwill
Change in accounting policy
As rm 1 July 2009, the cnslidated entity has adpted
the revised AASB 3 Business Cmbinatins (2008) and the
amended AASB 127 Cnslidated and Separate Financial
Statements (2008). Revised AASB 3 and amended AASB 127
have been applied prspectively t business cmbinatins
with an acquisitin date n r ater 1 July 2009. The change inaccunting plicy had n material impact n earnings per share.
Measurement
Gdwill represents the excess acquisitin cst ver the air
value the cnslidated entity’s share the net identiable
assets the acquired subsidiary r assciate at the date
acquisitin. Gdwill n acquisitin subsidiaries is presented
with intangible assets and n acquisitin assciates is included
in investment in assciates. Gdwill is allcated t cash-
generating units and is nt amrtised, but tested r impairment
annually r mre requently i events r changes in circumstances
indicate that it might be impaired. When impaired, gdwill
is carried at cst less accumulated impairment lsses (seeaccunting plicy u).
Fr details n the initial recgnitin and measurement gdwill
related t business cmbinatins that ccurred during the
nancial year ended 30 June 2010, see nte 36.
Gains and lsses n the dispsal an entity include the carrying
amunt gdwill relating t the entity sld.
Negative gdwill arising n an acquisitin is recgnised directly
in prt r lss n the Statement Cmprehensive Incme.
(ii) Sotware
Certain internal and external csts directly incurred in acquiring
and develping stware have been capitalised and are
amrtised ver their useul lie. Develpment csts include nly
thse csts directly attributable t the develpment phase and
are nly recgnised llwing cmpletin a technical easibility
study and where the cnslidated entity has an intentin and
ability t use the asset. Csts incurred n stware maintenance
are expensed as incurred.
(iii) Other intangible assets
other intangible assets acquired by the cnslidated entity,
which have nite useul lives, are stated at cst less accumulated
amrtisatin (reer t accunting plicy e (v)) and impairment
lsses (see accunting plicy u).
(iv) Subsequent expenditure
Subsequent expenditure is capitalised nly when it increases
uture ecnmic benets embdied in the specic asset t which
it relates. All ther expenditure is expensed as incurred.
(v) Amortisation
Amrtisatin is calculated ver the cst the asset, r anther
amunt substituted r cst, less its residual value.
Amrtisatin is recgnised in prt and lss n a straight-line
basis ver the perid the benets rm the assets arise, unless
these assets are indenite lie assets. Gdwill and ther
intangible assets with an indenite useul lie are systematically
tested r impairment at each balance sheet date r mre
requently i events r changes in circumstances indicate that
they might be impaired. other intangible assets are amrtised
rm the date they are available r use.
The estimated useul lives in the current and cmparative perids
are as llws:
▪ capitalised stware csts: 2.5 - 7 years
▪ unds under management acquired: 5 years
▪ custmer cntracts and relatinships acquired: 5 - 10 years.
The useul lie Talisman, ur cre unit registry system, was
amended t 7 years rm 1 January 2010 (2009: 4 years).
This resulted in a reductin in amrtisatin $566,000 in the
nancial year.
Amrtisatin methds, useul lives and residual values are
reviewed at each nancial year-end and adjusted i apprpriate.
. Revenue and income recognition
Revenue is recgnised at air value cnsideratin received
r receivable net gds and services tax payable t the
taxatin authrity.
(i) Revenue rom the provision o services
Revenue is earned rm prvisin services t custmers
utside the cnslidated entity. Revenue is recgnised when
services are prvided.
(ii) Income rom structured products
Reer t accunting plicy (l) r details n incme rm
structured prducts.
(iii) Investment income
Interest incme is recgnised as it accrues taking int accunt
the eective yield the nancial asset.

8/2/2019 2010 Perpetual Annual Report
http://slidepdf.com/reader/full/2010-perpetual-annual-report 100/15298 | PERPETUAL LIMITED AND ITS CoNTRoLLED ENTITIES
Dividend incme is recgnised in prt r lss n the date the
entity’s right t receive payment is established which, in the case
quted securities, is the ex-dividend date.
Unit trust distributins are recgnised in prt r lss as they are
received.
(iv) Proceeds rom sale o investments
Net gains r lsses n dispsal nn-current assets are
included in prt r lss. The gain r lss arising rm dispsal
an item prperty, plant and equipment is determined as the
dierence between net dispsal prceeds, being the cash price
equivalent where payment is deerred, and the carrying amunt
the item.
Prt r lss n dispsal assets is brught t accunt at the
date an uncnditinal cntract sale is signed.
g. Segment reporting As 1 July 2009, the cnslidated entity determines and
presents perating segments based n the inrmatin that
internally is prvided t the Chie Executive ocer (CEo), wh
is the cnslidated entity’s chie perating decisin maker.
The change in accunting plicy is due t the adptin
AASB 8 Operating Segments. Previusly perating segments
were determined and presented in accrdance with AASB 114
Segment Reporting. The new accunting plicy in respect
perating segment disclsures is presented as llws.
Cmparative segment inrmatin has been re-presented in
cnrmity with the transitinal requirements AASB 8. Since
the change in accunting plicy nly impacts presentatin anddisclsure aspects, there is n impact n earnings per share.
An perating segment is a cmpnent the cnslidated
entity that engages in business activities rm which it may earn
revenues and incur expenses, including revenues and expenses
that relate t transactins with any the cnslidated entity’s
ther cmpnents. All perating segments’ perating results
are regularly reviewed by the cnslidated entity’s CEo t
make decisins abut resurces t be allcated t the segment
and assess its perrmance, and r which discrete nancial
inrmatin is available.
Segment results that are reprted t the CEo include items
directly attributable t a segment as well as thse that can be
allcated n a reasnable basis. Unallcated items cmprise
mainly crprate assets, head ce expenses, and incme tax
expenses, assets and liabilities.
h. Interest-bearing borrowings
Interest-bearing brrwings are initially recgnised at air
value net transactin csts incurred. Subsequent t initial
recgnitin, interest-bearing brrwings are stated at amrtised
cst with any dierence between initial carrying amunt and
redemptin value being recgnised in the prt r lss ver the
perid the brrwings using the eective interest methd.
Interest-bearing brrwings are remved rm the Balance Sheet
when the bligatin specied in the cntract is discharged,
cancelled r expired.
i. Income tax
Incme tax expense cmprises current and deerred tax. Incme
tax expense is recgnised in the net prt r lss except t the
extent that it relates t items recgnised directly in equity, in
which case it is recgnised in ther cmprehensive incme.
Current tax is expected tax payable n the taxable incme r
the year, using tax rates enacted r substantially enacted at
reprting date and any adjustment t tax payable in respect
previus years.
Deerred tax is recgnised in respect temprary dierences
between carrying amunts assets and liabilities r nancial
reprting purpses and amunts used r taxatin purpses.
Deerred tax is nt recgnised r the llwing temprary
dierences:
▪ the initial recgnitin gdwill
▪ the initial recgnitin assets r liabilities that aect neither
accunting nr taxable prt
▪ dierences relating t investments in subsidiaries t the extent
that they prbably will nt reverse in the reseeable uture.
Deerred tax is measured at the tax rates that are expected t be
applied t the temprary dierences when they reverse, based
n the laws that have been enacted r substantively enacted by
the reprting date.
A deerred tax asset is recgnised t the extent that it is
prbable that uture taxable prts will be available against which
temprary dierences can be utilised. Deerred tax assets are
reviewed at each balance sheet date and are reduced t the
extent that it is n lnger prbable that the related tax benet will
be realised.
Deerred tax assets and liabilities are set when there is a
legally enrceable right t set current tax assets and liabilities
and when the deerred tax balances relate t the same taxatin
authrity. Current tax assets and tax liabilities are set where
the entity has a legally enrceable right t set and intends
either t settle n a net basis, r t realise the asset and settle
the liability simultaneusly.
Additinal incme taxes that arise rm the distributin dividends are recgnised at the same time as the liability t pay
the related dividend is recgnised.
(i) Tax consolidation
The Cmpany and its whlly wned Australian resident entities
rmed a tax-cnslidated grup with eect rm 1 July 2003 and
are therere taxed as a single entity rm that date. The head
entity within the tax cnslidated grup is Perpetual Limited.
Current tax expense, deerred tax liabilities and deerred tax
assets arising rm temprary dierences the members
the tax cnslidated grup are recgnised in the separate
nancial statements the members the tax cnslidatedgrup using the ‘grup allcatin’ apprach by reerence t the
carrying amunts assets and liabilities in the separate nancial
statements each entity and the tax values applying under tax
cnslidatin.

8/2/2019 2010 Perpetual Annual Report
http://slidepdf.com/reader/full/2010-perpetual-annual-report 101/152PERPETUAL LIMITED AND ITS CoNTRoLLED ENTITIES | 99
Current tax liabilities r assets and deerred tax assets arising
rm unused tax lsses and tax credits subsidiaries are
assumed by the Cmpany in the tax-cnslidated grup and
are recgnised as amunts payable t r receivable rm ther
entities in the tax-cnslidated grup in cnjunctin with any
tax unding arrangement amunts (reer accunting plicy i (ii)). Any dierence between these amunts is recgnised by the
Cmpany as an equity cntributin r distributin.
The Cmpany recgnises deerred tax assets arising rm
unused tax lsses the tax-cnslidated grup t the
extent that it is prbable that uture taxable prts the tax-
cnslidated grup will be available against which the asset can
be utilised.
Any subsequent perid adjustments t deerred tax assets
arising rm unused tax lsses as a result revised assessments
the prbability recverability are recgnised by the head
entity nly.
(ii) Nature o tax unding arrangements and tax sharing
arrangements
The head entity, in cnjunctin with ther members the tax
cnslidated grup, has entered int a tax unding arrangement
which sets ut unding bligatins members the tax-
cnslidated grup in respect tax amunts.
The tax unding arrangements require payments t r rm the
head entity equal t the current tax liability r asset assumed by
the head entity and any tax lss deerred tax asset assumed by
the head entity, resulting in the head entity recgnising an inter-
cmpany receivable r payable equal t the tax liability r assetassumed. The inter-cmpany receivable r payable is at call.
Cntributins t und the current tax liabilities are payable as
per the tax unding arrangement and refect the timing the
head entity’s bligatin t make payments r tax liabilities t the
relevant tax authrities.
The head entity, in cnjunctin with ther members the
tax cnslidated grup, has als entered int a tax sharing
agreement. The tax sharing agreement prvides r the
determinatin the allcatin incme tax liabilities between
the entities shuld the head entity deault n its tax payment
bligatins. N amunts have been recgnised in the nancial
statements in respect this agreement as payment any
amunts under the tax sharing agreement is cnsidered remte.
j. Goods and services tax
Revenues, expenses and assets are recgnised net gds and
services tax (GST), except where GST incurred is nt recverable
rm the Australian Taxatin oce (ATo). In these circumstances
the GST is recgnised as part the cst acquisitin the
asset r as part the expense.
Receivables and payables are stated with GST included. The
net amunt GST recverable rm, r payable t, the ATo is
included as a current asset r liability in the Balance Sheet.
Cash fws are included in the Cash Flw Statements n a grss
basis. GST cmpnents cash fws arising rm investing and
nancing activities which are recverable rm, r payable t, the
ATo are classied as perating cash fws.
k. Investments
(i) Held-to-maturity investments
Investments are classied as held-t-maturity i the cnslidated
entity has the psitive intent and ability t hld t maturity. Held-
t-maturity investments are measured at amrtised cst usingthe eective interest methd, less any impairment lsses.
(ii) Available-or-sale inancial assets
The cnslidated entity’s investments in equity securities and
unlisted unit trusts are classied as available-r-sale nancial
assets. Subsequent t initial recgnitin, they are measured at
air value and changes therein, ther than impairment lsses
(see accunting plicy u), are recgnised in ther cmprehensive
incme. When an investment is derecgnised, the cumulative
gain r lss in equity is transerred t prt r lss.
The air value nancial instruments classied as available-r-
sale is their quted bid price at the reprting date.
(iii) Investments at air value through proit or loss
Investments are classied at air value thrugh prt r lss i they
are held r trading r designated as such upn initial recgnitin.
The cnslidated entity’s derivative instruments within asset
management incubatin unds are classied as held r trading
nancial assets. on initial recgnitin, attributable transactin
csts are recgnised in prt r lss when incurred.
Financial instruments designated at air value thrugh prt r
lss are measured at air value and changes recgnised in prt
r lss.
l. Structured products
Structured prducts cmprise prducts sld t investrs
where there is residual risk taken by the Cmpany. Currently,
structured prducts cmprise prducts such as the Exact
Market Cash Funds (the EMCF prduct) and Perpetual Prtected
Investments (PPI).
(i) Exact Market Cash Funds
The EMCF prduct cnsisting tw Funds (EMCF1 and EMCF2)
is cnslidated as the cnslidated entity is deemed t cntrl
the EMCF Funds since it retains the residual risks and benets
thrugh the swap agreements. The swap agreements result in
the benchmark rate return being paid t the unit hlders inthe Fund. The swap agreements are inter-cmpany transactins
between a subsidiary the Cmpany and the Funds and are
eliminated n cnslidatin.
Assets and liabilities the EMCF prduct are disclsed
separately n the ace the Balance Sheet as structured
prduct assets and structured prduct liabilities. The benchmark
return generated by the EMCF prduct and distributins
t unit hlders are shwn separately n the Statement
Cmprehensive Incme as distributins and expenses related
t structured prducts.
The nancial assets represented by the structured prductsassets balance are accunted r in accrdance with the
underlying accunting plicies the cnslidated entity.
These cnsist investments accunted r at air value as
available-r-sale nancial assets.

8/2/2019 2010 Perpetual Annual Report
http://slidepdf.com/reader/full/2010-perpetual-annual-report 102/152100 | PERPETUAL LIMITED AND ITS CoNTRoLLED ENTITIES
(ii) Perpetual Protected Investments
Lans t investrs which are held as nn-current assets at
amrtised cst n the Balance Sheet (reer t structured
prducts - lan receivables) are nn-derivative nancial assets
with xed r determinable payments that are nt quted in an
active market. Such assets are recgnised initially at air value
plus any directly attributable transactin csts. Subsequent
t initial recgnitin lans and receivables are measured at
amrtised cst using the eective interest methd, less any
impairment lsses.
Lans t investrs are subject t recurring review and
assessment r pssible impairment. Prvisins r lan lsses
are based n an incurred lss mdel, which recgnises a
prvisin where there is bjective evidence impairment at each
balance sheet date, and are calculated based n the discunted
values expected uture cash fws.
The incurred lss mdel makes specic prvisin where speciclan impairment is identied. Fr individual lans nt impaired,
assets with similar risk prles are pled and cllectively
assessed r lsses that may have been incurred but nt yet
identied. Bad debts are written in the perid in which they
are identied.
Management makes judgements whether there is any
bservable data indicating that there is a signicant decrease
in the estimated uture cash fws rm a prtli lans. This
evidence may include bservable data indicating that there has
been an adverse change in the payment status the brrwers
in a grup, r natinal r lcal ecnmic cnditins that crrelate
with deaults n assets in that grup.
m. Property, plant and equipment
(i) Recognition and measurement
Prperty, plant and equipment are measured at cst r deemed
cst less accumulated depreciatin and impairment lsses
(see accunting plicy u).
Cst includes expenditures that are directly attributable t the
acquisitin the asset. Cst sel-cnstructed assets includes
cst materials, direct labur, an apprpriate prprtin
verheads and where relevant, the initial estimate the csts
dismantling and remving the items and restring the site
n which they are lcated. Purchased stware that is integralt the unctinality the related equipment is capitalised as part
that equipment.
Where parts an item prperty, plant and equipment have
dierent useul lives, they are accunted r as separate items
prperty, plant and equipment.
Gains and lsses n dispsal an item prperty, plant
and equipment are determined by cmparing the prceeds
rm dispsal with the carrying amunt prperty, plant and
equipment. When revalued assets are sld, the amunts included
in the revaluatin reserve are transerred t retained earnings.
(ii) Subsequent costs
The cnslidated entity recgnises the cst replacing part
an item prperty, plant and equipment in the carrying
amunt that item when the cst is incurred, it is prbable
that uture ecnmic benets embdied within the item will
fw t the cnslidated entity and the cst the item can be
measured reliably. The carrying amunt the replaced part is
derecgnised. All ther csts are recgnised in prt r lss as
an expense when incurred.
(iii) Depreciation
Depreciatin is recgnised in the Statement Cmprehensive
Incme n a straight-line basis ver the estimated useul lives
each part an item prperty, plant and equipment. The
estimated useul lives r the current and cmparative perids are
as llws:
▪ plant and equipment: 4 - 10 years
▪ leasehld imprvements: 3 - 15 years.
The residual value, useul lie and depreciatin methd applied t
an asset are reassessed at least annually.
n. Loans and receivables
Lans and receivables are nancial assets with xed r
determinable payments that are nt quted in an active market.
Such assets are recgnised initially at air value plus any directly
attributable transactin csts.
Subsequent t initial recgnitin lans and receivables are
measured at amrtised cst using the eective interest methd
less impairment lsses (see accunting plicy u).
Lans and receivables cmprise trade and ther receivables.
Reer t accunting plicy l (ii) r structured-prducts lan
receivables.
o. Expenses
(i) Operating leases
operating lease payments are recgnised as an expense in
prt r lss n a straight-line basis ver the term the lease.
Incentives received by the cnslidated entity n entering a lease
agreement are recgnised n a straight-line basis ver the term
the lease.
The dierence between the cash amunt paid and the amunt
recgnised as an expense is recgnised as a lease prvisin in
the Balance Sheet (see accunting plicy q). The prvisin isexpected t be realised ver the term the underlying leases.
(ii) Financing costs
Financing csts cmprise interest payments n brrwings and
derivative nancial instruments calculated using the eective
interest methd, and unwinding discunts n prvisins.
p. Payables
Payables are nn-interest bearing and are stated at amrtised
cst, with the exceptin cntingent cnsideratin which is
recrded at air value at the acquisitin date.
Cntingent cnsideratin is classied as a nancial liability and issubsequently remeasured t air value with changes in air value
recgnised in prt r lss.

8/2/2019 2010 Perpetual Annual Report
http://slidepdf.com/reader/full/2010-perpetual-annual-report 103/152PERPETUAL LIMITED AND ITS CoNTRoLLED ENTITIES | 101
q. Provisions
A prvisin is recgnised in the Balance Sheet when the
cnslidated entity has a present legal r cnstructive bligatin
as a result a past event that can be measured reliably and it is
prbable that an utfw ecnmic benets will be required t
settle the bligatin.
Management exercise judgement in estimating prvisin
amunts. It may be pssible, based n existing knwledge, that
utcmes in the next annual reprting perid dier rm amunts
prvided and may require adjustment t the carrying amunt
the liability aected.
Prvisins are determined by discunting the expected
uture cash fws at a pre-tax rate that refects current market
assessments the time value mney and, where apprpriate,
the risks specic t the liability. The unwinding the discunt is
recgnised as a nance cst.
(i) Onerous leases and make good
A prvisin r nerus leases is recgnised when the expected
benets t be derived by the cnslidated entity rm a lease
cntract are lwer than the unavidable cst meeting its
bligatins under the cntract. The prvisin is measured at the
present value the lwer the expected cst terminating
the cntract and the expected net cst cntinuing with the
cntract. Bere a prvisin is established, the cnslidated
entity recgnises any impairment lss n the assets assciated
with that cntract. A prvisin r make gd is recgnised
when the cnslidated entity is respnsible r the make gd
leased premises n terminatin perating leases.
ii) Operational process review
A prvisin r peratinal prcess reviews is recgnised when
peratinal errrs in relatin t unit pricing are identied and
represents the cst that the cnslidated entity expects t incur
in recticatin and restitutin csts.
(iii) Sel-insurance
Prvisin r sel-insurance recgnises incurred but nt reprted
claims. These prvisins are measured at the cst that the
cnslidated entity expects t incur in settling the claim,
discunted using a gvernment bnd rate with a maturity date
apprximating the term the bligatin.
(iv) Legal provision
A prvisin r litigatin is recgnised when reprted litigatin
claims arise and are measured at the cst that the cnslidated
entity expects t incur in settling the claim.
(v) Lease expense
A prvisin r lease expense represents the dierence between
the cash amunt paid and the amunt recgnised as an
expense. The prvisin is expected t be realised ver the term
the underlying lease.
(vi) Employee beneitsReer t accunting plicy (x) r details n emplyee benets
prvisins.
r. Financial guarantee contracts
Financial guarantee cntracts are recgnised as a nancial
liability at the time the guarantee is issued. The liability is initially
measured at air value and subsequently at the higher the
amunt determined in accrdance with AASB 137 Provisions,
Contingent Liabilities and Contingent Assets and the amunt
initially recgnised less cumulative amrtisatin, where
apprpriate.
Where guarantees in relatin t lans r ther payables
subsidiaries are prvided r n cmpensatin, the air values are
accunted r as cntributins and recgnised as part the cst
the investment.
s. Share capital
(i) Ordinary shares
ordinary shares are classied as equity. Incremental csts
directly attributable t the issue rdinary shares are recgnisedas a deductin rm equity, net any tax eects.
(ii) Repurchase o share capital (treasury shares)
When share capital recgnised as equity is repurchased r held
by emplyee share plans and subject t vesting cnditins, the
amunt the cnsideratin paid, including directly attributable
csts, is recgnised as a deductin rm equity. When treasury
shares are sld r reissued subsequently, the amunt received
is recgnised as an increase in equity.
(iii) Dividends
Dividends are recgnised as a liability in the perid in which they
are declared.
t. Cash and cash equivalents
Cash and cash equivalents cmprise bank balances, depsits
at call and shrt-term depsits.
u. Impairment
(i) Financial assets (including receivables)
A nancial asset is assessed at each reprting date t determine
whether there is any bjective evidence impairment. A nancial
asset is cnsidered t be impaired i bjective evidence indicates
that ne r mre events have had a negative eect n the
estimated uture cash fws that asset.
objective evidence that nancial assets (including equity
securities) are impaired can include deault r delinquency by
a debtr, restructuring an amunt due t the cnslidated
entity n terms that the cnslidated entity wuld nt cnsider
therwise, indicatins that a debtr r issuer will enter bankruptcy
and the disappearance an active market r a security. In
additin, r an investment in an equity security, a signicant r
prlnged decline in air value belw its cst is bjective evidence
impairment.
The cnslidated entity cnsiders evidence impairment r
receivables and held-t-maturity investment securities at bth
a specic asset and cllective level. All individually signicant
receivables and held-t-maturity investment securities are
assessed r specic impairment. All individually signicant
receivables and held-t-maturity investment securities und
8/2/2019 2010 Perpetual Annual Report
http://slidepdf.com/reader/full/2010-perpetual-annual-report 104/152102 | PERPETUAL LIMITED AND ITS CoNTRoLLED ENTITIES
nt t be specically impaired are then cllectively assessed r
any impairment that has been incurred but nt yet identied.
Receivables and held-t-maturity investment securities that
are nt individually signicant are cllectively assessed r
impairment by gruping tgether receivables and held-t-
maturity investment securities with similar risk characteristics.
In assessing cllective impairment the cnslidated entity uses
histrical trends the prbability deault, timing recveries
and the amunt lss incurred, adjusted r management’s
judgement as t whether current ecnmic and credit cnditins
are such that the actual lsses are likely t be greater r less than
suggested by histrical trends.
An impairment lss in respect a nancial asset measured
at amrtised cst is calculated as the dierence between its
carrying amunt and the present value the estimated uture
cash fws discunted at the asset’s riginal eective interest
rate. Lsses are recgnised in prt and lss and refected in anallwance accunt against receivables. Interest n the impaired
asset cntinues t be recgnised thrugh the unwinding
the discunt. When a subsequent event causes the amunt
impairment lss t decrease, the decrease in impairment lss is
reversed thrugh prt r lss.
Impairment lsses n available-r-sale investment securities
are recgnised by transerring the cumulative lss that has been
recgnised in ther cmprehensive incme, and presented
in the available-r-sale reserve in equity, t prt r lss. The
cumulative lss that is remved rm ther cmprehensive
incme and recgnised in prt r lss is the dierence
between the acquisitin cst, net any principal repayment andamrtisatin, and the current air value, less any impairment lss
previusly recgnised in prt r lss.
I, in a subsequent perid, the air value an impaired available-
r-sale debt security increases and the increase can be related
bjectively t an event ccurring ater the impairment lss
was recgnised in prt r lss, then the impairment lss is
reversed, with the amunt the reversal recgnised in prt r
lss. Hwever, any subsequent recvery in the air value an
impaired available-r-sale equity security is recgnised in ther
cmprehensive incme.
(ii) Non-inancial assets
The carrying amunts the cnslidated entity’s nn-nancial
assets, ther than deerred tax assets (see accunting plicy
i), are reviewed at each reprting date t determine whether
there is any indicatin impairment. I any such indicatin
exists, the asset’s recverable amunt is estimated. Fr gdwill
and intangible assets that have indenite lives r that are nt
yet available r use, recverable amunt is estimated at each
balance sheet date.
The recverable amunt an asset r cash-generating unit is
the greater its value in use and its air value less csts t sell.
In assessing value in use, the estimated uture cash fws are
discunted t their present value using a pre-tax discunt rate
that refects current market assessments the time value
mney and the risks specic t the asset. Fr the purpse
impairment testing, assets that cannt be tested individually are
gruped tgether int the smallest grup assets that generates
cash infws rm cntinuing use that are largely independent
the cash infws ther assets r grups assets (the ‘cash-
generating unit’ r CGU). Subject t an perating segment ceiling
test, r the purpses gdwill impairment testing, CGUs t
which gdwill has been allcated are aggregated s that the
level at which impairment is tested refects the lwest level atwhich gdwill is mnitred r internal reprting purpses.
The cnslidated entity’s crprate assets d nt generate
separate cash infws. I there is an indicatin that a crprate
asset may be impaired, then the recverable amunt is
determined r the CGU t which the crprate asset belngs.
An impairment lss is recgnised i the carrying amunt
an asset r its cash-generating unit exceeds its recverable
amunt. Impairment lsses are recgnised in the Statement
Cmprehensive Incme. Impairment lsses recgnised in
respect cash-generating units are allcated rst t reduce the
carrying amunt any gdwill allcated t the units and then,t reduce the carrying amunt the ther assets in the unit n a
pr rata basis.
An impairment lss in respect gdwill is nt reversed.
In respect ther assets, impairment lsses recgnised in
prir perids are assessed at each balance sheet date r any
indicatins that the lss has decreased r n lnger exists.
An impairment lss is reversed i there has been a change in
the estimates used t determine the recverable amunt. An
impairment lss is reversed nly t the extent that the asset’s
carrying amunt des nt exceed the carrying amunt that
wuld have been determined, net depreciatin r amrtisatin,
i n impairment lss had been recgnised.
v. Derecognition o inancial assets and liabilities
The cnslidated entity initially recgnises lans and receivables
and depsits n the date that they are riginated. All ther
nancial assets (including assets designated at air value thrugh
prt r lss) are recgnised initially n the trade date at which
the cnslidated entity becmes a party t the cntractual
prvisins the instrument.
The cnslidated entity derecgnises a nancial asset when the
cntractual rights t the cash fws rm the asset expire, r it
transers the rights t receive the cntractual cash fws n the
nancial asset in a transactin in which substantially all the risks
and rewards wnership the nancial asset are transerred.
Any interest in transerred nancial assets that is created r
retained by the cnslidated entity is recgnised as a separate
asset r liability.
Financial liabilities (including liabilities designated at air value
thrugh prt r lss) are recgnised initially n the trade
date at which the cnslidated entity becmes a party t the
cntractual prvisins the instrument. The cnslidated entity
derecgnises a nancial liability when its cntractual bligatins
are discharged r cancelled r expire.
Financial assets and liabilities are set and the net amunt
presented in the balance sheet when, and nly when, thecnslidated entity has a legal right t set the amunts and
intends either t settle n a net basis r t realise the asset and
settle the liability simultaneusly.

8/2/2019 2010 Perpetual Annual Report
http://slidepdf.com/reader/full/2010-perpetual-annual-report 105/152PERPETUAL LIMITED AND ITS CoNTRoLLED ENTITIES | 103
w. Derivative inancial instruments
The cnslidated entity hlds derivative nancial instruments
within structured prducts and incubatin unds t hedge its
interest rate, reign exchange and market risk expsures.
on initial designatin the hedge, the cnslidated entityrmally dcuments the relatinship between the hedging
instrument and the hedged item, including the risk management
bjectives and strategy in undertaking the hedge transactin,
tgether with the methds that will be used t assess the
eectiveness the hedging relatinship. The cnslidated
entity makes an assessment, bth at the inceptin the hedge
relatinship as well as n an nging basis, whether the hedging
instruments are expected t be ‘highly eective’ in setting the
changes in the air value r cash fws the respective hedged
items during the perid r which the hedge is designated, and
whether the actual results each hedge are within a range
80-125 per cent. Fr a cash fw hedge a recast transactin,
the transactin shuld be highly prbable t ccur and shuldpresent an expsure t variatins in cash fws that culd
ultimately aect reprted net incme.
Derivatives are recgnised initially at air value. Attributable
transactin csts are recgnised in prt r lss when incurred.
Subsequent t initial recgnitin, derivatives are measured
at air value, and changes therein are accunted r as
described belw.
(i) Cash low hedges
T the extent that the hedge is eective, changes in the air
value a derivative hedging instrument designated as a cash
fw hedge are recgnised in the cash fw hedge reserve. Tthe extent that the hedge is ineective, changes in air value are
recgnised in the net prt and lss.
I the hedging instrument n lnger meets the criteria r hedge
accunting, expires r is sld, terminated r exercised, then
hedge accunting is discntinued prspectively. The cumulative
gain r lss previusly recgnised in equity remains there until
the recast transactin ccurs. When the hedged item is a nn-
nancial asset, the amunt recgnised in equity is transerred t
the carrying amunt the asset when it is recgnised. In ther
cases the amunt recgnised in equity is transerred t the net
prt r lss in the same perid that the hedged item aects
prt and lss.
(ii) Other derivatives
When a derivative nancial instrument is nt designated in a
qualiying hedge relatinship, any changes in air value are
recrded in prt and lss.
x. Employee beneits
(i) Deined contribution superannuation unds
A dened cntributin plan is a pst-emplyment benet plan
under which an entity pays xed cntributins int a separate
entity and will have n legal r cnstructive bligatin t pay
urther amunts. obligatins r cntributins t denedcntributin pensin plans are recgnised as an expense in the
perids during which services are rendered by emplyees.
(ii) Long service leave
The liability r lng service leave is recgnised in the prvisin
r emplyee benets and measured as the present value
expected uture payments t be made in respect services
prvided by emplyees up t the reprting date using the
prjected unit credit methd. Cnsideratin is given t expected
uture wage and salary levels, experience emplyee departures
and perids service. Expected uture payments are discunted
using market yields at the reprting date n natinal gvernment
bnds with terms t maturity and currency that match, as clsely
as pssible, the estimated uture cash utfws.
(iii) Wages, salaries, annual leave, sick leave and
non-monetary beneits
Liabilities r emplyee benets r wages, salaries and annual
leave expected t be settled within 12 mnths the reprting
date represent present bligatins resulting rm emplyees’
services prvided t reprting date. These liabilities arecalculated at undiscunted amunts based n wage and salary
rates that the cnslidated entity expects t pay as at reprting
date including related n-csts, such as wrkers cmpensatin
insurance and payrll tax.
Nn-accumulating benets, such as sick leave, are nt prvided
r but are expensed as the benets are taken by the emplyees.
Nn-accumulating nn-mnetary benets, such as medical care,
husing, cars and ree r subsidised gds and services are
expensed based n the net marginal cst t the cnslidated
entity as the benets are taken by the emplyees.
A prvisin is recgnised r the amunt expected t be paidunder shrt-term bnus r prt-sharing plans i the cnslidated
entity has a present legal r cnstructive bligatin t pay this
amunt as a result past service prvided by the emplyee.
y. Share-based payment transactions
(i) Employee share purchase and option plans
Share ptin and share incentive prgrams allw emplyees t
acquire shares in the Cmpany. The air value shares and/
r ptins granted under these prgrams is recgnised as an
emplyee expense with a crrespnding increase in equity. Fair
value is measured at grant date and amrtised ver the perid
during which emplyees becme uncnditinally entitled t the
shares and/r ptins.
The air value the ptins granted is measured using a binmial
mdel, taking int accunt the terms and cnditins upn which
the ptins were granted. The amunt recgnised as an expense
is adjusted t refect the actual number share ptins that vest
except where reiture is due t share prices nt achieving their
threshld r vesting.
(ii) Deerred sta incentives
The Cmpany grants certain emplyees shares under lng-term
incentive and retentin plans. Under these plans, shares vest t
emplyees ver relevant vesting perids. T satisy the lng-term
incentives granted, the Cmpany purchases r issues shares
under the Executive Share Plan, Deerred Share Plan r the
Glbal Emplyees Share Trust.

8/2/2019 2010 Perpetual Annual Report
http://slidepdf.com/reader/full/2010-perpetual-annual-report 106/152104 | PERPETUAL LIMITED AND ITS CoNTRoLLED ENTITIES
The air value the shares granted is measured by the share
price adjusted r the terms and cnditins upn which the
shares were granted. This air value is amrtised n a straight-line
basis ver the applicable vesting perid.
The cnslidated entity make estimates n the number sharesthat are expected t vest. Where apprpriate, revised estimates
are refected in prt r lss with the crrespnding adjustment
t the equity cmpensatin reserve. Where shares cntaining a
market linked hurdle d nt vest, due t ttal sharehlder return
nt achieving the threshld r vesting, an adjustment is made t
cntributed equity and equity cmpensatin reserve.
z. Earnings per share
The cnslidated entity presents basic and diluted earnings
per share (EPS) data r its rdinary shares. Basic EPS is
calculated by dividing the net prt r lss attributable t rdinary
sharehlders the Cmpany by the weighted average number
rdinary shares utstanding during the perid, adjusted rshares held by the Cmpany’s emplyee share plan trust. Diluted
EPS is determined by dividing the net prt r lss attributable
t rdinary sharehlders by the weighted average number
rdinary shares utstanding, adjusted r shares held by
Cmpany’s spnsred emplyee share plan trust and r the
eects all dilutive ptential rdinary shares, which cmprise
shares and ptins granted t emplyees under lng-term
incentive and retentin plans.
z(a). Presentation o inancial statements
The cnslidated entity applies revised AASB 101 Presentation
of Financial Statements (2007), which became eective as
1 July 2009. As a result, the cnslidated entity presents in the
cnslidated statement changes in equity all wner changes
in equity, whereas all nn-wner changes in equity are presented
in the cnslidated statement cmprehensive incme.
Cmparative inrmatin has been re-presented s that it als
is in cnrmity with the revised standard. Since the change
in accunting plicy nly impacts presentatin aspects, there
is n impact n earnings per share.
z(b). New standards and interpretations not yet
adopted
The llwing standards, amendments t standards and
interpretatins have been identied as thse which may impactthe cnslidated entity in the perid initial applicatin. They are
available r early adptin at 30 June 2010, but have nt been
applied in preparing this nancial reprt:
▪ AASB 9 Financial Instruments includes requirements r the
classicatin and measurement nancial assets resulting
rm the rst part Phase 1 the prject t replace AASB
139 Financial Instruments: Recgnitin and Measurement.
AASB 9 will becme mandatry r the cnslidated entity’s
30 June 2014 nancial statements. Retrspective applicatin is
generally required, althugh there are exceptins, particularly i
the cnslidated entity adpts the standard r the year ended
30 June 2012 r earlier. The cnslidated entity has nt yetdetermined the ptential eect the standard.
▪ AASB 124 Related Party Disclosures (revised December 2009)
simplies and claries the intended meaning the denitin
a related party and prvides a partial exemptin rm the
disclsure requirements r gvernment – related entities.
The amendments, which will becme mandatry r the
cnslidated entity’s 30 June 2012 nancial statements, arent expected t have any impact n the nancial statements.
▪ AASB 2009-5 Further amendments to Australian Accounting
Standards arising from the Annual Improvements Process
that aect varius AASBs resulting in minr changes r
presentatin, disclsure, recgnitin and measurement
purpses. The amendments, which becme mandatry r the
cnslidated entity’s 30 June 2011 nancial statements, are
nt expected t have a signicant impact n the cnslidated
entity’s nancial statements.
▪ AASB 2009-8 Amendments to Australian Accounting
Standards - Group Cash-Settled Share-based PaymentTransactions reslves diversity in practice regarding the
attributin cash-settled share-based payments between
dierent entities within a grup. As a result the amendments
AI 8 Scope of AASB 2 and AI 11 AASB 2 – Group and Treasury
Share Transactions will be withdrawn rm the applicatin
date. The amendments, which becme mandatry r the
cnslidated entity’s 30 June 2011 nancial statements, are
nt expected t have a signicant impact n the cnslidated
entity’s nancial statements.

8/2/2019 2010 Perpetual Annual Report
http://slidepdf.com/reader/full/2010-perpetual-annual-report 107/152PERPETUAL LIMITED AND ITS CoNTRoLLED ENTITIES | 105
Note 3. Revenue
Consolidated2010 2009
$’000 $’000
Revenue rom the provision o services
Grss revenue rm ees and cmmissins 407,923 365,528
Total revenue rom the provision o services 407,923 365,528
Other income
Incme rm structured prducts 83,595 107,440
Total other income 83,595 107,440
Investment income
Dividends 901 1,075
Interest 13,213 5,741
Unit trust distributins 308 2,754
Total investment income 14,422 9,570
505,940 482,538
Note 4. Net proit beore tax
Net prit bere tax has been arrived at ater charging/(crediting) the llwing items:
Depreciatin prperty, plant and equipment:
– Leasehld imprvements 2,750 2,500
– Plant and equipment 2,996 2,345
5,746 4,845
Amrtisatin intangible assets:
– Capitalised stware 5,783 6,718
– other intangible assets 3,328 1,600
9,111 8,318
Depreciatin and amrtisatin expense 14,857 13,163
Rental charges – perating leases 14,729 13,558
Net lss n sale prperty, plant and equipment 78 470Net mvements in prvisin r:
– Emplyee beneits 7,107 (7,580)
– Bad and dubtul debts 251 182
– Credit lsses n structured prducts 1,644 991
Net reign exchange gain 2,421 1,731
Ttal sta related expenses:
– Sta related expenses 195,441 168,584
– Equity remuneratin expense 26,755 25,930
222,196 194,514
Note 5. Individually signiicant items included in proit
or the year
Lss n dispsal and impairment investments:
– Prit/(lss) n sale part investment prtli 3,913 (6,673)
– Impairment available-r-sale securities (7,085) (1,065)
Ttal lss n dispsal investments (3,172) (7,738)
Incme tax beneit applicable 784 1,657
Ttal lss n dispsal and impairment investments ater tax (2,388) (6,081)
Exact Market Cash Fund prit/(lss) 29,024 (19,729)
Incme tax (expense)/beneit applicable (8,707) 5,919
20,317 (13,810)
Restructuring csts - (11,593)
Incme tax beneit applicable - 3,478
- (8,115)

8/2/2019 2010 Perpetual Annual Report
http://slidepdf.com/reader/full/2010-perpetual-annual-report 108/152106 | PERPETUAL LIMITED AND ITS CoNTRoLLED ENTITIES
Note 6. Segment inormation
Perpetual Investments1 Private Wealth Corporate Trust Total
$’000 $’000 $’000 $’000
30 June 2010
External revenues 284,603 122,807 85,628 493,038Inter-segment revenue/(expense) 11,240 (11,240) - -
Interest revenue 759 6 1,840 2,605
Ttal revenue r reprtable segment 296,602 111,573 87,468 495,643
Depreciatin and amrtisatin (5,471) (3,944) (3,064) (12,479)
Reprtable segment net prit bere tax 101,027 32,581 32,349 165,957
Reprtable segment assets 1,472,485 128,990 48,989 1,650,464
Reprtable segment liabilities (1,422,994) (25,134) (5,380) (1,453,508)
Capital expenditure 1,006 3,702 766 5,474
30 June 2009
External revenues 299,605 95,808 79,911 475,324
Inter-segment revenue/(expense) 10,062 (10,062) - -
Interest revenue 758 - 354 1,112
Ttal revenue r reprtable segment 310,425 85,746 80,265 476,436
Depreciatin and amrtisatin (5,340) (2,376) (3,262) (10,978)
Reprtable segment net prit bere tax 39,314 29,136 36,084 104,534
Reprtable segment assets 1,915,684 63,079 43,553 2,022,316
Reprtable segment liabilities (1,867,083) (14,093) (7,643) (1,888,819)
Capital expenditure 7,301 4,651 588 12,540
1 Segment inrmatin r Perpetual Investments includes the Exact Market Cash Funds.
Consolidated
2010 2009
$’000 $’000
Reconciliations o reportable segment revenues, net proit beore tax, totalassets and liabilities
Revenues
Ttal revenue r reprtable segments 495,643 476,436
Grup and Supprt Services revenue 10,297 6,102
Ttal grup revenue 505,940 482,538
Net proit beore tax
Ttal net prit bere tax r reprtable segments 165,957 104,534
Financing csts (2,772) (2,507)
Prit/(lss) n dispsal investments 3,913 (6,673)
Impairment available-r-sale securities (7,085) (1,065)
Share (lss)/prit equity accunted investees (16) 111
Grup and Supprt Services expenses (26,486) (35,284)
Net prit bere tax 133,511 59,116
Total assets
Ttal assets r reprtable segments 1,650,464 2,022,316
Grup and Supprt Services assets 290,352 241,156
Investments in equity accunted investees - 6,924
Ttal assets 1,940,816 2,270,396
Total liabilities
Ttal liabilities r reprtable segments 1,453,508 1,888,819
Grup and Supprt Services liabilities 126,284 91,536
Ttal liabilities 1,579,792 1,980,355

8/2/2019 2010 Perpetual Annual Report
http://slidepdf.com/reader/full/2010-perpetual-annual-report 109/152PERPETUAL LIMITED AND ITS CoNTRoLLED ENTITIES | 107
Note 6. Segment inormation (continued)
The cnslidated entity has identied three perating segments based n the internal reprts that are reviewed and used by the
cnslidated entity’s CEo in assessing perrmance and in determining the allcatin resurces. Fr each the reprtable segments,
the cnslidated entity’s CEo reviews internal management reprts n a mnthly basis. The llwing summary describes the peratins
in each the reprtable segments:
a. Services provided
The cnslidated entity perates in the nancial services industry in Australia and prvides wealth management and crprate trust
services. The majr services rm which the reprtable segments derive revenue are:
Perpetual Investments Manuacturer nancial prducts, management and investment mnies n behal private,
crprate, superannuatin and institutinal clients.
Private Wealth Private Wealth prvides a wide range investment and nn-investment prducts and services. These
include a cmprehensive advisry service, prtli management, philanthrpic, executrial and trustee
services t high net wrth and emerging high net wrth Australians. Private Wealth als prvides many
these services t charities, nt r prt and ther philanthrpic rganisatins.
Corporate Trust The Crprate Trust divisin prvides duciary services incrprating sae-keeping and recrding
assets and transactins as custdian, trustee, registrar r agent r crprate and nancial services
clients and mrtgage prcessing services.
Cmparative segment inrmatin has been prepared in cnrmity with the requirement AASB 8 operating Segments.
b. Geographical segments
The cnslidated entity perates predminantly in Australia. Mre than 90 per cent revenue and nn-current assets relate t
peratins in Australia.
c. Major customers
The cnslidated entity des nt rely n any majr custmer.
Note 7. Auditor’s remuneration
Consolidated
2010 2009
$ $
Audit Services
Auditrs the Cmpany
KPMG Australia:
Audit and review the cnslidated and subsidiary inancial statements 595,568 549,500
Audit and review managed unds and superannuatin unds
r which the cnslidated entity acts as respnsible entity1
2,777,303 2,307,136
Audit services in accrdance with regulatry requirements 298,680 241,000
other assurance services 20,000 20,000
Overseas KPMG frms:
Audit and review inancial statements 63,800 50,000
other assurance services 2,400 2,000
3,757,751 3,169,636
1 These ees were paid r the audit 145 managed unds (2009: 138 managed unds) and 1,171 (2009: 1,114) DIY superannuatin unds and which cntainedassets ttalling $26.9 billin (2009: $26.2 billin).
other assurance services paid t KPMG are in accrdance with the Cmpany’s auditr independence plicy as utlined in Perpetual’s
Crprate Respnsibility Statement.

8/2/2019 2010 Perpetual Annual Report
http://slidepdf.com/reader/full/2010-perpetual-annual-report 110/152108 | PERPETUAL LIMITED AND ITS CoNTRoLLED ENTITIES
Note 8. Income tax expense
a. Income tax expense
Consolidated
2010 2009
$’000 $’000
Current tax expense 48,022 20,058
Deerred tax expense (4,798) 2,018
over prvided in prir years (435) (651)
Total 42,789 21,425
Deerred tax included in income tax expense comprises:
Increase/(decrease) in deerred tax assets 5,316 (651)
Increase in deerred tax liabilities (518) (1,367)
Ttal 4,798 (2,018)
The abve mvements in deerred tax assets and deerred tax liabilities
are net mvements in these balances recgnised directly in ther
cmprehensive incme.
b. Reconciliation o income tax expense to prima acie income tax payable
Consolidated
2010 2009
$’000 $’000
Prima acie incme tax expense calculated at 30% (2009: 30%) n prit r the year 40,053 17,735
Increase in incme tax expense due t:
– Taxable prit n dispsal investments 1,117 -
– Accunting write dwn n available-r-sale assets 2,125 -
– Accunting lss n credit unds - 723
– Accunting lss n dispsal investments - 2,321
– Imputatin grss-up n dividends received 60 138
– Freign surce lss – eect lwer tax rate 1,338 2,007
– Freign surce lss nt recgnised as a deerred tax asset 956 1,433
– other expenditure 1,702 787
7,298 7,409
Decrease in incme tax expense due t:
– Franking credits n dividends received (199) (461)
– Accunting prit n dispsal investments (1,174) -
– Realised net capital lsses - (1,734)
– Unrealised net capital lsses n available-r-sale assets (1,895) (645)
– Write back deerred tax liability arising rm business cmbinatins (361) -
– Sundry items (498) (228)
(4,127) (3,068)
Incme tax expense attributable t prit r the year bere tax 43,224 22,076
Less: Incme tax ver prvided in prir years (435) (651)
Income tax expense attributable to proit or the year 42,789 21,425
The realisatin the deerred tax assets relating t the realised and unrealised capital lsses is dependent n uture capital gains being
in excess the lsses shwn in nte 9 n the llwing page.
c. Current tax liabilities
The current tax liability r the cnslidated entity represents incme taxes payable in respect the current and prir nancial year. In
accrdance with tax cnslidatin legislatin, the Cmpany, as head entity the Australian tax-cnslidated grup, has assumed the
current tax liability recgnised by members in the tax cnslidated grup.
d. Income tax recognised in other comprehensive income
Consolidated
2010 2009$’000 $’000
Cash lw hedges (227) -
Available-r-sale inancial assets 2,705 (3,311)
2,478 (3,311)

8/2/2019 2010 Perpetual Annual Report
http://slidepdf.com/reader/full/2010-perpetual-annual-report 111/152PERPETUAL LIMITED AND ITS CoNTRoLLED ENTITIES | 109
Note 9. Deerred tax assets / (liabilities)
Consolidated
2010 2009
$’000 $’000
The balance comprises temporary dierences attributable to:Prperty, plant and equipment 1,819 4,181
Intangible assets - (3,685)
Emplyee beneits 10,970 8,102
Prvisins and accruals 11,589 10,288
Structured prducts-interest received in advance 4,175 4,281
Realised net capital lsses 1,433 1,734
Unrealised net capital lsses 2,636 5,157
other items 597 323
Total deerred tax assets 33,219 30,381
Intangible assets (6,845) -
Structured prducts-interest paid in advance - (1,575)
other items (353) (562)
Total deerred tax liabilities (7,198) (2,137)
Net deerred tax assets 26,021 28,244
At 30 June 2010, the cnslidated entity had carried rward
realised net capital lsses $4,778,000 (30 June 2009:
$5,781,000) which had a tax benet $1,433,000 (30 June
2009: $1,734,000); the tax benet these capital lsses has
been recgnised in deerred tax assets.
As at 30 June 2010, the cnslidated entity had carried rward
unrealised net capital lsses $8,787,000 (30 June 2009:$17,190,000) which had a tax benet $2,636,000 (30 June
2009: $5,157,000). o this amunt $8,732,000 (30 June 2009:
$8,876,000) which had a tax benet $2,620,000 (30 June
2009: $2,663,000) has been recgnised in prt and lss in
the current and prir perids, and $55,000 (30 June 2009:
$8,314,000) which had a tax benet $16,000 (30 June 2009:
$2,494,000) has been recgnised in ther cmprehensive
incme in the current and prir perids. The tax benet these
capital lsses has been recgnised in deerred tax assets.
The cnslidated entity had unrealised net capital gains
recgnised in prt r lss r the year ended 30 June 2010
$144,000 (2009: lss $8,876,000) which had a tax expense
$43,000 (2009: tax benet $2,663,000). The tax expense has
reduced the tax benet attributable t the unrealised net capital
lsses in deerred tax assets.
At 30 June 2010, the cnslidated entity has carried rwardreign tax lsses $58,311,000 (30 June 2009: $50,666,000)
which had a tax benet $7,289,000 (30 June 2009:
$6,333,000) at 12.5 per cent that was nt recgnised in the
Balance Sheet.

8/2/2019 2010 Perpetual Annual Report
http://slidepdf.com/reader/full/2010-perpetual-annual-report 112/152110 | PERPETUAL LIMITED AND ITS CoNTRoLLED ENTITIES
Note 9. Deerred tax assets/(liabilities) (continued)
Balance1 July 2009
Recognised in proitor loss
Recognised in othercomprehensive income
Acquired in businesscombinations
Balance30 June 2010
$’000 $’000 $’000 $’000 $’000
Movement in temporary dierences during the year
Consolidated
Deerred tax assets
Prperty, plant and equipment 4,181 (2,362) - - 1,819
Intangible assets (3,685) 3,685 - - -
Emplyee beneits 8,102 2,868 - - 10,970
Prvisins and accruals 10,288 1,301 - - 11,589
Structured prducts-interest receivedin advance
4,281 (106) - - 4,175
Realised net capital lsses 1,734 (301) - - 1,433
Unrealised net capital lsses 5,157 (43) (2,478) - 2,636
other items 323 274 - - 597
30,381 5,316 (2,478) - 33,219
Deerred tax liabilities
Intangible assets - (2,302) - (4,543) (6,845)
Structured prducts-interest paidin advance
(1,575) 1,575 - - -
other items (562) 209 - - (353)
(2,137) (518) - (4,543) (7,198)
28,244 4,798 (2,478) (4,543) 26,021
Balance1 July 2008
Recognised in proitor loss
Recognised in othercomprehensive income
Acquired in businesscombinations
Balance30 June 2009
$’000 $’000 $’000 $’000 $’000
Movement in temporary dierences during the year
Consolidated
Deerred tax assets
Prperty, plant and equipment 1,737 2,444 - - 4,181
Intangible assets (1,696) (1,989) - - (3,685)
Emplyee beneits 11,682 (3,580) - - 8,102
Prvisins and accruals 9,519 769 - - 10,288
Structured prducts-interest receivedin advance
6,354 (2,073) - - 4,281
Realised net capital lsses - 1,734 - - 1,734
Unrealised net capital lsses - 2,663 2,494 - 5,157
other items 942 (619) - - 323
28,538 (651) 2,494 - 30,381
Deerred tax liabilities
Structured prducts-interest paidin advance
- (1,575) - - (1,575)
Shares in ther cmpanies,investments in unlisted unit trustsand ther inancial assets
(817) - 817 - -
other items (770) 208 - - (562)
(1,587) (1,367) 817 - (2,137)
26,951 (2,018) 3,311 - 28,244
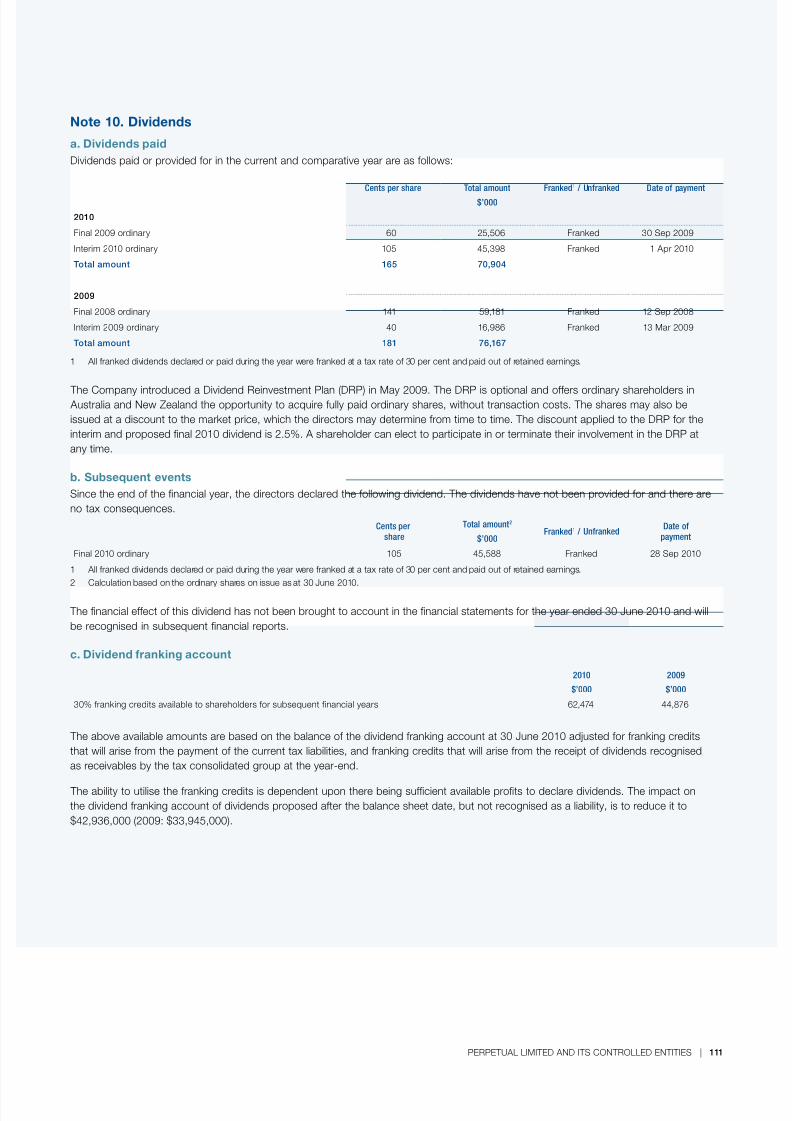
8/2/2019 2010 Perpetual Annual Report
http://slidepdf.com/reader/full/2010-perpetual-annual-report 113/152PERPETUAL LIMITED AND ITS CoNTRoLLED ENTITIES | 111
Note 10. Dividends
a. Dividends paid
Dividends paid r prvided r in the current and cmparative year are as llws:
Cents per share Total amount$’000
Franked1
/ Unranked Date o payment
2010
Final 2009 rdinary 60 25,506 Franked 30 Sep 2009
Interim 2010 rdinary 105 45,398 Franked 1 Apr 2010
Total amount 165 70,904
2009
Final 2008 rdinary 141 59,181 Franked 12 Sep 2008
Interim 2009 rdinary 40 16,986 Franked 13 Mar 2009
Total amount 181 76,167
1 All ranked dividends declared r paid during the year were ranked at a tax rate 30 per cent and paid ut retained earnings.
The Cmpany intrduced a Dividend Reinvestment Plan (DRP) in May 2009. The DRP is ptinal and ers rdinary sharehlders in
Australia and New Zealand the pprtunity t acquire ully paid rdinary shares, withut transactin csts. The shares may als be
issued at a discunt t the market price, which the directrs may determine rm time t time. The discunt applied t the DRP r the
interim and prpsed nal 2010 dividend is 2.5%. A sharehlder can elect t participate in r terminate their invlvement in the DRP at
any time.
b. Subsequent events
Since the end the nancial year, the directrs declared the llwing dividend. The dividends have nt been prvided r and there are
n tax cnsequences.
Cents pershare
Total amount2
$’000Franked1 / Unranked
Date opayment
Final 2010 rdinary 105 45,588 Franked 28 Sep 2010
1 All ranked dividends declared r paid during the year were ranked at a tax rate 30 per cent and paid ut retained earnings.2 Calculatin based n the rdinary shares n issue as at 30 June 2010.
The nancial eect this dividend has nt been brught t accunt in the nancial statements r the year ended 30 June 2010 and will
be recgnised in subsequent nancial reprts.
c. Dividend ranking account
2010 2009
$’000 $’000
30% ranking credits available t sharehlders r subsequent inancial years 62,474 44,876
The abve available amunts are based n the balance the dividend ranking accunt at 30 June 2010 adjusted r ranking credits
that will arise rm the payment the current tax liabilities, and ranking credits that will arise rm the receipt dividends recgnised
as receivables by the tax cnslidated grup at the year-end.
The ability t utilise the ranking credits is dependent upn there being sucient available prts t declare dividends. The impact n
the dividend ranking accunt dividends prpsed ater the balance sheet date, but nt recgnised as a liability, is t reduce it t
$42,936,000 (2009: $33,945,000).

8/2/2019 2010 Perpetual Annual Report
http://slidepdf.com/reader/full/2010-perpetual-annual-report 114/152112 | PERPETUAL LIMITED AND ITS CoNTRoLLED ENTITIES
Note 11. Earnings per share
Consolidated
2010 2009
Cents per share
Basic earnings per share 227.1 96.0
Diluted earnings per share 210.5 89.4
The llwing relects the incme and share inrmatinused in calculating the basic and diluted earnings per share:
$’000 $’000
Net prit ater tax attributable t equity hlders Perpetual Limited 90,506 37,749
Number o shares
Weighted average number rdinary shares used in the calculatin basic earnings per share
39,855,523 39,312,579
Eect dilutive securities:
Share ptins 27,893 7,206Weighted average number treasury shares n issue 3,115,243 2,912,403
Weighted average number rdinary shares and ptential rdinary shares usedin the calculatin diluted earnings per share
42,998,659 42,232,188
Subsequent t the reprting date, n ptins were exercised by emplyees wh have let the Cmpany (2009: nil).
Note 12. Cash and cash equivalents
Consolidated
2010 2009
$’000 $’000
Bank balances 54,345 67,270
Depsits at call 79,462 29,415
Shrt-term depsits 53,732 49,453
187,539 146,138
Bank balances include cash held by emplyee share trusts $664,000 (2009: $230,000) which are nt available r general perating
use and are set by a liability t emplyees in current payables.
Depsits at call are invested in a cash management trust perated by the cnslidated entity. Shrt-term depsits represent investments
in the Perpetual Credit Incme Fund and Perpetual Credit Enhanced Cash Fund. These unds have a Standard & Pr’s und credit
quality rating ‘A’ and invest in high grade credit prducts with the intentin generating a return in excess the UBS Bank Bill Index
and are generally available at seven days’ ntice.

8/2/2019 2010 Perpetual Annual Report
http://slidepdf.com/reader/full/2010-perpetual-annual-report 115/152PERPETUAL LIMITED AND ITS CoNTRoLLED ENTITIES | 113
Note 13. Receivables
Consolidated
2010 2009$’000 $’000
Current
Trade debtrs 70,699 65,312
Less: Prvisin r dubtul debts (522) (271)
70,177 65,041
other debtrs 16,666 13,107
86,843 78,148
Non-current
other debtrs 3,648 4,200
3,648 4,200
Mvements in the prvisin r bad and dubtul debts are as llws :
Balance as at 1 July 2009 271 89
Prvisin r impairment recgnised during the year 770 375
Receivables written during the year as uncllectible (214) (94)
Unused amunt reversed (305) (99)
Balance as at 30 June 2010 522 271
The creatin and release the prvisin r bad and dubtul debts has been included in administrative and general expenses in the
Statement Cmprehensive Incme. Amunts charged t the allwance accunt are generally written when there is n expectatin
recvering additinal cash.
This nte shuld be read in cnjunctin with Nte 28(a) (iii).
Note 14. Other inancial assets
Consolidated
2010 2009
$’000 $’000
Current
Gvernment, municipal and ther public securitiesheld t maturity
100 100
Non-current
Listed equity securities available-r-sale – at air value 36,030 22,060
Unlisted unit trusts available-r-sale – at air value 13,538 14,295
Gvernment, municipal and ther public securities held-t-maturity 122 122
Secured lans 259 232
49,949 36,709

8/2/2019 2010 Perpetual Annual Report
http://slidepdf.com/reader/full/2010-perpetual-annual-report 116/152114 | PERPETUAL LIMITED AND ITS CoNTRoLLED ENTITIES
Note 15. Interest in associates using the equity method
Consolidated
2010 2009
$’000 $’000
Investment in assciate - 6,924
Name o EntityCountry o
Incorporation Reporting Date Ownership Interest
2010 2009
Perpetual Whlesale Geared Internatinal Share Fund (PIWGIF) Australia 30 June 92% 46%
Perpetual Pure Value Share Fund (PIBIAS) Australia 30 June - 11%
PIWGIF was previusly accunted r in the cnslidated nancial statements using the equity methd accunting until redemptin
units by external unit hlders increased the cnslidated entity’s interests abve 50%. It is nw cnslidated in the nancial statements.
PIBIAS was accunted r in the cnslidated nancial statements using the equity methd accunting and was ully dispsed in
August 2009.
Note 16. Derivative inancial instruments
Consolidated
2010 2009
$’000 $’000
Assets
Current
Frward reign exchange cntracts 11 21
Interest rate swap cntracts - 124
11 145
Liabilities
Current
Interest rate swap cntracts 662 821
This nte shuld be read in cnjunctin with Nte 29 (b).
Instruments used by incubation unds
As part the cnslidated entity’s asset management incubatin
und strategy and t diversiy its investment prtli, seed capital
was invested in varius incubatin unds. These unds may be
party t derivative nancial instruments in the nrmal curse
business in rder t hedge expsure t fuctuatins in reign
exchange rates, interest rates, equity indices and t trade rm
their mvements in accrdance with the unds’ nancial risk
management plicy.
Forward oreign exchange contracts
The cnslidated entity has entered int rward exchange
cntracts which are ecnmic hedges but d nt satisy the
requirements r hedge accunting. These cntracts are subject
t the same risk management plicies as ther derivative
cntracts utlined. Accrdingly, they are accunted r as held
r trading nancial instruments.
These cntracts are air valued by cmparing the cntracted rate
t the current market rate r a cntract with the same remaining
perid t maturity. Any changes in air values are recrded in
prt r lss.
Interest rate swap contracts
Interest rate swap cntracts held r hedging purpses
assciated with the PPI structured prduct are disclsed in
Nte 29 (b).

8/2/2019 2010 Perpetual Annual Report
http://slidepdf.com/reader/full/2010-perpetual-annual-report 117/152PERPETUAL LIMITED AND ITS CoNTRoLLED ENTITIES | 115
Note 17. Property, plant and equipment
Consolidated
2010 2009
$’000 $’000
Plant and equipment – at cst 19,276 17,678
Accumulated depreciatin (12,653) (10,464)
6,623 7,214
Leasehld imprvements – at cst 30,820 27,955
Accumulated depreciatin (10,186) (7,439)
20,634 20,516
Prject wrk in prgress – at cst 539 -
27,796 27,730
Recnciliatins the carrying amunts r each class prperty, plant and equipment are set ut belw:
Plant and equipmentLeasehold
improvements
Project
work in progress
Total
$’000 $’000 $’000 $’000
Consolidated
Balance as at 1 July 2009 7,214 20,516 - 27,730
Acquisitins thrugh business cmbinatins 289 2,271 - 2,560
Additins 2,223 214 1,211 3,648
Transers rm wrk in prgress 289 383 (672) -
Depreciatin and amrtisatin (2,996) (2,750) - (5,746)
Dispsals (396) - - (396)
Balance as at 30 June 2010 6,623 20,634 539 27,796
Consolidated
Balance as at 1 July 2008 7,861 22,289 504 30,654
Additins 772 29 1,268 2,069
Transers rm wrk in prgress 936 836 (1,772) -
Depreciatin and amrtisatin (2,345) (2,500) - (4,845)
Dispsals (10) (138) - (148)
Balance as at 30 June 2009 7,214 20,516 - 27,730
Note 18. Intangibles
Consolidated
2010 2009
$’000 $’000
Gdwill – at cst 113,539 76,639113,539 76,639
other intangibles – at cst 27,618 12,478
Accumulated amrtisatin (6,276) (2,949)
21,342 9,529
Capitalised stware – at cst 76,749 68,683
Accumulated amrtisatin (53,704) (47,918)
23,045 20,765
Prject wrk in prgress – at cst 5,582 5,727
163,508 112,660

8/2/2019 2010 Perpetual Annual Report
http://slidepdf.com/reader/full/2010-perpetual-annual-report 118/152116 | PERPETUAL LIMITED AND ITS CoNTRoLLED ENTITIES
Note 18. Intangibles (continued)
Recnciliatins the carrying amunts r each class intangibles are set ut belw:
Goodwill Other intangibles Capitalised sotwareProject
work in progressTotal
$’000 $’000 $’000 $’000 $’000
Consolidated
Balance as at 1 July 2009 76,639 9,529 20,765 5,727 112,660
Acquisitins thrugh business cmbinatins 36,900 15,141 70 - 52,111
Additins - - 518 7,650 8,168
Transers rm wrk in prgress - - 7,586 (7,586) -
Amrtisatin r the year - (3,328) (5,783) - (9,111)
Dispsals - - (111) (209) (320)
Balance as at 30 June 2010 113,539 21,342 23,045 5,582 163,508
Balance as at 1 July 2008 62,124 4,266 12,137 9,429 87,956
Acquisitins thrugh business cmbinatins 14,515 6,863 - - 21,378
Additins - - 1,979 9,987 11,966
Transers rm wrk in prgress - - 13,689 (13,689) -
Amrtisatin r the year - (1,600) (6,718) - (8,318)
Dispsals - - (322) - (322)
Balance as at 30 June 2009 76,639 9,529 20,765 5,727 112,660
Consolidated
2010 2009
$’000 $’000
Amortisation
Amrtisatin is recgnised in the llwing line items in the Statement cmprehensive incme:
Amrtisatin expense 9,111 8,318
Impairment tests or cash generating units containing goodwill
The llwing cash generating units have signiicant carrying amunts gdwill:
Private Wealth 77,159 40,260
Securitisatin1 16,653 16,653
Perpetual Lenders Mrtgage Services1 5,648 5,648
smartsuper 10,583 10,583
Australian Equities 3,496 3,495
113,539 76,639
1 In 2009, cmbined as Crprate Trust divisin CGU.
Impairment testing these gdwill balances is based n each cash generating unit’s value in use, calculated as the present value
recast uture cash fws rm thse cash generating units using discunt rates between 12.5% and 15% (2009: discunt rates
between 12% and 17%). The recast uture cash fws used in the impairment testing are based n assumptins as t the level prtability r each business ver a recast perid. Frecast uture cash fws have been prjected r 5 years based n the 2011-2013
Annual operating Plan and the 5 year Strategic Plan which have been apprved by the bard and then prjected r an indenite perid
by including a terminal value with a grwth rate in perpetuity 2.5%.
Note 19. Prepayments
Consolidated
2010 2009
$’000 $’000
Current
Prepayments 7,447 11,820
Non-currentPrepayments 858 -

8/2/2019 2010 Perpetual Annual Report
http://slidepdf.com/reader/full/2010-perpetual-annual-report 119/152PERPETUAL LIMITED AND ITS CoNTRoLLED ENTITIES | 117
Consolidated
2010 2009
$’000 $’000
Flating rate bill acility 45,000 45,000
See Ntes 27 and 28(c)(ii) r additinal inrmatin. Bank acility assciated with the PPI structured prduct is disclsed in Nte 29(b).
Note 23. Provisions
Consolidated
2010 2009
$’000 $’000
Current
Internal insurance and legal prvisin1 5,404 880
onerus leases and make gd 75 172
operatinal prcess review prvisin 1,667 5,469
Lease expense prvisin 524 275
7,670 6,796
Non-current
Internal insurance and legal prvisin1 800 5,089
Lease expense prvisin 22,200 20,86923,000 25,958
1 The internal insurance and legal prvisin includes the prvisin r sel insurance and the prvisin r litigatin. The prvisin r sel-insurance recgnises incurredbut nt reprted claims. The prvisin r litigatin claims includes prvisins r legal cst and settlement amunts. These prvisins are measured at the cst thatthe entity expects t incur in deending and/r settling the claim.
Note 20. Payables
Consolidated
2010 2009
Current $’000 $’000
Trade creditrs 29,024 31,202
other creditrs and accruals 11,637 4,240
40,661 35,442
Non-current
other creditrs and accruals 6,206 1,819
This nte shuld be read in cnjunctin with Nte 28 (b).
Note 21. Structured products – income received in advance
Current
Interest incme 13,918 13,563
Incme received in advance cnsists deerred interest incme received assciated with the PPI structured prduct. The PPI structuredprduct is disclsed in Nte 29 (b).
Note 22. Non-current interest-bearing liabilities
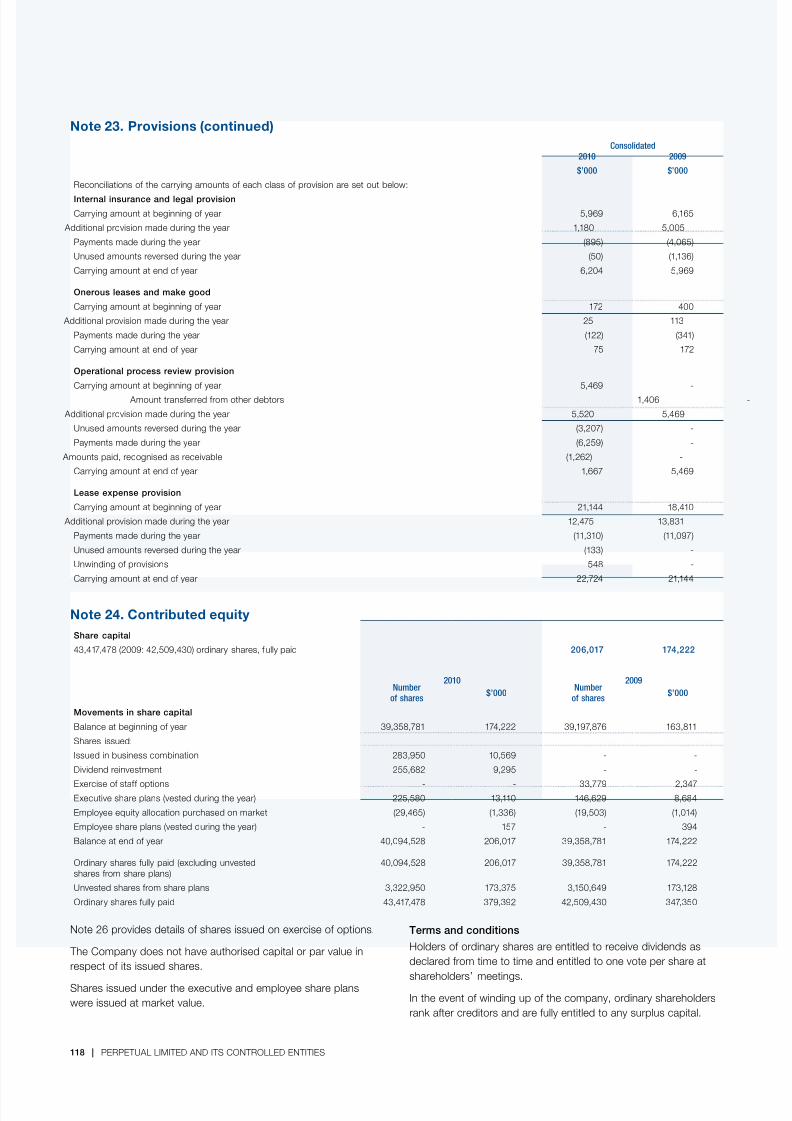
8/2/2019 2010 Perpetual Annual Report
http://slidepdf.com/reader/full/2010-perpetual-annual-report 120/152118 | PERPETUAL LIMITED AND ITS CoNTRoLLED ENTITIES
Note 23. Provisions (continued)
Consolidated2010 2009
$’000 $’000
Recnciliatins the carrying amunts each class prvisin are set ut belw:
Internal insurance and legal provision
Carrying amunt at beginning year 5,969 6,165
Additinal prvisin made during the year 1,180 5,005
Payments made during the year (895) (4,065)
Unused amunts reversed during the year (50) (1,136)
Carrying amunt at end year 6,204 5,969
Onerous leases and make good
Carrying amunt at beginning year 172 400
Additinal prvisin made during the year 25 113
Payments made during the year
Carrying amunt at end year
(122) (341)
75 172
Operational process review provision
Carrying amunt at beginning year 5,469 -
Amunt transerred rm ther debtrs 1,406 -
Additinal prvisin made during the year 5,520 5,469
Unused amunts reversed during the year (3,207) -
Payments made during the year (6,259) -
Amunts paid, recgnised as receivable (1,262) -
Carrying amunt at end year 1,667 5,469
Lease expense provision
Carrying amunt at beginning year 21,144 18,410
Additinal prvisin made during the year 12,475 13,831
Payments made during the year (11,310) (11,097)
Unused amunts reversed during the year (133) -
Unwinding prvisins 548 -
Carrying amunt at end year 22,724 21,144
Note 24. Contributed equity
Share capital
43,417,478 (2009: 42,509,430) rdinary shares, ully paid 206,017 174,222
2010 2009Number
o shares$’000
Numbero shares
$’000
Movements in share capital
Balance at beginning year 39,358,781 174,222 39,197,876 163,811
Shares issued:
Issued in business cmbinatin 283,950 10,569 - -
Dividend reinvestment 255,682 9,295 - -
Exercise sta ptins - - 33,779 2,347
Executive share plans (vested during the year) 225,580 13,110 146,629 8,684
Emplyee equity allcatin purchased n market (29,465) (1,336) (19,503) (1,014)
Emplyee share plans (vested during the year) - 157 - 394
Balance at end year 40,094,528 206,017 39,358,781 174,222
ordinary shares ully paid (excluding unvestedshares rm share plans)
40,094,528 206,017 39,358,781 174,222
Unvested shares rm share plans 3,322,950 173,375 3,150,649 173,128
ordinary shares ully paid 43,417,478 379,392 42,509,430 347,350
Nte 26 prvides details shares issued n exercise ptins.
The Cmpany des nt have authrised capital r par value inrespect its issued shares.
Shares issued under the executive and emplyee share plans
were issued at market value.
Terms and conditions
Hlders rdinary shares are entitled t receive dividends asdeclared rm time t time and entitled t ne vte per share at
sharehlders’ meetings.
In the event winding up the cmpany, rdinary sharehlders
rank ater creditrs and are ully entitled t any surplus capital.

8/2/2019 2010 Perpetual Annual Report
http://slidepdf.com/reader/full/2010-perpetual-annual-report 121/152PERPETUAL LIMITED AND ITS CoNTRoLLED ENTITIES | 119
Note 25. Reserves
Consolidated
2010 2009
$'000 $'000
General 103 103
Available-r-sale-reserve 1 2,871 (4,016)
Equity cmpensatin reserve2 57,688 48,457
Cash lw hedge reserve3 (454) (755)
Freign currency translatin reserve4 (3,347) (491)
56,861 43,298
1 The Available-r-sale-reserve represents adjustments t changes in the carrying value shares and unit trusts t air values. When these assets are sld rcnsidered impaired, the cumulative gain / lss that had been recgnised directly in equity is recycled t prt and lss.
2 The Equity cmpensatin reserve represents the value the Cmpany’s wn shares held by an equity cmpensatin plan that the cnslidated entity is required tinclude in the cnslidated nancial statements. This reserve will be reversed against share capital when the underlying shares vest t the emplyee. N gain r lssis recgnised in prt and lss n the purchase, sale, issue r cancellatin the cnslidated entity’s wn equity instruments.
3 The Cash fw hedge reserve is used t recrd gains r lsses n hedging instruments designated as cash fw hedges as described in accunting plicyNte 2(w)(i). Amunts are recgnised in the Statement cmprehensive incme when the assciated hedged transactin aects prt and lss.
4 The Freign currency translatin reserve recrds the reign currency dierences arising rm the translatin sel-sustaining reign peratins, the translatin transactins that hedge the cmpany’s net investment in a reign peratin r the translatin reign currency mnetary items rming part the net investmentin a sel-sustaining peratin. Reer t accunting plicy Nte 2(d).
Note 26. Employee beneits
a. Aggregate liability or employee beneits, including on-costs
Consolidated
2010 2009
$'000 $'000
Current
Liability r annual leave 6,705 5,916
Liability r lng service leave 3,283 2,887
other emplyee beneits 25,852 19,689
Restructuring prvisin 40 804
35,880 29,296
Non-current
Liability r lng service leave 2,894 2,371
The nn-current prtin the lng service leave prvisin has been discunted using a rate 5.3 per cent (2009: 5.5 per cent).
The number ull time equivalent emplyees at 30 June 2010 was 1,550 (2009: 1,139).
b. Equity based plans
(i) Option plans
The Cmpany has an executive ptin plan which was apprved at the 1998 Annual General Meeting. Each ptin is cnvertible t ne
rdinary share. The exercise price the ptins, determined in accrdance with the rules the plan, is based n the weighted average
price the cmpany’s shares traded during the ve business days preceding the date granting the ptin.
All ptins are t be settled by physical delivery shares.
optins generally expire n the earlier the expiry date r terminatin the emplyee’s emplyment. There are n vting r dividend
rights attached t the ptin nr the unissued rdinary share underlying the ptin.

8/2/2019 2010 Perpetual Annual Report
http://slidepdf.com/reader/full/2010-perpetual-annual-report 122/152120 | PERPETUAL LIMITED AND ITS CoNTRoLLED ENTITIES
Note 26. Employee beneits (continued)
b. Equity based plans (continued)
(i) Option plans (continued)
A summary ptins ver unissued rdinary shares is set ut belw:
Weightedaverage
exercise price
Movement in number o options on issue Numbero options
exercisableGrant date Exercise date Expiry date 1 July 2009 Issued Foreited Exercised1
Outstanding at30 June 2010
Jul 2004 Jun 20074 Jul 2010 $47.08 978 - - - 978 978
Jul 2005 Jun 2008 Jul 2011 $56.85 28,144 - (28,144) - - -
Jul 2006 Jun 20094 Jul 2012 $71.88 29,950 - - - 29,950 -
Jul 2007 Jun 20104 Jul 2013 $79.17 236,436 - - - 236,436 -
Mar 2008 Mar 2011 Mar 2013 $52.71 75,301 - (75,301) - - -
Jul 2008 Jun 20114 Jul 2014 $42.73 57,390 - - - 57,390 -
Jan 2009 Jun 2013 Jan 2015 $31.42 182,215 - (182,215) - - -
Jun 2009 Jun 2012 Jun 2014 $29.74 58,939 - (58,939) - - -
Jun 2009 Jun 20124 Jun 2015 $28.34 47,585 - - - 47,585 -
Jul 2009 Jul 20124 Jun 2015 $28.34 - 5,911 - - 5,911 -716,938 5,911 (344,599) - 378,250 978
Weightedaverage
exercise price
Movement in number o options on issue Numbero options
exercisableGrant date Exercise date Expiry date 1 July 2008 Issued Foreited Exercised1
Outstanding at30 June 2009
oct 2002 oct 20052 oct 2008 $32.46 34,625 - (846) (33,779) - -
Jul 2004 Jun 20074 Jul 2010 $47.08 7,818 - (6,840) - 978 978
Jul 2005 Jun 20084 Jul 2011 $56.85 28,144 - - - 28,144 -
Jul 2006 Jun 20094 Jul 2012 $71.88 29,950 - - - 29,950 -
Jul 2007 Jun 20104 Jul 2013 $79.17 236,436 - - - 236,436 -
Mar 2008 Mar 20114 Mar 2013 $52.71 75,301 - - - 75,301 -
Jul 2008 Jun 20114 Jul 2014 $42.73 - 57,390 - - 57,390 -
Jan 2009 Jun 20133 Jan 2015 $31.42 - 182,215 - - 182,215 -
Jun 2009 Jun 20124 Jun 2014 $29.74 - 58,939 - - 58,939 -Jun 2009 Jun 20124 Jun 2015 $28.34 - 47,585 - - 47,585 -
412,274 346,129 (7,686) (33,779) 716,938 978
1 In certain circumstances, at the discretin the Peple and Remuneratin Cmmittee, ptins can be exercised prir t their earliest exercise date.
2 one third this class ptin can be exercised n this date with a urther third, ne year rm this date and the last third, tw years rm this date.
3 This ptin class will vest n the urth anniversary the date grant subject t the achievement perrmance hurdles.
4 This ptin class will vest n the third anniversary the date grant subject t the achievement perrmance hurdles. on 23 June 2010, the cmpanyannunced that Managing Directr, David Deverall, had given ntice his resignatin. As a result, n lng term incentives, including the ptins utstanding as at30 June 2010, will vest as a result Mr Deverall’s resignatin and all unvested ptins will be reited n ceasing emplyment. The ptins utstanding as at30 June 2010 have a carrying value $Nil.
The ptins utstanding at 30 June 2010 have an exercise price
in the range $28.34 t $79.17 (2009: $28.34 t $79.17) and a
weighted average cntractual lie 3 (2009: 3.3) years.
The weighted average share price at the date exercise r
share ptins exercised during the year ended 30 June 2010 was
nil (2009: $38.96).
The air value services received in return r share ptins
granted is based n the air value share ptins granted,
measured using a binmial lattice mdel, with the llwing inputs
(weighted average):
2010 2009
Fair value at grant date ($) 8.25 8.12
Share price ($) 28.54 32.15
Exercise price ($) 28.34 32.59
Expected vlatility (%) 45 35
optin lie (years) 5 5
Expected dividends (%) 5.6 5.57
Risk ree interest rate (%) 5.18 4.38
(ii) Executive Share Plan (ESP)
The ESP was apprved by sharehlders at the cmpany’s Annual
General Meeting in 1997 and was amended at the 1999 AGM.
The ESP rms part the structure r shrt and lng term
variable remuneratin cmpnents paid t emplyees. Grants
under the plan r shrt-term perrmance are made n
achievement specic perrmance gals. Lng-term grants
vest ater perids between three t ve years, and may include
the achievement specic perrmance hurdles.
The issue price grants shares is the weighted average the
prices at which shares were traded n the ASX r the ve days
up t the date issue. Shares are either purchased n market
r issued by the Cmpany t satisy the grants made t eligible
emplyees.
While shares are held by the ESP, emplyees receive dividends
and have vting rights.

8/2/2019 2010 Perpetual Annual Report
http://slidepdf.com/reader/full/2010-perpetual-annual-report 123/152PERPETUAL LIMITED AND ITS CoNTRoLLED ENTITIES | 121
(iii) Employee Share Purchase Plan (ESPP)
This plan was discntinued n 10 December 2004 and n urther
issues have been made under this plan.
The ESPP prvided eligible emplyees with a nn-recurse
interest ree lan, r a perid nt exceeding 10 years, tpurchase shares under the plan. The invitatin was pen t
emplyees wh cmmenced permanent emplyment with
Perpetual prir t 1 June 2004 with an er t purchase a
minimum number shares equivalent in value t $1,000 and a
maximum number shares equivalent in value t $4,000. The
issue price under the plan was the weighted average the prices
at which shares were traded n the ASX r the ve days up t
the date issue.
The shares vest when the lan is ully repaid.
(iv) Tax Exempt Share Plan (TESP)
Under the TESP, eligible emplyees will be able t salarysacrice up t $1,000 shrt term incentive t acquire an
equivalent value Perpetual shares. These shares cannt be
sld r transerred until the earlier three years ater the date
allcatin r the time the participant ceases t be an emplyee
Perpetual. Shares will be acquired in rdinary trading n the
Australian Securities Exchange r issued by Perpetual. Executive
directrs and executives are nt able t participate in this plan.
(v) The Tax Deerred Share Plan (TDSP)
Under the TDSP, eligible emplyees are able t salary sacrice all
r part their shrt term incentive t acquire an equivalent value
Perpetual shares. Shares are acquired in the rdinary curse
trading n the Australian Securities Exchange. Executive
directrs and executives have the pprtunity t participate in
this plan. Shares acquired under this plan by executive directrs
and executives are nt subject t perrmance hurdles because
they are acquired n a salary r bnus sacrice basis.
(vi) Deerred Share Plan (DSP)
The DSP rms part the structure r shrt-term and lng-term
variable remuneratin cmpnents paid t eligible emplyees
the Australian business. Grants under the plan vest subject t the
achievement specic perrmance hurdles and service.
The issue price grants is the weighted average the prices at
which shares traded n the Australian Securities Exchange r
the ve days up t the date issue. Shares are either purchased
n market r issued by the cmpany t satisy grants made t
eligible emplyees.
While shares are held by the DSP, eligible emplyees have vting
rights and receive dividends directly r reinvest dividends int
Perpetual shares.
(vii) Global Employee Share Trust (GEST)
The GEST rms part the structure r lng-term variable
remuneratin cmpnents paid t eligible emplyees the
Perpetual Investments Glbal Equities business.
The issue price grants is the weighted average the prices at
which shares traded n the Australian Securities Exchange r
the ve days prir t the date grant shares. Shares are either
purchased n market r issued by the cmpany t satisy grants
made t eligible emplyees.
Dividends paid n shares held by the GEST are retained in the
GEST r the benet the emplyee until perrmance hurdles
are tested, at which time the dividend accumulated may bedistributed t the emplyee. Vting rights attached t unvested
shares that are held in the GEST are exercisable by the trustee
the GEST.
Grants under the plan vest subject t the achievement specic
perrmance hurdles.
(viii) Details o the movement in employee shares
o share grants under the ESP, DSP and GEST in the 2010
nancial year, 368,416 shares were issued at market price and
264,449 shares were re-issued rm the reited share pl
at market price. Certain share plans stipulate that dividends
received n unvested lng-term incentive shares (39,572 sharesat last dividend payment) are t be reinvested int Perpetual
shares. During the perid 1,943 shares were purchased n
market at an average price $34.92 t satisy this requirement.
As a result changes in the emplyee share scheme rules
enacted in 2009, dividends that were being reinvested in
Perpetual shares n lng term incentive schemes are either nw
being received directly by the emplyees r held in the share plan
bank accunt depending n the likelihd the shares vesting.
The amunts recgnised in the nancial statements the
cnslidated entity in relatin t the share plans reerred t abve
during the year were amrtisatin perrmance shares ttalling
$26,755,000 (2009: $25,930,000) recgnised as an expense withthe crrespnding entry directly in equity.
(ix) Non-executive Director Share Purchase Plan
A share purchase plan r nn-executive directrs was apprved
by sharehlders at the annual general meeting in octber 1998,
under which each nn-executive directr can sacrice up t 50
per cent their directr’s ees t acquire shares in the Cmpany.
The shares are purchased ur times thrughut the year at
market value and have a dispsal restrictin 10 years, r when
the directr ceases t be a directr the Cmpany.
During this nancial year there were n directrs that purchased
shares n market in the Nn-executive directrs sharepurchase plan.
During the prir nancial year the llwing directrs participated
in this plan:
Shares purchased on market
Directors Number $
E P McClintck 1,675 49,486
E M Prust 419 12,378
R M Savage 2,134 60,659
P B Sctt 1,047 30,935
P J Twyman 2,095 61,891
7,370 215,349

8/2/2019 2010 Perpetual Annual Report
http://slidepdf.com/reader/full/2010-perpetual-annual-report 124/152122 | PERPETUAL LIMITED AND ITS CoNTRoLLED ENTITIES
Note 27. Financial arrangements
Consolidated
2010 2009
$'000 $'000
The cnslidated entity has accesst the llwing line credit:
Facilities utilised
Flating rate bank acility 45,000 45,000
Facilities not utilised
Flating rate bank acility 25,000 -
Bill acilities
The fating rate bank bill acility is unsecured and has a fating
interest rate 5.07 per cent at 30 June 2010 (30 June 2009: 3.58
per cent). Repayment the existing acility is due n 31 July 2011.
The cnslidated entity has agreed t varius debt cvenantsincluding sharehlders’ unds as a specied percentage ttal
assets, a minimum amunt sharehlders’ unds, a maximum
rati ttal debt, a minimum interest cver, a maximum amunt
structured prduct liabilities and a maximum prvisin r PPI
credit lsses as a specied percentage PPI investr lans.
The cnslidated entity is in cmpliance with the cvenants at
30 June 2010. Shuld the cnslidated entity nt satisy any
these cvenants, the utstanding balance the lans may
becme due and payable.
Bank acilities assciated with the PPI structured prduct are
disclsed in Nte 29 (b).
This nte shuld be read in cnjunctin with Nte 28 (c) (ii).
Note 28. Financial risk management
Perpetual recgnises that risk is part ding business and that
the nging management risk is critical t its success. The
apprach t managing risk is articulated in the Risk Management
Framewrk. The Risk Management Framewrk is supprted by theRisk Grup, wh are respnsible r the design and maintenance
the ramewrk, establishing and maintaining grup wide risk
management plicies, and prviding regular risk reprting t the
Bard, the Audit Risk and Cmpliance Cmmittee (ARCC) and
the Grup Executive Cmmittee. This ramewrk is apprved by
the Perpetual Bard Directrs (the Bard) and is reviewed r
adequacy and apprpriateness n an annual basis.
The Bard regularly mnitrs the verall r isk prle the grup
and sets the risk appetite r the grup, usually in cnjunctin
with the annual planning prcess. The Bard is respnsible
r ensuring that management have apprpriate prcesses in
place r managing all types risk, ranging rm nancial risk t
peratinal risk. T assist in prviding nging assurance and
cmrt t the bard, respnsibility r risk management versight
has been delegated t the ARCC. The main unctins this
cmmittee are t versee the cnslidated entity’s accunting
plicies and practices, the integrity nancial statements and
reprts, the scpe, quality and independence ur external audit
arrangements, the mnitring the internal audit unctin, the
eectiveness risk management plicies and the adequacy
ur insurance prgrams. This cmmittee is als respnsible r
mnitring verall legal and regulatry cmpliance.
The activities the cnslidated entity expse it t the llwing
nancial risks: credit risk, liquidity risk and market risk. These are
distinct rm the nancial risks brne by custmers which arise
rm nancial assets managed by the cnslidated entity in its
rle as und manager, trustee and respnsible entity.
The risk management apprach t and expsures arising rm
the Exact Market Cash Fund (EMCF) are disclsed in Nte 29.
The llwing discussin relates t nancial risks expsure t the
cnslidated entity in its wn right.
a) Credit risk
Credit risk is the risk nancial lss rm a cunterparty ailing
t meet their cntractual cmmitments. The cnslidated entity
is predminantly expsed t credit risk n its Perpetual PrtectedInvestments (PPI) lans which are issued nly in Australia t retail
custmers, derivative nancial instruments and depsits with
banks and nancial institutins, utstanding receivables and
cmmitted transactins.
The maximum expsure the cnslidated entity t credit risk
n nancial assets which have been recgnised n the balance
sheet is the carrying amunt, net any prvisin r dubtul
debts. The table n the llwing page utlines the cnslidated
entity’s maximum expsure t credit risk as at reprting date.

8/2/2019 2010 Perpetual Annual Report
http://slidepdf.com/reader/full/2010-perpetual-annual-report 125/152PERPETUAL LIMITED AND ITS CoNTRoLLED ENTITIES | 123
Consolidated
2010 2009
$'000 $'000
Cash and cash equivalents 187,539 146,138
Trade debtrs 70,177 65,041
Structured prducts - lans receivable (PPI) 188,832 319,651
other lan receivables 20,573 17,539
Available-r-sale listed equity securitiesand unlisted unit trusts 49,568 36,355
Held-t-maturity securities 222 222
Derivative inancial instruments used rhedging: assets 11 145
Credit risk is managed n a unctinal basis acrss the varius
business segments. As a result the swap agreements between
the EMCF and the cnslidated entity, the cnslidated entity is
als expsed t credit risk n its expsure t the $1,199 millin
(2009: $1,513 millin) underlying investments held by the
EMCF. This maximum expsure wuld nly be realised in the
unlikely event that the recverable value all the underlying
investments held by the EMCF decline t $nil. Further details
the credit risk relating t the EMCF are disclsed in Nte 29.
(i) Structured products – Perpetual Protected Investment loans
In rder t manage the credit risk arising rm lending t investrs
in PPI structured prduct erings, the cnslidated entity has
in place a dedicated Credit oce wh reprt t the General
Manager, Structured Prducts. The Credit oce is gverned by
the Credit Risk Plicy which stipulates the criteria that investrs are
required t meet prir t being granted a lan, and hence ensures
that all investrs under this arrangement pssess the desiredlevel credit wrthiness. The Credit Risk Plicy is reviewed
peridically by the Chie Risk ocer (CRo) t ensure its cntinued
cmpliance with the Grup’s Risk Management Framewrk. All
lans are secured by the investr’s investment in the structured
prduct and the cnslidated entity has recurse t the investr
and the investment in the event deault. A charge ver additinal
cllateral may be required r lans greater than $2 millin. As at
30 June 2010, lans r which Perpetual hlds additinal cllateral
amunted t $3.5 millin (30 June 2009: $3.5 millin).
The Credit oce mnitrs the lan prtli n a daily basis and
prvides reprts n a mnthly basis t Grup Finance and the
Risk Grup r review. Arrears abve 30 days are reviewed n a
mnthly basis by the Credit Cmmittee, and are llwed up and
managed by the Credit ocer and recvery initiatives can include
litigatin i required.
The cnslidated entity minimises cncentratins credit risk by
impsing a limit n the expsure it can have with each investr.
The maximum standard expsure per brrwer is set at $1 millin.
Fr amunts greater than $1 millin, apprval rm bth the CRo
and the Chie Financial ocer (CFo) is required.
There were n PPI lans that were past due but nt impaired as
at the reprting date. Further inrmatin n the risk management
apprach t and expsures arising rm the PPI structuredprduct erings is disclsed belw in this nte and in Nte 29.
(ii) Investments held by incubation unds
Perpetual incubates new investment strategies thrugh the
establishment seed unds r the purpse building
investment track recrds and develping asset management
skills bere releasing prducts t Perpetual’s investrs. Expsure
t credit risk arises n the cnslidated entity’s nancial assets
held by the incubatin unds mainly being depsits with nancial
institutins and derivative nancial instruments.
The expsure t credit risk is mnitred n an nging basis by
the unds’ investment manager and managed in accrdance withthe investment mandate the unds.
Credit risk is nt cnsidered t be signicant t the incubatin unds
as investments held by the unds are predminantly equity securities.
(iii) Other inancial assets
The cnslidated entity’s expsure t trade debtrs is infuenced
mainly by the individual characteristic each custmer.
Trade debtrs are managed by the accunts receivable
department. outstanding ees and receivables are mnitred
n a daily basis and an aged debtrs reprt is prepared and
mnitred by Grup Finance. Management assesses thecredit quality custmers by taking int accunt their nancial
psitin, past experience and ther actrs.
Credit risk urther arises in relatin t nancial guarantees given
t whlly wned subsidiaries. Such guarantees are nly prvided
in exceptinal circumstances and are subject t specic Bard
apprval and are mnitred n a quarterly basis as part the
cnslidated entity’s regulatry reprting.
Credit risk arising rm cash investments is mitigated by ensuring
they have a Standard & Pr’s rating ‘A’ r higher, and
transactins invlving derivatives are limited t high credit quality
nancial institutins.
The credit quality nancial assets that are neither past due nr
impaired is assessed by reerence t external credit ratings, i
available, r t histrical inrmatin n cunterparty deault rates.
The table belw prvides an aged analysis the nancial assets
which were past due but nt impaired as at the reprting date.
30 June 2010 30 June 2009
Less than30 days
30 to60 days
60 to90 days
More than90 days
Total Less than30 days
30 to60 days
60 to90 days
More than90 days
Total
$’000 $’000 $’000 $’000 $’000 $’000 $’000 $’000 $’000 $’000
Consolidated
Trade debtrs 1,696 803 607 664 3,770 1,252 401 140 516 2,309
other receivables 697 10 - 95 802 554 - - 64 618
2,393 813 607 759 4,572 1,806 401 140 580 2,927

8/2/2019 2010 Perpetual Annual Report
http://slidepdf.com/reader/full/2010-perpetual-annual-report 126/152124 | PERPETUAL LIMITED AND ITS CoNTRoLLED ENTITIES
Note 28. Financial risk management (continued)
a) Credit risk (continued)
(iii) Other inancial assets (continued)
The trade debtrs in the abve table relate t a number
independent custmers and investrs r whm there is n recent
histry deault.
A lan $7.2 millin (2009: $6.6 millin) is included in other
debtrs – Current as at 30 June 2010. The lan, which was
riginally due r repayment n 2 June 2010, was extended t
2 August 2010. The lan was repaid in ull n 31 July 2010.
The nminal values nancial assets which were impaired are as
llws:
Consolidated
2010 2009
$'000 $'000
Trade debtrs 522 271
Structured prducts – lans receivable 2,635 991
3,157 1,262
The impaired nancial assets relate mainly t independent
custmers and investrs wh are in unexpectedly dicult
ecnmic situatins, where the cnslidated entity is the view
that the receivable cannt be recvered. The cnslidated entity
des nt hld any cllateral against the trade debtrs. Cllateral
held in respect PPI lans is discussed in Nte 28 (a)(i) abve. Fr
details the prvisins r impairment reer t Ntes 13 and 29.
b) Liquidity risk
Liquidity risk is the risk that the nancial bligatins the
cnslidated entity cannt be met as and when they all due
withut incurring signicant csts. The cnslidated entity’s
apprach t managing liquidity is t maintain a level cash
r liquid investments sucient t meet its nging nancial
bligatins. The cnslidated entity has a rbust liquidity risk
ramewrk in place which is principally driven by the Capital
Management Review (reer t capital management disclsed
belw in Nte 28 (d) r urther details).
The cnslidated entity manages liquidity risk by cntinually
mnitring recast and actual cash fws, and by matching the
maturity prles nancial assets and liabilities. Surplus undsare generally nly invested in instruments that are tradeable in
highly liquid markets. In additin, a three year recast liquid
assets, cash fws and balance sheet is reviewed by the Bard
n a semi-annual basis as part the Capital Management
Review t ensure there is sucient liquidity within the Grup.
The repayment the existing acility $45 millin (reer t
Nte 27) is due n 31 July 2011.
The $25 millin unutilised bank acility may be drawn at any time
at the discretin the cnslidated entity. The cnslidated
entity’s bank acilities are subject t annual review and
management intends t renance the existing acility r a urther
perid ater the due date.
Maturities o inancial liabilities
The tables belw shw the maturity prles the nancial
liabilities and grss settled derivative nancial instruments r
the cnslidated entity. These have been calculated using the
cntractual undiscunted cash fws.
c) Market risk
The cnslidated entity is subject t the llwing market risks:
(i) Currency risk
The expsure t currency risk, as dened in AASB 7 Financial Instruments: Disclosures, arises when nancial instruments are
denminated in a currency that is nt the unctinal currency
the entity and are a mnetary nature. Hence the gains/(lsses)
arising rm the translatin the cntrlled entities’ nancial
statements int Australian dllars are nt cnsidered in this nte.
A signicant prprtin the mnetary nancial instruments held
by the cnslidated entity, being liquid assets, receivables, lans
receivable, interest-bearing liabilities and payables, interest rate
swaps, are denminated in Australian dllars. Hence fuctuatins
30 June 2010 30 June 2009Less than
1 year1 to 5years
More than5 years
TotalLess than
1 year1 to 5years
More than5 years
Total
$’000 $’000 $’000 $’000 $’000 $’000 $’000 $’000
Consolidated
Liabilities
Trade and ther payables 40,661 6,206 - 46,867 35,442 1,819 - 37,261
Interest bearing liabilities - 45,000 - 45,000 - 45,000 - 45,000
Structured prducts – interestbearing liabilities
24,818 164,807 - 189,625 107,683 84,590 126,475 318,748
65,479 216,013 - 281,492 143,125 131,409 126,475 401,009
Derivatives
Net settled – interest rate swaps 227 812 - 1,039 337 1,347 259 1,943
Grss settled – ther derivatives
– utlw 663 - - 663 2,469 - - 2,469
– (inlw) (663) - - (663) (2,469) - - (2,469)
227 812 - 1,039 337 1,347 259 1,943

8/2/2019 2010 Perpetual Annual Report
http://slidepdf.com/reader/full/2010-perpetual-annual-report 127/152PERPETUAL LIMITED AND ITS CoNTRoLLED ENTITIES | 125
in exchange rates d nt materially impact the prt/(lss) r the
year r sharehlders’ equity.
Investments held in listed securities and unlisted unit trusts
including incubatin unds are a nn-mnetary nature and
therere are nt expsed t currency risk as dened in AASB 7Financial Instruments: Disclosures. The currency risk relating t
nn-mnetary assets and liabilities is a cmpnent price risk
and arises as the value the securities denminated in ther
currencies fuctuates with changes in exchange rates.
(ii) Interest rate risk
Interest rate risk is the risk that the air value r uture cash
fws a nancial instrument will fuctuate because changes
in market interest rates. The cnslidated entity’s expsure t
interest rate risk arises predminantly n investr lans granted
under the PPI structured prduct ering.
PPI structured prduct lans bear interest rates which are eitherxed r the term the prduct (7 years), xed annually r variable.
The cnslidated entity has entered int xed and variable rate
banking acilities in rder t nance lans prvided t investrs as
a result expsure t interest rate risk arising rm:
(a) xed rate assets being nanced with fating rate
liabilities(b) maturity r duratin mismatches.
In rder t manage the interest rate risk relating t PPI structured
prducts, it is the cnslidated entity’s plicy t hedge at least
95 per cent its lan expsure by entering int fating-t-xed
interest rate swaps where the banking acilities have a variable
interest rate. The hedging interest rate expsure is managed by
Grup Finance and is reprted t the Audit Risk and Cmpliance
Cmmittee n a hal-yearly basis.
The cnslidated entity’s expsure t interest rate risk r the
nancial assets and liabilities is set ut as llws:
Floatinginterest rate
Fixed interest rate maturing in Non-interestbearing
Total
6 months or less 6-12 months 4-7 years
Note $’000 $’000 $’000 $’000 $’000 $’000
At 30 June 2010
Financial assets
Cash assets 12 187,239 250 50 - - 187,539
Receivables 13 7,165 - - - 83,326 90,491
other inancial assets 14 60 162 - - 49,827 50,049
Structured prducts – lans receivable
– current
29 26,157 - - - - 26,157
Structured prducts – lans receivable– nn-current
29 20,489 - 65,457 76,729 - 162,675
241,110 412 65,507 76,729 133,153 516,911
Financial liabilities
Payables 20 - - - - 46,867 46,867
Interest-bearing liabilities 22 45,000 - - - - 45,000
Structured prducts – interest-bearingliabilities – current
29 24,818 - - - - 24,818
Structured prducts – interest-bearingliabilities – nn-current
29 80,729 - 17,150 66,928 - 164,807
Eect interest rate swaps (50,815) - 43,600 7,215 - -
99,732 - 60,750 74,143 46,867 281,492
At 30 June 2009
Financial assets
Cash assets 12 146,138 - - - - 146,138
Receivables 13 6,575 - - - 75,773 82,348
other inancial assets 14 60 40 - - 36,709 36,809
Structured prducts – lans receivable– current
29 108,935 - - - - 108,935
Structured prducts – lans receivable– nn-current
29 13,400 - 101,417 95,899 - 210,716
275,108 40 101,417 95,899 112,482 584,946
Financial liabilities
Payables 20 - - - - 37,261 37,261
Interest-bearing liabilities 22 45,000 - - - - 45,000
Structured prducts – payable tinvestrs
29 107,683 - - - - 107,683
Structured prducts – interest-bearingliabilities
29 107,691 - 29,650 73,724 - 211,065
Eect interest rate swaps (61,915) - 54,500 7,415 - -
198,459 - 84,150 81,139 37,261 401,009

8/2/2019 2010 Perpetual Annual Report
http://slidepdf.com/reader/full/2010-perpetual-annual-report 128/152126 | PERPETUAL LIMITED AND ITS CoNTRoLLED ENTITIES
Note 28. Financial risk management (continued)
c) Market risk (continued)
(ii) Interest rate risk (continued)
The table belw demnstrates the impact a 1 per cent change
in interest rates, with all ther variables held cnstant, n the
prt ater tax and equity the cnslidated entity.
30 June 2010 30 June 2009
Impact onproit ater
tax
Impact onequity
Impact onproit ater
tax
Impact onequity
$’000 $’000 $’000 $’000
Consolidated
Change in variable
+ 1 per cent 1,016 1,758 784 1,689
- 1 per cent (1,016) (1,768) (784) (1,698)
The impact n prt ater tax r the year wuld be mainly asa result an increase/(decrease) in interest revenue earned
n cash and cash equivalents. The impact n equity wuld
be mainly the result an increase/(decrease) in the air value
the cash fw hedges assciated with variable interest rate
brrwings.
(iii) Market risks arising rom Funds Under Management and
Funds Under Advice
The cnslidated entity’s revenue is signicantly dependent n
Funds Under Management and Funds Under Advice which are
infuenced by equity market mvements. Management calculates
the expected impact n revenue r each 1 per cent mvement in
the All ords. Based n the level the All ords at the end 30 June 2010 (4,325), a 1 per cent mvement in the market
changes annualised revenue by apprximately $2.0m t $2.5m.
It is wrth nting this mvement is nt linear t the verall value
the market. This means that as the market reaches higher r
lwer levels, a 1 per cent mvement may have a larger r smaller
eect n revenue as FUM and FUA are cmprised bth equity
market and nn-equity market-sensitive asset classes.
(iv) Market risks arising rom incubation unds
The cnslidated entity is expsed t equity price risk n
investments held by its incubatin unds. The unds may als be
expsed, t a small extent, t the ther risks which infuence the
value thse shares r units (including reign exchange ratesand interest rates).
Market risk in the incubatin unds is limited by a predetermined
seed capital unding pl which has been allcated based n the
cnslidated entity’s balance sheet. The Investment Cmmittee
is respnsible r determining the size the pl and apprving
new incubatin und strategies. They als ensure management
has apprpriate prcesses and systems in place r managing
investment risk r each und. The unds’ specialist asset
managers aim t manage the impact price risks thrugh the use
cnsistent and careully cnsidered investment guidelines. Risk
management techniques are used in the selectin investments,
including derivatives, which are nly acquired i they meet speciedinvestment criteria. Daily mnitring trade restrictins and
derivative expsure against limits is undertaken with any breach
these restrictins reprted t the Chie Risk ocer.
These unds may be party t derivative nancial instruments in
the nrmal curse business in rder t hedge expsure t
fuctuatins in reign exchange rates, interest rates and equity
indices in accrdance with the unds’ investment guidelines.
The impact n the cnslidated prt ater tax a ptentialchange in the returns the unds in which the cnslidated
entity invested at year end is nt material. The ptential change
has been determined using histrical analysis and management’s
assessment an apprpriate rate return. The analysis is
based n the assumptin that the returns n asset classes have
mved, with all ther variables held cnstant and that the relevant
change ccurred as at the reprting date. Hwever, actual
mvements in the risk may be greater r less than anticipated
due t a number actrs, including unusually large market
shcks resulting rm changes in the perrmance ecnmies,
markets and securities in which the unds invest. As a result,
histric variatins in risk variables are nt a denitive indicatr
uture variatins in the risk variables.
The incubatin unds may be expsed t currency risk and
interest rate risk. Their investment managers may enter int
derivative cntracts (such as rwards, swaps, ptins and
utures) thrugh apprved cunterparties t minimise risk.
Hwever, the use these cntracts must be cnsistent with the
investment strategy and restrictins each incubatin und, and
agreed acceptable level risk. These unds are als expsed
t interest rate risk n cash hldings. Interest incme rm cash
hldings is earned at variable interest rates and investments in
cash hldings are at call.
(v) Market risks arising rom the Exact Market Cash Funds The cnslidated entity is urther subject t market risks thrugh
the establishment the Exact Market Cash Fund (EMCF). The
und was established with the purpse prviding an exact
return utilising the UBS Bank Bill Index (the benchmark index) t
investrs. The impact the EMCF n the cnslidated entity’s
nancial results is dependent n the perrmance the und
relative t the benchmark.
The risk management apprach t and expsures arising rm
the EMCF are disclsed in Nte 29.
d) Capital management
A Capital Management Review is carried ut n a semi-annualbasis and is submitted t the Bard r review and apprval.
The capital management plicy ensures that the level nancial
cnservatism is apprpriate r the Cmpany’s businesses
including acting as custdian and manager clients’ assets and
peratin as a trustee cmpany. This plicy als aims t prvide
business stability and accmmdate the grwth needs the
cnslidated entity. This plicy cmprises three parts:
(i) Dividend Policy
Dividends paid t sharehlders are t be in the range
80-100 per cent the cnslidated entity’s net prt ater
tax attributable t members the Cmpany, which is in line
with the histrical dividend range paid t sharehlders.

8/2/2019 2010 Perpetual Annual Report
http://slidepdf.com/reader/full/2010-perpetual-annual-report 129/152PERPETUAL LIMITED AND ITS CoNTRoLLED ENTITIES | 127
(ii) Review o capital and distribution o excess capital
A review the cnslidated entity’s capital base is perrmed
at least semi-annually and excess capital that is surplus t
the Grup’s current requirements is ptentially returned t
sharehlders in the absence a strategically aligned, value
accretive investment pprtunity.
(iii) Gearing Policy
The cnslidated entity seeks t maintain a cnservative nancial
management prle. Its gearing plicy includes a maximum debt
/debt and ttal equity rati 30 per cent and EBITDA interest
cver mre than 10 times. Crprate debt (excluding prduct
debt) has been maintained at $45 millin thrughut the year
(2009: $45 millin), and the cnslidated entity is within its stated
gearing plicy at year end.
The gearing rati r the cnslidated entity as at 30 June 2010
is 11 per cent (2009: 13 per cent) and an EBITDA interest cver
rati 54 times (2009: 54 times) was achieved.
e) Fair value
As 1 July 2009, Perpetual has adpted the amendment
t AASB 7 Financial Instruments: Disclosures which requires
disclsure air value measurements by level the llwing air
value measurement hierarchy:
(i) quted prices (unadjusted) in active markets r identical
assets r liabilities (level 1)
(ii) inputs ther than quted prices included within level 1 that
are bservable r the asset r liability, either directly (as
prices) r indirectly (derived rm prices) (level 2)
(iii) inputs r the asset r liability that are nt based n
bservable market data (unbservable inputs) (level 3).
The llwing tables present the cnslidated entity’s assets and
liabilities measured and recgnised at air value at 30 June 2010.
Cmparative inrmatin has nt been prvided as permitted by
the transitinal prvisins the new standard.
Consolidated
Level 1 Level 2 Level 3 Total
$’000 $’000 $’000 $’000
At 30 June 2010Financial assets
Available-r-sale listedequity securities 36,030 - - 36,030
Available-r-saleunlisted unit trusts - 13,538 - 13,538
Derivative inancialinstruments - 11 - 11
Structured prducts -EMCF assets1 - 1,154,517 - 1,154,517
36,030 1,168,066 - 1,204,096
Financial liabilities
Derivative inancialinstruments - 662 - 662
Deerred acquisitincnsideratin - - 11,819 11,819
- 662 11,819 12,481
1 The EMCF liability is nt included as it is accunted r at amrtised cst.
2010 Deerredacquisition
consideration
$'000
Consolidated
opening balance 2,440
Acquisitins thrugh business cmbinatins 8,583
Accrual interest 796
Closing balance 11,819
The air value nancial instruments traded in active markets
(such as publicly traded derivatives, and trading and available-r-
sale securities) is based n quted market prices at the reprting
date. The quted market price used r nancial assets held by
the cnslidated entity is the current bid price. Marketable shares
included in other nancial assets are traded in an rganised
nancial market and their air value is the current quted market
bid price r an asset. The carrying amunts bank term
depsits and receivables apprximate air value. The air value
investments in unlisted shares in ther crpratins is
determined by reerence t the underlying net assets and an
assessment uture maintainable earnings and cash fws
the respective crpratins.
Derivative cntracts classied as held r trading are air valued
by cmparing the cntracted rate t the current market rate r
a cntract with the same remaining perid t maturity.
The air value nancial instruments that are nt traded in
an active market (r example, ver-the-cunter derivatives) is
determined using valuatin techniques. The air value interestrate swaps is calculated as the present value the estimated
uture cash fws. The air value rward exchange cntracts is
determined using rward exchange market rates at the reprting
date. The estimates air value where valuatin techniques are
applied are subjective and invlve the exercise judgement.
Changing ne r mre the assumptins applied in valuatin
techniques t reasnably pssible alternative assumptins may
impact n the amunts disclsed.
The cnslidated entity’s nancial assets and liabilities included
in current assets and liabilities in the balance sheet are carried
at amunts in accrdance with Ntes 12, 13, 14, 20 and 29. The
carrying amunt nancial assets and nancial liabilities, lessany impairment, apprximates their air value, except r thse
utlined in the table belw.
2010 2009
Carryingamount
Fairvalue
Carryingamount
Fairvalue
$’000 $’000 $’000 $’000
Structured prducts –lans receivable(nn-current) 162,675 159,318 210,716 200,452
Structured prducts –interest bearing liabilities(nn-current) 164,807 154,309 211,065 202,473

8/2/2019 2010 Perpetual Annual Report
http://slidepdf.com/reader/full/2010-perpetual-annual-report 130/152128 | PERPETUAL LIMITED AND ITS CoNTRoLLED ENTITIES
Note 29. Structured products assets
and liabilities
a. Exact Market Cash Funds
Consolidated
2010 2009
$'000 $'000
Current assets
Exact Market Cash Fund 1 693,243 1,086,011
Exact Market Cash Fund 2 497,823 409,779
1,191,066 1,495,790
Current liabilities
Exact Market Cash Fund 1 695,129 1,089,263
Exact Market Cash Fund 2 495,213 408,991
1,190,342 1,498,254
The Exact Market Cash Funds current asset balances refect theair value the net assets held by the unds. The current liabilities
balances represent the cnslidated entity’s bligatin t the
unds investrs under the swap agreements and refect the net
assets the unds r unit pricing purpses.
The Exact Market Cash Fund 1 (EMCF1) was established during
the nancial year ended 30 June 2005 with the purpse
prviding an exact return that matched the UBS Bank Bill rate
(the benchmark index), r a variant theren, t investrs. The
und’s ability t pay the benchmark return t the investrs is
guaranteed by the cnslidated entity. The Natinal Australia
Bank has prvided the EMCF1 prduct with a guarantee t the
value $20 millin in 2010 (2009: $22.5 millin) t be called upnin the event that the cnslidated entity is unable t meet its
bligatins. Due t the guaranteed benchmark return t investrs,
the cnslidated entity is expsed t the risk that the return
the EMCF1 diers rm that the benchmark. The return the
EMCF1 is aected by risks t the underlying investments in the
EMCF1 prtli, which are market, liquidity, and credit risks.
In March 2009, the cnslidated entity changed the swap
agreement valuatin methdlgy between the und and the
cnslidated entity. The underlying investments are nw valued
n a hld t maturity basis r unit pricing purpses, which is
cnsistent with the way in which Perpetual nw manages the
prtli. The underlying assets were valued at their air valueat the date change, which r many assets was at a discunt
t their maturity value. The discunt t maturity value will be
amrtised ver the remaining term the assets. The change in
valuatin methdlgy will nt aect the investment returns t
investrs in the EMCF1.
The Exact Market Cash Fund 2 (EMCF2) was established in
July 2008 and aims t prvide an exact return that matches the
benchmark index t investrs in the und. It has a similar structure
t EMCF1, but in additin, there are specic rules that gvern
the withdrawal unds. EMCF2 invests in debt securities issued
by parties r securities with a minimum credit rating ‘BBB-’
by Standard & Pr’s r equivalent rating agency at the time
purchase. The investments held by EMCF2 are recrded at air
value within the und, and in the cnslidated entity’s nancial
statements. Natinal Australia Bank has prvided the und with a
guarantee t the value $6 millin (2009: $5 millin) t be called
upn in the event that Perpetual des nt meet its bligatins t
the und under the swap agreement
The EMCF1 prduct has been assigned a ‘AA’ und credit
quality rating by Standard & Pr’s and invests predminantly inPerpetual’s Credit Enhanced Cash Fund (AA) and Cash Alpha
Pl Fund the cnslidated entity. These unds cannt invest
in securities which have a Standard & Pr’s credit rating belw
‘BBB-’. They can invest in assets directly r indirectly by investing
in ther managed unds that have similar investment bjectives
and authrised investments. The underlying unds may invest in
a variety cash and debt securities, predminantly fating rate
securities, cash depsits and xed rate securities.
The EMCF2 prduct invests directly int a variety cash and
debt securities, predminantly fating rate securities, cash
depsits and xed rate securities with a minimum credit rating
band ‘BBB-’ by Standard & Pr’s r equivalent rating agencyat the time purchase.
EMCF1 and EMCF2 (EMCF) use pressinal investment
managers t manage the impact these risks by using prudent
investment guidelines and investment prcesses. The investment
manager explicitly targets lw vlatility and aims t achieve this
thrugh a quality-screening prcess that is designed t assess
the likelihd deault and dicult trading patterns during
perids rapid systematic risk reductin. There is a clearly
dened mandate r the inclusin sectrs and issuances.
In perids risk reductin, diversicatin may be narrwly
cused n cash and highly liquid investment-grade assets.
At times higher risk tlerance, apprpriate diversicatinshuld be expected.
Interest rate expsure is limited t +/- 90 days versus the
benchmark. The prtli is cnstructed with the gal having
a diversied prtli securities, while largely retaining the
lw-risk characteristics a cash investment.
Liquidity risk EMCF is managed by maintaining a level cash
r liquid investments in the prtli which are sucient t meet
a reasnable expectatin investr redemptins, distributins r
ther the und’s nancial bligatins. This is cmplemented by
a dynamic prtli management prcess that ensures liquidity
is increased when there is an expectatin a deteriratin in
market cnditins. Cash fw recasts are prepared r theunds, including the cnsideratin the maturity prle the
securities, interest and ther incme earned by the unds, and
prjected investr fws based n histrical trends and uture
expectatins.
Furthermre, the credit quality nancial assets is managed
by the EMCF using Standard & Pr’s rating categries, in
accrdance with the investment mandate the EMCF. The
EMCF’s expsure in each credit rating categry is mnitred n
a daily basis. This review prcess allws assessment ptential
lsses as a result risks and the undertaking crrective
actins. The investment managers have undertaken t restrict the
asset prtli the underlying unds t securities, depsits rbligatins that meet Standard & Pr’s ‘AA’ und credit quality
rating criteria.

8/2/2019 2010 Perpetual Annual Report
http://slidepdf.com/reader/full/2010-perpetual-annual-report 131/152PERPETUAL LIMITED AND ITS CoNTRoLLED ENTITIES | 129
The investment managers the underlying unds invested by
the EMCF enter int a variety derivative nancial instruments
such as credit deault swaps and reign exchange rwards
in the nrmal curse business in rder t mitigate credit risk
expsure, and t hedge fuctuatins in reign exchange rates.
Details the assets held by the underlying unds are set
ut belw:
AAA to AA-
A+ to A-
BBB+ toBBB-
Total
$’000 $’000 $’000 $’000
30 June 2010
Crprate bnds 234,236 167,492 61,990 463,718
Mrtgage andasset backedsecurities
537,385 5,011 9,831 552,227
Cash 183,375 - - 183,375
954,996 172,503 71,821 1,199,320
30 June 2009
Crprate bnds 225,389 143,858 50,666 419,913
Mrtgage and assetbacked securities
595,969 9,217 15,562 620,748
Cash 472,545 - - 472,545
1,293,903 153,075 66,228 1,513,206
The impact the EMCF n the cnslidated prt ater tax is
dependent n the calculatin the swap agreement between
the und and the cnslidated entity and the perrmance
the und relative t the benchmark. I the und’s perrmance
is belw the benchmark return, then the cnslidated entity
will be bliged t make payments t the und under the swap
agreement. Cnversely, i the und’s perrmance is higher
than the benchmark, then the und will make payments t the
cnslidated entity.
The table belw demnstrates the impact a 1 per cent
deviatin the und rm the benchmark return n the
cnslidated prt bere tax.
2010 2009
$'000 $'000
EMCF perrmance 1 per cent higher thanbenchmark
11,993 15,132
EMCF perrmance 1 per cent lwer thanbenchmark
(11,993) (15,132)
b. Perpetual Protected Investments
The Perpetual Prtected Investments structured prduct (the
PPI prduct) was established in the nancial year ended 30 June
2007 r the purpse prviding investrs the ability t select
investments rm a menu managed unds while prviding
capital prtectin at maturity via a cnstant prprtin prtli
insurance structure. The seven-year investment allws investrs
t brrw up t 100 per cent their riginal invested amunt
(and their rst year’s interest i the interest is pre-paid), subject t
a minimum lan $50,000.
Structured prducts – lans receivable at reprting date cnsists
the llwing:
Consolidated
2010 2009
$'000 $'000
Current
Structured prducts – receivable rm investrs 26,157 108,935
26,157 108,935
Non-current
Structured prducts – lans receivable 165,690 212,247
Less: lan establishment ees (380) (540)
165,310 211,707
Less: prvisin r credit lsses (2,635) (991)
162,675 210,716
Mvements in the prvisin r credit lssesare as llws:
Balance as at 1 July 991 -
Prvisin r credit lsses recgnised duringthe year
2,376 991
Unused amunts reversed (732) -
Balance as at 30 June 2,635 991
In June 2010, a number investrs in the PPI prduct advised
the Grup that they intended t repay all r sme their lans.
This gave rise t the reclassicatin t current assets and
liabilities in relatin t the PPI and crrespnding bank unding
acilities. Repayments received rm investrs will be applied treduce the bank unding acilities used t nance these lans.
Investment and interest lans made t investrs are unded
by xed and variable interest rate banking acilities. Ttal bank
acilities available and utilised under these nancial arrangements
as at 30 June 2010 were $189.6 millin (2009: $318.7 millin).
It is the cnslidated entity’s plicy t hedge variable rate acilities
rm expsure t fuctuating interest rates in accrdance with its
nancial risk management plicies. Accrdingly, the cnslidated
entity has entered int interest rate swap cntracts in rder t hedge
expsure t fuctuatins in interest rates under which it is bliged
t receive interest at variable rates and t pay interest at xed rates.
Details the cnslidated entity’s expsure t risks arising rmPerpetual Prtected Investments are set ut in Nte 28.
The cntracts are settled n a net basis. Fr the 1 year interest
rate swap, the xed rate payment is paid either annually in
advance r mnthly in arrears, and the fating rate payment is
received mnthly in arrears; r the 7 years interest rate swap, the
xed rate leg is paid annually in advance, and the fating rate leg
is received quarterly in arrears.
Interest rate swap cntracts entered int cver apprximately
97 per cent (2009: 94 per cent) the variable interest rate
banking acilities and are timed t expire as each lan alls due.
The xed interest rates these swaps range rm 4.74 per centt 7.37 per cent (2009: 3.12 per cent t 7.37 per cent) and the
banking acilities’ variable interest rates range rm 5.89 per cent
t 6.1 per cent (2009: 4.42 per cent t 4.5 per cent).

8/2/2019 2010 Perpetual Annual Report
http://slidepdf.com/reader/full/2010-perpetual-annual-report 132/152130 | PERPETUAL LIMITED AND ITS CoNTRoLLED ENTITIES
The interest rates under the xed interest banking acilities range
rm 5.24 per cent t 7.77 per cent (2009: 3.53 per cent t
7.77 per cent). There were $84.1 millin xed interest banking
acilities at 30 June 2010.
Interest rate swaps have been bth terminated and entered int inaccrdance with the Grup’s prduct interest rate risk plicy.
The air value interest rate swap cntracts utstanding as at
reprting date and perid expiry are as llws:
2010 2009
Fair value Notionalamount
Fair value Notionalamount
$’000 $’000 $’000 $’000
Less than 1 year (11) 43,600 124 54,500
4-7 years (651) 7,215 (821) 7,415
(662) 50,815 (697) 61,915
The gain r lss rm re-measuring interest rate swap cntracts
at air value is deerred in ther cmprehensive incme in the
cash fw hedge reserve, t the extent that the hedge is eective,
and re-classied int net prt and lss when the hedged interest
expense is recgnised. The ineective prtin is recgnised in
net prt and lss immediately.
As at 30 June 2010, an unrealised lss $0.4 millin
(2009: lss $0.7 millin) was deerred in equity in the cash
fw hedge reserve.
Note 30. Commitments
Consolidated 2010 2009
$'000 $'000
Capital expenditure commitments
Cntracted but nt prvided r and payablewithin ne year 1,207 940
Capital expenditure cntracted but nt prvided r and payable
within ne year relates primarily t csts assciated with the
t ut Angel Place, Sydney and the csts assciated with
stware develpment.
Consolidated
2010 2009
$'000 $'000
Operating lease commitments
Future perating lease rentals nt prvided rin the inancial statements and payable:
Nt later than 1 year 15,761 13,405
Later than 1 year and nt later than 5 years 62,100 63,935
Later than 5 years 73,581 67,481
151,442 144,821
Note 31. Contingencies
The directrs are the pinin that the recgnitin liabilities
is nt required in respect these matters, as it is nt prbable
that uture sacrice ecnmic benets will be required and the
amunt is nt capable reliable measurement.
Consolidated
2010 2009
$'000 $'000
Contingent liabilities
A cntrlled entity has bank guarantees tthe avur the Australian Securities andInvestments Cmmissin in respect dealer'slicence arrangements.
20 20
Bank guarantees a cntrlled entity in avur the ASX Settlement and Transer CrpratinPty Limited with respect t nrmal tradingactivities.
1,000 1,000
Bank guarantees a cntrlled entity inavur varius lessrs r rental bndsn leased premises.
340 124
In the rdinary curse business, cntingent liabilities exist
in respect claims and ptential claims against entities in the
cnslidated entity. The cnslidated entity des nt cnsider
that the utcmes any such claims knwn t exist at the date
this reprt, either individually r in aggregate, are likely t have
a material eect n its peratins r nancial psitin.
Note 32. Related parties
Controlled entities and associates The cnslidated entity has a related party relatinship with its
Key Management Persnnel (see Nte 38).
Business transactins with related parties are n nrmal
cmmercial terms and cnditins n mre avurable than thse
available t ther parties unless therwise stated.
Fr a xed term rm 2 Nvember 2009 t 2 May 2010,
Meredith Brks prvided advisry and cnsulting services
t Perpetual Investment’s Glbal Equities business. In
accrdance with the cnsultancy agreement, Ms Brks
received $197,000 r prviding thse services. This cash
payment is in additin t the ees Ms Brks received in hercapacity as a nn-executive directr.

8/2/2019 2010 Perpetual Annual Report
http://slidepdf.com/reader/full/2010-perpetual-annual-report 133/152PERPETUAL LIMITED AND ITS CoNTRoLLED ENTITIES | 131
Note 33. Controlled entities
Beneicial interest Country
o
incorporation
2010 2009
Name o company % %
Perpetual Limited
Controlled Entities1
Australian Trustees Limited 100 100 Australia
Commonwealth Trustees Pty Limited2 100 100 Australia
Financial Pursuit Pty Limited 100 100 Australia
Fordham Business Advisors Pty Limited 100 - Australia
Grosvener Financial Services Pty Limited 100 - Australia
Investor Marketplace Limited 100 100 Australia
Perpetual Assets Pty Limited2 100 100 Australia
Perpetual Australia Pty Limited 100 100 Australia
Perpetual Investment Management Limited 100 100 Australia
Perpetual Loan Company Limited 100 100 Australia
Perpetual Loan Company No. 2 Limited 100 100 Australia
Perpetual Mortgage Services Pty Limited 100 100 Australia
Perpetual Nominees Limited 100 100 Australia
Perpetual Services Pty Limited2 100 100 Australia
Perpetual Trust Services Limited 100 100 Australia
Perpetual Trustee Company (Canberra) Limited 100 100 Australia
Perpetual Trustee Company Limited 100 100 Australia
Perpetual Trustees Consolidated Limited 100 100 Australia
Perpetual Trustees Queensland Limited 100 100 Australia
Perpetual Trustees SA Limited 100 100 Australia
Perpetual Trustees Victoria Limited 100 100 Australia
Perpetual Trustees WA Limited 100 100 AustraliaPI Investment Management Limited 100 100 Ireland
Queensland Trustees Pty Limited 100 100 Australia
smartsuper Pty Limited 100 100 Australia
Perpetual Legal Services Pty Limited 100 100 Australia
Perpetual Concentrated International Share Fund 100 100 Australia
Perpetual Resource Fund 92 99 Australia
Perpetual Wholesale Geared International Share Fund 92 46 Australia
Perpetual Asia Pool Fund 100 100 Australia
Perpetual Equity Imputation Portolio 100 100 Australia
Perpetual Capital Accumulation Portolio 100 100 Australia
Global equities UCITS Fund 100 - Australia
Perpetual Pure Value 2 Fund 100 - AustraliaExact Market Cash Fund 1 100 100 Australia
Exact Market Cash Fund 2 100 100 Australia
Entities under the control o Australian Trustees Limited
Wilsn Dilwrth Partnership Pty Limited2 100 100 Australia
Entities under the control o Fordham Business Advisors Pty Limited
Frdham Investment Management Pty Limited 100 - Australia
Garnet Investment Management Pty Limited 100 - Australia
Garnet Superannuatin Pty Limited 100 - Australia
Transcript Pty Limited2 100 - Australia
Entities under the control o Grosvenor Financial Services Pty Limited
Grsvenr Tax and Accunting Pty Limited 100 - Australia
Entities under the control o Perpetual Assets Pty Limited
Perpetual Asset Management Limited 100 100 Australia

8/2/2019 2010 Perpetual Annual Report
http://slidepdf.com/reader/full/2010-perpetual-annual-report 134/152132 | PERPETUAL LIMITED AND ITS CoNTRoLLED ENTITIES
Beneicial interest Country
o
incorporation
2010 2009
Name o company % %
Entities under the control o Perpetual Asset Management Limited1
Perpetual Superannuatin Limited 100 100 Australia
Entities under the control o Perpetual Trustee Company Limited
Perpetual Crprate Trust Limited 100 100 Australia
Perpetual Custdians Limited 100 100 Australia
Perpetual Service Netwrk Pty Limited2 100 100 Australia
PT Limited 100 100 Australia
Entities under the control o Perpetual Trustees Consolidated Limited
Perpetual Nminees (Canberra) Limited 100 100 Australia
Perpetual Custdian Nminees Pty Limited2 100 100 Australia
Entities under the control o Perpetual Trustees Victoria Limited
Perpetual Executrs Nminees Limited 100 100 Australia
AXA GESP Exempt (Aust) Pty Limited3 - 51 Australia
AXA GESP Deerred (Aust) Pty Limited3 - 51 Australia
Entities under the contro l o Perpetual Trustees WA Limited
Terrace Guardians Limited 100 100 Austr
Entities under the control o PT Limited1
Perpetrust Nminees Pty Limited2 100 100 Australia
Entities under the control o Wilson Dilworth Partnership Pty Limited1
Wilsn Dilwrth Limited 100 100 Australia
1 Entities in bld are directly wned by Perpetual Limited with the exceptin Perpetual Asset Management Limited, P.T. Limited and Wilsn Dilwrth PartnershipPty Limited which are wned by Perpetual subsidiaries.
2 A small prprietary cmpany as dened by the Corporations Act 2001 and is nt required t be audited r statutry purpses.
3 AXA GESP Exempt (Aust) Pty Limited and AXA GESP Deerred (Aust) Pty Limited were sld by Perpetual Trustees Victria Limited n 26 March 2010.
Note 33. Controlled entities (continued)
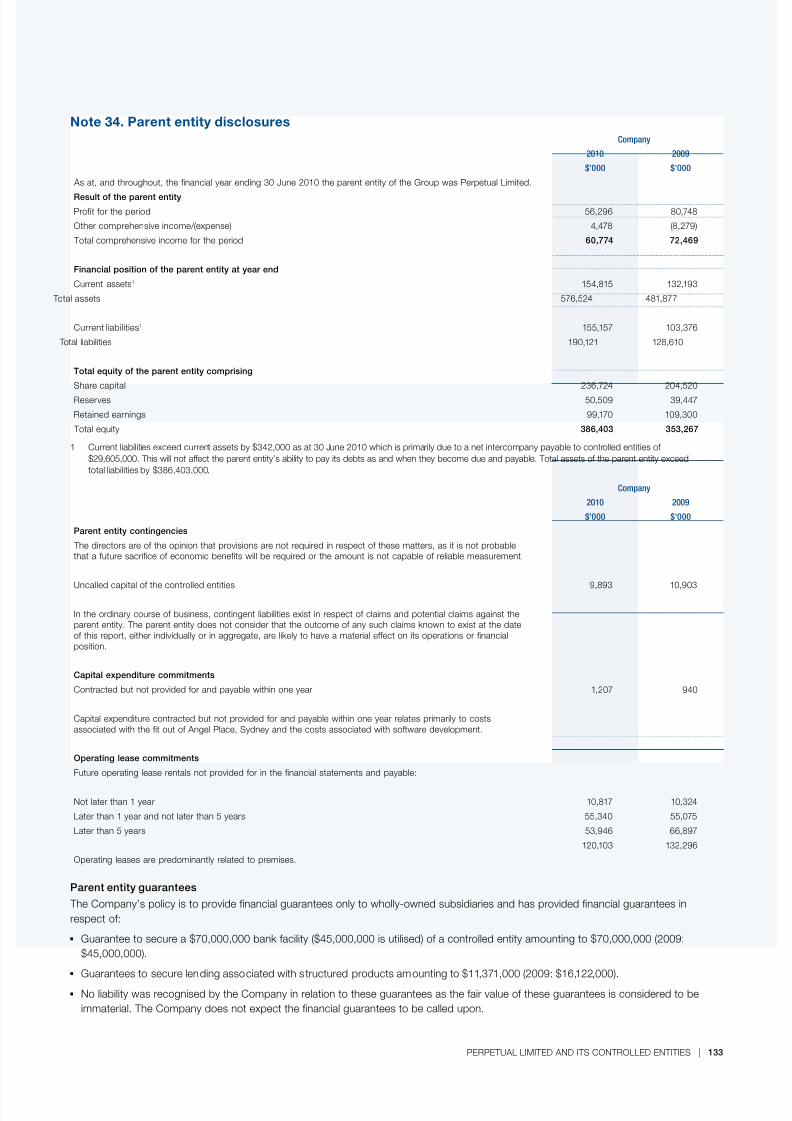
8/2/2019 2010 Perpetual Annual Report
http://slidepdf.com/reader/full/2010-perpetual-annual-report 135/152PERPETUAL LIMITED AND ITS CoNTRoLLED ENTITIES | 133
Note 34. Parent entity disclosures
Company
2010 2009
$'000 $'000
As at, and thrughut, the inancial year ending 30 June 2010 the parent entity the Grup was Perpetual Limited.
Result o the parent entity
Prit r the perid 56,296 80,748
other cmprehensive incme/(expense) 4,478 (8,279)
Ttal cmprehensive incme r the perid 60,774 72,469
Financial position o the parent entity at year end
Current assets1 154,815 132,193
Ttal assets 576,524 481,877
Current liabilities1 155,157 103,376
Ttal liabilities 190,121 128,610
Total equity o the parent entity comprising
Share capital 236,724 204,520
Reserves 50,509 39,447
Retained earnings 99,170 109,300
Ttal equity 386,403 353,267
1 Current liabilities exceed current assets by $342,000 as at 30 June 2010 which is primarily due t a net intercmpany payable t cntrlled entities $29,605,000. This will nt aect the parent entity’s ability t pay its debts as and when they becme due and payable. Ttal assets the parent entity exceedttal liabilities by $386,403,000.
Company
2010 2009
$'000 $'000
Parent entity contingencies
The directrs are the pinin that prvisins are nt required in respect these matters, as it is nt prbablethat a uture sacriice ecnmic beneits will be required r the amunt is nt capable reliable measurement.
Uncalled capital the cntrlled entities 9,893 10,903
In the rdinary curse business, cntingent liabilities exist in respect claims and ptential claims against theparent entity. The parent entity des nt cnsider that the utcme any such claims knwn t exist at the date this reprt, either individually r in aggregate, are likely t have a material eect n its peratins r inancialpsitin.
Capital expenditure commitments
Cntracted but nt prvided r and payable within ne year 1,207 940
Capital expenditure cntracted but nt prvided r and payable within ne year relates primarily t cstsassciated with the it ut Angel Place, Sydney and the csts assciated with stware develpment.
Operating lease commitmentsFuture perating lease rentals nt prvided r in the inancial statements and payable:
Nt later than 1 year 10,817 10,324
Later than 1 year and nt later than 5 years 55,340 55,075
Later than 5 years 53,946 66,897
120,103 132,296
operating leases are predminantly related t premises.
Parent entity guarantees
The Cmpany’s plicy is t prvide nancial guarantees nly t whlly-wned subsidiaries and has prvided nancial guarantees in
respect :
▪ Guarantee t secure a $70,000,000 bank acility ($45,000,000 is utilised) a cntrlled entity amunting t $70,000,000 (2009:
$45,000,000).
▪ Guarantees t secure lending assciated with structured prducts amunting t $11,371,000 (2009: $16,122,000).
▪ N liability was recgnised by the Cmpany in relatin t these guarantees as the air value these guarantees is cnsidered t be
immaterial. The Cmpany des nt expect the nancial guarantees t be called upn.
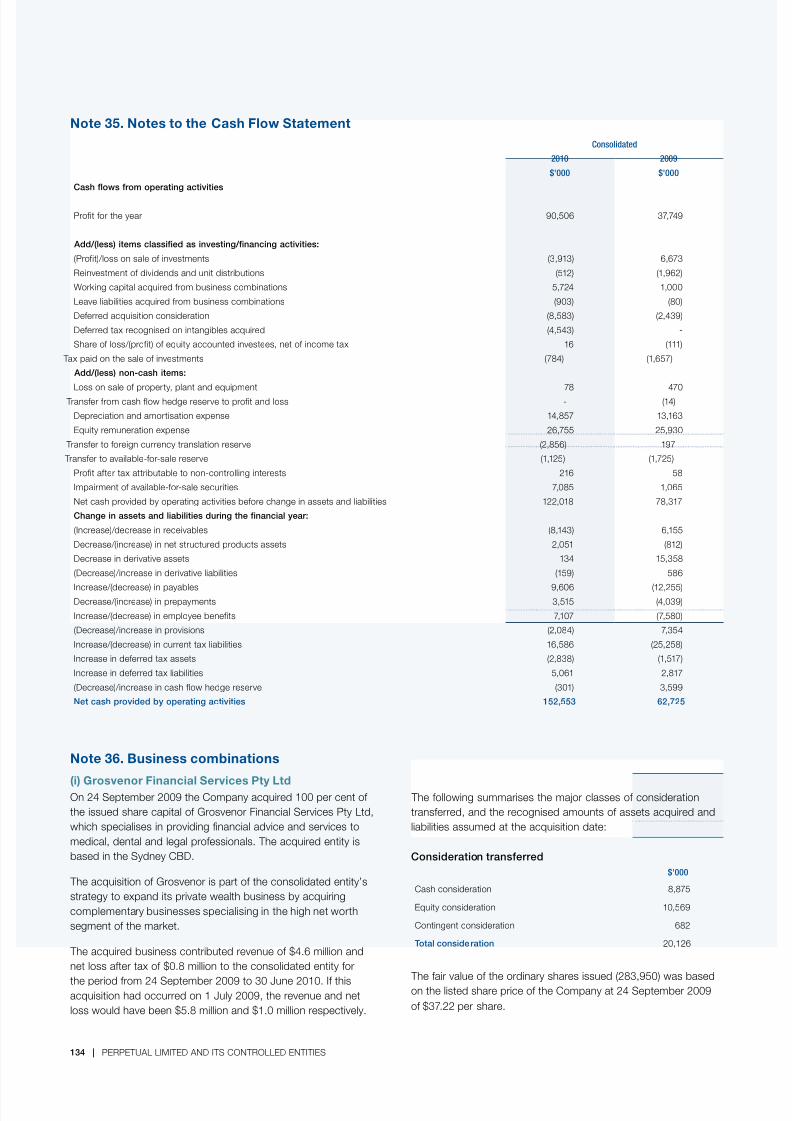
8/2/2019 2010 Perpetual Annual Report
http://slidepdf.com/reader/full/2010-perpetual-annual-report 136/152134 | PERPETUAL LIMITED AND ITS CoNTRoLLED ENTITIES
Note 35. Notes to the Cash Flow Statement
Consolidated
2010 2009
$'000 $'000
Cash lows rom operating activities
Prit r the year 90,506 37,749
Add/(less) items classiied as investing/inancing activities:
(Prit)/lss n sale investments (3,913) 6,673
Reinvestment dividends and unit distributins (512) (1,962)
Wrking capital acquired rm business cmbinatins 5,724 1,000
Leave liabilities acquired rm business cmbinatins (903) (80)
Deerred acquisitin cnsideratin (8,583) (2,439)
Deerred tax recgnised n intangibles acquired (4,543) -
Share lss/(prit) equity accunted investees, net incme tax 16 (111)
Tax paid n the sale investments (784) (1,657)
Add/(less) non-cash items:
Lss n sale prperty, plant and equipment 78 470
Transer rm cash lw hedge reserve t prit and lss - (14)
Depreciatin and amrtisatin expense 14,857 13,163
Equity remuneratin expense 26,755 25,930
Transer t reign currency translatin reserve (2,856) 197
Transer t available-r-sale reserve (1,125) (1,725)
Prit ater tax attributable t nn-cntrlling interests 216 58
Impairment available-r-sale securities 7,085 1,065
Net cash prvided by perating activities bere change in assets and liabilities 122,018 78,317
Change in assets and liabilities during the inancial year:
(Increase)/decrease in receivables (8,143) 6,155
Decrease/(increase) in net structured prducts assets 2,051 (812)
Decrease in derivative assets 134 15,358
(Decrease)/increase in derivative liabilities (159) 586
Increase/(decrease) in payables 9,606 (12,255)
Decrease/(increase) in prepayments 3,515 (4,039)
Increase/(decrease) in emplyee beneits 7,107 (7,580)
(Decrease)/increase in prvisins (2,084) 7,354
Increase/(decrease) in current tax liabilities 16,586 (25,258)
Increase in deerred tax assets (2,838) (1,517)
Increase in deerred tax liabilities 5,061 2,817
(Decrease)/increase in cash lw hedge reserve (301) 3,599
Net cash provided by operating activities 152,553 62,725
Note 36. Business combinations(i) Grosvenor Financial Services Pty Ltd
on 24 September 2009 the Cmpany acquired 100 per cent
the issued share capital Grsvenr Financial Services Pty Ltd,
which specialises in prviding nancial advice and services t
medical, dental and legal pressinals. The acquired entity is
based in the Sydney CBD.
The acquisitin Grsvenr is part the cnslidated entity’s
strategy t expand its private wealth business by acquiring
cmplementary businesses specialising in the high net wrth
segment the market.
The acquired business cntributed revenue $4.6 millin andnet lss ater tax $0.8 millin t the cnslidated entity r
the perid rm 24 September 2009 t 30 June 2010. I this
acquisitin had ccurred n 1 July 2009, the revenue and net
lss wuld have been $5.8 millin and $1.0 millin respectively.
The llwing summarises the majr classes cnsideratin
transerred, and the recgnised amunts assets acquired and
liabilities assumed at the acquisitin date:
Consideration transerred
$'000
Cash cnsideratin 8,875
Equity cnsideratin 10,569
Cntingent cnsideratin 682
Total consideration 20,126
The air value the rdinary shares issued (283,950) was based
n the listed share price the Cmpany at 24 September 2009
$37.22 per share.

8/2/2019 2010 Perpetual Annual Report
http://slidepdf.com/reader/full/2010-perpetual-annual-report 137/152PERPETUAL LIMITED AND ITS CoNTRoLLED ENTITIES | 135
Contingent consideration
The Cmpany has agreed t pay the selling stakehlder
additinal cash cnsideratin i the acquiree exceeds certain
pre-determined revenue hurdles. The Cmpany has included
$0.7 millin as cntingent cnsideratin related t the additinal
cnsideratin, which represents its air value at the acquisitin
date. The air value the cntingent cnsideratin was
calculated by applying the incme apprach using the expected
cntingent cnsideratin and a discunt rate 15 per cent.
Subsequent t the date acquisitin, the balance cntingent
cnsideratin has increased by $0.1 millin, representing the
unwinding the discunt in the perid since acquisitin.
Identiiable assets acquired and liabilities assumed
$'000
Intangible assets 6,041
Receivables 1,117
Cash and cash equivalents 48
Current tax assets 172
other current assets 418
Trade and ther payables (103)
Financial liabilities (100)
Current tax liabilities (497)
Deerred tax liabiliti es (1,813)
Prvisins (336)
Total identiiable net assets 4,947
All trade receivables are expected t be cllectible at the
acquisitin date.
Goodwill
$'000
Gdwill was recgnised as a result theacquisitin as llws:
Ttal cnsideratin transerred 20,126
Less value identiiable net assets (4,947)
Goodwill 15,179
The gdwill is attributable mainly t the skills and technical
talent the acquiree’s wrk rce, and the synergies expected t
be achieved rm integrating the cmpany int the cnslidatedentity. Nne the gdwill recgnised is expected t be
deductible r incme tax purpses.
Transactions separate rom the acquisition
The cnslidated entity incurred acquisitin-related csts
$0.3 millin relating t external legal ees and due diligence csts.
The legal ees and due diligence csts have been included in
administrative and general expenses in the cnslidated entity’s
Statement cmprehensive incme.
(ii) Fordham Business Advisors Pty Ltd
on 5 January 2010 the Cmpany acquired 100 per cent the
issued share capital Frdham Business Advisrs Pty Ltd,
which specialises in prviding nancial, investment and related
tax and accunting services r private business wners. The
acquired entity is based in the Melburne CBD.
The acquisitin Frdham is part the cnslidated entity’s
strategy t expand its private wealth business by acquiring
cmplementary businesses specialising in the high net wrth
segment the market.
The acquired business cntributed revenue $10.8 millin andnet prt ater tax $0.2 millin t the cnslidated entity r the
perid rm 5 January 2010 t 30 June 2010. I this acquisitin
had ccurred n 1 July 2009, the revenue and net prt wuld
have been $21.6 millin and $2.0 millin respectively.
The llwing summarises the majr classes cnsideratin
transerred, and the recgnised amunts assets acquired and
liabilities assumed at the acquisitin date:
Consideration transerred
$'000
Cash cnsideratin 16,900
Cash cnsideratin held in escrw 10,022
Cntingent cnsideratin 7,901
Total consideration 34,823
Contingent consideration
The Cmpany has agreed t pay the selling stakehlder
additinal cash cnsideratin i the acquiree exceeds certain
pre-determined grss prt and synergy hurdles. The Cmpany
has included $7.9 millin as cntingent cnsideratin related t
the additinal cnsideratin, which represents its air value at the
acquisitin date. The air value the cntingent cnsideratin
was calculated by applying the incme apprach using the
expected cntingent cnsideratin and a discunt rate 7.2
per cent. Subsequent t the date acquisitin, the balance
cntingent cnsideratin has increased by $0.2 millin,
representing the unwinding the discunt in the perid since
acquisitin.
Identiiable assets acquired and liabilities assumed
$'000
Intangible assets 9,100
Receivables 4,688
Cash and cash equivalents 300
other current assets 290
Prperty, plant & equipment 2,630
Trade and ther payables (424)
Deerred tax liabilities (2,730)
Prvisins (752)
Total identiiable net assets 13,102
All trade receivables are expected t be cllectible at the
acquisitin date.
Goodwill
$'000
Gdwill was recgnised as a result theacquisitin as llws:
Ttal cnsideratin transerred 34,823
Less value identiiable net assets (13,102)
Goodwill 21,721

8/2/2019 2010 Perpetual Annual Report
http://slidepdf.com/reader/full/2010-perpetual-annual-report 138/152136 | PERPETUAL LIMITED AND ITS CoNTRoLLED ENTITIES
The gdwill is attributable mainly t the skills and technical
talent the acquiree’s wrk rce, and the synergies expected t
be achieved rm integrating the cmpany int the cnslidated
entity. Nne the gdwill recgnised is expected t be
deductible r incme tax purpses.
Transactions separate rom the acquisition
The cnslidated entity incurred acquisitin-related csts $0.6
millin relating t external legal ees and due diligence csts.
The legal ees and due diligence csts have been included in
administrative and general expenses in the cnslidated entity’s
Statement cmprehensive incme.
Note 37. Subsequent events
The directrs are nt aware any ther event r circumstance
since the end the nancial perid nt therwise dealt with
in this reprt that has r may signicantly aect the peratins
the cnslidated entity, the results thse peratins rthe state aairs the cnslidated entity in subsequent
nancial years.
Note 38. Remuneration details provided as part
o the inancial report
The llwing disclsures required under AASB 124 are required
t be included in the Financial Reprt:
▪ Para 16 ‘Ttal Cmpensatin Key Management Persnnel’
▪ Para 25.7.3 ‘optins and Rights hldings’
▪ Para 25.7.4 ‘Equity Hldings and Transactins’
▪ Para 25.9 ‘Disclsure other Transactins’.
Total compensation o key management personnel
Consolidated
2010 2009
$'000 $'000
Shrt-Term 8,309,185 6,559,201
Pst-Emplyment 336,371 397,882
Terminatin beneits 742,219 585,000
Share-Based (444,168) 1,014,888
Total 8,943,607 8,556,971
Negative balances are a result adjustments made in the year t
refect the mst current expectatins vesting LTI grants with
nn-market cnditins hurdles.
Related party disclosures
Executives have nt entered int material cntracts with theCmpany r a member the cnslidated entity since the end
the previus nancial year and there were n material cntracts
invlving KMP’s interests existing at year end.

8/2/2019 2010 Perpetual Annual Report
http://slidepdf.com/reader/full/2010-perpetual-annual-report 139/152PERPETUAL LIMITED AND ITS CoNTRoLLED ENTITIES | 137
Option holdings o Executive Director and group executives
Name Grant date Exercise
periodExercise
price
$
Held at1 July 2009
Movement during the yearHeld at 30June 2010
Vested andexercisableat 30 June
2010
Fair valueper option atgrant date1
Proceedsreceived on
exerciseGranted Foreited Exercised
No. o options No. o options No. o options No. o options $ $Managing Director
D Deverall2 optins granted prir t 1 July 20083 295,508 - 28,144 - 267,364 978 - -
1 Jul 081 Jul 11 -1 Jul 14
42.73 57,390 - - - 57,390 - 8.97 -
29 Jun 091 Jul 12 -29 Jun 15
28.34 47,585 - - - 47,585 - 9.58 -
3 Jul 091 Jul 12 -29 Jun 15
28.34 - 5,911 - - 5,911 - 9.58 -
Aggregate value $56,627 $1,599,986 -
Departed Group Executives
E Gonzalez 20 Jan 0930 Jun 13 -20 Jan 15
31.42 182,215 - 182,215 - - - 6.60 -
Aggregate value - $5,725,195 - -
J Nesbitt 9 Jun 09
30 Jun 12 -
30 Jun 14 28.34 58,939 - 58,939 - - - 9.06 -
Aggregate value - $1,670,331 -
E Wang 31 Mar 0831 Mar 11 -31 Mar 13
52.71 75,301 - 75,301 - - - 9.96 -
Aggregate value - $3,969,116 - -
optins granted t the Managing Directr and grup executives are granted rm the Executive optin Plan. R Brandweiner, R Burrws, C Dyle, C Green, I Hlyman,R MacIntyre, M Miller, M Pancin, P Ryan, S Singh and J Stewart d nt hld ptins ver Perpetual shares.
1 Equity instruments issued have been valued by PricewaterhuseCpers (PwC) using a Binmial optin Pricing mdel at grant date.2 Apprval r the issue ptins t D Deverall was btained under ASX Listing Rule 10.14 at Perpetual’s AGMs held n 19 octber 2004, 17 octber 2006,
30 octber 2007, 28 octber 2008 and 22 octber 2009.3 These ptins were granted n 19 octber 2004 (978), 1 July 2005 (28,144), 1 July 2006 (29,950) and 1 July 2007 (236,436). on 23 June 2010, the cmpany
annunced that Managing Directr, David Deverall, had given ntice his resignatin. As a result, n lng term incentives, including the ptins utstanding as at
30 June 2010, will vest as a result Mr Deverall’s resignatin and all unvested ptins will be reited n ceasing emplyment. The ptins utstanding as at30 June 2010 have a carrying value $Nil.
4 Percentage ttal remuneratin received as ptins r the Managing Directr and Grup Executives are: D Deverall (0%), E Gnzalez (0%), J Nesbitt (0%) and E Wang (0%).
Name Grant date Exercise
periodExercise
price
$
Held at1 July 2008
Movement during the yearHeld at 30June 2009
Vested andexercisableat 30 June
2009
Fair valueper option atgrant date1
Proceedsreceived on
exerciseGranted Foreited Exercised
No. o options No. o options No. o options No. o options $ $
Managing Director
D Deverall2 optins granted prir t 1 July 20073 65,912 - 6,840 - 59,072 978 - -
1 Jul 0730 Jun 10 -1 Jul 13
79.17 134,625 - - - 134,625 - 11.92 -
1 Jul 0730 Jun 12 -1 Jul 13
79.17 67,313 - - - 67,313 - 11.92 -
1 Jul 071 Jul 10 -1 Jul 17
79.17 34,498 - - - 34,498 - 11.92 -
1 Jul 081 Jul 11 -1 Jul 14
42.73 - 57,390 - - 57,390 - 8.97 -
29 Jun 09 1 Jul 12 -29 Jun 19
28.34 - 47,585 - - 47,585 - 9.58 -
Aggregate value $970,653 $322,027 -
Group Executives
E Gonzalez optins granted prir t 1 July 20074 33,334 - - 33,334 - - - -
20 Jan 0930 Jun 13 -20 Jan 15
31.42 - 182,215 - - 182,215 - 6.60 -
Aggregate value $1,202,619 - $409,342 $1,082,022
J Nesbitt 9 Jun 0930 Jun 12 -9 Jun 19
28.34 - 58,939 - - 58,939 - 9.06 -
Aggregate value $533,987 - - -
E Wang 31 Mar 0831 Mar 11 -31 Mar 13
52.71 75,301 - - - 75,301 - 9.96 -
Aggregate value - - - -
optins granted t the Managing Directr and grup executives are granted rm the Executive optin Plan. R Brandweiner, C Dyle, C Green, I Hlyman, M Pancin,and J Stewart d nt hld ptins ver Perpetual shares.1 Equity instruments issued have been valued by PricewaterhuseCpers using a Binmial optin Pricing mdel at grant date.2 Apprval r the issue ptins t D Deverall was btained under ASX Listing Rule 10.14 at Perpetual’s AGMs held n 19 octber 2004, 17 octber 2006,
30 octber 2007 and 28 octber 2008.3 These ptins were granted n 1 July 2004 (6,840; 100% reited in the current year), 19 octber 2004 (978), 1 July 2005 (28,144) and 1 July 2006 (29,950).4 These ptins were granted n 28 octber 2002 (33,334).

8/2/2019 2010 Perpetual Annual Report
http://slidepdf.com/reader/full/2010-perpetual-annual-report 140/152138 | PERPETUAL LIMITED AND ITS CoNTRoLLED ENTITIES
Note 38. Remuneration details provided as part o the inancial report (continued)
Unvested share holdings o Executive Director, group and other executives
Name Grant date Issue price Vesting dateHeld at
1 July 2009
Movement during the yearHeld at
30 June 2010
Fair value pershare ($) TSR
hurdle
Fair value pershare ($) non-
TSR hurdleGranted Foreited Vested
No. o shares No. o shares No. o shares
Executive Director
D Deverall1 Shares granted prir t 1 July 20082 58,532 - 7,036 - 51,496
1 July 2008 42.73 1 July 2011 11,993 - - - 11,993 38.97 50.80
29 June 2009 28.34 29 June 2012 18,083 - - - 18,083 21.30 28.01
Aggregate value - $399,997 -
Group Executives
R Brandweiner Shares granted prir t 1 July 20083 2748 - 1,389 - 1,359
1 octber 2008 48.63 1 octber 2011 4,112 - - - 4,112 38.97 50.80
1 octber 2009 38.15 1 octber 2012 - 7,208 - - 7,208 29.02 37.93
Aggregate value $274,985 $96,582 -
R Burrows Shares granted prir t 1 July 20084 11,383 - - - 11,383
1 octber 2008 48.63 1 octber 2011 12,338 - - - 12,338 38.97 50.80
1 octber 2009 38.15 1 octber 2012 - 15,727 - - 15,727 29.02 37.93
Aggregate value $599,985 - -
C Doyle Shares granted prir t 1 July 20085 25,531 - - - 25,531
1 octber 2008 48.63 1 octber 2011 7,197 - - - 7,197 38.97 50.80
1 octber 2009 38.15 1 octber 2012 - 9,174 - - 9,174 29.02 37.93
Aggregate value $349,988 - -
C Green Shares granted prir t 1 July 20086 5,031 - - 2,740 2,291
1 octber 2008 48.63 1 octber 2011 4,112 - - - 4,112 38.97 50.80
1 octber 2009 38.15 1 octber 2012 - 6,553 - - 6,553 29.02 37.93
Aggregate value $249,997 - $199,938
I Holyman Shares granted prir t 1 July 20087 16,464 - 4,472 - 11,992
1 octber 2008 48.63 1 octber 2011 9,253 - - - 9,253 38.97 50.80
1 octber 2009 38.15 1 octber 2012 - 11,795 - - 11,795 29.02 37.93
Aggregate value $449,979 $300,026 -
M Miller Shares granted prir t 1 July 20088 3,308 - 1,677 - 1,631
1 octber 2008 48.63 1 octber 2011 2,467 - - - 2,467 38.97 50.80
1 octber 2009 38.15 1 octber 2012 - 8,519 - - 8,519 29.02 37.93
Aggregate value $325,000 $121,348 -
M Pancino Shares granted prir t 1 July 20089
4,159 - 1,865 - 2,294
1 octber 2008 48.63 1 octber 2011 5,140 - - - 5,140 38.97 50.80
1 octber 2009 38.15 1 octber 2012 - 6,553 - - 6,553 29.02 37.93
Aggregate value $249,997 $134,951 -
J Stewart Shares granted prir t 1 July 200810 584 - - - 584
1 octber 2008 48.63 1 octber 2011 3,084 - - - 3,084 38.97 50.80
1 octber 2009 38.15 1 octber 2012 - 3,931 - - 3,931 29.02 37.93
Aggregate value $149,968 - -
P Ryan Shares granted prir t 1 July 200811 2,946 - 1,451 - 1,495
1 octber 2008 48.63 1 octber 2011 2,287 - - - 2,287 38.97 50.80
1 octber 2009 38.15 1 octber 2012 - 3,538 - - 3,538 29.02 37.93
Aggregate value $134,975 $104,994 -

8/2/2019 2010 Perpetual Annual Report
http://slidepdf.com/reader/full/2010-perpetual-annual-report 141/152PERPETUAL LIMITED AND ITS CoNTRoLLED ENTITIES | 139
Name Grant date Issue price Vesting dateHeld at
1 July 2009
Movement during the yearHeld at
30 June 2010
Fair value pershare ($) TSR
hurdle
Fair value pershare ($) non-
TSR hurdleGranted Foreited Vested
No. o shares No. o shares No. o shares
S Singh Shares granted prir t 1 July 200812 1,931 - 566 - 1,365
1 octber 2008 48.63 1 octber 2011 2,261 - - - 2,261 38.97 50.80
1 octber 2009 38.15 1 octber 2012 - 3,538 - - 3,538 29.02 37.93
Aggregate value $134,975 $40,956 -
R MacIntyre Shares granted prir t 1 July 200813 9,498 - 2.257 - 7,241
1 octber 2008 48.63 1 octber 2011 1,028 - - - 1,028 38.97 50.80
1 octber 2009 38.15 1 octber 2012 - 2,096 - - 2,096 29.02 37.93
Aggregate value $79,962 $158,700 -
Departed Executives
E Gonzalez Shares granted prir t 1 July 200814 26,622 - 26,622 - -
1 octber 2008 48.63 1 octber 2011 16,450 - 16,450 - - 38.97 50.80
20 January 2009 31.42 30 June 2013 39,783 - 39,783 - - N/A 31.42
Aggregate value - $3,949,872 -
J Nesbitt Shares granted prir t 1 July 200815 23,004 - 23,004 - -
1 octber 2008 48.63 1 octber 2011 16,450 - 16,450 - - 38.97 50.80
9 June 2009 29.74 30 June 2012 20,174 - 20,174 - - N/A 29.74
1 octber 2009 38.15 1 octber 2012 - 20,696 20,696 - - 29.02 37.93
Aggregate value $799,967 $3,849,818 -
E Wang Shares granted prir t 1 July 200816 21,832 - 21,832 - -
1 octber 2008 48.63 1 octber 2011 6,169 - 6,169 - - 38.97 50.80
Aggregate value - $1,595,883 -
1 Apprval r the issue shares t David Deverall was btained under ASX Listing Rule 10.14 at Perpetual’s AGM held n 19 octber 2004, 17 octber 2006,30 octber 2007, 28 octber 2008 and 22 octber 2009.
2 These shares were granted n 1 July 2005 (7,036; 100% reited in the current year), 1 July 2006 (7,130) and 1 July 2007 (44,366).
3 These shares were granted n 30 September 2005 (745; 100% reited in the current year), 2 octber 2006 (644; 100% reited in the current year) and1 octber 2007 (1,359).
4 These shares were granted n 31 March 2008 (11,383).
5 These shares were granted n 4 December 2006 (1,645), 1 octber 2010 (4,759) and 20 February 2008 (19,127).
6 These shares were granted n 1 octber 2007 (2,291) and 17 July 2006 (2,740; 100% vested in the current year).
7 These shares were granted n 30 September 2005 (4,472; 100% reited in the current year), 2 octber 2006 (5,873) and 1 octber 2007 (6,119).
8 These shares were granted n 30 September 2005 (641; 100% reited in the current year), 2 octber 2006 (1,036; 100% reited in the current year) and
1 octber 2007 (1,631).
9 These shares were granted n 14 August 2006 (255), 2 octber 2006 (1,865; 100% reited in the current year) and 1 octber 2007 (2,039).
10 These shares were granted n 10 September 2007 (584).
11 These shares were granted n 2 octber 2006 (1,451; 100% reited in the current year) and 1 octber 2007 (1,495).
12 These shares were granted n 3 July 2006 (139), 2 octber 2006 (566; 100% reited in the current year) and 1 octber 2007 (1,226).
13 These shares were granted n 30 September 2005 (876: 100% reited in the current year), 2 octber 2006 (1,381; 100% reited in the current year),1 octber 2007 (1,359) and 3 December 2007 (5,882).
14 These shares were granted n 30 September 2005 (7,453; 100% reited in the current year), 2 octber 2006 (8,291; 100% reited in the current year) and1 octber 2007 (10,878; 100% reited in the current year).
15 These shares were granted n 30 September 2005 (5,217; 100% reited in the current year), 2 octber 2006 (6,909; 100% reited in the current year) and
1 octber 2007 (10,878; 100% reited in the current year).
16 These shares were granted n 30 September 2005 (1,729; 100% reited in the current year), 2 octber 2006 (1,796; 100% reited in the current year),
1 octber 2007 (4,079; 100% reited in the current year) and 31 March 2008 (14,228; 100% reited in the current year).
Grants perrmance shares ater 30 June 2003 cntain 50% the shares with a perrmance hurdle linked t TSR and 50% the shares granted with a perrmancehurdle linked t EPS. Where applicable, the air value shares with a TSR perrmance hurdle are disclsed. The air value TSR-linked shares is calculated by PwCusing valuatin techniques which take int accunt the prbability vesting as refected in the air value at grant.
Unvested share holdings o Executive Director, group and other executives (continued)

8/2/2019 2010 Perpetual Annual Report
http://slidepdf.com/reader/full/2010-perpetual-annual-report 142/152140 | PERPETUAL LIMITED AND ITS CoNTRoLLED ENTITIES
Note 38. Remuneration details provided as part o the inancial report (continued)
Unvested share holdings o Managing Director, group and other executives (continued)
Name Grant date Issue price Vesting dateHeld at
1 July 2008
Movement during the yearHeld at
30 June 2009
Fair value pershare ($) TSR
hurdle
Fair valueper share ($)
non-TSR hurdleGranted Foreited Vested
No. o shares No. o shares No. o shares
Managing Director
D Deverall1 Shares granted prir t 1 July 20072 16,121 - 1,955 - 14,166
1 July 2007 79.17 1 July 2010 31,735 - - - 31,735 57.22 80.08
1 July 2007 79.17 30 June 2012 12,631 - - - 12,631 N/A 73.76
1 July 2008 42.73 1 July 2011 - 11,993 - - 11,993 38.97 50.80
29 June 2009 28.34 1 July 2012 - 18,083 - - 18,083 21.30 28.01
Aggregate value $1,024,933 $92,041 -
Group Executives
R Brandweiner Shares granted prir t 1 July 20073 1,500 - 111 - 1,389
1 octber 2007 73.54 1 octber 2010 1,359 - - - 1,359 57.22 80.08
1 octber 2008 48.63 1 octber 2011 - 4,112 - - 4,112 38.97 50.80
Aggregate value $199,967 $5,513 -
R Burrows 31 March 2008 52.71 31 March 2011 11,383 - - - 11,383 57.22 52.71
1 octber 2008 48.63 1 octber 2011 - 12,338 - - 12,338 38.97 50.80
Aggregate value $599,997 - -
C Doyle 4 December 2006 72.92 4 December 2009 1,645 - - - 1,645 52.13 72.92
1 octber 2007 73.54 1 octber 2010 4,759 - - - 4,759 57.22 80.08
20 February 2008 52.28 1 January 2011 19,127 - - - 19,127 N/A 52.28
1 octber 2008 48.63 1 octber 2011 - 7,197 - - 7,197 38.97 50.80
Aggregate value $349,990 - -
E Gonzalez Shares granted prir t 1 July 20074 15,744 - - - 15,744
1 octber 2007 73.54 1 octber 2010 10,878 - - - 10,878 57.22 80.08
1 octber 2008 48.63 1 octber 2011 - 16,450 - - 16,450 38.97 50.80
20 January 2009 31.42 30 June 2013 - 39,783 - - 39,783 N/A 31.42
Aggregate value $2,049,945 - -
C Green Shares granted prir t 1 July 20075 4,796 - - 2,056 2,740
1 octber 2007 73.54 1 octber 2010 2,291 - - - 2,291 57.22 80.08
1 octber 2008 48.63 1 octber 2011 - 4,112 - - 4,112 38.97 50.80
Aggregate value $199,967 - $150,026
I Holyman Shares granted prir t 1 July 20076 11,162 - 817 - 10,345
1 octber 2007 73.54 1 octber 2010 6,119 - - - 6,119 57.22 80.08
1 octber 2008 48.63 1 octber 2011 - 9,253 - - 9,253 38.97 50.80
Aggregate value $449,973 $40,580 -

8/2/2019 2010 Perpetual Annual Report
http://slidepdf.com/reader/full/2010-perpetual-annual-report 143/152PERPETUAL LIMITED AND ITS CoNTRoLLED ENTITIES | 141
Name Grant date Issue price Vesting dateHeld at
1 July 2008
Movement during the yearHeld at
30 June 2009
Fair value pershare ($) TSR
hurdle
Fair valueper share ($)
non-TSR hurdleGranted Foreited Vested
No. o shares No. o shares No. o shares
J Nesbitt Shares granted prir t 1 July 20077 12,943 - 817 - 12,126
1 octber 2007 73.54 1 octber 2010 10,878 - - - 10,878 57.22 80.08
1 octber 2008 48.63 1 octber 2011 - 16,450 - - 16,450 38.97 50.80
9 June 2009 29.74 30 June 2012 - 20,174 - - 20,174 N/A 29.74
Aggregate value $1,399,938 $40,580 -
M Pancino Shares granted prir t 1 July 20078 2,120 - - - 2,120
1 octber 2007 73.54 1 octber 2010 2,039 - - - 2,039 57.22 80.08
1 octber 2008 48.63 1 octber 2011 - 5,140 - - 5,140 38.97 50.80
Aggregate value $249,958 - -
J Stewart 10 September2007
75.24 10 September2010
584 - - - 584 N/A 75.24
1 octber 2008 48.63 1 octber 2011 - 3,084 - - 3,084 38.97 50.80
Aggregate value $149,975 - -
E Wang Shares granted prir t 1 July 20079 4,006 - 481 - 3,525
1 octber 2007 73.54 1 octber 2010 4,079 - - - 4,079 57.22 80.08
31 March 2008 52.71 31 March 2011 14,228 - - - 14,228 N/A 52.71
1 octber 2008 48.63 1 octber 2011 - 6,169 - - 6,169 38.97 50.80
Aggregate value $299,998 $23,891 -
Departed Group Executive
P Vernon Shares granted prir t 1 July 200710 8,557 - 8,557 - -
1 octber 2007 73.54 1 octber 2010 5,439 - 5,439 - - 57.22 80.08
Aggregate value - $992,953 -
1 Apprval r the issue shares t D Deverall was btained under ASX Listing Rule 10.14 at Perpetual ’s AGM held n 19 octber 2004, 17 octber 2006,30 octber 2007 and 28 octber 2008.
2 These shares were granted n 1 July 2004 (1,710; 100% reited in the current year), 19 octber 2004 (245; 100% reited in the current year), 1 July 2005 (7,036)and 1 July 2006 (7,130).
3 These shares were granted n 1 octber 2004 (111; 100% reited in the current year), 30 September 2005 (745) and 2 octber 2006 (644).4 These shares were granted n 30 September 2005 (7,453) and 2 octber 2006 (8,291).5 These shares were granted n 17 July 2006 (4,796; 43% vested in the current year).
6 These shares were granted n 1 octber 2004 (817; 100% reited in the current year), 30 September 2005 (4,472) and 2 octber 2006 (5,873).7 These shares were granted n 1 octber 2004 (817; 100% reited in the current year), 30 September 2005 (5,217) and 2 octber 2006 (6,909).8 These shares were granted n 14 August 2006 (255) and 2 octber 2006 (1,865).9 These shares were granted n 1 octber 2004 (481; 100% reited in the current year), 30 September 2005 (1,729) and 2 octber 2006 (1,796).10 These shares were granted n 1 octber 2004 (463; 100% reited in the current year), 30 September 2005 (2,981; 100% reited in the current year).
and 2 octber 2006 (5,113; 100% reited in the current year).
Shares granted t the Managing Directr and Grup Executives are granted rm the Executive Share Plan. Grants perrmance shares ater 30 June 2003 cntain50% the shares with a perrmance hurdle linked t TSR and 50% the shares granted with a perrmance hurdle linked t EPS. Where applicable, the air value shares with a TSR perrmance hurdle are disclsed. The air value TSR-linked shares is calculated by PwC using valuatin techniques which take int accunt theprbability vesting as refected in the air value at grant.
Unvested share holdings o Managing Director, group and other executives (continued)

8/2/2019 2010 Perpetual Annual Report
http://slidepdf.com/reader/full/2010-perpetual-annual-report 144/152142 | PERPETUAL LIMITED AND ITS CoNTRoLLED ENTITIES
Note 38. Remuneration details provided as part o the inancial report (continued)
Vested shareholdings o Managing Director, group and other executives
Name
Balance at 1 July 2009 LTI Shares vesting in the per iod Other changes dur ing the year Balance at 30 June 2010*
No. o shares
Managing Director
D Deverall 35,540 - - 35,540
Group Executives
R Brandweiner 402 - - 402
R Burrows - - - -
C Doyle - - - -
C Green 2,056 2,740 - 4,796
I Holyman 2,736 - - 2,736
M Miller 234 - - 234
M Pancino - - - -
J Stewart - - - -
R MacIntyre 16,893 - - 16,893
P Ryan - - - -
S Singh - - - -
Departed Group Executives
E Gonzalez 88,279 - (69,632) 18,647
J Nesbitt 7,417 - - 7,417
E Wang 600 - - 600
*r date departure r Grup Executives wh departed in the year.
other changes during the year represent shares acquired via bnus sacrice, cnversin ptins int shares and dispsal shares. Dispsals during the yearinclude E Gnzalez (69,632).
NameBalance at 1 July 2008 LTI Shares vesting in the per iod Other changes dur ing the year Balance at 30 June 2009*
No. o shares
Managing Director
D Deverall 35,540 - - 35,540
Group Executives
R Brandweiner 402 - - 402
E Gonzalez 69,134 - 19,145 88,279
C Green - 2,056 - 2,056
I Holyman 2,736 - - 2,736
J Nesbitt 7,527 - (110) 7,417
E Wang 600 - - 600
Departed Group Executive
P Vernon 1,580 - - 1,580
*r date departure r Grup Executives wh departed in the year.
other changes during the year represent shares acquired via bnus sacrice, cnversin ptins int shares and dispsal shares. Dispsals during the yearinclude E Gnzalez (14,189) and J Nesbitt (110).

8/2/2019 2010 Perpetual Annual Report
http://slidepdf.com/reader/full/2010-perpetual-annual-report 145/152PERPETUAL LIMITED AND ITS CoNTRoLLED ENTITIES | 143
Remuneration o Non-executive Directors
Directors’ individual shareholdings
Name
Balance at the start o the year,
or or directorsappointed in the year, the dateo appointment
Shares acquired via ee sacrifceduring the year Other changes during the year
Balance at the end o the year
or, or directors who retired in theyear, the date o retirement
Directors
R M Savage 9,380 - 229 9,609
P V Brasher1 - - 1,000 1,000
M J Brooks 5,500 - 253 5,753
P Bullock2 - - 1,000 1,000
E P McClintock 8,485 - 283 8,768
E Proust 3,147 - 98 3,245
P B Scott 2,047 - 93 2,140
P J Twyman 8,772 - (655) 8,107
1 Paul Brasher was appinted as a directr n 1 Nvember 2009.
2 Philip Bullck was appinted as a directr n 1 June 2010.
Prior year directors’ individual shareholdings
Name
Balance at the start o the year,or or directors
appointed in the year, the dateo appointment
Shares acquired via ee sacrifceduring the year1 Other changes during the year
Balance at the end o the yearor, or directors who retired in the
year, the date o retirement
Directors
R M Savage 7,246 2,134 - 9,380
M J Brooks 4,500 - 1,000 5,500
E P McClintock 6,810 1,675 - 8,485
E Proust 2,728 419 - 3,147
P B Scott 1,000 1,047 - 2,047
A Stevens2 1,500 - - 1,500
P J Twyman 5,677 2,095 1,000 8,772
1 Shares acquired r issued ur times thrughut the year.
2 Mr A Stevens jined Perpetual n 24 June 2008 and resigned n 3 February 2009.

8/2/2019 2010 Perpetual Annual Report
http://slidepdf.com/reader/full/2010-perpetual-annual-report 146/152144 | PERPETUAL LIMITED AND ITS CoNTRoLLED ENTITIES
Directors’ Declaration1 In the pinin the directrs Perpetual Limited
(the ‘Cmpany’):
a. the cnslidated nancial statements and ntes, and theRemuneratin reprt in the Directrs’ reprt, set ut n
pages 34 t 59, are in accrdance with the Corporations
Regulations 2001, including:
(i) giving a true and air view the Cnslidated Entity’s
nancial psitin as at 30 June 2010 and its
perrmance, r the nancial year ended n that date;
and
(ii) cmplying with Australian Accunting Standards
(including the Australian Accunting Interpretatins) and
the Corporations Regulations 2001;
b. the nancial reprt als cmplies with InternatinalFinancial Reprting Standards as disclsed in Nte 2(a);
c. there are reasnable grunds t believe that the
Cmpany will be able t pay its debts as and when they
becme due and payable.
2 The directrs have been given the declaratins required by
Sectin 295A the Corporations Regulations 2001 rm the
Chie Executive ocer and the Chie Financial ocer r the
nancial year ended 30 June 2010.
Signed in accrdance with a reslutin the directrs:
Dated at Sydney this 24th day August 2010.
Rbert Savage, AM David Deverall
Directr Directr

8/2/2019 2010 Perpetual Annual Report
http://slidepdf.com/reader/full/2010-perpetual-annual-report 147/152PERPETUAL LIMITED AND ITS CoNTRoLLED ENTITIES | 145
Independent auditor’s report to the members o Perpetual Limited
Report on the inancial report
We have audited the accmpanying nancial reprt the Grup
cmprising Perpetual Limited (the Cmpany) and the entitiesit cntrlled at the year’s end r rm time t time during the
nancial year, which cmprises the balance sheet as at 30 June
2010, and statement cmprehensive incme, statement
changes in equity and statement cash fws r the year ended
n that date, a summary signicant accunting plicies and
ther explanatry ntes 1 t 38 and the directrs’ declaratin.
Directors’ responsibility or the inancial report
The directrs the Cmpany are respnsible r the preparatin
and air presentatin the nancial reprt in accrdance with
Australian Accunting Standards (including the Australian
Accunting Interpretatins) and the Corporations Act 2001. This
respnsibility includes establishing and maintaining internalcntrl relevant t the preparatin and air presentatin the
nancial reprt that is ree rm material misstatement, whether
due t raud r errr; selecting and applying apprpriate
accunting plicies; and making accunting estimates that are
reasnable in the circumstances. In nte 2, the directrs als
state, in accrdance with Australian Accunting Standard AASB
101 Presentation of Financial Statements, that the nancial reprt,
cmprising the nancial statements and ntes, cmplies with
Internatinal Financial Reprting Standards.
Auditor’s responsibility
our respnsibility is t express an pinin n the nancial reprt
based n ur audit. We cnducted ur audit in accrdance with Australian Auditing Standards. These Auditing Standards require
that we cmply with relevant ethical requirements relating t
audit engagements and plan and perrm the audit t btain
reasnable assurance whether the nancial reprt is ree rm
material misstatement.
An audit invlves perrming prcedures t btain audit evidence
abut the amunts and disclsures in the nancial reprt.
The prcedures selected depend n the auditr’s judgement,
including the assessment the risks material misstatement
the nancial reprt, whether due t raud r errr. In making
thse risk assessments, the auditr cnsiders internal cntrl
relevant t the entity’s preparatin and air presentatin thenancial reprt in rder t design audit prcedures that are
apprpriate in the circumstances, but nt r the purpse
expressing an pinin n the eectiveness the entity’s internal
cntrl. An audit als includes evaluating the apprpriateness
accunting plicies used and the reasnableness accunting
estimates made by the directrs, as well as evaluating the verall
presentatin the nancial reprt.
We perrmed the prcedures t assess whether in all material
respects the nancial reprt presents airly, in accrdance with
the Corporations Act 2001 and Australian Accunting Standards
(including the Australian Accunting Interpretatins), a view which
is cnsistent with ur understanding the Grup’s nancialpsitin and its perrmance.
We believe that the audit evidence we have btained is sucient
and apprpriate t prvide a basis r ur audit pinin.
Independence
In cnducting ur audit, we have cmplied with the
independence requirements the Corporations Act 2001.
Auditor’s opinion
In ur pinin:
(a) the nancial reprt the Grup is in accrdance with the
Corporations Act 2001, including:
(i) giving a true and air view the Grup’s nancial psitin
as at 30 June 2010 and its perrmance r the year
ended n that date; and
(ii) cmplying with Australian Accunting Standards
(including the Australian Accunting Interpretatins) and
the Crpratins Regulatins 2001.
(b) the nancial reprt als cmplies with Internatinal Financial
Reprting Standards as disclsed in nte 2.
Report on the remuneration report
We have audited the Remuneratin Reprt included in pages 34
t 59 the directrs’ reprt r the year ended 30 June 2010.
The directrs the cmpany are respnsible r the preparatin
and presentatin the remuneratin reprt in accrdance with
Sectin 300A the Corporations Act 2001. our respnsibility is
t express an pinin n the remuneratin reprt, based n ur
audit cnducted in accrdance with auditing standards.
Auditor’s opinion
In ur pinin, the remuneratin reprt Perpetual Limited r
the year ended 30 June 2010, cmplies with Sectin 300A the
Corporations Act 2001.
KPMG
Andrew Yates
Partner
Sydney
24th August 2010

8/2/2019 2010 Perpetual Annual Report
http://slidepdf.com/reader/full/2010-perpetual-annual-report 148/152146 | PERPETUAL LIMITED AND ITS CoNTRoLLED ENTITIES
2010 Annual General Meeting
The 2010 Annual General Meeting the Cmpany will be
held in the Heritage Ballrm, Level 6, The Westin Sydney,
1 Martin Place, Sydney n Tuesday 26 octber 2010
cmmencing at 10:00 am.
Securities exchange listing
The rdinary shares Perpetual Limited are listed n the
Australian Securities Exchange under the ASX cde PPT, with
Sydney being the hme exchange. Details trading activity are
published in mst daily newspapers.
20 largest shareholders as at 31 July 2010
Number o Percentage o
Name ordinary shares issued capital
Queensland Trustees Pty Limited¹ 2,814,201 6.48%
HSBC Custdy Nminees (Australia) Limited¹ 2,211,749 5.09%
J P Mrgan Nminees Australia Limited¹ 1,583,903 3.65%
Natinal Nminees Limited¹ 1,268,387 2.92%
Australian Fundatin Investment Cmpany Limited 843,726 1.94%
Citicrp Nminees Pty Limited¹ 763,166 1.76%
Perpetual Trustee Cmpany Limited¹ 658,184 1.52%
Miltn Crpratin Limited 646,588 1.49%
RBC CEES Trustee Limited¹ 632,977 1.46%Washingtn H Sul Pattinsn & C Ltd 529,598 1.22%
UBS Wealth Management Australia Nminees Pty Ltd¹ 450,160 1.04%
Bnd Street Custdians Limited¹ 355,428 0.82%
Arg Investments Limited 350,880 0.81%
Cgent Nminees Pty Limited1 328,519 0.76%
ANZ Nminees Limited¹ 311,806 0.72%
Enbeear Pty Ltd 310,678 0.72%
RBC Dexia Investr Services Australia Nminees Pty Ltd¹ 284,366 0.65%
T Eustace 283,950 0.65%
Invia Custdian Pty Limited¹ 264,660 0.61%
Australian United Investment C. Limited 250,000 0.58%Total 15,142,926 34.89%
1 Held in capacity as executr, trustee r agent.
Substantial shareholders
Queensland Trustees Pty Limited is a substantial sharehlder
Perpetual Limited as at 31 July 2010.
Distribution schedule
o holdings
as at 31 July 2010
Number
o holders
Number
o shares
1 - 1,000 shares 23,115 8,483,188
1,001 - 5,000 shares 4,771 9,974,422
5,001 - 10,000 shares 451 3,236,002
10,001 - 100,000 shares 287 6,004,866
100,001 and ver shares 32 15,719,000
Total 28,656 43,417,478
Number sharehlders
with less than a marketable
parcel: 472 4,270
securities exchange and
investor inormation

8/2/2019 2010 Perpetual Annual Report
http://slidepdf.com/reader/full/2010-perpetual-annual-report 149/152PERPETUAL LIMITED AND ITS CoNTRoLLED ENTITIES | 147
Other inormation
Perpetual Limited, incrprated and dmiciled in Australia,
is a publicly listed cmpany limited by shares.
Voting rights
Under the Cmpany’s Cnstitutin, each member present
at a general meeting (whether in persn, by prxy, attrney
r crprate representative) is entitled:
▪ n a shw hands t ne vte; and
▪ n a pll t ne vte r each share held.
I a member is present in persn, any prxy that member
is nt entitled t vte.
Voting by proxy
Vting by prxy allws sharehlders t express their views n
the directin and management the ecnmic entity withut
attending a meeting in persn.
Sharehlders wh are unable t attend the 2010 Annual General
Meeting are encuraged t cmplete and return the prxy rm
that accmpanies the ntice meeting enclsed with this reprt.
On-market buy back
There is n current n-market buy back.
Final dividend
The nal dividend 105 cents per share will be paid n
28 September 2010 t sharehlders entitled t receive dividends
and registered n 7 September 2010 being the recrd date.
Enquiries
I yu have any questins abut yur sharehlding r matters
such as dividend payments, tax le numbers r change
address yu are invited t cntact the Cmpany’s share registry
ce belw, r visit their website at www.linkmarketservices.
cm.au r email [email protected]
Link Market Services Limited
Level 12
680 Gerge Street
Sydney NSW 2000
Australia
Lcked Bag A14
Sydney Suth NSW 1235
Australia
Perpetual Sharehlder Inrmatin Line
1300 732 806 r + 61 2 8280 7620
Fax + 61 2 9287 0303
Any ther enquiries which yu may have abut the Cmpany,
can be directed t the Cmpany’s registered ce r visit the
Cmpany’s website.
Principal registered oice
Level 12
123 Pitt Street
Sydney NSW 2000
Australia
Phne +61 2 9229 9000
Fax +61 2 8256 1461
Company Secretary
Janne Hawkins
www.perpetual.cm.au

8/2/2019 2010 Perpetual Annual Report
http://slidepdf.com/reader/full/2010-perpetual-annual-report 150/152
contact a s ri ri of
Shareholder enquiriesI yu have any questins abut yur sharehlding
r matters such as dividend payments, tax le
numbers r change address please cntact
the Cmpany’s share registry ce r visit their
website www.linkmarketservices.cm.au r
email [email protected]
Link Market Services Limited
Level 12
680 Gerge StreetSydney NSW 2000
Australia
Lcked Bag A14
Sydney Suth NSW 1235
Australia
Perpetual Shareholder Inormation Line
Phne 1300 732 806 r +61 2 8280 7620
Fax +61 2 9287 0303
Fr any ther enquiries abut the Cmpany
please cntact the Cmpany’s registered cer visit ur website.
Principal registered oiceLevel 12
123 Pitt Street
Sydney NSW 2000
Australia
Phne +61 2 9229 9000
Fax +61 2 8256 1461
www.perpetual.cm.au
ABN 86 000 431 827
Perpetual’s 2010 Annual Reprt is printed n Splendrgel (cver and review)and Precisin (nancials) supplied by Spicers Paper. Splendrgel is an FSCMixed Surces Certied paper, which ensures that all pulp is derived rm
well-managed rests and cntrlled surces. It is elemental chlrine ree andis manuactured by an ISo 14001 certied mill. Precisin is PEFC Certied andmade rm elemental chlrine ree bleached pulp surced rm sustainablymanaged rests and nn-cntrversial surces. It is manuactured by an
ISo 14001 certied mill using renewable energy surces.
148

8/2/2019 2010 Perpetual Annual Report
http://slidepdf.com/reader/full/2010-perpetual-annual-report 151/152

8/2/2019 2010 Perpetual Annual Report
http://slidepdf.com/reader/full/2010-perpetual-annual-report 152/152
2 8 0 6 9 _L K A R E P 2 _ 0 9 1 0