2010 annual report - smith & nephew2010 annual report enabling people to live healthier, more...
TRANSCRIPT

2010 Annual Report
Enabling people to live healthier, more active lives.
Smith & Nephew plc15 Adam Street London WC2N 6LA United Kingdom
T +44 (0) 20 7401 7646 F +44 (0) 20 7960 2350
www.smith-nephew.com
2010 Annual Report
SN_AR2010_Cover_4.0.indd 1 23/02/2011 10:02
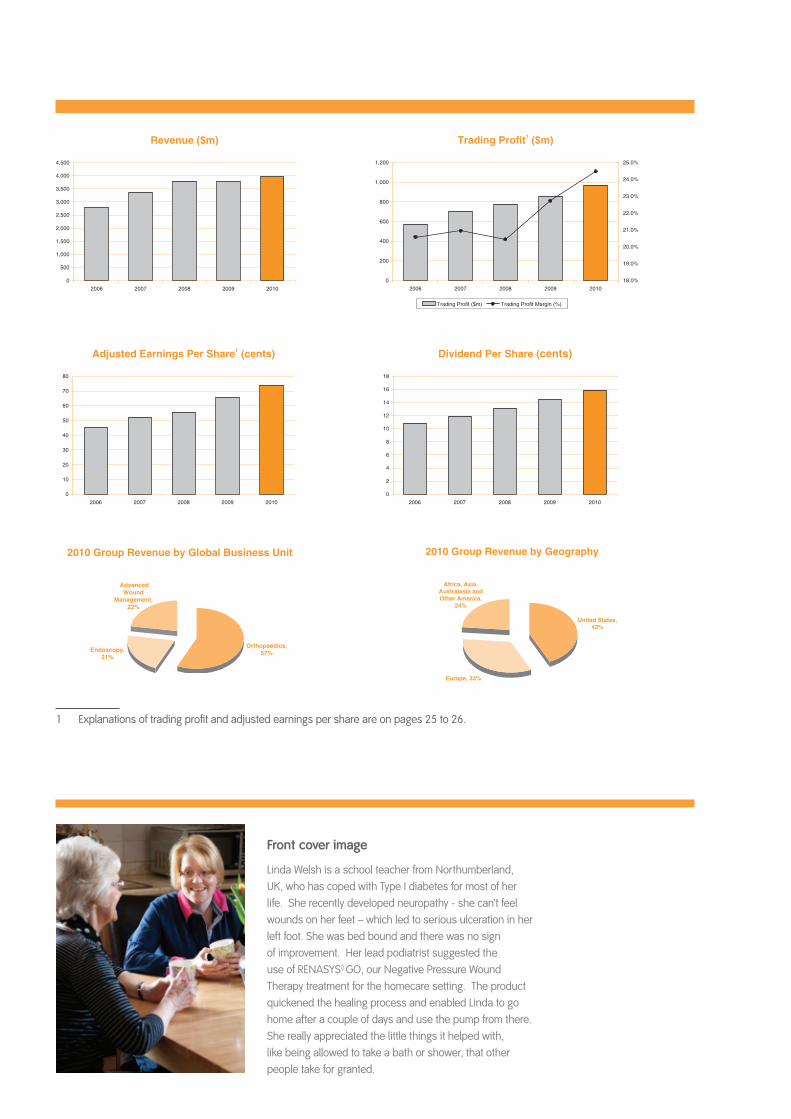
Revenue ($m)
0
500
1,000
1,500
2,000
2,500
3,000
3,500
4,000
4,500
2006 2007 2008 2009 2010
Trading Profit ($m) Trading Profit Margin (%)
Trading Profit1 ($m)
0
200
400
600
800
1,000
1,200 25.0%
18.0%
19.0%
20.0%
21.0%
22.0%
23.0%
24.0%
2006 2007 2008 2009 2010
Adjusted Earnings Per Share1 (cents)
0
10
20
30
40
50
60
70
80
2006 2007 2008 2009 2010
Dividend Per Share (cents)
0
2
4
6
8
10
12
14
16
18
2006 2007 2008 2009 2010
2010 Group Revenue by Global Business Unit
Orthopaedics,57%Endoscopy,
21%
AdvancedWound
Management,22%
2010 Group Revenue by Geography
United States,43%
Europe, 33%
Africa, Asia,Australasia andOther America,
24%
1 Explanations of trading profit and adjusted earnings per share are on pages 25 to 26.

INTRODUCTION AND FINANCIAL SUMMARYThe Smith & Nephew Group (the “Group”) is a global medical devices business operating in the markets for orthopaedic reconstruction andtrauma, endoscopy (which includes arthroscopic procedures referred to as sports medicine) and advanced wound management, withrevenue of approximately $4 billion in 2010. Smith & Nephew plc (the “Company”) is the parent company of the Group. It is an English publiclimited company with its shares listed on the premium list of the UK Listing Authority and traded on the London Stock Exchange. Shares arealso traded on the New York Stock Exchange in the form of American Depositary Shares (“ADSs”).
This is the Annual Report of Smith & Nephew plc for the year ended 31 December 2010. It comprises, in a single document, the AnnualReport and Accounts of the company in accordance with UK requirements and the Annual Report on Form 20-F in accordance with theregulations of the United States Securities and Exchange Commission (“SEC”).
Smith & Nephew’s corporate website, www.smith-nephew.com, gives additional information on the Group, including an electronic version ofthis Annual Report. Information made available on this website, or other websites mentioned in this Annual Report, are not, and should notbe regarded as being, part of or incorporated into this Annual Report.
For the convenience of the reader, a Glossary of technical and financial terms used in this document is included on page 152. The productnames referred to in this document are identified by use of capital letters and are trademarks owned by or licensed to members of theGroup.
Financial Summary
Financial Highlights (i) (iii)2010
$ million2009
$ million2008
$ million
Revenue 3,962 3,772 3,801Underlying growth in revenue (%) 4% 2% 6%Trading profit 969 857 776Underlying growth in trading profit (%) 11% 15% 6%Trading profit margin (%) 24.5% 22.7% 20.4%Operating profit 920 723 630Attributable profit for the year 615 472 377Adjusted attributable profit 654 580 493Basic earnings per Ordinary Share 69.3¢ 53.4¢ 42.6¢EPSA 73.6¢ 65.6¢ 55.6¢Growth in EPSA (%) 12% 18% 7%Dividends per Ordinary Share (ii) 15.82¢ 14.39¢ 13.08¢Cash generated from operations 1,111 1,030 815Trading cash flow 825 771 612Trading profit to cash conversion (%) 85% 90% 79%
(i) Items shown in italics are non-GAAP measures. Reconciliations to reported figures are on pages 24 to 27.
(ii) The Board has proposed a final dividend of 9.82 US cents per share which together with the first interim dividend of 6.00 US cents makes a totalfor 2010 of 15.82 US cents. The final dividend is expected to be paid, subject to shareholder approval, on 19 May 2011 to shareholders on theRegister of Members at the close of business on 3 May 2011.
(iii) All items are $ million unless otherwise indicated.
Key Performance IndicatorsThe Directors’ Report includes a number of measures that management use as key performance indicators including those financialperformance indicators set out in the Financial Summary above. A discussion of the reasons for, calculation and limitations of the keyfinancial performance indicators is set out below.
The Group is focused on continued delivery of sustainable profitable growth through four strategic pillars – ‘Customer led’, ‘Efficient’,‘Investing for growth’ and ‘Aligned’ – as explained on page 4 of this document.
From these four strategic pillars, a scorecard has been developed which identifies the specific functional strategic imperatives for each partof the Group. The performance against the scorecard is evaluated against a series of financial and non-financial indicators and measures.
2010 Annual Report i

The principal key financial performance indicators used in the scorecard, which measure performance against the Group’s strategic pillars,are:
(i) Underlying growth in revenue
Underlying growth in revenue is used to compare the revenue in a given year to the previous year on a like-for-like basis. This is achievedby adjusting for the impact of sales of products acquired in material business combinations and for movements in exchange rates.Underlying growth in revenue is not presented in the accounts prepared in accordance with International Financial Reporting Standards(“IFRS”) and is therefore not a Generally Accepted Accounting Principle (a “non-GAAP” measure). An explanation of how this non-GAAPmeasure is calculated is presented in the “Business Overview” on page 24.
The Group believes that the tabular presentation and reconciliation of reported revenue growth to underlying revenue growth assistsinvestors in their assessment of the Group’s performance in each business segment and for the Group as a whole.
Underlying growth in revenue is considered by the Group to be an important measure of performance in terms of local functional currencysince it excludes those items considered to be outside the influence of local management. The Group’s management uses this non-GAAPmeasure in its internal financial reporting, budgeting and planning to assess performance on both a business segment and a consolidatedGroup basis. Revenue growth at constant currency is important in measuring business performance compared to competitors andcompared to the growth of the market itself.
The Group considers that revenue from sales of products acquired in material business combinations results in a step-up in growth inrevenue in the year of acquisition that cannot be wholly attributed to local management’s efforts with respect to the business in the year ofacquisition. Depending on the timing of the acquisition, there will usually be a further step change in the following year. A measure of growthexcluding the effects of business combinations also allows senior management to evaluate the performance and relative impact of growthfrom the existing business and growth from acquisitions. The process of making business acquisitions is directed, approved and fundedfrom the Group corporate centre in line with strategic objectives.
The material limitation of the underlying growth in revenue measure is that it excludes certain factors, described above, which ultimatelyhave a significant impact on total revenues. The Group compensates for this limitation by taking into account relative movements inexchange rates in its investment, strategic planning and resource allocation. In addition, as the evaluation and assessment of businessacquisitions is not within the control of local management, performance of acquisitions is monitored centrally until the business is integrated.The Group’s management considers that the non-GAAP measure of underlying growth in revenue and the GAAP measure of growth inrevenue are complementary measures, neither of which management uses exclusively.
(ii) Trading profit and trading profit margin
Growth in trading profit and trading profit margin (trading profit expressed as a percentage of revenue) are measures which present thegrowth trend in the long-term profitability of the Group excluding the impact of specific transactions or events that management considersaffect the Group’s short-term profitability. The Group presents these measures to assist investors in their understanding of trends. TheGroup’s internal financial reporting (budgets, monthly reporting, forecasts, long-term planning and incentive plans), focuses primarily onprofit and earnings before these items. Trading profit and trading profit margin are not recognised measures under IFRS and are thereforenon-GAAP financial measures.
The Group has identified the following items, where material, as those to be adjusted and identified separately: acquisition and disposalrelated items including amortisation of acquisition intangible assets and impairments; significant restructuring events; gains and lossesarising from legal disputes and uninsured losses; and taxation thereon. An explanation of how trading profit is calculated is presented in“Business Overview” on page 25.
The material limitation of these measures is that they exclude significant income and costs that have a direct impact on current and prioryears’ profit attributable to shareholders. They do not, therefore, measure the overall performance of the Group presented by the GAAPmeasures of earnings per share and operating profit. The Group considers that no single measure enables it to assess overall performanceand therefore it compensates for the limitation of the adjusted earnings per share and trading profit measures by considering them inconjunction with their GAAP equivalents. The gains or losses which are identified separately arise from irregular events or transactions. Suchevents or transactions are authorised centrally and require a strategic assessment which includes consideration of financial returns andgeneration of shareholder value. Amortisation of acquisition intangibles will occur each year, whilst other excluded items arise irregularlydepending on the events that give rise to such items.
ii 2010 Annual Report

(iii) Adjusted earnings per ordinary share
Growth in adjusted earnings per ordinary shares (“EPSA”) is another measure which presents the trend growth in the long-term profitabilityof the Group. EPSA is not a recognised measure under IFRS and is therefore a non-GAAP financial measure.
EPSA excludes the same impact of specific transactions or events that management considers affect the Group’s short-term profitability asset out and discussed in the section on trading profit above, including the material limitations of such measures. A reconciliation of adjustedattributable profit, which represents the numerator used in the EPSA calculation, to attributable profit is presented in “Business Overview” onpage 26.
(iv) Trading cash flow and trading profit to cash conversion ratio
Growth in trading cash flow and improvement in the trading profit to cash conversion ratio are measures which present the trend growth inthe long-term cash generation of the Group excluding the impact of specific transactions or events that management considers affect theGroup’s short-term performance.
Trading cash flow is defined as cash generated from operations less net capital expenditure but before acquisition related cash flows,restructuring and rationalisation cash flows and cash flows arising from legal disputes and uninsured losses. Trading profit to cashconversion ratio is trading cash flow expressed as a percentage of trading profit. The nature and material limitations of these adjusting itemsare discussed in the sections above.
The Group presents these measures to assist investors in their understanding of trends. The Group’s internal financial reporting (budgets,monthly reporting, forecasts, long-term planning and incentive plans) focuses on cash generation before these items. Trading cash flow andtrading profit to cash conversion ratio are not recognised measures under IFRS and are therefore considered non-GAAP financial measures.A reconciliation of trading cash flow to cash generated from operations is presented in “Business Overview” on page 27.
The material limitation of this measure is that it could exclude significant cash flows that have had a direct impact on the current and prioryears’ financial performance of the Group. It does not, therefore, measure the financial performance of the Group presented by the GAAPmeasure of cash generated from operations. The Group considers that no single measure enables it to assess financial performance andtherefore it compensates for the limitation of the trading cash flow measure by considering it in conjunction with the GAAP equivalents. Cashflows excluded relate to irregular events or transactions including acquisition related costs, restructuring and rationalisation costs and cashflows arising from legal disputes and uninsured losses.
PresentationThe Group’s fiscal year end is 31 December. References in this Annual Report to a particular year are to the fiscal year unless otherwiseindicated. Except as the context otherwise requires, “Ordinary Share” or “share” refer to the Ordinary Shares of Smith & Nephew plc of 20US cents each.
The results of the Group, as reported in US Dollars, are affected by movements in exchange rates between US Dollars and other currencies.The Group applied the average exchange rates prevailing during the year to translate the results of companies with functional currency otherthan US Dollars. The currencies which most influenced these translations in the years covered by this report were Sterling, Swiss Franc andthe Euro.
The Group Accounts of Smith & Nephew in this Annual Report are presented in US Dollars. Solely for the convenience of the reader, certainparts of this Annual Report contain translations of amounts in US Dollars into Sterling at specified rates. These translations should not beconstrued as representations that the US Dollar amounts actually represent such Sterling amounts or could be converted into Sterling at therate indicated. Except as where stated otherwise, the translation of US Dollars and cents to Sterling and pence appearing in this AnnualReport has been made at the Bank of England exchange rate on the date indicated. On 23 February 2011, the Bank of England rate wasUS$1.6238 per £1.
The Accounts of the Group in this Annual Report are presented in millions (“m”) unless otherwise indicated.
2010 Annual Report iii

Special Note Regarding Forward-Looking StatementsThe Group’s reports filed with, or furnished to, the US Securities and Exchange Commission (“SEC”), including this document and writteninformation released, or oral statements made, to the public in the future by or on behalf of the Group, contain “forward-looking statements”within the meaning of the US Private Securities Litigation Reform Act of 1995, that may or may not prove accurate. In particular, statementsregarding expected revenue growth and trading margins discussed under “Outlook and Trend Information”, market trends and our productpipeline are forward-looking statements. Phrases such as “aim”, “plan”, “intend”, “anticipate”, “well-placed”, “believe”, “estimate”, “expect”,“target”, “consider” and similar expressions are generally intended to identify forward-looking statements. Forward-looking statementsinvolve known and unknown risks, uncertainties and other important factors that could cause actual results, to differ materially from what isexpressed or implied by the statements. For Smith & Nephew, these factors include: economic and financial conditions in the markets weserve, especially those affecting health care providers, payors and customers; price levels for established and innovative medical devices;developments in medical technology; regulatory approvals, reimbursement decisions or other government actions; product defects orrecalls; litigation relating to patent or other claims; legal compliance risks and related investigative, remedial or enforcement actions;strategic actions, including acquisitions and dispositions and our success in integrating acquired businesses; and numerous other mattersthat affect us or our markets, including those of a political, economic, business or competitive nature. Specific risks faced by the Group aredescribed under “Risk Factors” on page 18 of this Annual Report. Any forward-looking statement is based on information available toSmith & Nephew as of the date of the statement. All written or oral forward-looking statements attributable to Smith & Nephew are qualifiedby this caution. Smith & Nephew does not undertake any obligation to update or revise any forward-looking statement to reflect any changein circumstances or in Smith & Nephew’s expectations.
Market DataMarket data and market share estimates throughout this report are derived from a variety of sources including publicly available competitors’information, internal management information and independent market research reports.
Documents on DisplayIt is possible to read and copy documents referred to in this Annual Report at the Registered Office of the Company. Documents referred toin this Annual Report that have been filed with the Securities and Exchange Commission in the US may be read and copied at the SEC’spublic reference room located at 450 Fifth Street, NW, Washington DC 20549. Please call the SEC at 1-800-SEC-0330 for further informationon the public reference rooms and their copy charges. The SEC also maintains a web site at www.sec.gov that contains reports and otherinformation regarding registrants that file electronically with the SEC. This Annual Report and some of the other information submitted by theGroup to the SEC may be accessed through the SEC website.
iv 2010 Annual Report

Des
crip
tion
ofth
eG
roup
Busi
ness
Revi
ew,
Liqui
dity
and
Pros
pect
sCo
rpor
ate
Gov
erna
nce
Stat
emen
tD
irect
ors’
Rem
uner
atio
nRe
port
Gro
upA
ccou
nts
Com
pany
Acc
ount
sIn
vest
orIn
form
atio
n
Description of the Group4 The Business
10 Operating Activities13 The Business and the Community18 Risk
Business Review, Liquidity and Prospects24 Business Overview
29 2010 Year
34 2009 Year
39 Financial Position, Liquidity and Capital Resources
41 Legal Proceedings
43 Outlook and Trend Information
44 Contractual Obligations
44 Off-balance Sheet Arrangements
44 Related Party Transactions
Corporate Governance Statement46 The Board and Executive Officers48 Governance and Policy55 Accountability, Audit and Internal Control Framework
Directors’ Remuneration Report59 Directors’ Remuneration Report
Group Accounts74 Directors’ Responsibilities for the Accounts75 Directors’ Responsibility Statement Pursuant to
Disclosure and Transparency Rule 476 Independent Auditor’s UK Report78 Independent Auditor’s US Report80 Group Income Statement
80 Group Statement of Comprehensive Income81 Group Balance Sheet82 Group Cash Flow Statement83 Group Statement of Changes in Equity84 Notes to the Group Accounts
Company Accounts129 Company Auditor’s Report131 Company Balance Sheet132 Notes to the Company Accounts
Investor Information136 Shareholder Return138 Information for Shareholders141 Share Capital143 Selected Financial Data145 Taxation Information for Shareholders
147 Articles of Association150 Cross Reference to Form 20-F152 Glossary of Terms155 Index
2010 Annual Report 1

THIS PAGE INTENTIONALLY LEFT BLANK
2 2010 Annual Report

Des
crip
tion
ofth
eG
roup
Busi
ness
Revi
ew,
Liqui
dity
and
Pros
pect
sCo
rpor
ate
Gov
erna
nce
Stat
emen
tD
irect
ors’
Rem
uner
atio
nRe
port
Gro
upA
ccou
nts
Com
pany
Acc
ount
sIn
vest
orIn
form
atio
n
DESCRIPTION OF THE GROUPThis section discusses the activities, resources and operating environment of the business under the following headings:
The BusinessHistory and Development 4Business Description 4
Operating ActivitiesSales and Marketing 10Manufacturing, Supply and Distribution 10Property, Plant and Equipment 11Research and Development 11Intellectual Property 12Regulation 12
The Business and the CommunityOur commitment to Sustainability 13Employees 17
RiskRisk Factors 18Exchange and interest rate risk and financial instruments 21
Discussion of the Group’s operating and financial performance, liquidity and financial resources for 2010 and 2009 is given in the “BusinessReview, Liquidity and Prospects” section (pages 23 to 44).
Discussion of the Group’s management structure and corporate governance procedures is set out in the “Corporate Governance Statement”section (pages 45 to 57).
The “Directors’ Remuneration Report” gives details of the Group’s policies on senior management’s remuneration in 2010 (pages 59 to 71).
Details of the structure of the Company’s share capital and securities, persons with significant shareholdings in the Company and asummary of the articles of association are incorporated into the Directors’ Report and are given in “Investor Information” (pages 135 to 149).
2010 Annual Report 3
THE BUSINESSHISTORY AND DEVELOPMENT
Group StrategySmith & Nephew’s overall vision is to help improve people's lives by repairing and healing the human body. To achieve this, the Group isfocused on continued delivery of sustainable profitable growth, through four strategic pillars:
• ‘Customer led’: outperforming our served markets by focusing on our customers; anticipating and innovating to deliver on their needs.
• ‘Efficient’: delivering operating margin improvement and freeing up resources to invest in the business, through streamlining process andsystems re-engineering.
• ‘Investing for growth’: driving additional sales from new opportunities such as emerging markets, biologics and adjacent technologies.
• ‘Aligned’: aligning objectives across the business and developing our talent and organisation for consistent execution, through leveragingcore functions and sharing best practices.
Group HistoryThe Group has a history dating back over 150 years to the family enterprise of Thomas James Smith who opened a small pharmacy in Hull,England in 1856. On his death in 1896, his nephew Horatio Nelson Smith took over the management of the business.
By the late 1990s, Smith & Nephew had expanded into being a diverse healthcare conglomerate with operations across the globe, includingvarious medical devices, personal care products and traditional and advanced woundcare treatments. In 1998, Smith & Nephew announceda major restructuring to focus management attention and investment on three global business units – advanced wound management,endoscopy and orthopaedics – which offered high growth and margin opportunities.
Smith & Nephew was incorporated and listed on the London Stock Exchange in 1937 and in 1999 the Group was also listed on the NewYork Stock Exchange. In 2001, Smith & Nephew became a constituent member of the FTSE-100 index in the UK. This means that Smith &Nephew is included in the top 100 companies traded on the London Stock Exchange measured in terms of market capitalisation.
Today, Smith & Nephew is a public limited company incorporated and headquartered in the UK and carries out business around the world.
Recent DevelopmentsOn 10 February 2011, the Group announced that David Illingworth will retire from the Board and as Chief Executive, at the Annual GeneralMeeting on 14 April 2011. It was also announced that Olivier Bohuon will join the Board as an executive director on 1 April 2011. He willoffer himself for re-election by the shareholders at the Annual General Meeting and, subject to his re-appointment, shall assume theposition of Chief Executive Officer at the conclusion of the Annual General Meeting on 14 April 2011.
In December 2010, the Group reviewed and replaced its principal banking facilities ahead of their maturity in May 2012. The Group hasreduced its $1 billion 5 year term loan to $500 million with effect from 20 December 2010. Smith & Nephew has also cancelled its $1.5billion multi-currency revolving loan facility and replaced it with a new 5-year $1 billion multi-currency revolving loan facility.
BUSINESS DESCRIPTIONOrganisationSmith & Nephew is organised into three primary Global Business Units (“GBUs”), which are also our reporting segments: Orthopaedics,Endoscopy and Advanced Wound Management. Included within the Orthopaedics segment are our biologics activities, which compriseresearch and development projects under the direction of a Committee representing all GBUs.
Smith & Nephew operates on a worldwide basis and has distribution channels in over 90 countries. In the more established countries byrevenue, the Group’s business operations are organised by GBU. In the majority of the remaining markets, operations are managed bycountry managers who are responsible for sales and distribution of the Group’s product range. These comprise the emerging markets unit.
A head office team in London, England directs the overall business and supports the business units, primarily in the areas of businessdevelopment, legal, company secretarial, finance, human resources and investor relations.
4 2010 Annual Report
Des
crip
tion
ofth
eG
roup
Busi
ness
Revi
ew,
Liqui
dity
and
Pros
pect
sCo
rpor
ate
Gov
erna
nce
Stat
emen
tD
irect
ors’
Rem
uner
atio
nRe
port
Gro
upA
ccou
nts
Com
pany
Acc
ount
sIn
vest
orIn
form
atio
n
OrthopaedicsOverview
Orthopaedics comprises reconstruction, trauma and clinical therapies products.
The Orthopaedics business is managed worldwide from Memphis, Tennessee, the site of its main development and manufacturing facility,with a European headquarters in Baar, Switzerland. Products are also manufactured at smaller facilities in Switzerland, Germany, and the UKas well as by third-party manufacturers. A new facility has been constructed in Beijing, China.
Products
Orthopaedic reconstruction implants include hip, knee and shoulder joints as well as ancillary products such as bone cement. Orthopaedictrauma fixation products consist of internal and external devices and other products, including shoulder fixation and orthobiologicalmaterials used in the stabilisation of severe fractures and deformity correction procedures. Clinical therapies products are those that areapplied in an orthopaedic office or a clinic setting and include bone growth stimulation and joint fluid therapies.
Knee Implant Systems – The Orthopaedics business offers a range of products for specialised knee procedures. The LEGION/GENESIS IITotal Knee System is a comprehensive system designed to allow surgeons to address a wide range of knee procedures from primary torevision. LEGION TKS features VERILAST Technology, an advanced bearing surface. The JOURNEY Active Knee Solutions, a family ofadvanced, customised products designed to treat early to mid-stage osteoarthritis patients, provides more normal feeling and motionthrough bone ligament preservation and anatomic replication. Other knee systems include the PLUS Solution Knee Family and PROFIX Knee.Our LEGION/GENESIS II and JOURNEY also utilise VISONAIRE Patient-Matched Instrumentation, a new technology platform of patient-matched cutting blocks for total knee procedures.
Hip Implant Systems – The Orthopaedics business offers a broad range of hip replacement systems. In particular, the R3 AcetabularSystem includes a modular acetabular cup that provides a variety of advanced bearings within a single system. The BIRMINGHAM HIPResurfacing System is a system for hip resurfacing, a bone conserving approach, which utilises proven low wear metal-on-metal bearingsurface technology. Other hip systems include the SYNERGY Hip System, ANTHOLOGY Hip System and the SL-PLUS Hip Family System.
Bearing surfaces – The Orthopaedics business utilises a range of bearing surfaces in its implant systems, including its proprietary OXINIUMTechnology. Oxidised zirconium, branded OXINIUM, combines the enhanced wear resistance of a ceramic bearing with the superiordurability of a metallic bearing. When combined with highly cross-linked polyethylene (“XLPE”) it results in our VERILAST Technology. LEGIONPrimary Knee, with VERILAST Technology, is the only knee system with a 30 year wear performance claim approved by the United StatesFood and Drug Administration (“FDA”) – more than double the performance expectation for wear compared to conventional technologies.
Trauma Implant Systems – The principal fixation products are the TRIGEN Intramedullary Nailing system, TRIGEN Meta Nail with expandedfixation and technique options, TRIGEN INTERTAN Intertrochanteric Antegrade nails for hip fractures, TRIGEN SURESHOT Distal TargetingSystem for Intramedullary Nailing and PERI-LOC Periarticular Locked Plating system which offers a comprehensive family of fracture specificplate and screw products for the upper and lower extremity.
For external fixation and limb restoration, Orthopaedics offers the TAYLOR SPATIAL FRAME Circular Fixation System and JET-X UnilateralFixator.
Clinical therapies – The principal clinical therapies products offered include the EXOGEN Ultrasound Bone Healing System which utiliseslow-intensity pulsed ultrasound to accelerate the healing of fresh fractures and to heal non unions. DUROLANE Joint Fluid Therapy andSUPARTZ Joint Fluid Therapy are non-surgical, non-pharmacological pain-relieving therapies for osteoarthritis of the knee.
Strategy
Orthopaedics maintains its commitment to being customer-led by focusing on product innovation, sales excellence and physician education.Whether through extending the life of implants, improving operating room efficiency, or promoting faster healing, Smith & Nephew’sinnovations differentiate it and provide solutions to active patients seeking to regain quality of life while enhancing economic value forcustomers. Orthopaedics provides peer-to-peer medical education, through KLEOS, tailored to individual surgeon needs utilising the world’stop orthopaedic specialists and key opinion leaders. KLEOS is a medical education platform which offers seminars, fellowships, instructionalvideos and literature reviews.
The Orthopaedics business efficiency programmes continue to deliver savings to the business. The current programmes are focused onimproving inventory utilisation, reducing sourcing costs, improving manufacturing efficiency, reducing overhead costs and ensuringcontinual efficiency improvement.
2010 Annual Report 5

The emerging markets continue to be an important component of investing for growth, China in particular remains a focus with severalmilestones achieved in 2010 including opening a new manufacturing facility near Beijing, integration of product development teams into thefranchises, and opening of three surgical training centres. Outside China, Orthopaedics is investing in sales teams in other emergingmarkets, extending physician training via KLEOS, developing tailored products to meet local needs and improving local infrastructure andlogistics.
The Orthopaedics business aligns its organisation and develops its talent for consistent execution on the Group’s plans. Compensation forexecutives, managers and staff are carefully aligned to the execution of their objectives.
New Products
In Trauma, Orthopaedics launched the TRIGEN SURESHOT Distal Targeting System for Intramedullary Nailing which simplifies the surgicaltechnique, reducing surgery time and fluoroscopic X-ray exposure. The VLP Foot and Ankle plating system, a comprehensive plate andscrew system to manage fractures in the foot and ankle was also launched in the year bringing the advantages of variable angle plating to arapidly growing segment of the market.
Reconstructive Orthopaedics continued the commercialisation of its VISIONAIRE Patient-Matched Instrumentation. With VISIONAIRE, thepatient’s MRI and X-rays are used to create customised cutting blocks that allow the surgeon to achieve optimal mechanical axis alignmentas well as saving time and reducing instruments in the operating room.
Regulatory Approvals
In 2010, several significant regulatory product and claims approvals were obtained around the globe.
In the US the SURESHOT Distal Targeting System for TAN Intramedullary Nails and accessories was approved. In Japan, the LEGION TKSPosterior Stabilized and Revision Systems, 12/14 Taper OXINIUM Femoral Heads, the PERI-LOC Titanium Plating System, and ECHELONTitanium Hip Stems were all approved. In the EU, we also received approval for the SURESHOT Distal Targeting System and VISIONAIREPatient Matched Cutting Blocks. Also, in the EU, DUROLANE was approved for treatment of mild to moderate osteoarthritis in a broader rangeof joints and following joint arthroscopy.
In the US, the Orthopaedics business received 510(k) clearance from the FDA for VERILAST Technology wear claims for an estimated30 years of normal use for the LEGION Primary Knee system.
Around the globe, 20 additional approvals and clearances were obtained, including amongst others: BHR instrument upgrades,R3 Acetabular system additions, VLP FOOT Plating Screw System and accessories, the JOURNEY Select Knee System and LEGION PorousPlus HA primary Femoral Components.
In Europe, regulatory approval was secured for EXOGEN for use on all osseous defects and DUROLANE for osteoarthritis pain relief in allsynovial joints and for pain relief post arthroscopic surgery.
Seasonality
Orthopaedic reconstruction revenues are lower in the third quarter of any year due to fewer elective surgeries in the summer and higher inthe fourth quarter as elective surgeries increase. Reconstructive trauma revenues are generally highest in the fourth quarter caused to alarge extent by the relatively high number of accidents and sports related injuries which occur in the autumn and winter seasons in NorthAmerica and Europe.
Market and Competition
Smith & Nephew estimates that the worldwide orthopaedic market, excluding clinical therapies, served by the Group grew by approximately4% in 2010 and is currently worth approximately $17 billion per annum worldwide. Management believes that the Smith & NephewOrthopaedics business holds an 11% share of this market by value. Principal global competitors in orthopaedics are Zimmer, Stryker,DePuy/Johnson & Johnson, Synthes and Biomet.
In 2010, weaker economic conditions worldwide continued to create several challenges for the overall orthopaedic market, includingincreased deferrals of joint replacement procedures and heightened pricing pressures. These factors contributed to the lower overall growthof the worldwide orthopaedic market compared to historic comparables. However, over the medium-term, several catalysts are expected tocontinue to drive sustainable growth in orthopaedic device sales, including the growing, ageing population, rising rates of co-morbiditiessuch as obesity and diabetes, technology improvements allowing surgeons to treat younger, more active patients, and the increasing
6 2010 Annual Report

Des
crip
tion
ofth
eG
roup
Busi
ness
Revi
ew,
Liqui
dity
and
Pros
pect
sCo
rpor
ate
Gov
erna
nce
Stat
emen
tD
irect
ors’
Rem
uner
atio
nRe
port
Gro
upA
ccou
nts
Com
pany
Acc
ount
sIn
vest
orIn
form
atio
n
strength of the demand for healthcare in emerging markets. Both the orthopaedic trauma and clinical therapies markets are expected tocontinue to grow due to a global population increasingly at risk from fractures due to age, osteoporosis, obesity and diabetes and also dueto continuous advancements in the surgical treatment of fractures, and the need to manage pain in younger, more active patients.
Management estimates that the worldwide market for clinical therapies increased by 6% in 2010 and is currently worth more than$1.7 billion per annum. Smith & Nephew’s primary market for clinical therapies is in the US. In the US long bone stimulation marketmanagement estimates Smith & Nephew’s share to be 40%. Principal competitors are Biomet, DJ Ortho and Orthofix. In the US joint fluidtherapies market, management estimates that Smith & Nephew maintains a share of 14%. The principal competitors are Genzyme, SanofiAventis, DePuy/Johnson & Johnson and Ferring Pharmaceuticals.
EndoscopyOverview
Smith & Nephew’s Endoscopy business develops and commercialises endoscopic (minimally invasive surgery) techniques, educationalprogrammes and value-added services for surgeons to treat and repair soft tissue and articulating joints. The business focuses on thearthroscopy or sports medicine sector of the endoscopy market. Arthroscopy is the minimally invasive surgery of joints, in particular theknee, shoulder and hip.
The Endoscopy business is headquartered in Andover, Massachusetts and manufacturing facilities are currently located in Mansfield,Massachusetts, and Oklahoma City, Oklahoma. Major service centres are located in the US, the UK, Germany, Japan and Australia.
Products
The Endoscopy business offers surgeons endoscopic technologies for surgery of the joints and ligament repair, including: specialiseddevices and fixation systems to repair damaged tissue; fluid management equipment for surgical access; digital cameras, digital imagecapture, scopes, light sources and monitors to assist with visualisation; radiofrequency wands, electromechanical and mechanical blades,and hand instruments for resecting damaged tissue.
Key products in repair are FAST-FIX for meniscal repair, ENDOBUTTON for cruciate fixation, and the FOOTPRINT Suture Anchor for rotatorcuff repair. Key products in resection are the wide range of DYONICS shaver blades, ACUFEX handheld instruments, and a range ofradiofrequency probes. The key product in Visualisation is the DYONICS 560 HD camera.
Strategy
Smith & Nephew’s strategic intent is to grow the business as the leading provider of endoscopic techniques and technologies for joint andligament repair. Management believes that the business capitalises on the growing acceptance of endoscopy as a preferred surgical choiceamong physicians, patients and payors, enhanced by a customer-led approach to growing the arthroscopy market.
To sustain growth and enhance its market position, the Endoscopy business supports its strategy with investment in surgeon educationprogrammes, global fellowship support initiatives, partnerships with professional associations and surgeon advisory boards. The emergingmarkets, especially China, are expected to be a major driver of growth in future, and the business is also investing funds to accelerate thisgrowth.
The business has a commitment to, and track record of, driving efficiencies, through a formal operational excellence programme as well as aculture of continuous process improvement.
The Endoscopy business aligns its organisation to ensure all employees are working on common objectives, and to ensure consistentexecution against the Group’s wider objectives.
New Products
In 2010, Smith & Nephew continued to expand its arthroscopic sports medicine portfolio with the launch of several new repair and resectionproducts.
The BIORAPTOR Knotless Suture Anchor is a device used to repair a torn labrum in the hip and shoulder. The ease of use provided by thisknotless arthroscopic device provides surgeons with full control over suture tension – a critical element in the procedure.
BIOSURE SYNC Tibial Fixation System is designed to address the need for strong fixation on the tibial side of ACL reconstruction. It employsa sheath and screw to achieve a 360° graft-to-bone contact throughout the tibial tunnel and can accommodate a variety of arthroscopicligament reconstruction techniques.
2010 Annual Report 7

The TWINFIX and FOOTPRINT suture anchor product lines were enhanced through the incorporation of ULTRABRAID suture, which providesstronger knot strength and a low profile knot stack. Both are designed to provide easy, secure and strong repairs with precise control overfinal tensioning and are available in a wide variety of materials and sizes.
Recent Regulatory Approvals
During 2010, the Endoscopy business obtained regulatory clearances for the following products in most major markets, except Japan wherethe approval process is more lengthy: FOOTPRINT Ultra PK, BIOSURE SYNC, TWINFIX Ultra HA, and TWINFIX Ultra Ti, all designed for thereattachment of ligaments, tendons or soft tissues to bone in knees, shoulders or other articulating joints; and various other arthroscopyinstruments, devices and sterilisation trays. In Japan, regulatory approvals included ENDOBUTTON CL Ultra, Ultra FAST-FIX KINSA RC andvarious TWINFIX suture anchors.
Seasonality
Smith & Nephew’s Endoscopy revenues are generally at their highest in the fourth quarter of any year. This is caused to a large extent by therelatively high number of accidents and sports related injuries which occur in the autumn and winter seasons in North America and Europe.
Market and Competition
Management estimates that the global arthroscopy market in which the business principally participates is worth more than $3 billion a yearand has recently been growing between 8% and 12% annually. Arthroscopy growth rates are driven by increasing numbers of sportsinjuries, longer and more active lifestyles, patient desire for minimally invasive procedures, innovative technological developments and aneed for cost-effective procedures. The arthroscopy market has a particular focus on arthroscopic repair of the knee and shoulder using abroad range of technology. The Group also expects to benefit from the demand for less invasive approaches to arthroscopic hip repair.
Management believes that Smith & Nephew has a 22% share of the global arthroscopy market as at 31 December 2010. Smith & Nephew’smain competitors in the global arthroscopy market in 2010 were Arthrex, Mitek/Johnson & Johnson, Stryker, Arthrocare and Linvatec/Conmed.
Advanced Wound ManagementOverview
Smith & Nephew’s Advanced Wound Management business offers a range of products from initial wound bed preparation through to fullwound closure. These products are targeted at chronic wounds associated with the older population, such as pressure sores and venousleg ulcers. There are also products for the treatment of wounds such as burns and invasive surgery that impact the wider population.
The Advanced Wound Management business has its global headquarters in Hull, England and its North American headquarters in StPetersburg, Florida. The products are manufactured at facilities in Hull and Gilberdyke, England, Suzhou in China, and also by third partymanufacturers around the world.
Products
The main products within the Advanced Wound Management business are for exudate management, predominantly the ALLEVYN brand,infection management, including the ACTICOAT brand and Negative Pressure Wound Therapy (“NPWT”).
The ALLEVYN hydrocellular dressings range has been considerably enhanced by new versions, introduced in recent years, whichmanagement believes provide efficient fluid management and an optimal moist wound environment that promotes faster healing of thewound, reduced risk of maceration and protection from infection. The range includes ALLEVYN Ag, a range of dressings combining theinfection management capabilities of silver with ALLEVYN.
The ACTICOAT range incorporates the smallest crystallised silver used in the treatment of wounds and burns. The silver reduces the risk ofbacterial colonisation and acts to kill micro-organisms that can cause infection and prevent or delay healing.
NPWT delivers vacuum-assisted pressure to help promote healing. NPWT consists of a wound dressing, a drainage tube, and a transparentfilm that is connected to a suction device. Smith & Nephew offers the RENASYS EZ and RENASYS GO pump systems together with a range offoam and gauze dressing kits.
8 2010 Annual Report

Des
crip
tion
ofth
eG
roup
Busi
ness
Revi
ew,
Liqui
dity
and
Pros
pect
sCo
rpor
ate
Gov
erna
nce
Stat
emen
tD
irect
ors’
Rem
uner
atio
nRe
port
Gro
upA
ccou
nts
Com
pany
Acc
ount
sIn
vest
orIn
form
atio
n
Advanced Wound Management also offers a range of other advanced products including films, such as OPSITE and IV3000, skin caretreatments and gels.
Strategy
Advanced Wound Management’s strategy is to be customer-led and invest for growth by focusing on high growth, high value segments, inparticular exudate and infection management, through improved wound bed preparation, moist and active healing and penetration of theNPWT market.
There has been a continued focus on operational efficiency and excellence. Since 2007, efficiency improvements have been deliveredthrough various projects including support function consolidation, outsourcing of manufacturing to low cost suppliers, distributionrationalisation projects and the start of manufacturing in Suzhou, China.
An aligned approach across the GBU is designed to ensure that our employees are developed and work on common objectives to deliverconsistent execution of the Group’s plan.
New Products
During 2010, the ALLEVYN hydrocellular dressings range was extended further, reinforcing our position as the company offering what webelieve is the most comprehensive foam dressing solutions with the addition of ALLEVYN Lite. This new addition has the efficient fluidmanagement properties of the existing ALLEVYN dressings and reduces pain on dressing removal for the patient, whilst improving comfortand wear through anatomical design.
The infection management portfolio was expanded in Japan in 2010, with further improvements to the already successful CADEX productand our first silver dressing entry in the market with ALGISITE Ag, giving a strong portfolio for future growth in the region.
Recent Regulatory Approvals
During 2010, Advanced Wound Management secured approval for a new formulation of No Sting SKIN PREP, ALGISITE Ag in Japan, OPSITEVisible Drain dressing and NPWT dressing kits with ports in the EU and US. A new more conformable version of ALLEVYN Gentle Border,ALLEVYN Gentle Border Lite, was also approved in the EU and the US.
Approval was obtained in the EU and US for the manufacture of the complete range of ACTICOAT dressings at Advanced WoundManagement’s Hull facility following transfer of conversion and packaging from Alberta and for the manufacture of OPSITE Post Op Visible inSuzhou.
We secured our first licence to sell domestically manufactured products in China following the transfer of ALLEVYN Adhesive manufacture tothe Suzhou facility.
Seasonality
Due to the nature of its product range there is little seasonal impact on the Advanced Wound Management business.
Market and Competition
Management estimates that the sales value of the advanced wound management market worldwide was $5.2 billion in 2010, an underlyingincrease of just under 4% from 2009. During 2010, the market growth rate slowed slightly due to the weaker economic conditions. Theadvanced wound management market is focused on the treatment of chronic wounds of the older population and other hard-to-healwounds such as burns and certain surgical wounds and is therefore also expected to benefit from demographic trends. Growth is driven byan ageing population and by a steady advance in technology and products that are more clinically efficient and cost effective than theirconventional counterparts. The market for advanced wound treatments is relatively unpenetrated and it is estimated that the potentialmarket is significantly larger than the current market. Management believes that the market will continue the trend towards advanced woundproducts with its ability to accelerate healing rates, reduce hospital stay times and cut the cost of clinician and nursing time as well asaftercare in the home.
Management estimates that Smith & Nephew had a 18% share of the advanced wound management market as at 31 December 2010.Worldwide competitors in advanced wound management in 2010 include Convatec, Mölnlycke, Systagenix and Kinetic Concepts, who areactive exclusively in the NPWT market.
2010 Annual Report 9

OPERATING ACTIVITIESSALES AND MARKETING
Smith & Nephew’s customers are the providers of medical and surgical services worldwide. In certain parts of the world, including the UK,much of Continental Europe, Canada and Japan, these are largely government organisations funded by tax revenues. In the US, the Group’smajor customers are public and private hospitals, which receive revenue from private health insurance and government reimbursementprogrammes. Medicare is the major source of reimbursement in the US, for knee and hip reconstruction procedures and for wound healingtreatment regimes.
Competition exists among healthcare providers to gain patients on the basis of quality, service and price. Providers are under pressure toreduce the total cost of healthcare delivery. There has been some consolidation in the Group’s customer base, as well as amongst theGroup’s competitors, and these trends are expected to continue in the long term. Smith & Nephew competes against both specialised andmultinational corporations, including some with greater financial, marketing and other resources.
The Group’s customers reflect the wide range of distribution channels, purchasing agents and buying entities in over 90 countriesworldwide. The largest single customers worldwide are the National Health Service in the UK and the Heath Trust Purchasing Group in theUS. These represented 6% and 5% respectively of the Group’s worldwide revenue in 2010.
In the US, the Group’s products are marketed directly to care givers, hospitals and other healthcare facilities with each business unitoperating a separate specialised sales force. The US sales forces consist of a mixture of independent commissioned sales agents and directemployees. The independent agents are contractually not permitted to sell products that compete with Smith & Nephew’s. Orthopaedicsand Endoscopy products are principally shipped and invoiced directly to the ultimate customer. Advanced Wound Management products aremarketed directly to the ultimate customer. The products are shipped and invoiced to a number of wholesale distributors. In most otherdirect markets, the business units typically manage employee sales forces directly, and also ship and invoice products both directly to theultimate customer and to wholesale distributors.
The emerging markets unit comprises direct selling and marketing operations, directly and through distributors, in India, China, Hong Kong,South Korea, Malaysia, Singapore, Thailand, the United Arab Emirates and South Africa. In these markets, Orthopaedics and Endoscopyfrequently share sales resources. The Advanced Wound Management sales force may be separate where it calls on different customers. Incountries not covered by the emerging markets unit, Smith & Nephew typically sells to third party distributors which market the Group’sproducts locally.
MANUFACTURING, SUPPLY AND DISTRIBUTIONThe Group has a central Global Operations function which continues to implement Lean manufacturing throughout the factories and thesupply chain which is designed to improve and sustain higher levels of productivity, quality, service and efficiency. Core competenciesinclude: materials technology; high precision machining in Orthopaedics and Endoscopy; and high-volume, automated manufacturing inAdvanced Wound Management.
Each business unit purchases raw materials, components, finished products and packaging materials from certain key suppliers. Theseprincipally include metal forgings and stampings for Orthopaedics, optical and electronic sub-components and finished goods forEndoscopy, active ingredients and finished goods for Advanced Wound Management and packaging materials across all businesses.Suppliers are selected, and contracts negotiated, by a centralised Group procurement team wherever possible, with a view to ensure valuefor money based on the total spending across the Group.
The Group outsources manufacturing where necessary to obtain specialised expertise or where it is possible to gain lower cost without riskto intellectual property. Suppliers of outsourced products and services are selected based on their ability to deliver products and services tospecification, and establish and maintain a quality system. Suppliers are trained and are monitored through on-site assessments andperformance audits that include quality, service and delivery. Finished goods purchased for resale include SUPARTZ and DUROLANE jointfluid therapy products in the Orthopaedics business and screen displays, optical and electrical devices in the Endoscopy business.
The Group operates a number of central distribution facilities in the key geographical areas in which it operates. Orthopaedics andEndoscopy operate a facility in Baar, Switzerland which acts as the main holding and consolidation point for markets in Europe. Hubs servingthe US are located in Memphis, US for Orthopaedics and Oklahoma City, US for Endoscopy. Products are shipped to Group companies whohold small amounts of inventory locally for immediate or urgent customer requirements. Advanced Wound Management distribution hubsinclude: Neunkirchen, Germany; Nottingham, England; and Atlanta, US.
10 2010 Annual Report

Des
crip
tion
ofth
eG
roup
Busi
ness
Revi
ew,
Liqui
dity
and
Pros
pect
sCo
rpor
ate
Gov
erna
nce
Stat
emen
tD
irect
ors’
Rem
uner
atio
nRe
port
Gro
upA
ccou
nts
Com
pany
Acc
ount
sIn
vest
orIn
form
atio
n
PROPERTY, PLANT AND EQUIPMENTThe table below summarises the main properties which the Group uses and their approximate areas.
Approximate area(Square feet 000’s)
Group head office in London, England 15Group research facility in York, England 83Orthopaedics headquarters and manufacturing facilities in Memphis, Tennessee, US 1,052Orthopaedics distribution facility in Memphis, Tennessee, US 210Orthopaedics manufacturing facility in Aarau, Switzerland 117Orthopaedics manufacturing facility in Beijing, China (Linhe) 21Orthopaedics manufacturing facility in Beijing, China 192Orthopaedics manufacturing and warehouse facility in Warwick, England 90Orthopaedics manufacturing and warehouse facility in Tüttlingen, Germany 63Orthopaedics and Endoscopy distribution facility and Orthopaedics European headquarters in Baar, Switzerland 63Orthopaedics – Biologics/ Global Operations headquarters in Durham, North Carolina, US 27Endoscopy headquarters in Andover, Massachusetts, US 144Endoscopy manufacturing facility in Mansfield, Massachusetts, US 98Endoscopy manufacturing and distribution facility in Oklahoma City, Oklahoma, US 155Advanced Wound Management headquarters and manufacturing facility in Hull, England 439Advanced Wound Management manufacturing facility in Gilberdyke, England 70Advanced Wound Management manufacturing facility in Suzhou, China 144Advanced Wound Management manufacturing facility in Alberta, Canada 76Advanced Wound Management US headquarters in St. Petersburg, Florida, US 44
The Group Global Operations strategy includes ongoing assessment of the optimal facility footprint. The Orthopaedics headquarters andmanufacturing facilities in Memphis, Tennessee are largely freehold, a portion of Tuttlingen and the Advanced Wound Management facilitiesin Hull and Gilberdyke are freehold while other principal locations are leasehold. The Group has freehold and leasehold interests in realestate in other countries throughout the world, but no other is individually significant to the Group. Where required, the appropriategovernmental authorities have approved the facilities.
In 2010, Orthopaedics purchased a building in Cordova, Tennessee which will be its new headquarters and sales training building, and isexiting a smaller leasehold office facility in 2011. The Group closed the manufacturing facility in Largo, Florida during 2009 and outsourcedor relocated its manufacturing output – the building was sold in 2010. The Orthopaedics business has opened the new factory in Beijing,China, and the facility in Linhe is expected to close at the end of 2011. The Beijing factory will supply implants to the local market andorthopaedic instruments for export.
RESEARCH AND DEVELOPMENTThe global business units each manage a portfolio of short and long-term product development projects designed to meet the future needsof customers and continue to provide growth opportunities for the business. The Group’s research and development is directed towards allthree operating segments. Expenditure on research and development amounted to $151m in 2010 (2009 – $155m, 2008 – $152m),representing approximately 4% of Group revenue (2009 – 4%, 2008 – 4%).
The Group continues to invest in future technology opportunities for clinical needs identified from across the Smith & Nephew businesses.
The Group’s principal research facility located in York, England is now managed in conjunction with the Group’s research facility in Durham,North Carolina, to provide research programmes that seek to underpin the longer-term technology requirements for its businesses and toprovide a flow of innovative products. In-house research is supplemented by work performed by academic institutions and other externalresearch organisations in Europe, America and Asia.
Product development is primarily carried out at the Group’s principal locations, notably in Memphis, Tennessee and Aarau, Switzerland(Orthopaedics), Mansfield, Massachusetts (Endoscopy) and Hull, England (Advanced Wound Management).
2010 Annual Report 11

INTELLECTUAL PROPERTYSmith & Nephew has a policy of protecting, with patents, the results of research and development carried out by the Group. Patents havebeen obtained in a wide range of fields, including Orthopaedic reconstruction and trauma, clinical therapies, Endoscopy and AdvancedWound Management. Patent protection for Group products is sought routinely in the Group’s principal markets. Currently, the Group’s patentportfolio stands at approximately 4,000 patents in force and patent applications pending.
Smith & Nephew also has a policy of protecting the Group’s products by registering trademarks under local laws of markets in which suchproducts are sold. The Group vigorously protects its trademarks against infringement. Currently, the Group’s trademark portfolio consists ofapproximately 4,000 trademarks, trademark applications and design rights.
For each major product, Smith & Nephew’s goal is to provide a collection of intellectual property, which may include patents, trade secretsand licences, that reduces the risk associated with failure of any individual piece of intellectual property. Most individual pieces of intellectualproperty protect a relatively small proportion of the Group’s annual revenue. As a result, the Group tries to ensure that its overall business isnot sensitive to the loss (however caused) of any single piece of intellectual property.
In addition to protecting its market position by filing and enforcing patents and trademarks, Smith & Nephew may oppose third party patentsand trademark filings where appropriate in those areas that might conflict with the Group’s business interests.
In the ordinary course of its business, the Group enters into a number of licensing arrangements with respect to its products. None of thesearrangements individually is considered material to the current operations and the financial results of the Group.
REGULATIONThe international medical device industry is highly regulated. Regulatory requirements are a major factor in determining whether substancesand materials can be developed into marketable products and the amount of time and expense that should be allotted to suchdevelopment.
National regulatory authorities administer and enforce a complex series of laws and regulations that govern the design, development,approval, manufacture, labelling, marketing and sale of healthcare products. They also review data supporting the safety and efficacy ofsuch products. Of particular importance is the requirement in many countries that products be authorised or registered prior to manufacture,marketing or sale and that such authorisation or registration be subsequently maintained. The major regulatory agencies for Smith &Nephew’s products include the Food and Drug Administration (“FDA”) in the US, the Medicines and Healthcare products Regulatory Agencyin the UK, the Ministry of Health, Labour and Welfare in Japan and the State Food and Drug Administration in China.
The trend is towards more effective regulation and higher standards of technical appraisal. In the US, many of the Group’s products arebrought to market following pre-market notification to the FDA under Section 510(k) of the Food, Drug and Cosmetic Act, with a request thatFDA clear the product as being substantially equivalent in terms of safety and effectiveness to a previously approved device. The FDA isconsidering changes in the 510(k) clearance process that might delay or modify the path to clearance in some circumstances. Regulatoryrequirements may also entail inspections for compliance with appropriate standards, including those relating to Quality ManagementSystems or Good Manufacturing Practices regulations. All manufacturing and other significant facilities within the Group are subject toregular internal audit for compliance with national and Group medical device regulation and policies.
Payment for medical devices is governed by reimbursement tariff agencies in various countries. Reimbursement rates may be set inresponse to perceived economic value of the devices, based on clinical and other data relating to cost, patient outcomes and comparativeeffectiveness. They may also be affected by overall government budgetary considerations. The Group believes that its emphasis oninnovative products and services should contribute to success in this environment.
Management believes that the Group’s operations currently comply in all material respects with applicable environmental laws andregulations. Although the Group continues to make capital expenditures for environmental compliance, it is not currently aware of anysignificant expenditure that would be required as a result of such laws and regulations that would have a material adverse impact upon theGroup’s financial position.
12 2010 Annual Report

Des
crip
tion
ofth
eG
roup
Busi
ness
Revi
ew,
Liqui
dity
and
Pros
pect
sCo
rpor
ate
Gov
erna
nce
Stat
emen
tD
irect
ors’
Rem
uner
atio
nRe
port
Gro
upA
ccou
nts
Com
pany
Acc
ount
sIn
vest
orIn
form
atio
n
THE BUSINESS AND THE COMMUNITYOUR COMMITMENT TO SUSTAINABILITY
ApproachSmith & Nephew recognises that companies have a wide responsibility to the community, the environment and the quality of life enjoyed bysociety at large. As a leader in its markets, Smith & Nephew believes it should also be a leader in setting and meeting standards ofsustainable development. The Group monitors progress and views sustainable development as an integral part of the way the Group doesbusiness. We believe this because:
• It reinforces our commitment to meeting regulatory obligations and reduces our risks.
• It helps us to retain and recruit talented employees by demonstrating that we care about our people and our planet.
• It enhances our reputation as a partner with our health care customers, collaboratively developing innovative solutions in the form ofproducts and services.
• It enables us to improve our operational efficiencies, thereby reducing costs as well as improving environmental outcomes.
• It enables us to anticipate and prepare for “over the horizon” issues that will affect our customers and society at large.
• It reinforces our role as a strong corporate citizen in the communities where we work and live.
• It provides real value to our shareholders.
To further advance its commitment to sustainability, Smith & Nephew created a new executive position in 2010, the Senior Vice-President ofCorporate Sustainability.
Smith & Nephew’s approach to sustainability is governed by the policies and principles it has developed to cover four key areas of corporateand social responsibility, namely: corporate governance and business integrity; health, safety and environment; social responsibility andeconomic contribution. These policies and principles are available at www.smith-nephew.com.
2010 Highlights
• Continued strong ranking in the Dow Jones Sustainability Index (“DJSI”) and membership of FTSE4Good.
• Commenced registration for the UK Carbon Reduction Commitment.
• Became an invited member of the World Environment Center as the first representative of the Health Care and Technology industry.
The Group has published a Sustainability Report since 2001. The 2011 Sustainability Report, which provides more comprehensiveinformation on the actions and performance in the four key reporting areas during the last year, will be published on the Group’s website inmid 2011 at www.smith-nephew.com.
Corporate Governance and Business IntegritySee the ‘Corporate Governance Statement’ section on pages 45 to 57 for a discussion of Smith & Nephew’s governance structures andprocedures.
Smith & Nephew aims to be honest and fair in all aspects of its business and expects the same from those with whom it does business. TheGroup’s Code of Conduct and Business Principles governs the way it operates so that it respects stakeholders and seeks to build open,honest and constructive relationships. The Group takes account of ethical, social, environmental, legal and financial considerations as partof its operating methods. The Group has an independently operated whistle-blowing service in all jurisdictions in which the Group operateswhere such service is allowed.
Our EnvironmentThe Group’s health, safety and environmental (“HSE”) commitment is to:
• give due regard to the effects of its operations on the environment and community to create a sustainable business;
• provide and maintain a safe and healthy work environment for employees, contractors and visitors;
2010 Annual Report 13

• require each of the Group’s businesses to achieve the HSE standards specified by the HSE policy;
• seek to improve HSE performance through continuous evaluation and development of measures to control risk, conserve resources andminimise waste; and
• recognise, promote and reinforce the responsibility of employees, contractors and visitors to work safely and follow procedures.
Smith & Nephew recognises the importance of minimising the environmental impact arising from all aspects of the business and placesemphasis on controlling its waste streams, use of energy and overall carbon emissions. Activities at a local and Group level remain key toensuring our overall HSE performance. Annual targets are set and initiatives put in place to meet these performance goals.
Throughout 2010, operations continued to develop in China and Canada. Results associated with these locations are included for the firsttime this year.
While we report absolute performance data, we also provide data normalised for changes related to cost of production (using 2010 as thebase year) to facilitate better year-on-year comparisons. Performance against the published targets for the key HSE parameters is alsoshown in the table below.
2010 actual 2009 actual2010 target
change
2010 actualchange
(normalised) (iv)
Change overlast 5 years
(normalised) (iv)
Energy Consumption (GWh) 168.9 157.4 -5% 6.5% -1.9%Carbon Emissions (tonnes) 76,638 74,603 No target 1.1% -10.9%Non-hazardous waste (tonnes) 3,297 4,917 (i) -33.3% -42.0%Hazardous waste (tonnes) 481 517 (i) -9.7% 61.5%Recycled waste (tonnes) 3,081 2,334 (i) - -Total waste incl. recycled (tonnes) 6,859 7,768 -5% -11.2% -5.8%Water (1,000m3) 629 621 No target -0.2% -13.7%Lost time accidents incident rate (ii) 0.53 0.57 -5% -7.0% 6.0%OSHA recordable incident rate (iii) 0.89 1.20 -10% -26.0% -36.0%
(i) There was no target for the reduction of specific waste streams. The Group target was for a 5% reduction in total waste.
(ii) Lost Time Accident Frequency Rate is measured as the number of accidents resulting in the loss of a day or more per 200,000 hours worked.
(iii) Occupational Safety & Health Administration (“OSHA”) definition measured as the number of incidents resulting in lost time, medical treatment(other than simple first aid), or modification to the persons work, per 200,000 hours worked.
(iv) Normalisation is based on Cost of Production which is defined as the Cost of Goods Sold adjusted for opening and closing inventory levels.
Energy consumption for the Group increased by over 6% in 2010, but this was largely attributable to 2010 representing the first full year ofenergy use reporting for the major global distribution centre in Memphis and the newly acquired facility in Alberta, Canada. Energy efficiencyinitiatives were effected at a number of locations, with particularly notable accomplishments at the Hull Advanced Wound Management siteand Endo operations in Massachusetts and Oklahoma.
The Group emission of carbon dioxide was 76,638 tonnes. This figure is calculated from both direct emissions from the combustion of fossilfuels on Smith & Nephew’s sites and secondary emissions from utility company power generation for Smith & Nephew’s electricity needs.While carbon dioxide emissions increased by approximately 1% in 2010, this was almost entirely related to the addition of the Memphisdistribution facility and Alberta, Canada operations as noted above.
The business generated 3,297 tonnes of non-hazardous waste in 2010. While this represented a substantial decline (33%) from 2009levels, 2009 represented an anomaly related to increased waste production associated with new construction and closure of a facility.
Over the last year, the amount of hazardous waste has reduced by 10% to 481 tonnes. The largest percentage reductions were achieved atthe Advanced Wound Management site in Hull and the Research Centre in York.
Smith & Nephew continues to demonstrate a commitment to recycling; in 2010, our percentage of total waste that was recycled increased to45% relative to 30% in the previous year. While these recycling initiatives were evident at many sites, the Memphis Orthopaedic facilitieswere noteworthy for their focus on scrap metals that resulted in diminished landfill costs and improved recycling revenue generation.
Water consumption throughout the Group remained largely unchanged relative to 2009. All sites continue to explore opportunities tominimise water use.
14 2010 Annual Report

Des
crip
tion
ofth
eG
roup
Busi
ness
Revi
ew,
Liqui
dity
and
Pros
pect
sCo
rpor
ate
Gov
erna
nce
Stat
emen
tD
irect
ors’
Rem
uner
atio
nRe
port
Gro
upA
ccou
nts
Com
pany
Acc
ount
sIn
vest
orIn
form
atio
n
Workplace accidents decreased in 2010. Improvements were notable both in terms of lost time accident frequency rate (-7%) and thenumber of lost time accidents (46 relative to 58 in 2009). The OSHA recordable rate for the Group also continued to improve (26%). Bothindicators of occupational accidents are below published industry average levels. The local HSE training plans continue to drive and promotesafe working practices at all sites.
HSE audits were undertaken at six locations in 2010. These audits are a continuation of our protocol of assessing each of our facilities on abi-annual schedule.
A full analysis of these measurements and key health and safety performance measures will be included in the 2011 Sustainability Reporton the Group’s website when it is published in mid 2011.
Social ResponsibilityOur People
The Group's employment policies are based on equality of opportunity regardless of colour, creed, race, national origin, sex, age, maritalstatus, sexual orientation, or mental or physical disability unrelated to the ability of the person to perform the essential functions of the job.
Smith & Nephew is committed to providing a healthy and safe working environment and operates a set of policies that ensure flexible,family-friendly practices and non-discrimination. It aims to provide an open environment based on constructive relationships and regularand timely dissemination of Group information and encourages feedback and ideas. Smith & Nephew carries out employee opinion surveysacross the business. The aim of the surveys is to assess how aligned staff are to the Group’s, and local GBU’s strategy, to determine whatwe, as a business, do well and identify what could be improved. We also take the opportunity to test the effectiveness of Performance,Innovation and Trust as the declared company values.
The Human Resources (“HR”) Policy Framework provides a framework of key HR policies, values, behaviours and management principlesthat provide the structure within which the business units and global functions plan and deliver successful results. There is also an HRstrategy which provides direction on how the Group intends to attract, retain and develop the right talent to meet business needs and createa culture that is aligned to Smith & Nephew values and deliver the Group’s long term strategic plans.
Other employee engagement indicators
In 2010, the Group continued to assess indicators of employee engagement. These measurements are a useful monitoring tool and alertmechanism for action as well as giving trend indicators of improved performance. The data below relates to the Group’s US and UK population(approximately 60% of the total employees) as these regions have the most established and robust data collection processes in place.
• Positions filled by internal candidates through promotions – This measure is an indicator of how well the Group believes it isdeveloping its employees and the success of the Group’s internal recruitment policy. In 2010, the percentage of vacancies filled byinternal applicants averaged 32% (2009 – 32%). The total for non-management positions was 29% (2009 – 29%) and for managementpositions was 52% (2009 – 51%). The Group target for all employees continues to be 40% (including management positions), whichmanagement believes is challenging but achievable. The Group has a policy of open advertising and providing opportunities for existingemployees wherever possible, while recognising the need to bring in new ideas and approaches that external recruitment brings.
• Labour turnover – The Group measures various labour turnover rates. The average voluntary labour turnover rate during 2010 was 7.2%,a slight increase from the 2009 equivalent rate of 6.5%. The average involuntary labour turnover rate was 5.1% (2009 – 10.7%), whichmanagement believe is indicative of the Group’s continuing management programme of efficiency improvements. This is aligned tocontinued investment in new markets and skills. An indicator of this is that the Group’s headcount remained broadly unchanged on theprior year. In addition, the Group measures labour turnover relating specifically to employees who have been with the business for lessthan two years. This measure is an indication of how well the Group recruits and then retains its employees so that they can make acontribution to the business. The average voluntary turnover for employees leaving the Group within two years of joining was 10.9%,compared to 10.1% in 2009.
The Group is committed to providing training and information so that all employees can make the best contribution possible. To ensure thatthe Group continues to improve in this important area, the central global organisational development team continued their programmes tolead talent management, performance management and learning and development across the whole of the Group. Learning anddevelopment programmes are used to attract, retain and develop employees. These programmes are linked to formal performance appraisaland development planning. The Group operates training programmes under the banner of ‘Management Excellence’. These provide the keymanagement skills required to be successful managers and leaders, covering the requirements of both new and experienced individuals.Additionally the Group has rolled out a global on-line learning resource and in 2011 will be expanding the programmes available to allemployees.
2010 Annual Report 15

The legal frameworks governing employee relations vary from country to country, as does custom and practice. Relations with trade unionsare nationally determined and managed locally in line with the applicable legal framework and standards of good practice. The well-developed arrangements for interactions with trade union and worker councils provide the forum for productive discussion andcollaborations with regard to collective bargaining agreements and other employment issues. It is the Group’s policy to conform to thenationally determined arrangements. The Group does not use any form of forced, compulsory or child labour.
Our Communities
Smith & Nephew values community involvement; it is an active member of its local communities and supports employees who undertakecommunity work. The Group’s principles for charitable giving are based on criteria relevant to its business, with priority given to medicaleducation. Individual company sites support their local communities in a range of charitable causes giving donations of money, gifts in kindand employee time.
The Group realises that its technologies and products do not reach everyone. Project Apollo is a charitable and humanitarian serviceprogramme of the Orthopaedics business. This links up with physicians and non-profit groups engaged in medical philanthropy that receivedonations of Smith & Nephew products through sponsorship and help from the Group’s employees. By working in collaboration with theseindividuals and organisations, Smith & Nephew considers that this is a way of increasing the impact of its charitable giving and work itundertakes.
More examples of community support programmes supported by the Group are given in the Sustainability Report.
In 2010, direct donations to charitable and community activities totalled $5,644,000 comprised of $1,736,000 in cash and $3,908,000 inproduct donations, primarily for Haiti earthquake relief efforts. This compares with $1,866,000 of cash donations in 2009 and $1,498,000 in2008. As a matter of policy, Smith & Nephew makes no political contributions.
Smith & Nephew is committed to establishing mutually beneficial relationships with its suppliers, customers and business partners. TheGroup works only with partners it believes adhere to business principles and health, safety, social and environmental standards consistentwith its own. Additional work continues each year to improve the monitoring of supplier standards for service quality and activities relevantto their corporate responsibility including a diversity programme to promote long-term relationships with local or small business enterprisesand minority-owned and women-owned business enterprises.
Economic ContributionSustainability by definition includes economic success. The Group is committed to providing innovative, cost-effective healthcare solutionsbenefiting patients, healthcare professionals, reimbursement agencies and their patients through improved treatment, ease and speed ofproduct use and reduced healthcare costs. The Group’s business policies are designed to achieve long-term growth and profits – which inturn bring continued economic benefits to shareholders, employees, suppliers and local communities. Highlights for 2010 included:
• Our net sales in 2010 amounted to $4.0 billion (2009 – $3.8 billion);
• Smith & Nephew’s employment of over 10,000 people globally is a substantial economic generator; our total wages and salaries in 2010amounted to $817m (2009 – $768m); and
• We invested $151m (2009 – $155m) in Research and Development to develop improved products and services.
Looking AheadThe Group is fulfilling an important role in the healthcare sector. Increased demands are being placed on healthcare systems by thedemographic trends of an ageing population and as the problems with obesity become more widespread. More active lifestyles and theincreased incidence of diabetes and other diseases also increase the demand for Smith & Nephew’s products. In addition, developing andnewly industrialised countries are increasing their demands for advanced products driven by similar demographic and health issues asdeveloped nations.
Smith & Nephew’s vision is to be the best in helping people regain their lives by improving and healing the human body. The Group believesthat it can achieve this by setting and meeting ambitious performance targets, by constant innovation in products and services and byearning the trust of its stakeholders. The Group considers sustainability a journey, not an end point and is committed to that journey as anessential part of its long-term strategy.
16 2010 Annual Report

Des
crip
tion
ofth
eG
roup
Busi
ness
Revi
ew,
Liqui
dity
and
Pros
pect
sCo
rpor
ate
Gov
erna
nce
Stat
emen
tD
irect
ors’
Rem
uner
atio
nRe
port
Gro
upA
ccou
nts
Com
pany
Acc
ount
sIn
vest
orIn
form
atio
n
EMPLOYEESThe average number of full-time equivalent employees in 2010 was 10,172, of whom 1,625 were located in the UK, 4,247 were located inthe US and 4,300 were located in other countries. The Group does not employ a significant number of temporary employees.
The average number of employees for the past three years by business segment:
2010 2009 2008
Orthopaedics 5,045 4,853 4,840Endoscopy 2,134 1,888 1,849Advanced Wound Management 2,993 3,023 3,068
10,172 9,764 9,757
Where the Group has collective bargaining arrangements in place with labour unions, these reflect local market circumstances.
Smith & Nephew operates share option plans that are available to the majority of employees (for further information see Note 25 of theNotes to the Group Accounts). The Group has no share plans in which shares have rights with regard to control of the Company that are notexercisable directly by employees.
2010 Annual Report 17

RISK
Management of RiskAs an integral part of planning and review, Group management and management of each of the GBUs seek to identify the risks involved inthe business, the probability of those risks materialising, the impact if they do materialise and the actions being taken, and to be taken, tomanage and mitigate those risks. Internal audit reviews and reports on the effectiveness of the operation of the risk management process.The Group Risk Committee meets twice a year to review the major risks identified by the GBUs and Group management and any mitigatingactions being taken. As appropriate, the Risk Committee may re-categorise risks or require further information or mitigating action to beundertaken. The Risk Committee reports to the Board on an annual basis detailing all principal risks categorised by potential financial impacton profit and share price. In addition, the risks considered to be most significant to the Group are reported to the Board on a regular basis.These reports include details of new, key or significantly increased risks, the senior management who have primary responsibility formanaging each of these risks along with actions they have put in place to mitigate such risks.
RISK FACTORSThere are known and unknown risks and uncertainties relating to Smith & Nephew’s business. The factors listed below could cause theGroup’s business, financial position and results of operations to differ materially and adversely from expected and historical levels. Inaddition, other factors not listed here, that Smith & Nephew cannot presently identify or does not believe to be equally significant, could alsomaterially adversely affect Smith & Nephew’s business, financial position or results of operations.
Strategic RiskHighly Competitive Markets
The Group’s business units compete across a diverse range of geographic and product markets. Each market in which the business unitsoperate contains a number of different competitors, including specialised and international corporations. Significant product innovations,technical advances or the intensification of price competition by competitors could adversely affect the Group’s operating results. Some ofthese competitors may have greater financial, marketing and other resources than Smith & Nephew. These competitors may be able toinitiate technological advances in the field, deliver products on more attractive terms, more aggressively market their products or investlarger amounts of capital and research and development into their businesses.
There is a possibility of further consolidation of companies, which could adversely affect the Group’s ability to compete with largercompanies due to insufficient financial resources. If any of the Group’s businesses were to lose market share or achieve lower thanexpected sales growth, there could be a disproportionate adverse impact on the Group’s share price and its strategic options.
Competition exists among healthcare providers to gain patients on the basis of quality, service and price. There has been someconsolidation in the Group’s customer base and this trend is expected to continue. Increased competition and unanticipated actions bycompetitors or customers could lead to downward pressure on prices and/or a decline in market share in any of the Group’s businessareas, which could adversely affect Smith & Nephew’s results of operations and hinder its growth potential.
Continual Development and Introduction of New Products
The medical devices industry has a rapid rate of new product introduction. In order to remain competitive, each of the Group’s businessunits must continue to develop innovative products that satisfy customer needs and preferences or provide cost or other advantages.Developing new products is a costly, lengthy and uncertain process. A potential product may not be brought to market for any number ofreasons, including failure to work optimally, failure to receive regulatory approval, failure to be cost-competitive, infringement of patents orother intellectual property rights and changes in consumer demand. The Group’s products and technologies are also subject to marketingattack by competitors. Furthermore, new products that are developed and marketed by the Group’s competitors may affect price levels in thevarious markets in which the Group’s business units operate. If the Group’s new products do not remain competitive with those ofcompetitors, the Group’s sales revenue could decline.
There is a risk that a major disruptive technology could be introduced into one or more of the Group’s markets and adversely affect its abilityto achieve business plans and targets.
18 2010 Annual Report

Des
crip
tion
ofth
eG
roup
Busi
ness
Revi
ew,
Liqui
dity
and
Pros
pect
sCo
rpor
ate
Gov
erna
nce
Stat
emen
tD
irect
ors’
Rem
uner
atio
nRe
port
Gro
upA
ccou
nts
Com
pany
Acc
ount
sIn
vest
orIn
form
atio
n
External RiskDependence on Government and Other Funding
In most markets throughout the world, expenditure on medical devices is ultimately controlled to a large extent by governments. Funds maybe made available or withdrawn from healthcare budgets depending on government policy. The Group is therefore largely dependent onfuture governments providing increased funds commensurate with the increased demand arising from demographic trends.
Pricing of the Group’s products is governed in most major markets largely by governmental reimbursement authorities. Initiatives sponsoredby government agencies, legislative bodies and the private sector to limit the growth of healthcare costs, including price regulation, excisetaxes and competitive pricing, are ongoing in markets where the Group has operations. This control may be exercised by determining pricesfor an individual product or for an entire procedure. The Group is exposed to changes in reimbursement policy, tax policy and pricing whichmay have an adverse impact on sales and operating profit. In particular, recent changes to the health care legislation in the US are due toimpose significant taxes on medical device manufacturers from 2013. There may be an increased risk of adverse changes to governmentfunding policies arising from the deterioration in macro-economic conditions in some of the Group’s markets.
The Group must adhere to the rules laid down by government agencies that fund or regulate health care, including extensive and complexrules in the US. Failure to do so could result in fines or loss of future funding.
World Economic Conditions
Demand for the Group’s products is driven by demographic trends, including the ageing population and the incidence of osteoporosis andobesity. Supply of, use of and payment for the Group’s products are also influenced by world economic conditions which could placeincreased pressure on demand and pricing, adversely impacting the Group’s ability to deliver revenue and margin growth. The conditionscould favour larger, better capitalised groups, with higher market shares and margins. As a consequence, the Group’s prosperity is linked togeneral economic conditions and there is a risk of deterioration of the Group’s performance and finances during adverse macro-economicconditions.
During 2010, economic conditions worldwide continued to create several challenges for the Group, including deferrals of joint replacementprocedures, heightened pricing pressures and significant declines in capital equipment expenditures at hospitals. These factors temperedthe overall growth of the Group’s global markets and could have an increased impact on growth in the future.
Political Uncertainties
The Group operates on a worldwide basis and has distribution channels, purchasing agents and buying entities in over 90 countries.Political upheaval in some of those countries or in surrounding regions may impact the Group’s results of operations. Political changes in acountry could prevent the Group from receiving remittances of profit from a member of the Group located in that country or from selling itsproducts or investments in that country. Furthermore, changes in government policy regarding import quotas, taxation or other matters couldadversely affect the Group’s turnover and operating profit. War, terrorist activities or other conflict could also adversely impact the Group.
Currency Fluctuations
The Group uses the US Dollar as its reporting currency and the US Dollar is the functional currency of Smith & Nephew plc. In 2010, 43%(2009 – 44%) of Group revenue arose in the US, 26% (2009 – 27%) in Continental Europe, 24% (2009 – 21%) in Africa, Asia, Australia,Canada, New Zealand and Latin America, and 7% (2009 – 8%) in the UK.
The Group’s manufacturing cost base is situated principally in the US, the UK, China and Switzerland, from which finished products areexported to the Group’s selling operations worldwide. Thus, the Group is exposed to fluctuations in exchange rates between the US Dollar,Sterling and Swiss Franc and the currencies of the Group’s selling operations, particularly the Euro, Australian Dollar and Japanese Yen. Ifthe US Dollar, Sterling or Swiss Franc should strengthen against the Euro, Australian Dollar and the Japanese Yen, the Group’s tradingmargin could be adversely affected.
Stock Market Valuations
Changing market conditions, both within the medical devices sector and in stock prices in general, may lead to volatility in the share price, ora stock market valuation of the Group which is materially less than the Group’s intrinsic value. This may lead to difficulties in makingacquisitions, an increased vulnerability to takeovers at below intrinsic value, and loss of value for our shareholders.
2010 Annual Report 19
Operational RiskManufacturing and Supply
The Group’s manufacturing production is concentrated at 11 main facilities in Memphis, Tennessee, Mansfield, Massachusetts andOklahoma City, Oklahoma in the US, Hull, Warwick and Gilberdyke in the UK, Aarau in Switzerland, Tüttlingen in Germany, Alberta in Canadaand Suzhou and Beijing in China. If major physical disruption took place at any of these sites, it could adversely affect the results ofoperations. Physical loss and consequential loss insurance is carried to cover such risks but is subject to limits and deductibles and may notbe sufficient to cover catastrophic loss.
Management of orthopaedic inventory is complex, particularly forecasting and production planning. There is a risk that failures in operationalexecution could lead to excess inventory or individual product shortages.
Each of the business units is reliant on certain key suppliers of raw materials, components, finished products and packaging materials.These suppliers must provide the materials and perform the activities to the Group’s standard of quality requirements. If any of thesesuppliers is unable to meet the Group’s needs, compromises on standards of quality or substantially increases its prices, Smith & Nephewwould need to seek alternative suppliers. There can be no assurance that alternative suppliers would provide the necessary raw materialson favourable or cost-effective terms at the desired quality. Consequently, the Group may be forced to pay higher prices to obtain rawmaterials, which it may not be able to pass on to its customers in the form of increased prices for its finished products. In addition, some ofthe raw materials used may become unavailable, and there can be no assurance that the Group will be able to obtain suitable and cost-effective substitutes. Any interruption of supply caused by these or other factors could negatively impact Smith & Nephew’s revenue andoperating profit.
The Group uses a variety of information systems to conduct its manufacturing, supply and selling operations. An unrecoverable fault in oneof these systems could disrupt trading in certain markets and locations.
The Group is in the process of outsourcing to third parties or relocating to lower cost countries certain of its manufacturing processes. As aresult of these transfers, there is a risk of disruption to supply.
Attracting and Retaining Key Personnel
The Group’s continued development depends on its ability to hire and retain highly skilled personnel with particular expertise. This is critical,particularly in general management, research, new product development and in the sales forces. If Smith & Nephew is unable to retain keypersonnel in general management, research and new product development or if its largest sales forces suffer disruption or upheaval, itssales and operating profit would be adversely affected. Additionally, if the Group is unable to recruit, hire, develop and retain a talented,competitive workforce, it may not be able to meet its strategic business objectives.
Proprietary Rights and Patents
Due to the technological nature of medical devices and the Group’s emphasis on serving its customers with innovative products, the Grouphas been subject to patent infringement claims and is subject to the potential for additional claims.
Claims asserted by third parties regarding infringement of their intellectual property rights, if successful, could require the Group toexpend time and significant resources to pay damages, develop non-infringing products or obtain licences to the products which are thesubject of such litigation, thereby affecting the Group’s growth and profitability. Smith & Nephew attempts to protect its intellectual propertyand regularly opposes third party patents and trademarks where appropriate in those areas that might conflict with the Group’s businessinterests. If Smith & Nephew fails to protect and enforce its intellectual property rights successfully, its competitive position could suffer,which could harm its results of operations.
Product Liability Claims and Loss of Reputation
The development, manufacture and sale of medical devices entail risk of product liability claims or recalls. Design and manufacturing defectswith respect to products sold by the Group or by companies it has acquired could damage, or impair the repair of, body functions. TheGroup may become subject to liability, which could be substantial, because of actual or alleged defects in its products. In addition, productdefects could lead to the need to recall from the market existing products, which may be costly and harmful to the Group’s reputation.
There can be no assurance that customers, particularly in the US, the Group’s largest geographical market, will not bring product liability orrelated claims that would have a material adverse effect on the Group’s financial position or results of operations in the future, or that theGroup will be able to resolve such claims within insurance limits.
20 2010 Annual Report

Des
crip
tion
ofth
eG
roup
Busi
ness
Revi
ew,
Liqui
dity
and
Pros
pect
sCo
rpor
ate
Gov
erna
nce
Stat
emen
tD
irect
ors’
Rem
uner
atio
nRe
port
Gro
upA
ccou
nts
Com
pany
Acc
ount
sIn
vest
orIn
form
atio
n
Compliance and Reporting RiskRegulatory Compliance in the Healthcare Industry
Business practices in the healthcare industry are subject to regulation and review by various government authorities. In general, the trend inmany countries in which the Group does business is towards higher expectations and increased enforcement activity by governmentalauthorities. In the UK, a new Bribery Act was adopted in 2010 that will increase risks for companies that allow improper conduct on theirbehalf. While the Group is committed to doing business with integrity and welcomes the trend to higher standards in the healthcare industry,the Group and other companies in the industry have been subject to investigations and other enforcement activity that have incurred andmay continue to incur significant expense. See “Legal Proceedings”. Under certain circumstances, if the Group were found to have violatedthe law, its ability to sell its products to certain customers could be restricted.
Regulatory Approvals and Controls
The medical device industry is highly regulated. Regulatory requirements are a major factor in determining whether substances andmaterials can be developed into marketable products and the amount of time and expense that should be allotted to such development. TheGroup is required to comply with a wide range of regulatory controls over the manufacturing, testing, distribution, marketing and sale of itsproducts, particularly in the US, Europe and China. Such controls have become increasingly demanding and costly to comply with andmanagement believes that this trend will continue. At any time, the Group is awaiting a number of regulatory approvals which, if notreceived, could adversely affect results of operations. Regulatory approval of new products and new materials is required in most countriesin which the Group operates, although a single approval may be obtained for all countries within the European Union. Regulatory approval ofnew products may entail a lengthy process, particularly if materials are employed which have not previously been used in similar products.In the US, the 510(k) process by which many of the Group’s products are cleared for sale may be revised in ways that could lead to delays orincreased costs. See “Regulation”.
Failure to comply with these regulatory requirements could have a number of adverse consequences, including withdrawal of approval tosell a product in a country, temporary closure of a manufacturing facility, fines and potential damage to company reputation.
Other Risk FactorsSmith & Nephew is subject to a number of other risks, which are common to most global medical technology groups and are reviewed aspart of the Group’s risk management process.
EXCHANGE AND INTEREST RATE RISK AND FINANCIAL INSTRUMENTSThe Board of directors of the Company has established a set of policies to manage funding, currency and interest rate risks. Derivativefinancial instruments are used only to manage the financial risks associated with underlying business activities and their financing. See Note20 of the Notes to the Group accounts for further details of these risks.
The Group’s financial instruments are subject to changes in fair values as a result of changes in market rates of exchange and forwardinterest rates. Financial instruments entered into to hedge sales and purchase transactions in foreign currency and interest rate exposuresare accounted for as hedges. Changes in fair values of effective financial instruments would not affect the Group’s income statementimmediately. The movements in the fair value of financial instruments that are not accounted for as hedges offset movements in the valuesof assets and liabilities and are recognised through the income statement. The net impact of these changes in fair value on the Group’sincome statement is not significant.
2010 Annual Report 21

THIS PAGE INTENTIONALLY LEFT BLANK
22 2010 Annual Report

Des
crip
tion
ofth
eG
roup
Busi
ness
Revi
ew,
Liqui
dity
and
Pros
pect
sCo
rpor
ate
Gov
erna
nce
Stat
emen
tD
irect
ors’
Rem
uner
atio
nRe
port
Gro
upA
ccou
nts
Com
pany
Acc
ount
sIn
vest
orIn
form
atio
n
BUSINESS REVIEW, LIQUIDITY AND PROSPECTSThe Business Review, Liquidity and Prospects discusses the operating and financial performance of the Group, including the financialoutlook and the financial resources of the Group, under the following headings:
Business Overview 242010 Year 292009 Year 34Financial Position, Liquidity and Capital Resources 39Legal Proceedings 41Outlook and Trend Information 43Contractual Obligations 44Off-balance Sheet Arrangements 44Related Party Transactions 44
The results for each year are compared primarily with the results for the preceding year.
2010 Annual Report 23

BUSINESS OVERVIEWSmith & Nephew’s operations are organised into three primary business units that operate globally: Orthopaedics, Endoscopy andAdvanced Wound Management. Smith & Nephew believes that its businesses have opportunities for strong growth due to its marketsbenefiting from an ageing population, an increase in active lifestyles, trends toward less invasive medical procedures and the increasingdemand in emerging markets.
Revenue by business segment as a percentage of total revenue was as follows:
2010%
2009%
2008%
Orthopaedics 55 57 57Endoscopy 22 21 21Advanced Wound Management 23 22 22
Total revenue 100 100 100
Revenue by geographic market as a percentage of total revenue was as follows:
2010%
2009%
2008%
United States 43 44 44Europe (Continental Europe and United Kingdom) 33 35 36Africa, Asia and Australia and Other America 24 21 20
Total revenue 100 100 100
Underlying Growth in Revenue“Underlying growth in revenue” is a non-GAAP financial measure which is a key performance indicator used by the Group’s management inorder to compare the revenue in a given year to that of the previous year on a like-for-like basis. This is achieved by adjusting for the impactboth of sales of products acquired in material business combinations and for movements in exchange rates. The Group’s management usesthis non-GAAP measure in its internal financial reporting, budgeting and planning to assess performance on both a business segment and aconsolidated Group basis.
“Underlying growth in revenue” reconciles to growth in revenue reported in accordance with IFRS by making two adjustments, the “constantcurrency exchange effect” and the “acquisitions effect”, described below. The material limitation of the underlying growth in revenuemeasure is that it excludes certain factors, described above, which do ultimately have a significant impact on total revenues. The Groupmeasures the performance of local managers using underlying growth in revenue whilst the Group’s management additionally considersGAAP revenue each quarter and further assesses the excluded items by monitoring against internal budget amounts.
The “constant currency exchange effect” is a measure of the increase/decrease in revenue resulting from currency movements on non-USDollar sales. This is measured as the difference between the increase in revenue translated into US Dollars on a GAAP basis (i.e. currentyear revenue translated at the current year average rate, prior year revenue translated at the prior year average rate) and the increasemeasured by translating current and prior year revenue into US Dollars using the prior year closing rate.
The “acquisitions effect” is the measure of the impact on revenue from newly acquired business combinations. This is calculated byexcluding the revenue from sales of products acquired as a result of a business combination consummated in the current year, with non-USDollar sales translated at the prior year average rate. Additionally, prior year revenue is adjusted to include a full year of revenue from thesales of products acquired in those business combinations consummated in the previous year, calculated by adding back revenue fromsales of products in the period prior to the Group’s ownership. These sales are separately tracked in the Group’s internal reporting systemsand are readily identifiable.
24 2010 Annual Report

Des
crip
tion
ofth
eG
roup
Busi
ness
Revi
ew,
Liqui
dity
and
Pros
pect
sCo
rpor
ate
Gov
erna
nce
Stat
emen
tD
irect
ors’
Rem
uner
atio
nRe
port
Gro
upA
ccou
nts
Com
pany
Acc
ount
sIn
vest
orIn
form
atio
n
Underlying growth in revenue in 2010 by business segment reconciles to reported growth, the most directly comparable financial measurecalculated in accordance with IFRS, as follows:
Reportedgrowth
%
Constantcurrency
exchangeeffect
%
Underlyinggrowth
%
Orthopaedics 3 (1) 2Endoscopy 8 (1) 7Advanced Wound Management 8 (1) 7
Total revenue 5 (1) 4
Underlying growth in revenue by business segment reconciles to reported growth in 2009 as follows:
Reportedgrowth
%
Constantcurrency
exchangeeffect
%
Underlyinggrowth
%
Orthopaedics (1) 2 1Endoscopy (1) 2 1Advanced Wound Management - 6 6
Total revenue (1) 3 2
Trading ProfitTrading profit is a trend measure which presents the long-term profitability of the Group excluding the impact of specific transactions thatmanagement considers affect the Group’s short-term profitability. The Group presents this measure to assist investors in theirunderstanding of trends. The Group has identified the following items, where material, as those to be excluded from operating profit whenarriving at trading profit: acquisition and disposal related items including amortisation of acquisition intangible assets and impairments;significant restructuring events; and gains and losses resulting from legal disputes and uninsured losses.
Trading profit in 2010 reconciles to operating profit, the most directly comparable financial measure calculated in accordance with IFRS, asfollows:
Operatingprofit
$ million
Restructuringand
rationalisationcosts
$ million
Amortisationof acquisition
intangiblesand
impairments$ million
Trading profit$ million
Orthopaedics 503 8 25 536Endoscopy 197 2 1 200Advanced Wound Management 220 5 8 233
Total 920 15 34 969
2010 Annual Report 25

Trading profit reconciles to operating profit in 2009 as follows:
Operatingprofit
$ million
Acquisitionrelated costs
$ million
Restructuringand
rationalisationcosts
$ million
Amortisationof acquisition
intangiblesand
impairments$ million
Tradingprofit
$ million
Orthopaedics 410 26 26 46 508Endoscopy 169 - 5 15 189Advanced Wound Management 144 - 11 5 160
Total 723 26 42 66 857
Trading profit by business segment as a percentage of total trading profit was as follows:
2010%
2009%
2008%
Orthopaedics 55 59 62Endoscopy 21 22 21Advanced Wound Management 24 19 17
Total trading profit 100 100 100
Operating profit by business segment as a percentage of total operating profit was as follows.
2010%
2009%
2008%
Orthopaedics 55 57 61Endoscopy 21 23 23Advanced Wound Management 24 20 16
Total operating profit 100 100 100
Adjusted Earnings per Ordinary ShareAdjusted earnings per Ordinary Share is a trend measure which presents the long-term profitability of the Group excluding the impact ofspecific transactions that management considers affect the Group’s short-term profitability. The most comparable financial measurecalculated in accordance with IFRS is earnings per Ordinary share. The Group presents this measure to assist investors in theirunderstanding of trends. Adjusted attributable profit is the numerator used for this measure.
Adjusted attributable profit is reconciled to attributable profit as follows:
2010$ million
2009$ million
2008$ million
Attributable profit for the year 615 472 377Acquisition related costs - 26 61Restructuring and rationalisation expenses 15 42 34Amortisation of acquisition intangibles and impairments 34 66 51Taxation on excluded items (10) (26) (30)
Adjusted attributable profit 654 580 493
Earnings per Ordinary shareBasic 69.3¢ 53.4¢ 42.6¢Diluted 69.2¢ 53.3¢ 42.4¢Adjusted: Basic 73.6¢ 65.6¢ 55.6¢Adjusted: Diluted 73.6¢ 65.5¢ 55.4¢
26 2010 Annual Report

Des
crip
tion
ofth
eG
roup
Busi
ness
Revi
ew,
Liqui
dity
and
Pros
pect
sCo
rpor
ate
Gov
erna
nce
Stat
emen
tD
irect
ors’
Rem
uner
atio
nRe
port
Gro
upA
ccou
nts
Com
pany
Acc
ount
sIn
vest
orIn
form
atio
n
Trading Cash Flow and Trading Profit to Cash Conversion RatioGrowth in trading cash flow and improvement in the trading profit to cash conversion ratio are measures which present the trend growth inthe long-term cash generation of the Group excluding the impact of specific transactions or events that management considers affect theGroup’s short-term performance.
Trading cash flow is defined as cash generated from operations less net capital expenditure but before acquisition related cash flows,restructuring and rationalisation cash flows and cash flows arising from legal disputes and uninsured losses. Trading profit to cashconversion ratio is trading cash flow expressed as a percentage of trading profit.
The Group presents those measures to assist investors in their understanding of trends. The Group’s internal financial reporting (budgets,monthly reporting, forecasts, long-term planning and incentive plans) focuses on cash generation before these items. Trading cash flow andtrading profit to cash conversion ratio are non-GAAP financial measures.
Trading cash flow reconciles to cash generated from operations, the most directly comparable financial measure calculated in accordancewith IFRS, as follows:
2010$ million
2009$ million
2008$ million
Cash generated from operations 1,111 1,030 815Less: Capital expenditure (315) (318) (292)Add: Cash received on disposal of fixed assets 8 - 3Add: Acquisition related expenditure - 22 48Add: Restructuring and rationalisation related expenditure 16 32 28Add: Macrotexture expenditure 5 5 10
Trading cash flow 825 771 612
Trading Profit 969 857 776
Trading profit to cash conversion ratio (%) 85% 90% 79%
Factors Affecting Smith & Nephew’s Results of OperationsSales Trends
Smith & Nephew’s business units participate in the global medical devices market and share a common focus on the repair of humantissue. Smith & Nephew’s principal geographic markets are in the well-developed healthcare economies of the US, Europe, Japan andAustralia.
These markets are characterised by an increase in the average age of the population caused by the immediate post-World War II “babyboomer” generation approaching retirement, increased longevity, more active lifestyles, obesity and increased affluence. Together thesefactors have created significant demand for more effective healthcare products which deliver improved outcomes through technologyadvances. Furthermore, pressure to resist increases in overall healthcare spending has led healthcare providers to demand products whichminimise the length of hospital stays and use of surgeon and nursing resources.
Increasing consumer awareness of available healthcare treatments through the Internet and direct-to-customer advertising has led toincreased consumer influence over product purchasing decisions.
For a description of the impact on each business unit refer to the Market and Competition sections under ‘Business Description’ on pages 4to 9.
Innovation
The Group must continually develop its existing and new technologies and bring new products to its customers to drive sales growth.Expenditure on research and development in 2010 represented approximately 4% (2009 – 4%) of Group revenue. The focus of Smith &Nephew’s innovation is to create new products and surgical techniques with distinct advantages in clinical performance and cost-effectiveness benefits for clinicians, patients and healthcare providers.
2010 Annual Report 27

Currency Movements
Smith & Nephew’s results of operations are affected by transactional exchange rate movements in that they are subject to exposures arisingfrom revenue in a currency different from the related costs and expenses. The Group manages the impact of exchange rate movements onsales and cost of goods sold by a policy of transacting forward foreign currency commitments when firm purchase orders are placed. Inaddition, the Group’s policy is for forecast transactions to be covered between 50% and 90% for up to one year.
The Group’s revenues, profits and earnings are also affected by exchange rate movements on the translation of results of operations inforeign subsidiaries for financial reporting purposes. This exposure is offset partly because the Group incurs interest in currencies otherthan US Dollars on its indebtedness denominated in currencies other than US Dollars. See “Financial Position, Liquidity and CapitalResources” on page 39.
Governmental economic, fiscal, monetary and political policies and factors that materially affect the Group’s operations or investments ofshareholders are discussed in “Regulation,” “External Risk”, “Compliance and Reporting Risk”, “Taxation information for shareholders” onpages 12, 19, 21 and 145-146, respectively, and elsewhere in this Annual Report.
Critical Accounting PoliciesThe Group’s significant accounting policies are set out in Note 2 of the Notes to the Group Accounts. Of those, the policies which require themost use of management’s judgment are as follows:
Inventories
A feature of the Orthopaedics business (whose finished goods inventory makes up approximately 78% of the Group total finished goodsinventory) is the high level of product inventory required, some of which is located at customer premises and is available for customers’immediate use. Complete sets of product, including large and small sizes, have to be made available in this way. These sizes are used lessfrequently than standard sizes and towards the end of the product life cycle are inevitably in excess of requirements. Adjustments tocarrying value are therefore required to be made to orthopaedic inventory to anticipate this situation. These adjustments are calculated inaccordance with a formula based on levels of inventory compared with historical usage. This formula is applied on an individual product linebasis and is first applied when a product group has been on the market for two years. This method of calculation is considered appropriatebased on experience, but it does involve management judgements on effectiveness of inventory deployment, length of product lives,phase-out of old products and efficiency of manufacturing planning systems.
Impairment
In carrying out impairment reviews of goodwill, intangible assets and property, plant and equipment a number of significant assumptionshave to be made when preparing cash flow projections. These include the future rate of market growth, the market demand for the productsacquired, the future profitability of acquired businesses or products, levels of reimbursement and success in obtaining regulatory approvals.If actual results should differ or changes in expectations arise, impairment charges may be required which would adversely impact operatingresults.
Retirement Benefits
A number of key judgements have to be made in calculating the fair value of the Group’s defined benefit pension plans. These assumptionsimpact the Balance Sheet liability, operating profit and other finance income/costs. The most critical assumptions are the discount rate andmortality assumptions to be applied to future pension plan liabilities. For example as of 31 December 2010, a 0.5% increase in discount ratewould have reduced the combined UK and US pension plan deficit by $84m whilst a 0.5% decrease would have increased the combineddeficit by $93m. A 0.5% increase in discount rate would have decreased profit before taxation by $2m whilst a 0.5% decrease would haveincreased it by $2m. A one year increase in the assumed life expectancy of the average 60 year old male pension plan member in both theUK and US would have increased the combined deficit by $33m. In making these judgements, management takes into account the advice ofprofessional external actuaries and benchmarks its assumptions against external data.
The discount rate is determined by reference to market yields on high quality corporate bonds, with currency and term consistent with thoseof the liabilities. In particular for the UK and US, the discount rate is derived by reference to a AA yield curve derived by the Group’s actuarialadvisers.
See Note 33 of the Notes to the Group Accounts for a summary of how the assumptions selected in the last five years have compared withactual results.
28 2010 Annual Report

Des
crip
tion
ofth
eG
roup
Busi
ness
Revi
ew,
Liqui
dity
and
Pros
pect
sCo
rpor
ate
Gov
erna
nce
Stat
emen
tD
irect
ors’
Rem
uner
atio
nRe
port
Gro
upA
ccou
nts
Com
pany
Acc
ount
sIn
vest
orIn
form
atio
n
Contingencies and Provisions
The recognition of provisions for legal disputes is subject to a significant degree of estimation. Provision is made for loss contingencieswhen it is considered probable that an adverse outcome will occur and the amount of the loss can be reasonably estimated. In making itsestimates, management takes into account the advice of internal and external legal counsel. Provisions are reviewed regularly and amountsupdated where necessary to reflect developments in the disputes. The ultimate liability may differ from the amount provided depending onthe outcome of court proceedings and settlement negotiations or if investigations bring to light new facts.
The Group operates in numerous tax jurisdictions around the world. Although it is Group policy to submit its tax returns to the relevant taxauthorities as promptly as possible, at any given time the Group has unagreed years outstanding and is involved in disputes and tax audits.Significant issues may take several years to resolve. In estimating the probability and amount of any tax charge, management takes intoaccount the views of internal and external advisors and updates the amount of provision whenever necessary. The ultimate tax liability maydiffer from the amount provided depending on interpretations of tax law, settlement negotiations or changes in legislation.
2010 YEARThe following discussion and analysis is based upon, and should be read in conjunction with, the Group Accounts of Smith & Nephewincluded elsewhere in this Annual Report.
Financial Highlights of 2010Group revenue was $3,962m for the year ended 31 December 2010, representing a 5% growth compared to 2009. This comprised ofunderlying revenue growth of 4% and favourable currency translation of 1%.
Profit before taxation was $895m in 2010, compared with $670m in 2009. Attributable profit was $615m compared to $472m in 2009.Adjusted attributable profit (calculated as set out in “Selected Financial Data”) rose 13% to $654m in 2010, from $580m in 2009.
Basic earnings per Ordinary Share were 69.3¢, compared to 53.4¢ for 2009. EPSA (as set out in “Selected Financial Data”) was 73.6¢ in2010 compared to 65.6¢ for 2009, representing a 12% increase.
Fiscal 2010 Compared with Fiscal 2009The following table sets out certain income statement data for the periods indicated:
2010$ million
2009$ million
Revenue (i) 3,962 3,772Cost of goods sold (ii) (1,031) (1,030)
Gross profit 2.931 2,742Marketing, selling and distribution expenses (iii) (1,414) (1,351)Administrative expenses (iv) (446) (513)Research and development expenses (151) (155)
Operating profit (i) 920 723Net interest payable (15) (40)Other finance costs (10) (15)Share of results of associates - 2
Profit before taxation 895 670Taxation (280) (198)
Attributable profit for the year 615 472
(i) Group revenue and operating profit are derived wholly from Continuing Operations and discussed on a segment basis on pages 32 to 34.(ii) In 2010 no restructuring and rationalisation expenses and no acquisition related costs were charged to cost of goods sold (2009 – $15m of
restructuring and rationalisation expenses and $12m of acquisition related costs).(iii) 2010 includes $3m of restructuring and rationalisation expenses. No acquisition related costs were charged to Marketing, selling and
distribution in 2010. (2009 – $7m of acquisition related costs and $10m of restructuring and rationalisation expenses).(iv) 2010 includes $12m of restructuring and rationalisation expenses and $34m relating to amortisation of acquisition intangibles and impairments
(2009 – $7m of acquisition related costs, $17m of restructuring and rationalisation expenses and $66m relating to amortisation of acquisitionintangibles and impairments).
2010 Annual Report 29

Transactional and Translational Exchange
The Group’s principal markets outside the US are, in order of significance, Continental Europe, UK, Australia and Japan. Revenues in thesemarkets fluctuate when translated into US Dollars on consolidation. During the year, the average rates of exchange against the US Dollarused to translate revenues and profits arising in these markets changed compared to the previous year as follows: the Euro decreased from$1.39 to $1.32 (5%), Sterling decreased from $1.56 to $1.54 (1%), the Swiss Franc increased from $0.92 to $0.96 (4%), the Australian Dollarincreased from $0.78 to $0.92 (18%) and the Japanese Yen increased from ¥94 to ¥88 (6%).
The Group’s principal manufacturing locations are in the US (Orthopaedics and Endoscopy), Switzerland (Orthopaedics), UK (AdvancedWound Management and Orthopaedics) and China (Orthopaedics and Advanced Wound Management). The majority of the Group’s sellingand distribution subsidiaries around the world purchase finished products from these locations. As a result of currency movementscompared with the previous year, purchases from the US became relatively more expensive for Europe and the UK and relatively lessexpensive for Australia, Japan and Switzerland. The Group’s policy of purchasing forward a proportion of its currency requirements mitigatedthe impact of these movements.
Revenue
Group revenue increased by $190m (5%) from $3,772m in 2009 to $3,962m in 2010. Underlying revenue growth was 4%, and a further 1%growth was attributable to favourable currency translation.
Orthopaedics revenues increased by $60m (3%), of which 2% was attributable to underlying growth, and 1% due to favourable currencytranslation. Endoscopy revenues increased by $64m (8%), of which 7% was attributable to underlying growth, and 1% due to favourablecurrency translation. Advanced Wound Management revenues increased by $66m (8%), of which 7% was attributable to underlying growthand 1% due to favourable currency translation.
A more detailed analysis is included within the Revenue sections of the individual business segments that follow on pages 32 and 34.
Cost of goods sold
Cost of goods sold increased by $1m to $1,031m from $1,030m in 2009. This represents 26% of revenue compared to 27% in 2009. During2010, the Group has continued to deliver on its efficiency commitments, including our new Advanced Wound Management manufacturingfacility in China and improved inventory management in Orthopaedics. Other factors contributing to the movement were the decrease of$15m in restructuring and rationalisation expenses and decrease of $12m in other acquisition related costs. Currency had little impact onthe year on year movement.
Further margin analysis is included within the “Trading profit” sections of the individual business segments that follow on pages 32 to 34.
Marketing, selling and distribution expenses
These expenses increased by $63m (5%) to $1,414m from $1,351m in 2009. In line with increased revenue there has been a 4%underlying increase in advertising, marketing and selling costs. Unfavourable currency movements have contributed to the remaining 1%movement.
Administrative expenses
Administrative expenses decreased by $67m (-13%) to $446m from $513m in 2009. The principal factors contributing to the underlyingmovement of -14% were a $32m reduction in the amortisation and impairment charge of intangible assets, a $7m reduction in acquisitionrelated costs and a decrease of $5m in restructuring and rationalisation expenses. This was partially offset by a 1% unfavourable movementin currency.
Research and development expenses
Expenditure as a percentage of revenue decreased by 0.3% to 3.8% in 2010 (2009 – 4.1%). The Group continues to invest in innovativetechnologies and products to differentiate itself from competitors.
Operating profit
Operating profit increased by $197m to $920m from $723m in 2009 comprising increases of $93m in Orthopaedics, $28m in Endoscopyand $76m in Advanced Wound Management.
30 2010 Annual Report

Des
crip
tion
ofth
eG
roup
Busi
ness
Revi
ew,
Liqui
dity
and
Pros
pect
sCo
rpor
ate
Gov
erna
nce
Stat
emen
tD
irect
ors’
Rem
uner
atio
nRe
port
Gro
upA
ccou
nts
Com
pany
Acc
ount
sIn
vest
orIn
form
atio
n
Net interest payable
Net interest payable reduced by $25m from $40m in 2009 to $15m in 2010. This is a consequence of the overall reduction of borrowingswithin the Group and a reduction in the applicable interest rates.
Other finance cost
Other finance costs in 2010 were $10m compared to $15m in 2009. This decrease is attributable to an increase in the expected return onpension plan assets.
Taxation
The taxation charge increased by $82m to $280m from $198m in 2009. The effective rate of tax was 31.3%, compared with 29.6% in 2009.
The tax charge was reduced by $10m in 2010 (2009 – $26m) as a consequence of restructuring and rationalisation expenses, acquisitionrelated costs, amortisation of acquisition intangibles and impairments. The effective tax rate was 30.8% (2009 – 27.9%) after adjusting forthese items and the tax thereon.
Group Balance Sheet
The following table sets out certain balance sheet data as at 31 December of the years indicated:
2010$million
2009$million
Non-current assets 2,579 2,480Current assets 2,154 2,071Assets held for sale - 14
Total assets 4,733 4,565
Non-current liabilities 1,046 1,523Current liabilities 914 863
Total liabilities 1,960 2,386Total equity 2,773 2,179
Total equity and liabilities 4,733 4,565
Non-current assets increased by $99m to $2,579m from $2,480 in 2009. Intangible assets and goodwill increased by $22m of which $65mrelated to additions of intangibles, $28m related to favourable currency translation and $2m of transfers. These were partially offset by $68mof amortisation and a $4m adjustment to contingent consideration. Property, plant and equipment increased by $34m comprising $250m ofadditions and $3m of favourable currency translation, partially offset by $203m of depreciation charge, $14m of disposals and $2m oftransfers. Deferred tax assets and other non-current assets increased by $43m in the year.
Current assets increased by $83m to $2,154m from $2,071m in 2009. This was due to an increase in trade and other receivables of $78mand an increase in cash at bank of $15m. These increases were partially offset by a reduction in inventories of $10m.
Non-current liabilities decreased by $477m from $1,523m in 2009 to $1,046m in 2010. $448m of this decrease was due to the reduction oflong-term borrowings. The net retirement benefit obligation decreased by $60m. This was largely due to the excess of pension contributionstotalling $65m over the charge to the income statement in the year of $35m which gave rise to a net $30m reduction in the liability. Inaddition, there were actuarial gains totalling $26m. Other movements in non-current liabilities related to a reduction in deferred acquisitionconsideration of $27m due to settlement of the BlueSky Medical Group, Inc (“BlueSky”) deferred consideration, an increase of $38m in thedeferred tax liability and an increase in provisions of $20m due to a change in the expected time frame to settlement which has resulted in areclassification from current liabilities.
Current liabilities increased by $51m from $863m in 2009 to $914m in 2010. This was due to an increase in bank overdrafts and currentborrowings of $12m, an increase in trade and other payables of $21m and an increase in current tax payable of $36m, offset by a decreasein provisions of $18m.
Total equity increased by $594m from $2,179m in 2009 to $2,773m in 2010. The principal movements were an increase of $615m due toattributable profit, currency translation and hedging gains of $53m, an increase of $26m relating to actuarial gains on retirement benefitobligations, offset by a decrease of $7m relating to deferred taxation and a decrease of $132m due to dividends paid during the year.
2010 Annual Report 31

Business Segment Analysis
Revenue by business segment and geographic market and trading and operating profit by business segment are set out below:
2010$ million
2009$ million
Revenue by business segmentOrthopaedics 2,195 2,135Endoscopy 855 791Advanced Wound Management 912 846
Total revenue 3,962 3,772
Revenue by geographic marketUnited States 1,707 1,664Europe (Continental Europe and United Kingdom) 1,315 1,313Africa, Asia, Australasia and other America 940 795
Total revenue 3,962 3,772
Trading profit by business segmentOrthopaedics 536 508Endoscopy 200 189Advanced Wound Management 233 160
Total trading profit 969 857
Operating profit by business segmentOrthopaedics 503 410Endoscopy 197 169Advanced Wound Management 220 144
Total operating profit 920 723
OrthopaedicsRevenue
Orthopaedics revenue increased by 3% to $2,195m from $2,135m in 2009. Of this increase, 2% is attributable to underlying growth and 1%is due to favourable currency movements.
In the US, revenue increased by $22m to $1,176m (2%), all of which was due to underlying growth. The main factors were the continuedgrowth of products launched in the year including VERILAST and VISIONAIRE.
Outside the US, revenue increased by $38m to $1,019m (4%). This movement is attributable to underlying growth of 2% and favourableforeign currency translation of 2%.
Global knee revenue increased by $45m to $806m (6%), representing underlying revenue growth of 5% and favourable foreign currencytranslation of 1%. There has been continued pressure from the challenging environment on higher specification and early intervention hipand knee implant systems. Nevertheless, our knee franchise and in particular our LEGION Knee Systems delivered strong growth. This wasdriven by the FDA clearance to claim that VERILAST bearing technology for knee replacement provides wear performance sufficient for 30years of actual use under typical conditions and by our VISIONAIRE Patient Matched Instrumentation sets.
Global hip revenue increased by $7m to $688m (1%), all of which was due to favourable foreign currency translation. In our hip franchise,both our traditional and new products have continued to perform well, led by the R3 Acetabular System. Sales of BIRMINGHAM HIPResurfacing Systems have been weaker, but we are confident that our programme of reinforcing the superior clinical data with surgeons andpatients will be effective.
Global trauma revenue increased by $20m to $434m (5%), representing underlying revenue growth of 3% and 2% favourable foreigncurrency translation. This improvement is attributable to management’s actions to provide additional support and training to the sales force.
In Clinical Therapies, EXOGEN Ultrasound Bone Healing System achieved double digit revenue growth for the year. Our joint fluid therapiesfranchise continues to perform well despite the increased competitive environment in the US. Early in 2010 we sold our niche painmanagement business and terminated our small spine distribution business in Germany, which reduced our Orthopaedics revenue growthby approximately 1%.
32 2010 Annual Report

Des
crip
tion
ofth
eG
roup
Busi
ness
Revi
ew,
Liqui
dity
and
Pros
pect
sCo
rpor
ate
Gov
erna
nce
Stat
emen
tD
irect
ors’
Rem
uner
atio
nRe
port
Gro
upA
ccou
nts
Com
pany
Acc
ount
sIn
vest
orIn
form
atio
n
Trading profit
Trading profit increased by $28m (6%) to $536m from $508m in 2009. Trading profit margin increased from 23.8% to 24.4%. This increaseis due to cost management and further investment in improving the efficiency and effectiveness of the main processes, primarily in the costof sales area.
Operating profit
Operating profit increased by $93m to $503m. This comprises the increase in trading profit of $28m discussed above, a $26m reduction inacquisition related costs, a reduction of $21m in the amortisation of acquisition intangibles and impairments and an $18m reduction in costsassociated with the Earnings Improvement Programme (“EIP”).
EndoscopyRevenue
Endoscopy revenue increased by $64m, or 8%, to $855m from $791m in 2009, comprising 1% favourable currency translation and 7%underlying growth.
In the US, revenue increased by $4m to $353m (1%), all of which represents underlying growth.
Outside the US, revenue increased by $60m to $502m (14%), of which 11% was underlying growth and 3% was due to favourable foreigncurrency translation.
Global revenue of knee and shoulder repair products increased by $46m to $391m (13%), of which 11% was underlying growth and 2%favourable foreign currency translation.
Revenue in the global resection products sector increased by $17m to $282m (7%), of which 6% represents underlying revenue growth and1% of favourable foreign currency translation. The resection franchise benefited from the introduction of a new range of radio-frequencyablation probes early in the year.
Global Visualisation revenue reduced by $9m to $112m (-7%), of which -9% represents negative underlying growth, partially offset by 2% offavourable foreign currency translation. This decrease reflects the Group’s strategy to only focus on those capital items which are closelyaligned with our core resection and repair businesses.
Trading profit
Trading profit increased by $11m (6%) to $200m from $189m in 2009. Trading profit margin decreased from 23.9% to 23.3%. This reflectsthe increased investment in product development and in the sales force, particularly in the US.
Operating profit
Operating profit increased by $28m to $197m from $169m in 2009. This comprises the $11m increase in trading profit set out above, areduction of $14m in amortisation of acquisition intangibles and impairments and a $3m reduction in restructuring costs.
Advanced Wound ManagementRevenue
Revenue increased by $66m, or 8%, to $912m from $846m in 2009, comprising 1% favourable currency translation and 7% underlyinggrowth. A significant portion of the growth came from our Negative Pressure Wound Therapy (“NPWT”) product range, which we havecontinued to expand to offer customers a wide range of clinical options. Our Exudate and Infection Management franchises continue tobenefit from new products and line extensions.
In the US, revenue increased by $17m to $178m (11%), all of which is attributable to underlying revenue growth.
Outside the US, revenue increased by $49m to $734m (7%). This is represented by an underlying growth of 6% and 1% of favourableforeign currency translation. European revenue increased by $6m to $454m (1%) of which 5% was underlying growth partially offset by 4%of unfavourable currency translation.
2010 Annual Report 33

Trading profit
Trading profit increased by $73m (46%) to $233m from $160m in 2009 and trading profit margin increased from 18.9% to 25.6%. Thesettlement in the year with the vendors of BlueSky Medical Group, Inc with regard to legal expenses in defending our NPWT intellectualproperty position increased trading profit by $25m. During the year, Advanced Wound Management also benefited from a full year’sproduction at the new manufacturing facility in China, reducing manufacturing costs.
Operating profit
Operating profit increased by $76m to $220m. This comprises the increase in trading profit of $73m and a reduction of $6m in restructuringand rationalisation costs partially offset by an increase of $3m in the amortisation of acquisition intangibles following the acquisition ofNucryst in December 2009.
2009 YEARThe following discussion and analysis is based upon, and should be read in conjunction with, the Group Accounts of Smith & Nephewincluded elsewhere in this Annual Report.
Financial Highlights of 2009Group revenue was $3,772m for the year ended 31 December 2009, representing a 1% decline compared to 2008. Unfavourable currencytranslation of -3% was partly offset by underlying revenue growth of 2%.
Profit before taxation was $670m in 2009, compared with $564m in 2008. Attributable profit was $472m compared with $377m in 2008.Adjusted attributable profit (calculated as set out in “Selected Financial Data”), rose 18% to $580m in 2009, from $493m in 2008.
Basic earnings per Ordinary Share were 53.4¢, compared to 42.6¢ for 2008. EPSA (as set out in “Selected Financial Data”) was 65.6¢ in2009 compared, to 55.6¢ for 2008, representing an 18% increase.
Fiscal 2009 Compared with Fiscal 2008The following table sets out certain income statement data for the periods indicated:
2009$ million
2008$ million
Revenue (i) 3,772 3,801Cost of goods sold (ii) (1,030) (1,077)
Gross profit 2,742 2,724Marketing, selling and distribution expenses (iii) (1,351) (1,416)Administrative expenses (iv) (513) (526)Research and development expenses (155) (152)
Operating profit (i) 723 630Net interest payable (40) (66)Other finance costs (15) (1)Share of results of associates 2 1
Profit before taxation 670 564Taxation (198) (187)
Attributable profit for the year 472 377
(i) Group revenue and operating profit are derived wholly from Continuing Operations and discussed on a segment basis on pages 37 to 38.(ii) 2009 includes $15m of restructuring and rationalisation expenses and $12m of acquisition related costs (2008 – $15m in respect of the
utilisation of Plus inventory stepped-up to fair value on acquisition, $18m of restructuring and rationalisation expenses and $8m of acquisitionrelated costs).
(iii) 2009 includes $7m of acquisition related costs and $10m of restructuring and rationalisation expenses (2008 – $7m of acquisition related costsand $3m of restructuring and rationalisation expenses).
(iv) 2009 includes $7m of acquisition related costs, $17m of restructuring and rationalisation expenses and $66m relating to amortisation ofacquisition intangibles and impairments (2008 – $31m of acquisition related costs, $13m of restructuring and rationalisation expenses and$51m amortisation of acquisition intangibles and impairments).
34 2010 Annual Report

Des
crip
tion
ofth
eG
roup
Busi
ness
Revi
ew,
Liqui
dity
and
Pros
pect
sCo
rpor
ate
Gov
erna
nce
Stat
emen
tD
irect
ors’
Rem
uner
atio
nRe
port
Gro
upA
ccou
nts
Com
pany
Acc
ount
sIn
vest
orIn
form
atio
n
Transactional and Translational Exchange
The Group’s principal markets outside the US are, in order of significance, Continental Europe, UK, Australia and Japan. Revenues in thesemarkets fluctuate when translated into US Dollars on consolidation. During the year, the average rates of exchange against the US Dollarused to translate revenues and profits arising in these markets changed compared to the previous year as follows: the Euro weakened from$1.46 to $1.39 (-5%), Sterling weakened from $1.84 to $1.56 (-15%), the Swiss Franc remained flat at $0.92, the Australian Dollar weakenedfrom $0.84 to $0.78 (-7%) and the Japanese Yen strengthened from ¥103 to ¥94 (+9%).
The Group’s principal manufacturing locations are in the US (Orthopaedics and Endoscopy), Switzerland (Orthopaedics) and UK (AdvancedWound Management and Orthopaedics). The majority of the Group’s selling and distribution subsidiaries around the world purchasefinished products from these locations. As a result of currency movements compared with the previous year, purchases from the US becamerelatively more expensive. The Group’s policy of purchasing forward a proportion of its currency requirements mitigates the impact of thesemovements.
Revenue
Group revenue decreased by $29m (-1%) from $3,801m in 2008 to $3,772m in 2009. Underlying revenue growth was 2%, offset by -3%attributable to unfavourable currency translation.
Orthopaedics revenues decreased by $23m (-1%), of which 1% was attributable to underlying growth, offset by -2% due to unfavourablecurrency translation. Endoscopy revenues decreased by $9m (-1%), of which 1% was attributable to underlying growth, offset by -2% due tounfavourable currency translation. Advanced Wound Management revenues increased by $3m (nil%), of which 6% was attributable tounderlying growth, offset by -6% due to unfavourable currency translation.
A more detailed analysis is included within the Revenue sections of the individual business segments that follow on pages 37 and 38.
Cost of goods sold
Cost of goods sold decreased by $47m to $1,030m from $1,077m in 2008. The main drivers of this decrease are continuing focus on costefficiency, cost effectiveness and the impact of currency. Other factors contributing to the movement were the decrease of $15m inutilisation of the Plus inventory stepped up to fair value on the acquisition, a decrease of $3m in restructuring and rationalisation expenses,offset by an increase of $4m in other acquisition related costs.
Further margin analysis is included within the “Trading profit” sections of the individual business segments that follow on pages 37 to 38.
Marketing, selling and distribution expenses
These expenses decreased by $65m to $1,351m from $1,416m in 2008. The decrease was largely driven by continuing focus on costmanagement, efficiencies achieved through the Earnings Improvement Programme and the impact of currency. These were partly offset byan increase in restructuring and rationalisation expenses of $7m.
Administrative expenses
Administrative expenses decreased by $13m to $513m from $526m in 2008, largely as a result of the focus on cost management andefficiency and the impact of currency. Other factors contributing to the movement were the decrease of $24m in other acquisition relatedcosts, offset by an increase in the amortisation and impairment charge of intangible assets by $15m and an increase of $4m in restructuringand rationalisation expenses.
Research and development expenses
Expenditure as a percentage of revenue increased by 0.1% to 4.1% in 2009 (2008 – 4.0%). The Group continues to invest in innovativetechnologies and products to differentiate itself from competitors.
Operating profit
Operating profit increased by $93m to $723m from $630m in 2008 comprising, increase of $28m in Orthopaedics, $23m in Endoscopy and$42m in Advanced Wound Management.
2010 Annual Report 35

Net interest payable
Net interest payable decreased by $26m from $66m in 2008 to $40m in 2009. This is a consequence of the overall reduction of borrowingswithin the Group and a reduction in the applicable interest rates.
Other finance cost
Other finance costs in 2009 were $15m compared to $1m in 2008. This increase is attributable to a decrease in the expected return onpension plan assets.
Taxation
The taxation charge increased by $11m to $198m from $187m in 2008. The effective rate of tax was 29.6%, compared with 33.2% in 2008.
The tax charge was reduced by $26m in 2009 (2008 – $30m) as a consequence of restructuring and rationalisation expenses, acquisitionrelated costs, amortisation of acquisition intangibles and impairments. The effective tax rate was 27.9% (2008 – 30.6%) after adjusting forthese items and the tax thereon. This is a lower rate than expected due to favourable progress in, and resolution of, certain historic issues.
Group Balance Sheet
The following table sets out certain balance sheet data for the years ended indicated:
2009$ million
2008$ million
Non-current assets 2,480 2,523Current assets 2,071 1,985Assets held for sale 14 -
Total assets 4,565 4,508
Non-current liabilities 1,523 1,841Current liabilities 863 968
Total liabilities 2,386 2,809Total equity 2,179 1,699
Total equity and liabilities 4,565 4,508
Non-current assets decreased by $43m to $2,480m from $2,523 in 2008. Intangible assets and goodwill decreased by $60m of which$112m related to the Plus settlement, $92m to amortisation and impairments and $4m to disposals. These were offset by $102m ofadditions, $15m relating to the acquisition of Nucryst and $31m relating to favourable currency translation. Property, plant and equipmentincreased by $28m comprising $216m of additions, $30m of favourable currency translation and $6m relating to the acquisition of Nucryst.This was offset by $206m of depreciation charge, $10m of disposals and $8m of assets transferred to held for sale. Deferred tax assetsdecreased by $12m in the year, primarily due to the decrease in post retirement obligations.
Current assets increased by $86m to $2,071m from $1,985m in 2008. This was due to an increase in inventory of $54m and an increase incash at bank of $47m. These increases were partially offset by a reduction in trade and other receivables of $15m.
Non-current liabilities decreased by $318m from $1,841m in 2008 to $1,523m in 2009. $268m of this decrease was due to the reduction oflong-term borrowings. The net retirement benefit obligation decreased by $28m. This was due to experience gains on plan assets andliabilities totalling $88m. These gains were offset by a $47m increase in the defined obligation attributable to changes in actuarialassumptions and $16m of unfavourable currency movements.
Current liabilities decreased by $105m from $968m in 2008 to $863m in 2009. This was due to a decrease in bank overdrafts and currentborrowings of $70m, a decrease in trade and other payables of $11m and decrease in current tax payable of $25m.
Total equity increased by $480m from $1,699m in 2008 to $2,179m in 2009. The principal movements were an increase of $472m due toattributable profit, an increase in currency translation and hedging gains of $62m, an increase of $41m relating to actuarial gains onretirement benefit obligations, offset by $10m relating to deferred taxation and $120m due to dividends paid during the year.
36 2010 Annual Report

Des
crip
tion
ofth
eG
roup
Busi
ness
Revi
ew,
Liqui
dity
and
Pros
pect
sCo
rpor
ate
Gov
erna
nce
Stat
emen
tD
irect
ors’
Rem
uner
atio
nRe
port
Gro
upA
ccou
nts
Com
pany
Acc
ount
sIn
vest
orIn
form
atio
n
Business Segment Analysis
Revenue by business segment and geographic market and trading and operating profit by business segment are set out below:
2009$ million
2008$ million
Revenue by business segmentOrthopaedics 2,135 2,158Endoscopy 791 800Advanced Wound Management 846 843
Total revenue 3,772 3,801
Revenue by geographic marketEurope (Continental Europe and United Kingdom) 1,313 1,398United States 1,664 1,657Africa, Asia, Australasia and other America 795 746
Total revenue 3,772 3,801
Trading profit by business segmentOrthopaedics 508 481Endoscopy 189 166Advanced Wound Management 160 129
Total trading profit 857 776
Operating profit by business segmentOrthopaedics 410 382Endoscopy 169 146Advanced Wound Management 144 102
Total operating profit 723 630
OrthopaedicsRevenue
Orthopaedics revenue decreased by 1% to $2,135m from $2,158m in 2008. Of this decrease, 1% is attributable to underlying growth and-2% is due to unfavourable currency movements. The principal factors in the underlying growth in revenue were the continuing expansion inglobal orthopaedic markets and the growth of recently launched products.
In the US, revenue increased by $27m to $1,154m (2%), all of which was due to underlying growth. The main factors were the continuedgrowth of products launched in recent years including the LEGION and JOURNEY knees.
Outside the US, revenue decreased by $50m to $981m (-5%), attributable to unfavourable foreign currency translation of -5% and flatunderlying revenue growth.
Global knee revenue increased by $3m to $761m (nil%), representing underlying revenue growth of 3% offset by -3% of unfavourableforeign currency translation.
Global hip revenue decreased by $7m to $681m (-1%) of which 1% was due to underlying revenue growth offset by -2% unfavourableforeign currency translation.
Trading profit
Trading profit increased by $27m (6%) to $508m from $481m in 2008. Trading profit margin increased from 22.3% to 23.8%. This increaseis due to good cost management and further investment in improving the efficiency and effectiveness of the main processes, primarily in thecost of sales area.
Operating profit
Operating profit increased by $28m to $410m. This largely comprises the increases in trading profit of $27m. A decrease in acquisitionrelated costs of $35m were offset by increases of $17m in costs associated with Earnings Improvement Programme (“EIP”) and $17m in theamortisation of acquisition intangibles and impairments.
2010 Annual Report 37
EndoscopyRevenue
Endoscopy revenue decreased by $9m, or 1%, to $791m from $800m in 2008, comprising -2% unfavourable currency translation and 1%underlying growth.
In the US, revenue decreased by $23m to $349m (-6%), all of which represents negative underlying growth. This is largely attributable to thedecrease in demand for capital equipment due to the current economic market conditions.
Outside the US, revenue increased by $14m to $442m (3%), of which 9% was underlying growth offset by -6% of unfavourable foreigncurrency translation.
Global revenue of knee and shoulder repair products increased by $13m to $325m (4%), of which 12% was underlying growth offset by -8%unfavourable foreign currency translation.
Revenue in the global resection products sector decreased by $29m to $248m (-11%), of which -2% represents negative underlyingrevenue growth in addition to -9% of unfavourable foreign currency translation.
Global Visualisation revenue decreased by $29m to $121m (-19%), of which -20% represents negative underlying growth offset by 1% offavourable foreign currency translation.
Trading profit
Trading profit increased by $23m (14%) to $189m from $166m in 2008 resulting in a trading profit margin increase from 20.8% to 23.9%.This improvement was mainly due to a greater focus on managing costs and a favourable product mix benefit.
Operating profit
Operating profit increased by $23m to $169m from $146m in 2008. This comprises the $23m increase in trading profit.
Advanced Wound ManagementRevenue
Revenue increased by $3m, or nil%, to $846m from $843m in 2008, comprising -6% unfavourable currency translation and 6% underlyinggrowth. Within the infection management and exudate management markets, growth was driven by the extension of the Group’s ALLEVYNbrand to new products.
In the US, revenue increased by $3m to $161m (2%), all of which is attributable to underlying revenue growth.
Outside the US, revenue remained constant at $685m. This is represented by an underlying growth of 7% offset by -7% of unfavourableforeign currency translation. European revenue decreased by 2% of which -8% was unfavourable currency translation and 6% wasunderlying growth.
Trading profit
Trading profit increased by $31m (24%) to $160m from $129m in 2008 and trading profit margin increased from 15.3% to 18.9%. Thisimprovement was mainly due to a greater focus on cost management and overall process improvement.
Operating profit
Operating profit increased by $42m to $144m. This largely comprises the increase in trading profit of $31m and a reduction of $10m inrestructuring and rationalisation costs.
38 2010 Annual Report

Des
crip
tion
ofth
eG
roup
Busi
ness
Revi
ew,
Liqui
dity
and
Pros
pect
sCo
rpor
ate
Gov
erna
nce
Stat
emen
tD
irect
ors’
Rem
uner
atio
nRe
port
Gro
upA
ccou
nts
Com
pany
Acc
ount
sIn
vest
orIn
form
atio
n
FINANCIAL POSITION, LIQUIDITY AND CAPITAL RESOURCES
Cash Flow and Net DebtThe main elements of Group cash flow and movements in net debt can be summarised as follows:
2010$ million
2009$ million
2008$ million
Cash generated from operations 1,111 1,030 815Net interest paid (17) (41) (63)Income taxes paid (235) (270) (186)
Net cash inflow from operating activities 859 719 566Capital expenditure (net of disposal of property, plant and equipment) (307) (318) (289)Acquisitions (net of cash acquired) - (25) (16)Plus settlement - 137 -Equity dividends paid (132) (120) (109)Proceeds from own shares 8 10 4Issue of ordinary share capital 15 7 19Treasury shares purchased (5) - (193)
Change in net debt from net cash flow (see Note 27 of the Notes to the Group Accounts) 438 410 (18)Facility fee - - 2Exchange adjustment 13 (21) (6)Opening net debt (943) (1,332) (1,310)
Closing net debt (492) (943) (1,332)
The Group’s net debt decreased from $1,310m at the beginning of 2008 to $492m at the end of 2010, representing an overall decrease of$818m. Translation of foreign currency net debt into US Dollars had the effect of increasing net debt by $14m in the three-year period ended31 December 2010. Closing net debt includes no currency swap liabilities (2009 – nil, 2008 – $4m).
Net Cash Inflow from Operating ActivitiesCash generated from operations in 2010 of $1,111m (2009 – $1,030m, 2008 – $815m) is after paying out $5m (2009 – $5m, 2008 – $10m)of macrotextured claim settlements unreimbursed by insurers, $nil (2009 – $22m, 2008 – $48m) of acquisition related costs and $16m(2009 – $32m, 2008 – $28m) of restructuring and rationalisation expenses.
Capital ExpenditureThe Group’s ongoing capital expenditure and working capital requirements were financed through cash flow generated by businessoperations and, where necessary, through short-term committed and uncommitted bank facilities. In recent years, capital expenditure ontangible and intangible fixed assets represented approximately 8% of continuing Group revenue.
In 2010, gross capital expenditure amounted to $315m (2009 – $318m, 2008 – $292m). The principal areas of investment were theplacement of orthopaedic instruments with customers, patents and licences, plant and equipment and information technology.
At 31 December 2010, $15m (2009 – $7m, 2008 – $27m) of capital expenditure had been contracted but not provided for which will befunded from cash inflows.
Acquisitions and DisposalsIn the three-year period ended 31 December 2010, $41m was spent on acquisitions, funded from net debt and cash inflows. Thiscomprised $25m for Nucryst, $14m for BlueSky and $2m for Plus. During 2009, the Group reached an agreement with the vendors of PlusOrthopedics Holdings AG to reduce the total original purchase price to CHF927m. This resulted in an additional cash inflow of $137m.
2010 Annual Report 39

LiquidityThe Group’s policy is to ensure that it has sufficient funding and facilities in place to meet foreseeable borrowing requirements. In December2010 the Group reviewed and replaced its principal banking facilities ahead of their maturity in May 2012. The Group has reduced its$1,000m 5 year term loan to $500m with effect from 20 December 2010. Smith & Nephew has also cancelled its $1,500m multi-currencyrevolving loan facility and replaced it with a new 5 year $1,000m multi-currency revolving loan facility.
At 31 December 2010, the Group held $207m (2009 – $192m, 2008 – $145m) in cash and balances at bank. The Group has committedand uncommitted facilities of $1,511m and $332m respectively. Of the undrawn committed facilities totalling $884m, $7m expires in 2011and $877m after two but within five years. Smith & Nephew intends to repay the amounts due within one year by using available cash anddrawing down on the longer-term facilities. In addition, Smith & Nephew has finance lease commitments of $22m (of which $10m extendsbeyond five years).
The principal variations in the Group’s borrowing requirements result from the timing of dividend payments, acquisitions and disposals ofbusinesses, the share buy-back programme (announced as suspended in November 2008), timing of capital expenditure and workingcapital fluctuations.
Smith & Nephew believes that its capital expenditure needs and its working capital funding for 2011, as well as its other known or expectedcommitments or liabilities, can be met from its existing resources and facilities.
The Group’s planned future contributions are considered adequate to cover the current under funded position in the Group’s defined benefitplans.
Further disclosure regarding borrowings, related covenants and the liquidity risk exposures is set out in Note 19 of the Notes to the GroupAccounts. The Group believes that its borrowing facilities do not contain restrictions that would have significant impact on its funding orinvestment policy for the foreseeable future.
Going ConcernThe Group’s business activities, together with the factors likely to affect its future development, performance and position are set out in the“Description of the Group” section on pages 3 to 21. The financial position of the Group, its cash flows, liquidity position and borrowingfacilities are described in the “Business Review, Liquidity and Prospects” section set out on pages 23 to 40. In addition, the notes to thefinancial statements include the Group’s objectives, policies and processes for managing its capital; its financial risk managementobjectives; details of its financial instruments and hedging activities; and its exposure to credit risk and liquidity risk.
The Group has considerable financial resources and its customers and suppliers are diversified across different geographic areas. As aconsequence, the directors believe that the Group is well placed to manage its business risk successfully despite the ongoing uncertaineconomic outlook.
The directors have a reasonable expectation that the Group has adequate resources to continue in operational existence for the foreseeablefuture. Thus they continue to adopt the going concern basis for accounting in preparing the annual financial statements.
Payment PoliciesIt is the Group’s and Company’s policy to ensure that suppliers are paid within agreed terms. At the year-end the Company had no tradecreditors.
40 2010 Annual Report

Des
crip
tion
ofth
eG
roup
Busi
ness
Revi
ew,
Liqui
dity
and
Pros
pect
sCo
rpor
ate
Gov
erna
nce
Stat
emen
tD
irect
ors’
Rem
uner
atio
nRe
port
Gro
upA
ccou
nts
Com
pany
Acc
ount
sIn
vest
orIn
form
atio
n
LEGAL PROCEEDINGSThe Company and its subsidiaries are parties to various legal proceedings, some of which include claims for substantial damages. Theoutcome of these proceedings cannot readily be foreseen, but with the possible exception of those detailed below, management believesnone of them will result in a material adverse effect on the financial position of the Group. The Group provides for outcomes that are deemedto be probable and can be reliably estimated. There is no assurance that losses will not exceed the provision or will not have a significantimpact on the Group’s results of operations or financial condition in the period in which they are realised.
Product Liability ClaimsIn August 2003, the Group withdrew voluntarily from all markets the macrotextured versions of its OXINIUM femoral knee components. Anumber of related claims have been filed, most of which have been settled. The aggregate cost to date related to this matter isapproximately $212m. The Group has sought recovery from its insurers.
To date the primary insurance carrier has paid $60m in full settlement of its policy liability. An additional $22m was received from asuccessful legal settlement. At 31 December 2010, at least $133m remains due, and the Group has sought coverage from five excessinsurance carriers. However, these excess carriers have denied coverage, citing defences relating to the wording of the insurance policiesand other matters. In December 2004, the Group brought suit against them in the US District Court for the Western District of Tennessee,and trial is expected to commence in 2012.
A charge of $154m was recorded in 2004 for anticipated expenses in connection with macrotexture claims. Most of that amount has sincebeen applied to settlements of such claims. Management believes that the $20m provision remaining is adequate to cover remainingclaims. Given the uncertainty inherent in such matters, there can be no assurance on this point.
The Group faces other claims from time to time for alleged defects in its products and has on occasion recalled products to minimise risk ofharm or claims. The Group maintains product liability insurance subject to limits and deductibles that management believes are reasonable.
Business Practice InvestigationsIn March 2005 the US Attorney’s Office in Newark, New Jersey issued subpoenas to the five largest sellers of hip and knee implants to USorthopaedic surgeons, including the Group’s Orthopaedic business, asking for information regarding arrangements with orthopaedicreconstructive surgeons. In September 2007, the Group (and the other four companies involved) settled the charges that could haveresulted from this investigation, without admitting any wrongdoing as part of the settlement. At the same time, the Group entered into aCorporate Integrity Agreement with the Office of the Inspector General (“OIG”) of the US Department of Health and Human Services whichrequires certain compliance efforts. This agreement is in effect for five years, until September 2012. If the Group meets its terms, the OIG willnot attempt to exclude it from receiving Medicare payments for its products. The Group has devoted substantial effort to comply with thisagreement and to enhance its compliance programme across all of its business units.
In September 2007, the SEC notified the Group that it was conducting an informal investigation of companies in the medical devicesindustry, including the Group, regarding possible violations of the Foreign Corrupt Practices Act (“FCPA”) in connection with the sale ofproducts in certain foreign countries. The US Department of Justice subsequently joined the SEC’s request. The Group is cooperating fullywith the US Department of Justice and the SEC regarding these matters, has conducted a broader review on its own initiative, and hasdisclosed to them information indicating that at least one independent distributor of its products may have made payments that could haveFCPA implications. The Group is engaged in discussions to resolve these matters which might include a settlement by which the Groupwould pay certain amounts and submit to compliance reporting and oversight obligations. There is no assurance that a settlement will bereached, however.
Intellectual Property DisputesThe Group is engaged, as both plaintiff and defendant, in litigation with various competitors and others over claims of patent infringementand, in some cases, breach of licence agreement. These disputes are being heard in courts in the United States and other jurisdictions andalso before agencies that examine patents. Outcomes are rarely certain and costs are often significant.
Since the Group’s entry into the negative pressure wound therapy business in 2007, Kinetic Concepts, Inc. (“KCI”) has pursued claims ofpatent infringement against the Group in the US, UK, Germany and other jurisdictions. In one case in the US District Court for the WesternDistrict of Texas a jury found that KCI’s patents were valid but not infringed by the Group. That ruling was upheld on appeal in February2009. In a subsequent case in the same court, relating to the Group’s foam product, a jury concluded in March 2010 that KCI’s assertedpatents were valid and infringed. But the court determined the relevant patent claims were invalid and entered judgement in favour of the
2010 Annual Report 41

Group. KCI has appealed the court’s judgement. If KCI were to prevail, the Group could be prevented from selling that foam product in theUS until patent expiration in 2014. KCI has also pursued patent infringement claims in certain countries relating to pumps, canisters andother negative pressure wound therapy accessories.
The Group has won jury verdicts against Arthrex Inc., (“Arthrex”) for infringement of the Group’s patents relating to suture anchors (in the USDistrict Court for Oregon) and femoral fixation devices for ACL reconstruction (in the US District Court for the Eastern District of Texas).Arthrex appealed both decisions. The Oregon decision was reversed on appeal and remanded to the District Court for a new trial, scheduledto begin in June 2011.
In a case filed in September 2008 in the US District Court for the Western District of Tennessee against the Group's US subsidiary, threeindividuals are seeking substantial royalty and other damages in connection with sales of certain products within the Group’s Orthopaedicsbusiness based on various legal theories including alleged breach of contracts entered into in 1988-1999 and patent infringement. TheGroup disputes these claims. Trial is expected to commence in 2012.
Other MattersIn April 2009, the Group was served with a subpoena by the US Department of Justice in Massachusetts requiring the production ofdocuments from 1995 to 2009 associated with the marketing and sale of the Group’s EXOGEN bone growth stimulator. Similar subpoenashave been served on a number of competitors in the bone growth stimulator market. Around the same time a qui tam or “whistleblower”complaint concerning the industry’s sales and marketing of those products, originally filed in 2005 against the primary manufacturers ofbone growth stimulation products (including Smith & Nephew), was unsealed in federal court in Boston, Massachusetts. A motion to dismissthat complaint was denied in December 2010.
In June 2010 the Group was served with another subpoena by the US Department of Justice in Massachusetts requiring the production ofdocuments relating to the distribution of samples of the Group’s SUPARTZ joint fluid therapy product.
The Group is subject to country of origin requirements under the US Buy American and Trade Agreements Acts with regard to sales tocertain US government customers. The Group has voluntarily disclosed to the US Veterans Administration and the US Department ofDefense that a small percentage of the products sold to the US government in the past, primarily from the Orthopaedics business, may haveoriginated from countries that are not eligible for such sales except with government consent. Government auditors subsequently conductedan on-site visit at the Group’s Orthopaedics business. In December 2008, three months after our initial voluntary disclosure, a whistleblowersuit was filed in the US District Court for Massachusetts alleging these violations. Smith & Nephew’s motion to dismiss the suit was deniedin November 2010.
42 2010 Annual Report

Des
crip
tion
ofth
eG
roup
Busi
ness
Revi
ew,
Liqui
dity
and
Pros
pect
sCo
rpor
ate
Gov
erna
nce
Stat
emen
tD
irect
ors’
Rem
uner
atio
nRe
port
Gro
upA
ccou
nts
Com
pany
Acc
ount
sIn
vest
orIn
form
atio
n
OUTLOOK AND TREND INFORMATIONThe discussion below contains certain forward-looking statements that may or may not prove accurate. For example, statements regardingexpected revenue growth and trading margins, market trends and our product pipeline are forward looking statements. Phrases such as“aim”, “plan”, “intend”, “anticipate”, “well placed”, “believe”, “estimate”, “target”, “consider”, and similar expressions are generally intended toidentify forward looking statements. Forward-looking statements involve known and unknown risks and uncertainties and other importantfactors that could cause actual results to differ materially from those projected in forward-looking statements. For Smith & Nephew, thesefactors include: economic and financial conditions in the markets we serve, especially those affecting health care providers, payors andcustomers; price levels for established and innovative medical devices; developments in medical technology; regulatory approvals;reimbursement decisions or other government actions; products defects or recalls; litigation relating to patent or other claims; legalcompliance risks and related investigative, remedial or enforcement actions; strategic actions, including acquisitions and depositions andour success in integrating acquired businesses; and numerous other matters which affect us or our markets, including those of a political,economic business or competitive nature.
For additional information on factors that could cause the Group’s actual results to differ from estimates reflected in these forward-lookingstatements, can be found under “Risk Factors” within this document.
Information regarding the recent and longer term market growth trends is given for each of the Group’s global business units in the relevant‘Market and Competition’ sections under Business Description on pages 4 to 9.
The Group has delivered another strong performance, with the majority of businesses outperforming their respective markets. The currentmarket challenges are well understood. The Group is meeting them by supplying innovative products which offer clinical and cost benefit forour customers and continuing to execute efficiency programmes across our businesses. The long-term growth drivers underpinning theGroup’s industry – including demographics, emerging markets and patients desire to return to an active life – remain strong.
During 2011, the Group expects Orthopaedic Reconstruction to grow at above the market rate, as the momentum in our knee franchise isexpected to continue. In Orthopaedic Trauma the Group made substantial improvements in 2010 and are committed to sustaining thisperformance. In Endoscopy the Group expects to achieve above market growth in Arthroscopy (sports medicine), driven by the repairproduct segment. In Advanced Wound Management the Group believes it will continue to grow at above the market rate.
The Group made further trading margin progress during 2010, achieving a trading profit margin of 23.9% (before the benefit of the BlueSkysettlement), and continues to see many areas in our businesses which offer further efficiencies. The Group also sees an increasing numberof investment opportunities to drive top line growth, both geographically and in new products. The Group is taking advantage of theseopportunities and anticipates that in the short to medium term the cost of these investments will broadly offset our further efficiency savings.
The Group believes it has a clear, balanced, plan for the future, based on the same strategic pillars which have maintained growth andinvestment during the recent global cyclical downturn, while delivering significant margin improvement. We are confident that, by offering ourcustomers the right product, at the right time with the right value proposition, we are positioned to continue to deliver long term growth.
2010 Annual Report 43
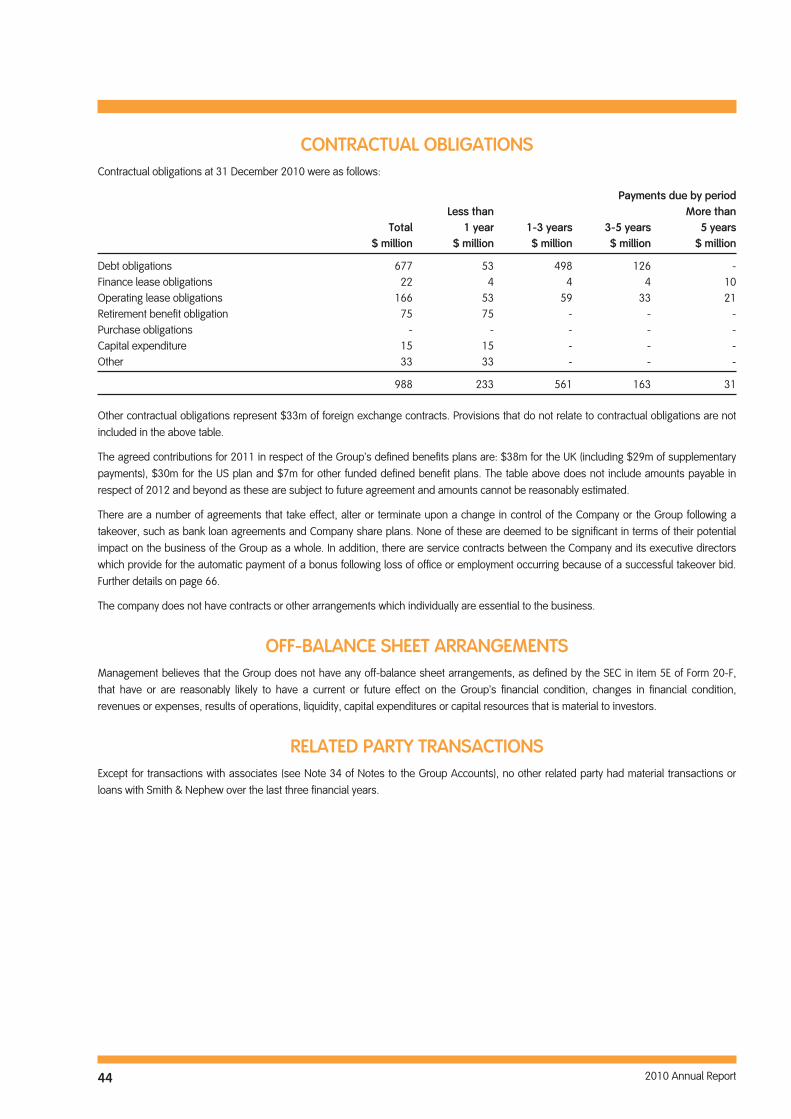
CONTRACTUAL OBLIGATIONSContractual obligations at 31 December 2010 were as follows:
Payments due by period
Total$ million
Less than1 year
$ million1-3 years$ million
3-5 years$ million
More than5 years
$ million
Debt obligations 677 53 498 126 -Finance lease obligations 22 4 4 4 10Operating lease obligations 166 53 59 33 21Retirement benefit obligation 75 75 - - -Purchase obligations - - - - -Capital expenditure 15 15 - - -Other 33 33 - - -
988 233 561 163 31
Other contractual obligations represent $33m of foreign exchange contracts. Provisions that do not relate to contractual obligations are notincluded in the above table.
The agreed contributions for 2011 in respect of the Group’s defined benefits plans are: $38m for the UK (including $29m of supplementarypayments), $30m for the US plan and $7m for other funded defined benefit plans. The table above does not include amounts payable inrespect of 2012 and beyond as these are subject to future agreement and amounts cannot be reasonably estimated.
There are a number of agreements that take effect, alter or terminate upon a change in control of the Company or the Group following atakeover, such as bank loan agreements and Company share plans. None of these are deemed to be significant in terms of their potentialimpact on the business of the Group as a whole. In addition, there are service contracts between the Company and its executive directorswhich provide for the automatic payment of a bonus following loss of office or employment occurring because of a successful takeover bid.Further details on page 66.
The company does not have contracts or other arrangements which individually are essential to the business.
OFF-BALANCE SHEET ARRANGEMENTSManagement believes that the Group does not have any off-balance sheet arrangements, as defined by the SEC in item 5E of Form 20-F,that have or are reasonably likely to have a current or future effect on the Group’s financial condition, changes in financial condition,revenues or expenses, results of operations, liquidity, capital expenditures or capital resources that is material to investors.
RELATED PARTY TRANSACTIONSExcept for transactions with associates (see Note 34 of Notes to the Group Accounts), no other related party had material transactions orloans with Smith & Nephew over the last three financial years.
44 2010 Annual Report
Des
crip
tion
ofth
eG
roup
Busi
ness
Revi
ew,
Liqui
dity
and
Pros
pect
sCo
rpor
ate
Gov
erna
nce
Stat
emen
tD
irect
ors’
Rem
uner
atio
nRe
port
Gro
upA
ccou
nts
Com
pany
Acc
ount
sIn
vest
orIn
form
atio
n
CORPORATE GOVERNANCE STATEMENTThis section discusses Smith & Nephew’s structures and governance procedures.
The Board and Executive Officers 46Governance and Policy 48Accountability, Audit and Internal Control Framework 55
2010 Annual Report 45

THE BOARD AND EXECUTIVE OFFICERSThe Board of directors of Smith & Nephew as at 23 February 2011 comprised:
Director PositionInitially elected or
appointed
John Buchanan Independent Non-Executive Chairman 3 February 2005David J. Illingworth Executive Director, Chief Executive 8 February 2006Adrian Hennah Executive Director, Chief Financial Officer 15 June 2006Ian E. Barlow Independent Non-Executive Director 5 March 2010Geneviève B. Berger Independent Non-Executive Director 5 March 2010Dr. Pamela J. Kirby Independent Non-Executive Director 1 March 2002Brian Larcombe Independent Non-Executive Director 1 March 2002Joseph C. Papa Independent Non-Executive Director 1 August 2008Richard De Schutter Independent Non-Executive Director 1 January 2001Dr. Rolf W. H. Stomberg Independent Non-Executive Director 1 January 1998
Directors’ BiographiesJohn Buchanan, Independent non-executive Chairman. John was appointed independent non-executive Deputy Chairman in 2005 andbecame Chairman in April 2006 and is Chairman of the Nominations Committee. He is Deputy Chairman of Vodafone Group Plc and anon-executive director of BHP Billiton. He was formerly Group Chief Financial Officer of BP plc.
David J. Illingworth, Chief Executive, joined the Group in May 2002 as President of Orthopaedics and was appointed a director and ChiefOperating Officer in February 2006. In July 2007 he was appointed Chief Executive. He is a member of the Nominations Committee. Prior tojoining the Group he held posts within GE Medical, as Chief Executive Officer of a publicly traded medical devices company, President of arespiratory/critical care company and President of a technology incubator company. He will be retiring from the Board at the end of theAnnual General Meeting to be held on 14 April 2011.
Adrian Hennah, Chief Financial Officer, joined the Group and was appointed a director in June 2006. He was previously Chief FinancialOfficer of Invensys plc and held various senior positions within GlaxoSmithKline. Adrian will be appointed as a member of the SupervisoryBoard of Reed Elsevier NV and as a non-executive director of Reed Elsevier PLC, subject to shareholder approval at their respective AnnualGeneral Meetings, on 19 and 20 April 2011.
Ian E. Barlow, Independent non-executive director. Ian was appointed a director on 5 March 2010 and is Chairman of the Audit Committee.He is a non-executive director and Chairman of the Audit Committees of the PA Consulting Group and the Brunner Investment Trust,Chairman of Think London and the Racecourse Association and a non-executive director of Candy & Candy. Previously he was SeniorPartner, London at KPMG.
Prof. Geneviève B. Berger, Independent non-executive director. Geneviève was appointed a director on 5 March 2010. She is ChiefResearch & Development Officer at Unilever plc and Unilever NV having previously served as a non-executive director. Previously, she hasbeen Chairman of the Health Advisory Board for the European Commission and a Professor at the University of Paris and Le Pitié-SapêtrièreTeaching Hospital and Director General of the French Centre National de La Recherche Scientifique. Subject to her re-appointment by theshareholders, she will join the Ethics and Compliance Committee on 14 April 2011.
Dr. Pamela J. Kirby, Independent non-executive director. Pamela was appointed a director in March 2002 and is a member of theRemuneration and Ethics and Compliance Committees. She is non-executive Chairman of Scynexis Inc and a non-executive director ofInforma plc, Novo Nordisk A/S and Victrex plc. Subject to her re-appointment by the shareholders, she will be appointed Chairman of theEthics and Compliance Committee on 14 April 2011.
Brian Larcombe, Independent non-executive director. Brian was appointed a director in March 2002 and is a member of the Audit andRemuneration Committees. He is a non-executive director of gategroup Holding AG and Incisive Media Holdings Limited. Previously he wasChief Executive Officer of 3i Group plc.
Joseph C. Papa, Independent non-executive director. Joe was appointed a director in August 2008 and is a member of the Ethics andCompliance, Audit and Remuneration Committees. He is Chairman and Chief Executive of Perrigo Company. Previously he was Chairmanand Chief Executive Officer of the Pharmaceutical and Technology Services segment of Cardinal Health Inc., and President and ChiefOperating Officer of Watson Pharmaceuticals Inc. Subject to his re-appointment by the shareholders, he will be appointed Chairman of theRemuneration Committee on 14 April 2011.
46 2010 Annual Report

Des
crip
tion
ofth
eG
roup
Busi
ness
Revi
ew,
Liqui
dity
and
Pros
pect
sCo
rpor
ate
Gov
erna
nce
Stat
emen
tD
irect
ors’
Rem
uner
atio
nRe
port
Gro
upA
ccou
nts
Com
pany
Acc
ount
sIn
vest
orIn
form
atio
n
Richard De Schutter, Independent non-executive director. Richard was appointed a director in January 2001 and is Chairman of the Ethicsand Compliance Committee and a member of the Audit, Nominations and Remuneration Committees. He is non-executive Chairman ofIncyte Corporation and a non-executive director of Navicure Inc. and Slate Pharmaceuticals. Subject to his re-appointment by theshareholders, he will be appointed Senior Independent Director and cease to be Chairman of the Ethics and Compliance Committee on14 April 2011.
Dr. Rolf W. H. Stomberg, Independent non-executive director and Senior Independent Director. Rolf was appointed a director in 1998 and isChairman of the Remuneration Committee and a member of the Audit and Nominations Committees. He is Chairman of Lanxess AG and anon-executive director of Hoyer GmbH, Biesterfeld AG and Severstal OAO. He will cease to be Senior Independent Director and Chairman ofthe Remuneration Committee on 14 April 2011.
Executive OfficersThe Chief Executive of Smith & Nephew and other senior executives are responsible for the day-to-day management of the Group. Inaddition to the executive directors, the following are executive officers of Smith & Nephew:
Naseem Amin, Chief Scientific Officer. Naseem joined the Group in 2009 prior to which he held a number of senior business developmentand research posts, most recently Senior VP of Business Development at Biogen Idec.
Mark Augusti, President of Biologics & Clinical Therapies. Mark joined the Group in 2003 as Vice President of Global Marketing for theTrauma Division, became President of Orthopaedic Trauma and Clinical Therapies in February 2006 and was appointed to his current role inJanuary 2008. He previously worked for GE Medical Systems in the US and Asia. In 2009 Mark was also appointed to the board ofHutchinson Technology Inc. as an independent director.
John W. Campo, Chief Legal Officer. Jack joined the Group in June 2008. Prior to joining the Group he was employed by General ElectricCompany for 14 years in a variety of roles, including seven years with GE Healthcare (successor to GE Medical Systems) in the US and Asia.
Joseph DeVivo, President of Orthopaedics. Joe joined the Group in June 2007 as President of Orthopaedic Reconstruction and wasappointed to his current role in May 2008. Prior to joining the Group, he held senior executive positions with RITA Medical Systems Inc.,Computer Motion Inc. and United States Surgical, a division of Tyco Healthcare.
Michael Frazzette, President of Endoscopy. Mike joined the Group as President of Endoscopy in July 2006. Previously he was President andChief Executive Officer of a US manufacturer of medical devices and spent 15 years at Tyco Healthcare becoming President of the PatientCare, THC Canada and Health Systems divisions.
R. Gordon Howe, Senior Vice President Global Planning and Development. Gordon joined the Group in 1998, and served in planning andbusiness development roles in the Orthopaedics division. He was appointed to his current role in August 2007. Prior to joining the Group,he held management positions with United Technologies Corporation.
Kelvin Johnson, National Executive of China/President of Emerging Markets. Kelvin joined the Group in 1980 and has held a number of keyroles within Smith & Nephew. His role as President of Emerging Markets was expanded during 2010 to lead the Group’s increased focus inChina. Prior to joining Smith & Nephew, Kelvin worked at the Ford Motor Company.
Roger Teasdale, President of Advanced Wound Management. Roger joined the Group in 1989 and has held a number of key roles inbusinesses within Smith & Nephew, most recently as Senior Vice President of Advanced Wound Management. Roger was appointed to hiscurrent role on 1 May 2009.
Company SecretarySusan Henderson, Company Secretary. Susan joined the Group in May 2009, prior to which she held a number of senior companysecretarial positions at Amersham plc and Prudential plc.
2010 Annual Report 47

GOVERNANCE AND POLICYIntroductionThe Board continues to be committed to the highest standards of Corporate Governance and this report together with the Directors’Remuneration Report explains how the provisions and principles of the FSA Listing Rules, Disclosure & Transparency Rules (“DTR”), theCombined Code on Corporate Governance (the “Code”) and the UK Corporate Governance Code (the “New Code”) have been appliedthroughout the year. The Company’s American Depositary Shares are listed on the NYSE and the Company is therefore subject to the rulesof the NYSE as well as the US securities laws and the rules of the SEC applicable to foreign private issuers.
The Board considers that it has complied with all relevant provisions of the Code, the New Code, and the requirements of the SEC and NYSEthroughout the year, except that the Nominations Committee is not comprised wholly of independent directors, as required by the NYSE, butconsists of a majority of independent directors in accordance with the Code.
With effect from the Annual General Meeting in 2011, all directors will submit themselves for re-election at each Annual General Meeting inaccordance with the New Code. Whilst the remaining provisions of the New Code do not currently apply to the Company, the Boardconsiders that it does comply with the provisions of the New Code except that, although the Chairman and entire Board have endorsed andapproved this corporate government statement, none of our directors use any part of the annual report to make personal statements.
In accordance with the Code, the following paragraphs describe Smith & Nephew’s Corporate Governance policies and procedures and howit applies the main Principles set out in section one of the Code.
The BoardThe Board of directors of Smith & Nephew consists of a non-executive Chairman, two executive directors and seven independentnon-executive directors. In 2010, the Board met on 10 occasions and individual attendance together with attendance at Board Committeemeetings, is shown in the table on page 53. In addition to formal Board meetings, informal telephone updates are held between Boardmeetings to ensure that directors are kept up to date with matters affecting the Group.
Geneviève Berger and Ian Barlow joined the Board as independent non-executive directors on 5 March 2010.
On 10 February 2011, it was announced that Olivier Bohuon will be joining the Board as an Executive Director on 1 April 2011. He will offerhimself for re-election by the shareholders at the Annual General Meeting and, subject to his re-appointment, will assume the position ofChief Executive Officer at the conclusion of the Annual General Meeting on 14 April 2011. David Illingworth will retire from the Board at theconclusion of the Annual General Meeting.
The Scope of the BoardThe Board is responsible for the strategic direction, overall management of the Group and the long-term success of the Company. There is aformal schedule of matters reserved for its decisions which include the approval of certain policies, budgets, financing plans, large capitalexpenditure projects, acquisitions, divestments and treasury arrangements. Otherwise, it delegates the executive management of the Groupto the Chief Executive and certain specific responsibilities to Board Committees, as described on pages 50 to 53. It reviews the key activitiesand performance of the businesses and considers and reviews the work undertaken by the Committees. Succession planning is regularlyreviewed and appropriate measures are taken to ensure the Board has the appropriate balance of skills and experience necessary for amajor global medical devices company.
Non-executive directors meet regularly prior to each Board meeting without management in attendance. The Senior Independent Directormeets with the other non-executive directors annually to evaluate the performance of the Chairman. All directors have access to the adviceand services of the Company Secretary, who is also responsible to the Board for ensuring that board and governance procedures arecomplied with. The appointment and removal of the Company Secretary is a matter for the Board as a whole. Board members individuallyand Board Committees may obtain independent professional advice, at the Company’s expense, where they judge it necessary in order tofulfil their responsibilities as directors. If directors are unable to attend a Board meeting or Board Committee meeting, they are advised ofmatters to be discussed and have an opportunity to make their views known to the Chairman or the Chairman of the relevant Committeeprior to the meeting.
48 2010 Annual Report
Des
crip
tion
ofth
eG
roup
Busi
ness
Revi
ew,
Liqui
dity
and
Pros
pect
sCo
rpor
ate
Gov
erna
nce
Stat
emen
tD
irect
ors’
Rem
uner
atio
nRe
port
Gro
upA
ccou
nts
Com
pany
Acc
ount
sIn
vest
orIn
form
atio
n
The Role of Individual DirectorsWhilst the Chairman and Chief Executive collectively are responsible for the leadership of the Group, there is a clear division of respectiveresponsibilities which has been agreed by the Board. The Chairman’s primary responsibility is leading the Board including setting its agendaand ensuring its effectiveness, by encouraging constructive challenge. The Chief Executive is responsible for the performance, managementand supervision of the Group in accordance with the strategy, policies, budgets and business plans approved by the Board. The SeniorIndependent Director is currently Rolf Stomberg, whose role includes consulting with members of the Board on issues relating to theChairman and chairing meetings of the Nominations and Audit Committee in the absence of the Chairman or Chairman of the AuditCommittee. He is available to shareholders if they have concerns that cannot be resolved through the normal channels of contact with theChairman or Chief Executive. Rolf Stomberg will cease to be the Senior Independent Director on 14 April 2011, when Richard De Schutterwill, subject to his re-appointment by shareholders, be appointed in his place. The role of the independent non-executive directors is toprovide constructive challenge and to help develop proposals on strategy.
Independence of Non-Executive DirectorsThe Board has determined that all the non-executive directors are independent in accordance with UK and US requirements. None of thenon-executive directors or their immediate families has ever had a material relationship with the Group either directly as an employee or asa partner, shareholder or officer of an organisation that has a relationship with the Group. They do not receive additional remuneration apartfrom directors’ fees, do not participate in the Group’s share option plans or performance related pay schemes, and are not members of theGroup’s pension schemes nor do they serve as a director of a company or an affiliate in which any other director of Smith & Nephew is adirector.
The Board recognises that a number of the independent non-executive directors have served on the Board for a period of time that might beconsidered to impact on their independence. The Board has thoroughly considered the independence of each of these long servingdirectors (Rolf Stomberg, Richard De Schutter, Pamela Kirby and Brian Larcombe) and has concluded that each continues to provide effectivechallenge both within and outside Board meetings. In 2010, Ian Barlow and Geneviève Berger were appointed non-executive directors on5 March 2010, and the search for additional directors continued throughout 2010 and into 2011. It is intended that as and when newdirectors are appointed and have spent some time settling into the Company, some of the longer serving non-executive directors will stepdown. The Board believes that to provide continuity, it is useful for some non-executive directors to remain on the Board to assist in theperiod of transition.
Management of Conflicts of InterestNone of the directors or their connected persons has any family relationship with any other director or officer nor has a material interest inany contract to which the Company or any of its subsidiaries are or were a party during the year or up to 23 February 2011.
Each director has a duty under the Companies Act 2006 to avoid a situation in which he or she has or can have a direct or indirect interestthat conflicts or possibly may conflict with the interests of the Company. This duty is in addition to the existing duty that a director owes tothe Company to disclose to the Board any transaction or arrangement under consideration by the Company. The Company’s articles ofassociation permit directors to authorise conflicts and potential conflicts in accordance with the Companies Act 2006 and to approve suchsituations. Directors inform the Board of any situations which may give rise to a conflict of interest as they arise and this information isrecorded in the Company’s Register of Conflicts together with the date on which authorisation was given. On an annual basis, directorscertify that the information contained in the register is correct. The Board has a procedure when deciding whether to authorise a conflict orpotential conflict of interest. Firstly, only directors who have no interest in the matter under consideration are able to take the relevantdecision. Secondly, in taking the decision the directors must act in a way they consider, in good faith, will be most likely to promote theCompany’s success. In addition, the directors may impose limits or conditions when giving authorisation if they think this is appropriate.During the year, one director identified situations which could give rise to conflicts of interest. Each of these situations was authorised by theBoard, although no actual conflicts were identified.
Re-appointment of DirectorsUnder the Company’s articles of association, any director who has been appointed by the Board since the previous Annual General Meetingof shareholders, either to fill a casual vacancy or as an additional director, holds office only until the conclusion of the next Annual GeneralMeeting at which they are eligible for re-appointment by the shareholders. In accordance with the New Code, with effect from the AnnualGeneral Meeting to be held in 2011, all directors will retire with effect from the conclusion of each Annual General Meeting and offerthemselves for re-election at that meeting. However, David Illingworth will not seek re-election at the Annual General Meeting to be held on14 April 2011. The directors are subject to removal with or without cause by the Board or the shareholders.
2010 Annual Report 49

Board Development ProgrammeA number of training and development opportunities were identified for the Board during 2010. As in previous years, training focused mainlyon increasing the Board’s understanding of the business and markets in which the Company operates. Throughout the year, each globalbusiness unit presented to the Board on its business and the current challenges it faced. These themes were explored in greater depthduring the two day Strategy Review held in September. In November, the Board visited the headquarters of the Endoscopy business basedin Andover, Massachusetts, meeting with the senior management team and major customers and receiving presentations on our productsand processes. Two formal Board development sessions were also held which gave the Board technical briefings on, amongst other things,UK corporate governance requirements, the UK Bribery Act and remuneration trends and governance matters. Tailored inductionprogrammes were also held for Geneviève Berger and Ian Barlow who joined the Board in 2010. These programmes included a series of sitevisits to some of our principal sites and one to one meetings with members of the senior management teams in the global business unitsand head office functions. All directors are encouraged to visit our principal sites and to meet with key members of staff to gain a moredetailed understanding of particular areas of interest. The Chairman continues to keep the training and developmental needs of eachdirector under review.
Review into the Effectiveness of the BoardTowards the end of 2010, the Board undertook a review of its effectiveness and the effectiveness of its key Committees. The review was ledby the Chairman and facilitated by the Company Secretary and took the form of a series of one to one discussions between the CompanySecretary and individual Directors. These discussions focused on certain areas identified in the previous effectiveness review.
The review concluded that the Board operated well under the effective leadership of the Chairman. There was constructive debate within theBoardroom and directors were kept well advised of and consulted on relevant matters arising between meetings. The Board welcomed theopportunity to meet and engage with members of the management team at site visits and at the Strategy Review. The Effectiveness Reviewrecognised that a number of improvements had been made to processes and communications during the year and has identified furtherimprovements to be made throughout 2011.
Committees of the BoardThe Board is assisted by the Audit, Remuneration, Nominations and Ethics and Compliance Committees, each of which has its own terms ofreference, which may be found on the Group’s website at www.smith-nephew.com. The Company Secretary or her designate is secretary toeach of the Committees. For each of the Committees the Chairman of the Committee reports orally to the Board and minutes of the meetingsare circulated to all members of the Board.
Audit Committee
The principal duties of the Audit Committee are:
• Finance and Accounting :
- to monitor the integrity of the Group’s accounts, ensuring that they meet statutory and associated legal and regulatory requirements;this includes reviewing significant financial reporting judgments contained in them, reports on compliance with accounting standards,appropriate accounting policies and practices and any changes to these, accounting and reporting issues, going concern assumptionsand anti fraud programmes and controls;
- to monitor announcements relating to the Group’s financial performance;
• Internal Controls:
- to monitor the effectiveness of internal financial controls and review compliance with s404 of the Sarbanes-Oxley Act 2002;
- to review the operation of the Group’s risk management process;
- to monitor the control environment mitigating compliance and quality management system risk
• Audit:
- to monitor and review the effectiveness of the Group’s internal audit function;
- to monitor and review the external auditors’ performance, the effectiveness of the audit process and their independence, approvingtheir terms of engagement, remuneration and ability to supply non-audit services and recommending for shareholder approval theappointment, re-appointment or removal of the external auditors, as appropriate;
50 2010 Annual Report

Des
crip
tion
ofth
eG
roup
Busi
ness
Revi
ew,
Liqui
dity
and
Pros
pect
sCo
rpor
ate
Gov
erna
nce
Stat
emen
tD
irect
ors’
Rem
uner
atio
nRe
port
Gro
upA
ccou
nts
Com
pany
Acc
ount
sIn
vest
orIn
form
atio
n
• Whistleblowing:
- to review the arrangements by which staff may raise complaints against the Group regarding financial reporting or other matters.
The members of the Audit Committee are Ian Barlow (Chairman and designated financial expert), Brian Larcombe, Richard De Schutter, RolfStomberg and Joseph Papa. Warren Knowlton served as Chairman of the Audit Committee up to 6 May 2010, when he retired from theBoard. All members of the Audit Committee are considered to be independent in accordance with the Code and are qualified as financialexperts as defined by the DTR, SEC and NYSE rules. The Chairman, Chief Executive and the Chief Financial Officer attend meetings of theAudit Committee by invitation but are not members of the Audit Committee.
The Audit Committee met five times during the year including discussions with the auditors, without management present.
For 2010, the Audit Committee considered quarterly reporting, the preliminary results and the Annual Report. Due consideration was givento compliance with accounting standards, appropriate accounting policies and practices, accounting and reporting issues, going concernassumptions and Section 404 of the Sarbanes-Oxley Act. The Audit Committee has also reviewed the appropriateness of the Group’sprincipal accounting policies, practices and judgments, including the identification of critical accounting policies which are those requiringthe most use of management’s judgment which includes the valuation of inventories, impairment review of goodwill, intangible and tangibleassets and the valuation of retirement benefits, contingencies and provisions. The Audit Committee also received a presentation from theGroup Treasurer. During the year, the Audit Committee additionally took on responsibility for monitoring controls that mitigate qualitymanagement system risk.
During the year, no concerns were raised with the Audit Committee about possible improprieties in matters of financial reporting or othermatters.
The Audit Committee reviewed the activities of the Internal Audit department, its programme of work and resourcing requirements. Specificactivities of the Internal Audit department include; review of the internal controls over financial reporting (compliance with Section 404 of theSarbanes – Oxley Act), assessing the operating effectiveness of the risk management process and review of other internal controlprocesses, including regulatory compliance, quality management systems and the prevention and detection of fraud. The Audit Committeereviewed the Group’s approach to internal financial control, its processes, outcomes and disclosures and considered the Group’s riskmanagement processes.
The Audit Committee also reviewed the work of the external auditors, Ernst & Young LLP, and received reports on the scope and outcome ofthe annual audit and management’s response. These reports included accounting matters, governance and control and accountingdevelopments. In addition, the Audit Committee reviewed the audit, audit-related, tax and other services provided by the external auditorsand ensured that all services provided by the external auditors were pre-approved in accordance with the Auditor Independence policyexplained in greater detail on page 55. As part of the review into the services provided by the auditors, the Audit Committee reviewed theindependence, objectivity and effectiveness of the external auditors and was satisfied that it was appropriate to recommend to the Boardtheir reappointment.
Remuneration Committee
The members of the Remuneration Committee are Rolf Stomberg (Chairman), Pamela Kirby, Brian Larcombe (appointed to the RemunerationCommittee on 7 September 2010), Richard De Schutter and Joseph Papa. Warren Knowlton also served on the Remuneration Committee upto 6 May 2010, when he retired from the Board. With effect from 14 April, Rolf Stomberg will cease to be Chairman of the RemunerationCommittee and Joseph Papa will, subject to his re-appointment by the shareholders, be appointed Chairman in his place. All members ofthe Remuneration Committee are considered to be independent in accordance with the Code, the New Code and SEC and NYSErequirements.
The Remuneration Committee met four times during the year. The principal duties of the Remuneration Committee are reviewing:
• the remuneration, including pension entitlements, of executive directors and executive officers;
• the relationship between the remuneration of executive directors and that of other employees;
• the competitiveness of executive remuneration using data from independent consultants on companies of similar size, technologies andinternational complexity;
• the performance targets for the incentive plan and long-term incentive plans and the performance against these targets; and
• the operation of the long-term incentive plans, share option plans and performance related incentive plan, determining the participantsand overall grant levels.
The activities of the Remuneration Committee throughout 2010 are described in greater detail in the Directors’ Remuneration Report onpages 59 to 71.
2010 Annual Report 51

Nominations Committee
The members of the Nominations Committee are John Buchanan (Chairman), David Illingworth, Rolf Stomberg and Richard De Schutter. RolfStomberg and Richard De Schutter are considered to be independent in accordance with the Code, the New Code and SEC and NYSErequirements. David Illingworth will cease to be a member of the Nominations Committee when he retires from the Board on 14 April 2011and Olivier Bohuon will, subject to his re-appointment by the shareholders, be appointed in his place.
The Nominations Committee met eight times during the year and those meetings were attended by all members.
The principal duties of the Nominations Committee are:
• to review the Board structure, size and composition and to make recommendations to the Board accordingly;
• to identify and nominate suitable candidates to the Board to fill any Board vacancies as they arise, evaluating the balance of skills,knowledge and experience currently on the Board and which may be required in the future;
• to make recommendations to the Board on the continuation in office, or otherwise, of any executive director or non-executive director;
• to make recommendations to the Board regarding membership of the Board Committees and the fees paid to non-executive directors;and
• to consider and if thought fit approve the appointment of any executive director as a non-executive director of another company.
The principle work of the Nominations Committee in 2010 was to search for a Chief Executive Officer to replace David Illingworth, who hadindicated his desire to retire as and when a suitable successor could be found. A thorough search was undertaken using the services of anexternal firm of headhunters and internal candidates were also considered. A number of meetings were held to define the role and the typeof Chief Executive Officer required, to discuss potential candidates and, in 2011, finally to consider making a recommendation to the Boardto appoint Olivier Bohuon.
The Nominations Committee also continued the process commenced in 2009 to search for new non-executive directors, recognising that anumber of non-executive directors have served on the Board for periods of time which could give rise to questions about their continuedindependence. Ian Barlow and Geneviève Berger were appointed to the Board as non-executive directors in March 2010. The searchhowever has continued for additional directors to fit the profiles prepared by the full Board in 2009. The services of a headhunting firm wereutilised in this process and whilst a number of candidates were considered, no further appointments were made. The search will continueinto 2011.
Should the need arise, the Senior Independent Director would oversee the process for the appointment of a new Chairman.
Ethics and Compliance Committee
The members of the Ethics and Compliance Committee are Richard De Schutter (Chairman), Pamela Kirby and Joseph Papa. All members ofthe Committee are considered to be independent in accordance with the Code, the New Code and SEC and NYSE requirements. DavidIllingworth, Chief Executive, attends every meeting. With effect from 14 April 2011, subject to their re-appointment by shareholders, PamelaKirby will replace Richard De Schutter as Chairman of the Ethics and Compliance Committee and Geneviève Berger will join the Committeeas an additional member.
The Ethics and Compliance Committee met four times during the year.
The principal duties of the Ethics and Compliance Committee are:
• to review and approve Group policies as they relate to ethics and compliance matters;
• to receive reports and review activities from executive and specialist groups managing ethical and compliance matters across the Group’soperations;
• to review and approve implementation of ethics and compliance programmes;
• to receive and review reports of audits and monitoring of ethics & compliance procedures and processes;
• to review ethics and compliance best practice and continuous improvement programmes by reference to appropriate external reports andbenchmarking;
• to review, where appropriate, the Group’s internal communications and training in relation to ethics and compliance policies andprocedures;
52 2010 Annual Report

Des
crip
tion
ofth
eG
roup
Busi
ness
Revi
ew,
Liqui
dity
and
Pros
pect
sCo
rpor
ate
Gov
erna
nce
Stat
emen
tD
irect
ors’
Rem
uner
atio
nRe
port
Gro
upA
ccou
nts
Com
pany
Acc
ount
sIn
vest
orIn
form
atio
n
• to review the Group’s external communication and reporting in respect of ethics and compliance programmes and the operation of theCommittee;
• to review the integration of ethics and compliance procedures with the business risk management programme; and
• to review and approve ethics and compliance strategy and plans.
During the year, the Ethics and Compliance Committee has:
• monitored the continued roll-out of the Enhanced Global Compliance Programme;
• reviewed progress in enhancing precautions with regard to third party sellers;
• received reports from management in relation to progress made under the Enhanced Global Compliance Programme, the activities of theUS and Global Compliance programmes and concerns raised through the Group’s hotline and other channels; and
• considered the impact of the UK Bribery Act.
Board and Committee AttendanceThe table below details attendance of directors at Board and Committee meetings held throughout the year:
Board10 meetings
RemunerationCommittee4 meetings
AuditCommittee5 meetings
NominationsCommittee8 meetings
Ethics andComplianceCommittee4 meetings
John Buchanan 10 - - 8 -David J. Illingworth 10 - - 8 -Adrian Hennah 10 - - - -Ian Barlow (i) 8 - 3 - -Geneviève B. Berger (i) 8 - - - -Pamela J. Kirby 10 4 - - 4Brian Larcombe (ii) 10 2 5 - -Warren D. Knowlton (iii) 2 1 3 - -Joseph C. Papa (iv) 9 4 5 - 4Richard De Schutter 10 4 5 8 4Rolf W. H. Stomberg (iv) 8 4 5 8 -
(i) Joined the Board on 5 March 2010.(ii) Appointed to the Remuneration Committee on 7 September 2010.(iii) Resigned from the Board on 6 May 2010(iv) Attended all scheduled meetings and was unable to attend some meetings arranged at short notice because of prior commitments.
From time to time directors also attend Committee Meetings at the invitation of the Committee Chairman even if they are not members of theCommittee in order to gain a better understanding of the activities of the Committee.
Liaison with ShareholdersThe executive directors meet regularly with investors to discuss the Company’s business and financial performance both at the time of theannouncement of results and at industry investor events. During 2010, the executive directors held meetings with institutional investors,including investors representing approximately 54% of the share capital as at December 2010. As part of this programme of investormeetings, during 2010, John Buchanan, the Chairman, met with investors representing 11% of the share capital. Over the last three years,he has met investors representing in aggregate 35% of the share capital. The Company’s website (www.smith-nephew.com) containsinformation of interest to both institutional investors and private shareholders, including financial information and webcasts of the resultspresentations to analysts for each quarter, as well as specific information for private shareholders relating to the management of theirshareholding.
2010 Annual Report 53

Directors’ Indemnity ArrangementsAppropriate directors and officers liability insurance is in place and Deeds of Indemnity have been entered into between the Company anddirectors and certain directors of some subsidiary companies. The Deeds of Indemnity allow for indemnification of directors in respect ofproceedings brought by third parties and for the Company to provide funds for directors’ ongoing costs in defending a legal action as theyare incurred rather than after judgement has been given. Individual directors would still be liable to pay any damages awarded to theCompany in an action against them and to repay their defence costs to the extent funded by the Company if their defence wereunsuccessful.
Share CapitalAs at 23 February 2011, the Company’s total issued share capital with voting rights consisted of 892,091,804 Ordinary Shares of 20 UScents each. 61,720,798 Ordinary Shares are held in treasury and are not included in the above figure.
As at 23 February 2011, notification had been received from the undernoted persons under the DTR in respect of interests in 3% or more ofthe issued Ordinary Shares of the Company.
Number of Shares %
Capital Group of Companies Inc 44,594,320 5.05Legal and General Group plc 44,704,245 5.02Newton Investment Management Limited 44,337,465 4.98BlackRock, Inc 42,101,761 4.73
Other than disclosed above, the Company is not aware of any person who has a significant direct or indirect holding of securities in theCompany and is not aware of any persons holding securities which may control the Company. There are no securities in issue which havespecial rights as to the control of the Company.
DividendThe Board has proposed a final dividend of 9.82 US cents per share which, together with the first interim dividend of 6.00 US cents, makes atotal for 2010 of 15.82 US cents. The final dividend is expected to be paid, subject to shareholder approval, on 19 May 2011 toshareholders on the register of Members at the close of business on 3 May 2011.
Annual General MeetingThe Company’s Annual General Meeting is to be held on 14 April 2011 at 2pm at The Royal Society, 6-9 Carlton House Terrance, London,SW1Y 5AG. Notice of the meeting has been sent to all registered shareholders with an accompanying letter from the Chairman.
Directors’ ReportThe Directors’ Report includes the following sections; “Description of the Group” (pages 3 to 21), “Business Review, Liquidity and Prospects”(pages 23 to 44), “Corporate Governance Statement” (pages 45 to 57), “Directors’ Remuneration Report” (pages 59 to 71) and “InvestorInformation” (pages 135 to 142).
Corporate Headquarters and Registered OfficeThe corporate headquarters is in the UK and the registered office address is: Smith & Nephew plc, 15 Adam Street, London WC2N 6LA, UK.Registered in England and Wales No. 324357. Tel: +44 (0) 20 7401 7646. Website: www.smith-nephew.com.
54 2010 Annual Report

Des
crip
tion
ofth
eG
roup
Busi
ness
Revi
ew,
Liqui
dity
and
Pros
pect
sCo
rpor
ate
Gov
erna
nce
Stat
emen
tD
irect
ors’
Rem
uner
atio
nRe
port
Gro
upA
ccou
nts
Com
pany
Acc
ount
sIn
vest
orIn
form
atio
n
ACCOUNTABILITY, AUDIT AND INTERNAL CONTROL FRAMEWORK
Internal Control and Risk ManagementThe Board has overall responsibility for ensuring that the Group maintains an adequate system of internal control and risk management andfor reviewing its effectiveness. The Internal Audit function and the Group Risk Committee consider and test effectiveness and report to theAudit Committee and to the Board respectively on their findings. The Board has reviewed the system of internal control, including financialcontrol for the year ended 31 December 2010 and up to the date of approval of this Annual Report and Accounts. The Group’s system ofinternal control is designed to manage rather than eliminate the risk of failure to achieve business objectives, and can only providereasonable and not absolute assurance against material misstatement or loss.
Risk CommitteeThe members of the Risk Committee are the executive directors, certain senior executives and the Company Secretary. The Chairman of theCommittee is the Chief Executive. As an integral part of planning and review, the management of each of the Global Business Units identifiesthe risks involved in their business, the probability of those risks occurring, the impact if they do occur and the actions being taken tomanage and mitigate those risks. The Risk Committee meets twice a year to review the major risks identified by the Global Business Unitsand any mitigating actions being taken. As appropriate, the Risk Committee may re-categorise risks or require further information ormitigating action to be undertaken. The Risk Committee reports to the Board on an annual basis detailing all significant risks categorised bypotential financial impact on profit and share price and by likelihood of occurrence. Details of new, key or significantly increased risks alongwith actions put in place to mitigate such risks are reported to the Board as appropriate. The principal risks identified through this processare detailed in “Risk Factors” to be found on pages 18 to 21.
Audit CommitteeThe activities of the Audit Committee are described in greater detail in pages 50 to 51.
The Audit Committee reviews the Group’s approach to internal financial control and the operation of the risk management process. During2010, the effectiveness of the Global Business Units’ systems to identify and manage material risks was evaluated and the findings werereported to the Audit Committee. No material weaknesses were identified in these systems.
Auditor Independence PolicyThe Audit Committee has adopted an Auditor Independence Policy which forms part of the Committee’s Terms of Reference. This policygoverns the conduct of non-audit work by the external auditors. This prohibits the auditors from performing services which would result inthe auditing of their own work, participating in activities normally undertaken by management, acting as advocate for the Group and creatinga mutuality of interest between the auditors and the Group, for example being remunerated through a success fee structure. Each year, theAudit Committee pre-approves the budget for fees relating to audit and non-audit work, including taxation services, in accordance with alisting of particular services. In the event that limits for these services are expected to be exceeded or the Group wants the external auditorsto perform services that have not been pre-approved, approval by the Chairman of the Audit Committee is required, together with anotification to the Audit Committee of the service and the fees involved. All services provided by the independent auditors during the yearwere pre-approved by the Audit Committee.
The Auditor Independence Policy also governs the policy regarding the audit partner rotation in accordance with the Auditing PracticesBoard Ethical Standards in the UK and the SEC rules in the US. Partners and senior audit staff may not be recruited by the Group unless twoyears have expired since their previous involvement with the Group.
Management’s Report on Internal Control over Financial ReportingManagement is responsible for establishing and maintaining adequate internal control over financial reporting as defined in Rule 13a-15(f)and 15d-15(f) under the Securities Exchange Act of 1934.
Because of inherent limitations, internal controls over financial reporting may not prevent or detect all mis-statements. In addition,projections of any evaluation of effectiveness in future periods are subject to the risk that controls may become inadequate because ofchanges in conditions, or that the degree of compliance with the policies or procedures may deteriorate.
2010 Annual Report 55

In accordance with the requirement in the US under s404 of the Sarbanes-Oxley Act, management assessed the effectiveness of theGroup’s internal control over financial reporting as at 31 December 2010. In making this assessment, management used the criteria set forthby the Committee of Sponsoring Organisations of the Treadway Commission in Internal Control-Integrated Framework. Based on itsassessment, management has concluded and hereby reports that, as at 31 December 2010, the Group’s internal control over financialreporting is effective based on those criteria.
Ernst & Young LLP, an independent registered public accounting firm, has issued an audit report on the Group’s internal control overfinancial reporting as of 31 December 2010. This report appears on page 79.
There has been no change in the Group’s internal control over financial reporting during the period covered by this Annual Report that hasmaterially affected, or is reasonably likely to materially affect, the Group’s internal control over financial reporting.
Disclosures Committee and Evaluation of Disclosure Controls and ProceduresThe Disclosures Committee is chaired by the Chief Executive and comprises the Chief Financial Officer and various additional seniorexecutives. The secretary is the Company Secretary or her designate. The Committee meets as required and approves the release of allmajor communications to investors, to the UK Listing Authority and the London and New York Stock Exchanges.
The Chief Executive and Chief Financial Officer have evaluated the effectiveness of the design and operation of the Group’s disclosurecontrols and procedures as at 31 December 2010. Based upon, and as at the date of that evaluation, the Chief Executive and Chief FinancialOfficer concluded that the disclosure controls and procedures were effective.
Code of ConductThe revised Code of Conduct approved by the Ethics and Compliance Committee was issued to all employees during 2010. The Code ofConduct sets out the basic legal and ethical principles for carrying out business and applies both to employees and those who act on theGroup’s behalf. It sets out in detail how persons covered by the Code of Conduct are expected to interact ethically with healthcareprofessionals and government officials. It also covers the broader issues of ethics and compliance throughout the business and includes acode of business principles. A copy of the Code of Conduct can be found on the Group’s website (www.smith-nephew.com).
The Code of Conduct includes a whistle blowing policy which enables persons in all jurisdictions where the Group operates to contact theGroup anonymously through an independent provider. All calls and contacts are investigated and the appropriate action taken, includingreports to senior management or the Board where warranted.
Code of Ethics for Senior Financial OfficersThe Board of directors has adopted a Code of Ethics for senior financial officers, which is available on the Group’s website (www.smith-nephew.com) and on request. It applies to the Chief Executive, Chief Financial Officer, Group Financial Controller and the Group’s seniorfinancial officers. There have been no waivers to any of the Code’s provisions nor any amendments made to the Code during 2010 or upuntil 23 February 2011.
Principal Accountant Fees and ServicesFees for professional services provided by Ernst & Young LLP, the Group’s independent auditors in each of the last two fiscal years, in eachof the following categories were:
2010$ million
2009$ million
Audit 3 3Audit related fees - -Tax 2 2Other - -
5 5
Audit fees include fees associated with the annual audit and local statutory audits required internationally. A more detailed breakdown ofaudit fees may be found in Note 35 of the Notes to the Group Accounts.
56 2010 Annual Report

Des
crip
tion
ofth
eG
roup
Busi
ness
Revi
ew,
Liqui
dity
and
Pros
pect
sCo
rpor
ate
Gov
erna
nce
Stat
emen
tD
irect
ors’
Rem
uner
atio
nRe
port
Gro
upA
ccou
nts
Com
pany
Acc
ount
sIn
vest
orIn
form
atio
n
Disclosure of Information to the AuditorsIn accordance with Section 418 of the Companies Act 2006, the directors serving at the time of approving the Directors’ Report confirm that,to the best of their knowledge and belief, there is no relevant audit information of which the auditors, Ernst & Young LLP, are unaware andthe directors also confirm that they have taken reasonable steps to be aware of any relevant audit information and, accordingly, to establishthat the auditors are aware of such information.
AuditorsErnst & Young LLP have expressed their willingness to continue as auditors and resolutions proposing their reappointment and to authorisethe directors to determine their remuneration will be proposed at the Annual General Meeting as approved by the Audit Committee.
2010 Annual Report 57

THIS PAGE INTENTIONALLY LEFT BLANK
58 2010 Annual Report
Des
crip
tion
ofth
eG
roup
Busi
ness
Revi
ew,
Liqui
dity
and
Pros
pect
sCo
rpor
ate
Gov
erna
nce
Stat
emen
tD
irect
ors’
Rem
uner
atio
nRe
port
Gro
upA
ccou
nts
Com
pany
Acc
ount
sIn
vest
orIn
form
atio
n
DIRECTORS’ REMUNERATION REPORTThe Directors’ Remuneration Report (the “Report”) has been prepared in accordance with The Large and Medium-sized Companies andGroups (Accounts and Reports) Regulations 2008 (the “Regulations”) and meets the relevant requirements of the Financial Services Authority(“FSA”) Listing Rules. As required by the Regulations, a resolution to approve the Report will be proposed at the Annual General Meeting on14 April 2011.
The Remuneration Committee Membership and MeetingsThe members of the Remuneration Committee are Rolf Stomberg (Chairman) Pamela Kirby, Brian Larcombe (appointed to the RemunerationCommittee on 7 September 2010), Joseph Papa and Richard de Schutter. Warren Knowlton also served as a member of the RemunerationCommittee up to 6 May 2010, when he retired from the Board. With effect from 14 April 2011, Rolf Stomberg will cease to be Chairman ofthe Remuneration Committee and will be replaced by Joseph Papa. All members of the Committee are non-executive directors and areconsidered by the Board to be independent in accordance with the Combined Code, the UK Corporate Governance Code and therequirements of the SEC and the NYSE. The Company Secretary acts as secretary to the Remuneration Committee.
The Remuneration Committee met four times during the year and each meeting was attended by all members. In addition, the RemunerationCommittee agreed on certain resolutions by e-mail when unable to meet physically.
At the request of the Remuneration Committee, the Chairman, John Buchanan, the Chief Executive, David Illingworth and various membersof the Human Resources function were invited to attend meetings of the Remuneration Committee throughout the year. David Illingworth andthe Human Resources function advise the Remuneration Committee on all aspects of the Group’s reward structures and policies and JohnBuchanan offers a valuable perspective given his experience on the Boards of other companies. None of these directors or officers ispresent for any discussion concerning their own remuneration.
During the year, the Remuneration Committee received information from a number of independent consultants appointed by the Company:Deloitte LLP on a broad range of remuneration issues and on long-term incentive plan comparative performance and Towers Watson andMercer Limited on salary data when considering base salaries of executive directors and executive officers. Deloitte LLP also providedtaxation advice to the Group, while Towers Watson and Mercer Limited have provided general salary data and advised on variouscompensation matters below Board level. None of these advisors advised any director in respect of their own remuneration.
The Role of the Remuneration CommitteeThe terms of reference of the Remuneration Committee are available on the Group’s website at www.smith-nephew.com.
The Remuneration Committee reviews:
• The remuneration, including pension entitlements, of executive directors and executive officers;
• The relationship between the remuneration of executive directors and that of other employees;
• The competitiveness of executive remuneration using data from independent consultants on companies of similar size, technologies andinternational complexity;
• The performance targets for the bonus plan and long-term incentive plans and the performance against these targets; and
• The operation of the long-term incentive plans, share option plans and performance related bonus plan, determining the participants andoverall grant levels.
Remuneration PolicyThe remuneration policy as approved by the Remuneration Committee and the Board is designed to ensure that remuneration is sufficientlycompetitive to attract, retain and motivate executive directors and executive officers of a calibre that meets the Group’s needs to achieve itsbusiness objectives. The policy is designed to ensure that remuneration is firmly linked with the success of the Group and achievementagainst the Group’s key performance indicators, so that executive directors and executive officers are suitably incentivised to generate long-term and sustainable value for shareholders.
The Remuneration Committee has responsibility for determining the individual remuneration packages for the executive directors andexecutive officers of the Company, as detailed on page 51 of this Annual Report. In determining these remuneration packages, theRemuneration Committee has regard to the levels of pay and the structure of remuneration packages across the entire Group. The shape ofthe remuneration packages for the executive directors and executive officers is broadly similar to the remuneration packages for other
2010 Annual Report 59

executives in the Group. The salary levels and multiples used in the various incentive plans differ according to level of seniority. This isexplained in greater detail within the discussion on each incentive plan.
Across the Group, base pay and benefits are referenced to median competitive levels for acceptable performance whilst incentive plans,both short and long-term, are designed to motivate and reward out-performance. Total remuneration packages are benchmarked byreference to appropriate UK and US companies and where relevant other local markets. Individual remuneration levels are based onmeasurable performance against fair and open objectives and there are no automatic pay adjustments unless required by law or localprotocol.
The policies described in this Report have been applied throughout 2010 and it is intended that they will continue to apply throughout 2011.The Remuneration Committee will however continue to monitor its policies against evolving market practice and relevant guidance which isparticularly relevant in the current economic climate.
The Remuneration Committee has a policy to consult with the Company’s major shareholders and relevant stakeholders prior toimplementing any significant change to the remuneration policy and places great value in developing a transparent relationship on suchmatters.
Principal Components of RemunerationThe remuneration package for the Company’s senior executives, which includes the executive directors and executive officers, comprisesthe following elements:
• Basic salary and benefits;
• Annual incentive with a deferred element under the Deferred Bonus Plan;
• Long-term incentives, comprising Performance Shares and Share Options; and
• Pension entitlements.
As disclosed in last year’s Report, a full and detailed review of remuneration arrangements was carried out in 2009. A further detailed reviewwas therefore not considered to be appropriate in 2010 as the Remuneration Committee wanted the opportunity to assess the effectivenessof the changes introduced in 2009, some of which were only implemented in 2010. During 2010 therefore, the Remuneration Committeecontinued to have regard to the latest developments in the economic and corporate governance environment, but proposed no furtherchange to the overall structure of remuneration packages. The Remuneration Committee continues to aim for incentive arrangements whichare firmly linked to the long-term success of the business and based on balanced measures of corporate performance. The RemunerationCommittee believes that the changes implemented in 2009 and retained in 2010 continue to meet these objectives.
a) Base Salary and BenefitsAcross the Group, base salary is determined both by the scope and the responsibility of the position and performance potential of theindividual. Salaries are reviewed annually with effect from 1 April each year. Base salary is benchmarked by reference to the median for therelevant geographic market and employees are paid in a currency related to their home market. The Group also provides certain benefitssuch as private healthcare and a company car or allowance in line with competitive practice for the applicable geographic market. TheRemuneration Committee also considers any pension consequences and costs to the Company when determining base salary increases forexecutive directors and executive officers.
With effect from 1 April 2010, the Remuneration Committee agreed the following base salaries for the executive directors:
David Illingworth $1,407,000Adrian Hennah £ 530,000
Following the annual review conducted in February 2011, the Remuneration Committee determined that with effect from 1 April 2011, DavidIllingworth’s base salary would remain unchanged in view of his impending retirement on 10 August 2011.
Adrian Hennah continues to make, what the Board considers, an excellent contribution as Chief Financial Officer. During 2010, headditionally took on responsibility for a number of significant aspects of the day to day handling of operational matters, beyond the remit of aconventional Chief Financial Officer. In particular:
• Management of a number of initiatives to drive and achieve the Group strategy;
• Responsibility for addressing operational improvements, including field efficiencies and inventory levels in the Orthopaedics globalbusiness unit;
• Key role in establishing and driving margin improvement performance.
60 2010 Annual Report

Des
crip
tion
ofth
eG
roup
Busi
ness
Revi
ew,
Liqui
dity
and
Pros
pect
sCo
rpor
ate
Gov
erna
nce
Stat
emen
tD
irect
ors’
Rem
uner
atio
nRe
port
Gro
upA
ccou
nts
Com
pany
Acc
ount
sIn
vest
orIn
form
atio
n
He also continues to deliver outstanding individual performance and contribution to the Group. Following a review of market positioning andin light of his enhanced role, the Remuneration Committee believes that a re-rating of his base salary is appropriate. With effect from 1 April2011, his base salary will therefore be £580,000, which is an increase of 9.4%.
On 10 February 2011, the appointment of Olivier Bohuon as an Executive Director from 1 April 2011 and Chief Executive Officer with effectfrom 14 April 2011 was announced. Olivier Bohuon’s base salary will be €1,050,000. Further details of his remuneration package aredisclosed on page 66.
In common with our practice across the Group, the executive directors are each paid in their home currency.
The committee is mindful of salary increase for all employees when considering salaries for executive directors.
Average salary increases across the Group as a whole in 2011 will range between 2.5% and 3%.
b) Annual Incentive with Deferred Element under the Deferred Bonus PlanAn Annual Incentive Plan is operated across the Group. The plan is designed to encourage outstanding performance without promotingexcessive risk taking in order to achieve a short term incentive opportunity.
Senior executives also participate in the Deferred Bonus Plan under which a proportion of their annual incentive (dependent upon theirseniority in the organisation) is compulsorily deferred into shares which vest in equal annual tranches over three years, subject to theparticipant’s continued employment. No further performance conditions apply to these deferred shares. The Deferred Bonus Plan isdesigned to encourage executives to build up and maintain a significant shareholding in the Company to encourage them to behave and actlike shareholders.
Executive directors and officers participate in the same Annual Incentive Plan and Deferred Bonus Plan although the targets and maximumlevels are different reflecting their differing roles and levels of responsibility.
During 2010, the maximum annual incentive opportunity for executive directors was 150% of annual base salary with an incentive of 100%for on target performance. For executive officers, the maximum annual incentive opportunity was 140%. A proportion of the annual incentiveearned at and above target is compulsorily deferred into shares as explained above. For executive directors, the amount deferred is onethird and for executive officers it is one quarter. The maximum cash incentive opportunity is therefore 100% of salary for executive directors.There is no deferral of incentive for below target level performance. The maximum and target incentive awards for executive directors willremain unchanged in 2011.
The performance measures for the Annual Incentive Plan are linked to the four strategic pillars for success set out on page 4 of this AnnualReport:
• ‘Customer led’: outperforming our served markets by focusing on our customers; anticipating and innovating to deliver on their needs.
• ‘Efficient’: delivering operating margin improvement and freeing up resources to invest in the business, through streamlining processesand systems re-engineering.
• ‘Investing for growth’: driving additional sales from new opportunities such as biologics, emerging markets and adjacent technologies.
• ‘Aligned’: aligning objectives across the business and developing our talent and organisation for consistent execution, through leveragingcore functions and sharing best practices.
From these four strategic “pillars”, a scorecard has been developed for each Global Business Unit, which identifies the strategic imperativesfor each part of the business. Employees across the Group have performance objectives which link into the business scorecard andultimately into these four strategic pillars.
The incentive bonus in 2010 for executive directors was subject to performance measures relating to revenue (30% of incentive), tradingprofit/margin (30%) and trading cash flow (15%). The remaining 25% of the incentive payable was dependent on personal objectives. Inrespect of 2010, the annual incentives earned by the executive directors were as follows:
Incentive paid in cashIncentive deferred into an
award over sharesTotal Incentive as percentage of base
salary
David Illingworth $1,202,985 $602,196 128.3%Adrian Hennah £ 453,150 £226,840 128.3%
2010 Annual Report 61

Over the period, underlying revenue growth was 4%, underlying trading profit growth was 11%, trading margin improved by 180 bps andtrading profit to cash conversion was 85%. Collectively, these performance measures triggered 60.5% of the maximum incentive andpersonal objectives triggered 25% of the maximum incentive for David Illingworth and 25% of the incentive for Adrian Hennah.
In 2011, the Annual Incentive Plan will remain linked to the four strategic pillars for success and the business scorecard. The performancemeasures will comprise revenue (30%), trading profit (30%) and trading cash flow (15%). The remaining 25% of the total incentive will bedependent on individual personal objectives.
c) Long-Term IncentivesThe Group operates two main long-term incentive plans for executive directors: the 2004 Performance Share Plan and the 2004 ExecutiveShare Option Plan. Annual awards of 150% of salary are made under the 2004 Performance Share Plan and annual grants of options at100% of salary are made under the 2004 Executive Share Option Plan. In addition, there are some outstanding awards that were madeunder legacy plans no longer in operation. Performance shares are also awarded and options granted to executive officers and other seniorexecutives under the 2010 Global Share Option Plan which was approved by shareholders in 2010.
(i) 2004 Performance Share Plan (PSP)
Under the 2004 Performance Share Plan, awards over shares are currently made to executive directors in the second half of the year.Awards are made to executive officers and other senior executives at the same time under the Global Share Plan 2010 and further details ofthis plan are given below.
The initial market value of awards made to executive directors in 2010 was equivalent to 150% of their base. The Remuneration Committeehas agreed that for 2011 the level of these awards will remain the same.
Share awards under the 2004 Performance Share Plan will only vest if pre-determined levels of EPSA growth are achieved. In addition, inorder to drive enhanced shareholder value and maintain close alignment of executive and shareholder interests, the number of sharesdelivered to executives may be increased subject to the achievement of superior Total Shareholder Return (“TSR”) measured against themajor companies in the medical devices industry. There is no retesting. The Remuneration Committee believes that the combination of EPSAand TSR measures encourages executives to achieve outstanding performance both in absolute terms looking at the EPSA measurementand also in relative terms compared to our peers looking at the TSR measurement.
A relative EPSA measure was used for awards made in 2009 and 2010. The targets for growth in EPSA are related to growth of relevantmarkets, taking into account both volume and price changes in each of our major markets, and weighted according to our relative turnoverin each of those markets to provide an estimate of “global market growth” calculated on an annual basis for each year of the plan. The actualEPSA growth over the three years will then be compared to the compounded EPSA growth targets to calculate the level of vesting. Globalmarket growth is derived from a range of publicly available sources including individual competitor company press releases, quarterly resultsand analyst reports, as well as data purchased from a variety of industry surveys.
The following table sets out the performance measure used for awards made in 2010.
Annual Growth in EPSA over the three years ending 31 December 2012 Percentage of award vesting
Market Growth +2% per annum 25% – ThresholdMarket Growth +5% per annum 50% – TargetMarket Growth +8% per annum 100% – Maximum
None of the award will vest if the growth in EPSA over three years is less than Threshold and the award will vest pro rata on a straight linebasis between the points given in the table above if growth in EPSA is between these levels.
If the Company’s TSR is positioned above median when compared with the TSR of medical devices companies, then the number of vestedshares delivered to participants following the achievement of the EPSA targets will be increased by a multiplier as follows:
TSR Ranking within comparator group Multiplier
Below or at Median 1.0xUpper quartile 1.3xUpper decile or above 1.5x
The multiplier increases on a straight line basis between the above points.
62 2010 Annual Report

Des
crip
tion
ofth
eG
roup
Busi
ness
Revi
ew,
Liqui
dity
and
Pros
pect
sCo
rpor
ate
Gov
erna
nce
Stat
emen
tD
irect
ors’
Rem
uner
atio
nRe
port
Gro
upA
ccou
nts
Com
pany
Acc
ount
sIn
vest
orIn
form
atio
n
TSR will be measured relative to a tailored sector peer group of medical devices companies. The companies in the comparator group for theawards made in 2010 are:
Arthrocare KCIBard MedtronicBaxter Nobel BiocareBecton Dickinson NuvasiveBoston Scientific OrthofixColoplast Group StrykerConmed St Jude MedicalCovidien SynthesEdwards Life Sciences Corp Wright MedicalJohnson & Johnson Zimmer
The Group’s TSR performance and its performance relative to the comparator group is independently monitored and reported to theRemuneration Committee by Deloitte LLP.
The performance measures to be used for the awards to be made in 2011 to executive directors under the 2004 Performance Share Planwill be on the basis of absolute measures of EPSA growth.
The following table sets out the performance measure which will be used for awards to be made in 2011.
Growth in EPSA over the three years ending 31 December 2013 Percentage of award vesting
EPSA growth of 15% (approximately 4.5% compounded annually over three years) 25% – ThresholdEPSA growth of 20% (approximately 6% compounded annually over three years) 50% – TargetEPSA growth of 30% (approximately 9% compounded annually over three years) 100% – Maximum
None of the award will vest if the growth in EPSA over three years is less than Threshold and the award will vest pro rata on a straight linebasis between the points given in the table above if growth in EPSA is between these levels.
In addition, as in previous years, if the Company’s TSR is positioned above median when compared with the TSR of medical devicescompanies listed above, then the number of vested shares delivered to participants following the achievement of the EPSA targets will beincreased by the multiplier as detailed in the table above.
The awards made in 2008 were subject to performance conditions determined in 2008. EPSA growth over the three years ending31 December 2010, adjusted to take account of the suspension of the share buy back programme in 2008, was 45% and this meant that27% of the award will vest on the third anniversary of the award, being 15 August 2011. Over the same period the Company was ranked11th out of 21 companies in the medical devices comparator group which meant that a multiplier of 1 was applied to the number of sharesvesting under the EPSA target with the result that the following awards will vest on 15 August 2011:
Number of shares under award Number of shares vesting
David Illingworth 168,810 45,578Adrian Hennah 120,578 32,556
ii) Executive Share Options
Under the 2004 Executive Share Option Plan, share options are granted to executive directors in the second half of the year at the sametime as awards are made under the 2004 Performance Share Plan. Share options are granted to executive officers and other seniorexecutives at the same time under the Global Share Plan 2010 and further details of this plan are given below.
Under the rules of the 2004 Executive Share Option Plan, the maximum market value of options which may be granted in each year isequivalent to the base salary of the participant. These options are granted at an option price no less than the market value at the date ofgrant and would vest on a change of control.
Share options are exercisable up to ten years from the date of grant and are only exercisable if the performance conditions over a three yearperformance period are achieved, beginning with the year in which the share option is granted.
2010 Annual Report 63

The performance measurement for grants made in 2010 was based on Total Shareholder Return. If the Company’s TSR is positioned abovemedian when compared with the TSR of certain medical devices companies over a three year period commencing 1 January 2010, then theoptions become exercisable as follows:
TSR Ranking within comparator group Percentage of option vesting
Below or at Median NilMedian 33%Upper Quartile 100%
Options vest on a straight line basis between these points. If the Company’s TSR performance is below median, no options vest. Thecomparator group is the same for the 2004 Performance Share Plan, outlined above.
The Company’s TSR performance and its performance relative to the comparator group is independently monitored and reported to theRemuneration Committee by Deloitte LLP.
Options granted in 2008 were subject to performance conditions determined in 2008. EPSA growth over the three years ended31 December 2010, adjusted to take account of the suspension of the share buy-back programme in 2008, was 45% and this meant that27% of the options granted will vest on 15 August 2011 as follows:
Number of options granted Number of options vesting
David Illingworth 112,540 30,385Adrian Hennah 80,385 21,703
iii) 2004 Co-Investment Plan
The 2004 Co-Investment Plan was replaced by the Deferred Bonus Plan described above in 2009. No awards were therefore made in 2009,2010 or will be made in future.
The 2004 Co-Investment Plan enabled executive directors, executive officers and certain senior executives to take part of their annualbonus in the form of shares. Under this plan, the participant elected the level of bonus to be used for this purpose up to a maximum of onehalf of the annual gross bonus capped at 20% of base salary. The net amount of the gross amount elected was then used to purchaseshares. The shares were then matched by the Company depending on growth in EPSA performance over a three year period, provided theshares are held for three years and the participant remains employed. For awards made in 2008, the Remuneration Committee determinedthat no matching shares will vest for each share acquired with bonus as EPSA growth amounted to 45% over the three year performanceperiod, which was below the threshold hurdle for this award.
iv) Restricted Stock Awards
No issues of restricted stock awards were made to executive directors in 2010. Restricted stock awards over a total of 82,305 shares weremade to two executive officers in 2010 on their appointment to the Company or their promotion to executive officer level.
v) Global Share Plan 2010
The Global Share Plan 2010 was approved by shareholders at the Annual General Meeting held in 2010. Certain executives and keyemployees below executive directors are eligible to participate in this plan. The plan operates on the same basis across the world with aseparate tax efficient schedule in the UK. The plan is flexible and capable of delivering performance shares with performance conditionsmirroring those of the 2004 Performance Share Plan and share options without performance conditions, both on an annual basis. Restrictedstock awards may also be granted under the plan on a “one-off” basis in particular circumstances. Executive directors are not generally ableto participate in this plan.
Executive share options under all plans are offered at no less than the market value at the date of grant. These options would vest on achange of control.
d) PensionsPensions – UK
UK based executive directors and executive officers have a normal retirement age of 62. Those in service pre-2003 participate in theSmith & Nephew UK Pension Fund and the UK Executive Pension Scheme, under which pensions have been accrued in the year at anannual rate of one-thirtieth of final pensionable salary up to a limit based on service of two-thirds of final pensionable salary, subject to HM
64 2010 Annual Report

Des
crip
tion
ofth
eG
roup
Busi
ness
Revi
ew,
Liqui
dity
and
Pros
pect
sCo
rpor
ate
Gov
erna
nce
Stat
emen
tD
irect
ors’
Rem
uner
atio
nRe
port
Gro
upA
ccou
nts
Com
pany
Acc
ount
sIn
vest
orIn
form
atio
n
Revenue & Customs (“HMRC”) constraints. Pensions in payment are guaranteed to increase by 5% per annum or the rate of inflation in theUK, if lower. Death in service cover of four times salary and spouse’s pension at the rate of two thirds of the member’s pension are providedon death. A salary supplement partially compensates for the HMRC earnings cap on final pensionable salary which continues to apply in thedefined benefit plans.
Those commencing employment post-2002 either participate in the defined contribution plan to which the Company contributes 30% ofbasic salary or they receive a non-pensionable, non-bonusable salary supplement of 30% of basic salary. Death in service cover of seventimes basic salary, of which four times salary is payable as a lump sum, is also provided. The non-pensionable salary supplement is alsoavailable to any executive director or executive officer who wishes to opt out of the defined pension plans for future service.
Pensions – US
US based executive directors and executive officers participate in either the defined benefit Smith & Nephew US Pension Plan or the definedcontribution US Savings plan 401 (K) Plus. Under the US Pension Plan, pensions accrue at an annual rate of approximately one sixty-sixth offinal pensionable salary up to a limit based on service of 53% of final pensionable salary. The plan also provides for a spouse’s pension atthe rate of one half of the member’s pension on death. Normal retirement age under the plan is 65. For executives in the defined benefit USpension plan, a supplementary plan is used to enable benefits to be payable from age 62 without reduction for early retirement. Asupplementary defined contribution plan is used to compensate for the earnings cap imposed by the US Internal Revenue Code and toprovide additional retirement benefits.
Shareholding RequirementsAcross the Group, senior executives are expected to build up and maintain a personal equity stake in the Company. Executive directors arerequired to accumulate a personal holding equivalent to 2 times their base salary and executive officers are required to accumulate apersonal holding equivalent to 1.5 times their base salary. Senior executives are also required to accumulate a personal holding at differinglevels depending upon their seniority. These holdings are expected to be accumulated within five years of the later of the date of theirjoining the company or the date they became eligible to join Senior Executive Share Plans. The personal equity stake includes ordinaryshares or ADRs held by the senior executive or their immediate family members as well as the gain element in any vested but unexercisedshare options. The Remuneration Committee will take account of the extent to which these guidelines have been met when making futureawards. Non-executive directors are expected to accumulate a personal holding in the Company equivalent to their annual basic fee withinthree years of their appointment.
As at 23 February 2011, David Illingworth holds shares to the value of 269% of his base salary and Adrian Hennah holds shares to the valueof 190% of his base salary.
Total Reward CompositionThe split between fixed and variable pay for the executive directors and executive officers in 2010 was as follows:
Base Pay (fixed)Annual Incentive (variable)earned in respect of 2010
Present economic value oflong-term incentives
(variable)
Executive directors 25% 32% 43%Executive officers 31% 32% 37%
Retirement Arrangements for David IllingworthOn 10 February 2011 it was announced that David Illingworth would retire from the Board and as Chief Executive at the conclusion of theAnnual General Meeting to be held on 14 April 2011. In accordance with the terms of his service contract he will continue to remain anemployee of the Company up to 10 August 2011 and will receive the pay and benefits he currently receives. At the end of his period ofemployment, the Remuneration Committee will determine the level of bonus payable (if any) in respect of his service during 2011.
The treatment of David Illingworth’s outstanding awards under the Company’s annual and long-term incentive plans will be in accordancewith the terms of the relevant scheme rules. Therefore, they will be pro-rated for time and vest at their normal vesting date subject to theapplicable performance conditions.
2010 Annual Report 65

At the end of his period of employment, it is envisaged that David Illingworth will continue to be engaged by the Company in a consultancycapacity, advising and supporting Olivier Bohuon, on specific matters, as required. It is initially expected that this consultancy arrangementwill be in place for a period of six months to 10 February 2012 for a fee of $90,000 per quarter. Such arrangement will be terminable on 30days notice from either David Illingworth or the Company.
Remuneration Terms for Olivier BohuonOn 10 February 2011, it was also announced that Olivier Bohuon would join the Board with effect from 1 April 2011 and would be appointedChief Executive Officer at the conclusion of the Annual General Meeting to be held on 14 April 2011. Olivier Bohuon will receive a basesalary of €1,050,000 and will participate in the Annual Incentive Plan, the 2004 Performance Share Plan and the 2004 Executive ShareOption Plan on the same basis as Adrian Hennah, his fellow executive director, as detailed elsewhere in this Directors’ RemunerationReport. In addition, he will receive similar benefits and a contribution of 30% of his base pay into his pension arrangements. He will beemployed under a service contract with a notice period of twelve months from the Company and six months from Olivier Bohuon on thesame basis as described below.
On leaving his previous employment, Olivier Bohuon is required to repay a cash amount and forfeit unvested restricted stock. On joining theCompany therefore, Olivier Bohuon will also receive a restricted stock award over 200,000 shares and a cash payment of €1,400,000 toenable him to repay the cash amount and to compensate him partially for the forfeited unvested shares. The restricted stock award will notbe subject to performance conditions and will vest in three equal tranches over a period of three years following the date of award, subjectto continued employment. In the event that he leaves the Company within 12 months of joining, he will be required to pay back the cashpayment.
Service ContractsDetails of the service contracts for each of the executive directors, including their notice periods, are set out below. The notice period underexecutive directors’ service contracts is twelve months from the Company and six months from the executive director. No payment will bemade in the case of dismissal for cause. On termination of the contract, the Company may require the executive director not to work hisnotice period and pay him an amount equivalent to the salary, pension and benefits he would have received had he been required to workhis notice period. In addition, the Remuneration Committee has discretion to pay the executive director a proportion of the bonus he wouldhave received had he been required to work his notice period. This discretion will only be exercised in exceptional circumstances and theRemuneration Committee will take into account their policy of not rewarding failure and the executive director will be required, wherepossible, to mitigate the loss. The Remuneration Committee may also enforce the non-compete clause in the executive director’s contract.
Following a change of control, in the event that an executive director’s employment is terminated or his responsibilities or duties arematerially diminished, or there is a reduction in their overall salary and benefits package or a change in the location of his or her place ofwork within 12 months following such a change of control, the executive directors are entitled to receive 12 months base salary and 12months bonus at target plus pension and benefits.
Executive directorDate of Service
Contract Effective Date Expiry DateNotice period from
company
David Illingworth 29 June 2007 1 July 2007 27 October 2015 12 monthsAdrian Hennah 1 February 2006 1 June 2006 12 November 2019 12 months
Executive directors may serve as a non-executive director of a maximum of one external company. Such appointments are subject to theapproval of the Nominations Committee and any fees earned are retained by the executive director. Currently neither executive directorholds such an appointment. Adrian Hennah will be proposed for election to the Boards of Reed Elsevier NV and Reed Elsevier PLC at theirAnnual General Meetings to be held on 19 and 20 April 2011 respectively.
Non-Executive DirectorsNon-executive directors do not have service contracts but instead have letters of appointment. Non-executive directors are normallyappointed for terms of three years, terminable at will, without notice by either the Group or the director and without compensation. TheChairman has a six month notice period. The Nominations Committee determines the remuneration of the non-executive directors and aimsto set fees that are competitive with other companies of equivalent size and complexity. Non-executive directors are not entitled to receiveawards under the Company’s long term incentive plans and no part of their fees are paid in shares.
Non-executive director fees were reviewed and increased in May 2010. Non-executive directors are paid a basic annual fee and theChairmen of the Audit, Remuneration and Ethics and Compliance Committees and the Senior Independent Director receive an extra fee in
66 2010 Annual Report

Des
crip
tion
ofth
eG
roup
Busi
ness
Revi
ew,
Liqui
dity
and
Pros
pect
sCo
rpor
ate
Gov
erna
nce
Stat
emen
tD
irect
ors’
Rem
uner
atio
nRe
port
Gro
upA
ccou
nts
Com
pany
Acc
ount
sIn
vest
orIn
form
atio
n
recognition of their additional responsibilities. An additional fee is also payable to non-executive directors in cases where intercontinentaltravel is necessary to attend Board and Committee meetings. The fees currently paid to non-executive directors are as follows.
Fee in UK Sterling Fee in US Dollars Fee in Euros
Basic Annual Fee £60,000 $110,000 €80,250Committee Chairman and Senior Independent Director Fee £15,000 $ 27,000 €20,000Intercontinental Travel fee (per meeting) £ 3,000 $ 6,000 € 4,500
The Chairman receives an all-inclusive fee of £375,000.
Directors’ Emoluments and PensionsThe following sections of the Report up to “Total Shareholder Return” have been audited by Ernst & Young LLP in accordance with theRegulations.
a) Salaries and Fees
Salariesand fees Benefits (i)
AnnualIncentive
(ii)
SalarySupplement
in lieu ofpensions
Total 2010(iv)
Total 2009(iv)
Thousands
Chairman (non-executive)John Buchanan £373 - - - £373 £350
Executive directorsDavid Illingworth $1,407 $28 $1,203 (iii) $104 $2,742 $2,667Adrian Hennah £526 £21 £453 £157 £1,157 £1,128
Non-executive directorsIan Barlow (v) £70 - - - £70 -Geneviève Berger (v) €83 - - - €83 -Pamela Kirby £64 - - - £64 £54Warren Knowlton (vi) $65 - - - $65 $163Brian Larcombe £64 - - - £64 £54Joseph Papa $134 - - - $134 $146Richard de Schutter $158 - - - $158 $158Rolf Stomberg €125 - - - €125 €93
(i) Benefits shown in the table above include cash allowances and benefits in kind.(ii) The amount shown is the cash element of the Annual Incentive Plan. A further amount, as shown on page 61 will be deferred into an award over
shares in 2011. The total amount for 2009 is presented on the same basis.(iii) The amount provided under an international pension plan for David Illingworth is disclosed below.(iv) Total executive and non-executive directors’ emoluments for 2010 amounted to $6,044,000 (2009 – $5,740,000), excluding portion of incentive
deferred.(v) Appointed on 5 March 2010.(vi) Retired on 6 May 2010.
2010 Annual Report 67

b) Pensions
AccruedPension as at
1 Jan 2010
Increase inaccruedpension
excludinginflation
Increase inaccrued
pension dueto inflation
Accruedpension at 31
Dec 2010
Transfervalue ofaccrued
pension at1 Jan 2010
Director’scontributionduring 2010
Increase intransfer
value overyear lessdirectors’
contribution
Transfervalue ofaccrued
pension at 31Dec 2010
$ thousands per annum $ thousands
David Illingworth 3 - - 3 19 - 1 20
$318,198 (2009 – $422,100) was provided under an International pension plan for David Illingworth.
No amounts have been paid to third parties in respect of executive directors’ services and no excess retirement benefits or compensationhas been paid to past executive directors.
c) Directors’ Share Options
Options asat 1
January2010
Grantedduring 2010
Exerciseprice ofoptionsgranted
Exercisedduring 2010
Lapsedduring 2010
Options asat 31
December2010
Averageexercise
price
Range ofexercisable
dates ofoptions held
at 31December
2010(number) (number) (number) (number) (number) (date)
David Illingworth(i) 419,865 - - - (43,098) 376,767 599p 05/07-08/18(ii) 177,875 166,115 (iv) $42.35 - - 343,990 $40.90 08/12-08/20
Total 597,740 166,115 - (43,098) 720,757
Adrian Hennah(i) 320,901 97,605 543p - (28,013) 390,493 534p 06/09-08/20(iii) 2,107 3,351 461p (2,107) - 3,351 461p 11/13-04/14
Total 323,008 100,956 (2,107) (28,013) 393,844
All options above were granted at prices below the market price at 31 December 2010 of 676.5p.
(i) Options over Ordinary shares granted under 2004 Executive Share Option Plans.(ii) Options over ADSs granted under 2004 Executive Share Option Plans. Figures in the above table show the equivalent number of ordinary
shares.(iii) Options granted under the UK ShareSave Scheme.(iv) Per ADS.
The range in the market price of the Company’s Ordinary Shares during the year was 537.5p to 696.5p and the market price at31 December 2010 was 676.5p. The notional gain made by Adrian Hennah on his exercise of options during the year was £2,781 (2009 –£nil). In 2009 the gain made by David Illingworth on exercising share options was $347,820, no gain was made by David Illingworth in 2010.
On 11 February 2011, 73% of the options granted to David Illingworth and Adrian Hennah under the 2004 Executive Share Option planlapsed following completion of the performance period. The remainder of options will vest and become capable of being exercised on thethird anniversary of their grant in August 2011.
68 2010 Annual Report

Des
crip
tion
ofth
eG
roup
Busi
ness
Revi
ew,
Liqui
dity
and
Pros
pect
sCo
rpor
ate
Gov
erna
nce
Stat
emen
tD
irect
ors’
Rem
uner
atio
nRe
port
Gro
upA
ccou
nts
Com
pany
Acc
ount
sIn
vest
orIn
form
atio
n
d) Long-Term Incentive Plan Awards
Award type
Maximumnumber of
sharesawarded at
1 January2010
(number)
Awardsduring the
year(number)
Market priceon award
Vestedaward
(number)
Marketprice onvesting
Lapsedaward
(number)
Number ofshares
awarded at31 December
2010(number)
Latestperformance
period(date)
David Illingworth(i) PSP 347,670 250,830 (iii) $42.07 (56,600) (iii) $50.85 (24,260) 517,640 2012(ii) PSP 252,346 - - (58,475) 674.5p (25,061) 168,810 2010RSA 81,300 - - (81,300) 651.5p - - -
Total 681,316 250,830 (196,375) (49,321) 686,450
Adrian Hennah(ii) PSP 389,591 146,408 543.0p (75,417) 676.5p (32,323) 428,259 2012
Total 389,591 146,408 (75,417) (32,323) 428,259
(i) Awards made over ADSs under the 2004 Performance Share Plan and Performance Share Agreements. Figures in the above table show theequivalent number of ordinary shares.
(ii) Awards made over ordinary shares under the 2004 Performance Share Plan and Performance Share Agreements.(iii) Per ADS.
On 11 February 2011, 73% of the awards granted to David Illingworth and Adrian Hennah in 2008 under the 2004 Performance Share Planlapsed following completion of the performance period. The remainder of the awards will vest on the third anniversary of their grant inAugust 2011.
e) 2004 Co-Investment Plan AwardsThe number of matched shares to be allocated to each executive director is subject to growth in EPSA over a three-year period. Details ofthe Plan can be found on page 64.
Total matchedawards as at
1 January 2010
Matched awardvested during the
year Lapsed award
Total matchedaward at 2 x gross
bonus held at31 December 2010
David Illingworth 16,170 (8,085) (8,085) -Adrian Hennah 58,298 (13,521) (13,521) 31,256
No awards were made under this plan in 2010 or 2009.
100% of the Award granted to Adrian Hennah in 2008 under the 2004 Co-Investment Plan has lapsed.
f) Deferred Bonus PlanThe vesting of awards under the Deferred Bonus Plan is dependent upon continued employment within the Group throughout the three-yearvesting period. Provided the condition of continued employment is met, one third of the total award will vest in each of the three years, onthe award’s anniversary.
Total as at1 January 2010
Awarded during2010 Vested during 2010
Total as at31 December 2010
David Illingworth 51,658 60,900 (17,217) 95,341Adrian Hennah 37,119 33,125 (12,371) 57,873
2010 Annual Report 69

Senior Management RemunerationThe Group’s administrative, supervisory and management body (“the senior management”) is comprised, for US reporting purposes, ofexecutive directors and executive officers.
In respect of the financial year 2010, the total compensation (excluding pension emoluments but including cash payments under theperformance related incentive plans) paid to the senior management for the year was $11,689,000 (2009 – $11,456,000, 2008 –$9,919,000), the aggregate increase in accrued pension benefits was $16,000 (2009 – increase of $9,000, 2008 – increase of $12,000)and the aggregate amounts provided for under the supplementary schemes was $1,141,000 (2009 – $1,179,000, 2008 – $507,000).
During 2010, senior management were granted options over 608,389 shares and 33,223 ADSs under the 2004 Executive Share OptionPlans, Global Share Plan 2010 and employee ShareSave plans. Performance share awards were granted to senior management over246,036 shares and 92,523 ADSs under the 2004 Performance Share Plan and the Global Share Plan 2010, 46,986 shares and 22,953ADSs under the Deferred Bonus Plan and restricted stock awards over a total of 82,305 shares. As of 23 February 2011, the SeniorManagement (10 persons) owned 284,053 shares and 75,147 ADSs, constituting less than 0.1% of the issued share capital of theCompany. Senior Management also held as of this date, options to purchase 1,917,581 shares and 77,298 ADSs, restricted stock awardsover 82,305 shares and 5,549 ADSs, performance share awards over 544,086 shares and 196,736 ADSs awarded under the 2004Performance Share Plan and the Global Share Plan 2010; and awards over 115,495 shares and 29,717 ADSs under the Deferred BonusPlan.
Directors’ InterestsBeneficial interests of the directors in the Ordinary Shares of the Company are as follows:
1 January 2010 31 December 2010 23 February 2011 (i)Numbers Shares Options Shares Options Shares Options
John Buchanan 154,531 - 156,977 - 156,977 -David Illingworth (ii) 172,005 597,740 326,828 720,757 326,828 638,602Adrian Hennah 78,898 323,008 140,698 393,844 140,698 335,162Ian Barlow - - 10,000 - 13,000 -Geneviève Berger - - - - - -Pamela Kirby 8,500 - 8,500 - 8,500 -Brian Larcombe 20,000 - 20,000 - 20,000 -Joseph Papa 5,000 - 5,000 - 5,000 -Richard De Schutter 250,000 - 250,000 - 250,000 -Rolf Stomberg 13,100 - 13,100 - 13,100 -
Total 702,034 920,748 931,103 1,114,601 934,103 973,764
(i) The latest practicable date for this Annual Report.(ii) In addition, David Illingworth holds 50,000 Deferred Shares. Following the redenomination of Ordinary Shares into US dollars on 23 January
2006, the Company issued 50,000 Deferred Shares. These shares are normally held by the Chief Executive and are not listed on any StockExchange and have extremely limited rights attached to them.
The total holdings of the directors represent less than 1% of the Ordinary Share Capital of the Company.
The register of directors’ interests, which is open to inspection at the Company’s registered office, contains full details of directors’shareholdings and share options.
70 2010 Annual Report

Des
crip
tion
ofth
eG
roup
Busi
ness
Revi
ew,
Liqui
dity
and
Pros
pect
sCo
rpor
ate
Gov
erna
nce
Stat
emen
tD
irect
ors’
Rem
uner
atio
nRe
port
Gro
upA
ccou
nts
Com
pany
Acc
ount
sIn
vest
orIn
form
atio
n
Total Shareholder ReturnSchedule 8 to the Regulations requires a graph to be published showing the Company’s TSR against the TSR performance of a broad equitymarket index. As a component of the FTSE100 index, a graph of the Company’s TSR performance compared to that of the TSR of theFTSE100 index is shown below.
Smith & Nephew - Five year Total Shareholder Return (measured in UK sterling)
-40%
-20%
0%
20%
40%
60%
80%
31-Dec-05 31-Dec-06 31-Dec-07 31-Dec-08 31-Dec-09 31-Dec-10
Smith & Nephew FTSE 100
The Remuneration Committee, however, compares the company’s performance to a tailored sector peer group of medical devicescompanies (see page 63), when considering TSR performance in the context of the 2004 Performance Share Plan.
The following graph therefore also shows the TSR performance of this peer group over a comparable period.
Smith & Nephew - Five year Total Shareholder Return (measured in US dollars)
-60%
-40%
-20%
0%
20%
40%
60%
80%
31-Dec-05 31-Dec-06 31-Dec-07 31-Dec-08 31-Dec-09 31-Dec-10
Smith & Nephew Medical Devices (Median)
By order of the Board, 24 February 2011
Susan HendersonCompany Secretary
2010 Annual Report 71

THIS PAGE INTENTIONALLY LEFT BLANK
72 2010 Annual Report

Des
crip
tion
ofth
eG
roup
Busi
ness
Revi
ew,
Liqui
dity
and
Pros
pect
sCo
rpor
ate
Gov
erna
nce
Stat
emen
tD
irect
ors’
Rem
uner
atio
nRe
port
Gro
upA
ccou
nts
Com
pany
Acc
ount
sIn
vest
orIn
form
atio
n
GROUP ACCOUNTSDirectors’ Responsibilities for the Accounts 74Directors’ Responsibility Statement Pursuant to Disclosure and Transparency Rule 4 75Independent Auditor’s UK Report 76Independent Auditor’s US Reports 78Group Income Statement 80Group Statement of Comprehensive Income 80Group Balance Sheet 81Group Cash Flow Statement 82Group Statement of Changes in Equity 83Notes to the Group Accounts 84Company Auditor’s Report 129Company Balance Sheet 131Notes to the Company Accounts 132
2010 Annual Report 73

DIRECTORS’ RESPONSIBILITIES FOR THE ACCOUNTSThe directors are responsible for preparing the Group and Company accounts in accordance with applicable United Kingdom law andregulations. As a consequence of the Company’s Ordinary Shares being traded on the New York Stock Exchange (in the form of AmericanDepositary Shares) the directors are responsible for the preparation and filing of an annual report on Form 20-F with the US Securities andExchange Commission.
The directors are required to prepare Group accounts for each financial year, in accordance with the International Financial ReportingStandards (“IFRS”) as adopted by the European Union which present fairly the financial position of the Group and the financial performanceand cash flows of the Group for that period. In preparing those Group accounts, the directors are required to:
• Select suitable accounting policies in accordance with IAS 8: Accounting Policies, Changes in Accounting Estimates and Errors and thenapply them consistently;
• Present information, including accounting policies, in a manner that provides relevant, reliable, comparable and understandableinformation;
• Provide additional disclosures when compliance with the specific requirements in IFRS is insufficient to enable users to understand theimpact of particular transactions, other events and conditions on the Group’s financial position and financial performance; and
• State that the Group has complied with IFRS, subject to any material departures disclosed and explained in the accounts.
Under United Kingdom law the directors have elected to prepare the Company accounts in accordance with United Kingdom GenerallyAccepted Accounting Practice (United Kingdom Accounting Standards and applicable law), which are required by law to give a true and fairview of the state of affairs of the Company and of the profit or loss of the Company for that period. In preparing the Company accounts, thedirectors are required to:
• Select suitable accounting policies and then apply them consistently;
• Make judgements and estimates that are reasonable and prudent;
• State whether applicable UK Accounting Standards have been followed, subject to any material departures disclosed and explained in theaccounts; and
• Prepare the accounts on a going concern basis unless it is inappropriate to presume that the company will continue in business.
The directors confirm that they have complied with the above requirements in preparing the accounts.
The directors are responsible for keeping proper accounting records that disclose with reasonable accuracy at any time the financial positionof the Group and the Company and enable them to ensure that the accounts comply with the Companies Act 2006 and, in the case of theGroup accounts, Article 4 of the IAS Regulation. They are also responsible for safeguarding the assets of the Group and the Company andhence for taking reasonable steps for the prevention and detection of fraud and other irregularities.
The directors are responsible for the maintenance and integrity of the corporate and financial information included on the Group’s website. Itshould be noted that information published on the internet is accessible in many countries with different legal requirements. Legislation inthe UK governing the preparation and dissemination of accounts may differ from legislation in other jurisdictions.
74 2010 Annual Report

Des
crip
tion
ofth
eG
roup
Busi
ness
Revi
ew,
Liqui
dity
and
Pros
pect
sCo
rpor
ate
Gov
erna
nce
Stat
emen
tD
irect
ors’
Rem
uner
atio
nRe
port
Gro
upA
ccou
nts
Com
pany
Acc
ount
sIn
vest
orIn
form
atio
n
DIRECTORS’ RESPONSIBILITY STATEMENT PURSUANT TODISCLOSURE AND TRANSPARENCY RULE 4
The directors confirm that, to the best of each person’s knowledge:
• the Group accounts in this report, which have been prepared in accordance with IFRS as adopted by the European Union and those partsof the Companies Act 2006 applicable to companies reporting under IFRS, give a true and fair view of the assets, liabilities, financialposition and profit of the Group taken as a whole;
• the Company accounts in this report, which have been prepared in accordance with United Kingdom Generally Accepted AccountingPractice and the Companies Act 2006, give a true and fair view of the assets, liabilities, financial position and profit of the Company; and
• the “Business Review, Liquidity and Prospects” contained in the accounts includes a fair review of the development and performance ofthe business and the financial position of the Company and the Group taken as a whole, together with a description of the principal risksand uncertainties that they face.
By order of the Board, 24 February 2011
Susan HendersonCompany Secretary
2010 Annual Report 75

INDEPENDENT AUDITOR’S UK REPORTIndependent Auditor’s Report to the Members of Smith & Nephew plc
We have audited the group accounts of Smith & Nephew plc for the year ended 31 December 2010 which comprise the Group IncomeStatement, the Group Statement of Comprehensive Income, the Group Balance Sheet, the Group Cash Flow Statement, the Group Statementof Changes in Equity and the related notes 1 to 36. The financial reporting framework that has been applied in their preparation is applicablelaw and International Financial Reporting Standards (IFRSs) as adopted by the European Union.
This report is made solely to the company’s members, as a body, in accordance with Chapter 3 of Part 16 of the Companies Act 2006. Ouraudit work has been undertaken so that we might state to the company’s members those matters we are required to state to them in anauditor’s report and for no other purpose. To the fullest extent permitted by law, we do not accept or assume responsibility to anyone otherthan the company and the company’s members as a body, for our audit work, for this report, or for the opinions we have formed.
Respective responsibilities of directors and auditor
As explained more fully in the Directors’ Responsibility Statement set out on page 75 the directors are responsible for the preparation of thegroup accounts and for being satisfied that they give a true and fair view. Our responsibility is to audit the group accounts in accordancewith applicable law and International Standards on Auditing (UK and Ireland). Those standards require us to comply with the AuditingPractices Board’s (APB’s) Ethical Standards for Auditors.
Scope of the audit of the accounts
An audit involves obtaining evidence about the amounts and disclosures in the accounts sufficient to give reasonable assurance that theaccounts are free from material misstatement, whether caused by fraud or error. This includes an assessment of: whether the accountingpolicies are appropriate to the group’s circumstances and have been consistently applied and adequately disclosed; the reasonableness ofsignificant accounting estimates made by the directors; and the overall presentation of the accounts.
Opinion on accounts
In our opinion the group accounts:
• give a true and fair view of the state of the group’s affairs as at 31 December 2010 and of its profit for the year then ended;
• have been properly prepared in accordance with IFRSs as adopted by the European Union; and
• have been prepared in accordance with the requirements of the Companies Act 2006 and Article 4 of the IAS Regulation.
Opinion on other matter prescribed by the Companies Act 2006
In our opinion the information given in the Directors’ Report for the financial year for which the group accounts are prepared is consistentwith the group accounts.
Matters on which we are required to report by exception
We have nothing to report in respect of the following:
Under the Companies Act 2006 we are required to report to you if, in our opinion:
• certain disclosures of directors’ remuneration specified by law are not made; or
• we have not received all the information and explanations we require for our audit.
Under the Listing Rules we are required to review:
• the directors’ statement, set out on page 40, in relation to going concern; and
• the part of the Corporate Governance Statement relating to the company’s compliance with the nine provisions of the June 2008Combined Code specified for our review.
76 2010 Annual Report

Des
crip
tion
ofth
eG
roup
Busi
ness
Revi
ew,
Liqui
dity
and
Pros
pect
sCo
rpor
ate
Gov
erna
nce
Stat
emen
tD
irect
ors’
Rem
uner
atio
nRe
port
Gro
upA
ccou
nts
Com
pany
Acc
ount
sIn
vest
orIn
form
atio
n
Other matter
We have reported separately on the Company accounts of Smith & Nephew plc for the year ended 31 December 2010 and on theinformation in the Directors’ Remuneration Report that is described as having been audited.
Separate Opinion in Relation to IFRSs
As explained in Note 1 to the Group accounts, the Group in addition to complying with its legal obligation to comply with IFRS as adopted bythe European Union, has also compiled with IFRS as issued by the International Accounting Standards Board.
In our opinion the group accounts give a true and fair view, in accordance with IFRS, of the state of the Group’s affairs as at 31 December2010 and of its profit for the year then ended.
Les Clifford (Senior statutory auditor)for and on behalf of Ernst & Young LLP, Statutory AuditorLondon24 February 2011
2010 Annual Report 77

INDEPENDENT AUDITOR’S US REPORTSReport of Independent Registered Public Accounting Firm to the Board of Directors and Shareholders ofSmith & Nephew plc
We have audited the accompanying Group balance sheets of Smith & Nephew plc as of 31 December 2010 and 2009, and the relatedGroup income statements, Group statements of comprehensive income, Group cash flow statements and Group statements of changes inequity for each of the three years in the period ended 31 December 2010. These accounts are the responsibility of the Company’smanagement. Our responsibility is to express an opinion on these accounts based on our audits.
We conducted our audits in accordance with the standards of the Public Company Accounting Oversight Board (United States). Thosestandards require that we plan and perform the audit to obtain reasonable assurance about whether the accounts are free of materialmisstatement. An audit includes examining, on a test basis, evidence supporting the amounts and disclosures in the accounts, assessingthe accounting principles used and significant estimates made by management, as well as evaluating the overall account presentation. Webelieve that our audits provide a reasonable basis for our opinion.
In our opinion, the accounts referred to above present fairly, in all material respects, the consolidated financial position of Smith & Nephewplc at 31 December 2010 and 2009, and the consolidated results of its operations and cash flows for each of the three years in the periodended 31 December 2010, in accordance with International Financial Reporting Standards as issued by the International AccountingStandards Board and International Financial Reporting Standards as adopted by the European Union.
We also have audited, in accordance with the standards of the Public Company Accounting Oversight Board (United States), Smith &Nephew plc’s internal control over financial reporting as of 31 December 2010, based on criteria established in Internal Control – IntegratedFramework issued by the Committee of Sponsoring Organisations of the Treadway Commission and our report dated 24 February 2011expressed an unqualified opinion thereon.
Ernst & Young LLP
London, England
24 February 2011
78 2010 Annual Report

Des
crip
tion
ofth
eG
roup
Busi
ness
Revi
ew,
Liqui
dity
and
Pros
pect
sCo
rpor
ate
Gov
erna
nce
Stat
emen
tD
irect
ors’
Rem
uner
atio
nRe
port
Gro
upA
ccou
nts
Com
pany
Acc
ount
sIn
vest
orIn
form
atio
n
Report of Independent Registered Public Accounting Firm to the Board of Directors and Shareholders ofSmith & Nephew plc
We have audited Smith & Nephew plc’s internal control over financial reporting as of 31 December 2010, based on criteria established inInternal Control – Integrated Framework issued by the Committee of Sponsoring Organisations of the Treadway Commission (the COSOcriteria). Smith & Nephew plc’s management is responsible for maintaining effective internal control over financial reporting, and for itsassessment of the effectiveness of internal control over financial reporting included in the accompanying “Management’s Report on InternalControl over Financial Reporting”. Our responsibility is to express an opinion on the Company’s internal control over financial reporting basedon our audit.
We conducted our audit in accordance with the standards of the Public Company Accounting Oversight Board (United States). Thosestandards require that we plan and perform the audit to obtain reasonable assurance about whether effective internal control over financialreporting was maintained in all material respects. Our audit included obtaining an understanding of internal control over financial reporting,assessing the risk that a material weakness exists, testing and evaluating the design and operating effectiveness of internal control basedon the assessed risk, and performing such other procedures as we considered necessary in the circumstances. We believe that our auditprovides a reasonable basis for our opinion.
A company’s internal control over financial reporting is a process designed to provide reasonable assurance regarding the reliability offinancial reporting and the preparation of financial statements for external purposes in accordance with generally accepted accountingprinciples. A company’s internal control over financial reporting includes those policies and procedures that (1) pertain to the maintenance ofrecords that, in reasonable detail, accurately and fairly reflect the transactions and dispositions of the assets of the company; (2) providereasonable assurance that transactions are recorded as necessary to permit preparation of financial statements in accordance withgenerally accepted accounting principles, and that receipts and expenditures of the company are being made only in accordance withauthorisations of management and directors of the company; and (3) provide reasonable assurance regarding prevention or timely detectionof unauthorised acquisition, use or disposition of the company’s assets that could have a material effect on the financial statements.
Because of its inherent limitations, internal control over financial reporting may not prevent or detect misstatements. Also, projections of anyevaluation of effectiveness to future periods are subject to the risk that controls may become inadequate because of changes in conditions,or that the degree of compliance with the policies or procedures may deteriorate.
In our opinion, Smith & Nephew plc maintained, in all material respects, effective internal control over financial reporting as of 31 December2010, based on the COSO criteria.
We also have audited, in accordance with the standards of the Public Company Accounting Oversight Board (United States), the Groupbalance sheets of Smith & Nephew plc as of 31 December 2010 and 2009, and the related Group income statements, Group statements ofcomprehensive income, Group cash flow statements and Group statements of changes in equity for each of the three years in the periodended 31 December 2010 and our report dated 24 February 2011 expressed an unqualified opinion thereon.
Ernst & Young LLP
London, England
24 February 2011
2010 Annual Report 79

GROUP INCOME STATEMENTYears ended 31 December
Notes 2010$ million
2009$ million
2008$ million
Revenue 3 3,962 3,772 3,801Cost of goods sold (1,031) (1,030) (1,077)
Gross profit 2,931 2,742 2,724Selling, general and administrative expenses 4 (1,860) (1,864) (1,942)Research and development expenses (151) (155) (152)
Operating profit 3 & 4 920 723 630Interest receivable 7 3 2 5Interest payable 7 (18) (42) (71)Other finance costs 8 (10) (15) (1)Share of results of associates 15 – 2 1
Profit before taxation 895 670 564Taxation 9 (280) (198) (187)
Attributable profit for the year (i) 615 472 377
Earnings per Ordinary Share (i) 11Basic 69.3¢ 53.4¢ 42.6¢Diluted 69.2¢ 53.3¢ 42.4¢
GROUP STATEMENT OF COMPREHENSIVE INCOMEYears ended 31 December
2010$ million
2009$ million
2008$ million
Attributable profit for the year (i) 615 472 377
Other comprehensive income:Cash flow hedges – interest rate swaps– losses arising in the year (1) (3) (13)– losses transferred to income statement for the year 4 13 2Cash flow hedges – forward foreign exchange contracts– (losses)/gains arising in the year (3) (15) 21– losses/(gains) transferred to inventories for the year 1 7 (6)Exchange differences on translation 66 63 (57)Exchange on borrowings classified as net investment hedges (14) (3) (42)Actuarial gains/(losses) on retirement benefit obligations 26 41 (215)Taxation on items relating to components of other comprehensive income (7) (12) 71
Other comprehensive income/(expense) for the year, net of taxation 72 91 (239)
Total comprehensive income for the year (i) 687 563 138
(i) Attributable to equity holders of the Company and wholly derived from continuing operations.
The Notes on pages 84 to 128 are an integral part of these accounts.
80 2010 Annual Report

Des
crip
tion
ofth
eG
roup
Busi
ness
Revi
ew,
Liqui
dity
and
Pros
pect
sCo
rpor
ate
Gov
erna
nce
Stat
emen
tD
irect
ors’
Rem
uner
atio
nRe
port
Gro
upA
ccou
nts
Com
pany
Acc
ount
sIn
vest
orIn
form
atio
n
GROUP BALANCE SHEETAt 31 December
Notes 2010$ million
2009$ million
ASSETSNon-current assets:Property, plant and equipment 12 787 753Goodwill 16 1,101 1,093Intangible assets 13 426 412Investments 14 6 7Investments in associates 15 13 13Deferred tax assets 23 224 202Trade and other receivables 18 22 -
2,579 2,480Current assets:Inventories 17 923 933Trade and other receivables 18 1,024 946Cash and bank 19 207 192
2,154 2,071
Assets held for sale 30 - 14
TOTAL ASSETS 4,733 4,565
EQUITY AND LIABILITIESEquity attributable to equity holders of the parent:Share capital 24 191 190Share premium 396 382Treasury shares 26 (778) (794)Other reserves 116 63Retained earnings 2,848 2,338
Total equity 2,773 2,179
Non-current liabilities:Long-term borrowings 19 642 1,090Retirement benefit obligations 33 262 322Other payables 21 - 27Provisions 22 73 53Deferred tax liabilities 23 69 31
1,046 1,523Current liabilities:Bank overdrafts and loans 19 57 45Trade and other payables 21 617 596Provisions 22 37 55Current tax payable 203 167
914 863
Total liabilities 1,960 2,386
TOTAL EQUITY AND LIABILITIES 4,733 4,565
The accounts were approved by the Board and authorised for issue on 24 February 2011 and are signed on its behalf by: John BuchananChairman David J. Illingworth Chief Executive Adrian Hennah Chief Financial Officer
The Notes on pages 84 to 128 are an integral part of these accounts.
2010 Annual Report 81

GROUP CASH FLOW STATEMENTYears ended 31 December
Notes 2010$ million
2009$ million
2008$ million
Net cash inflow from operating activitiesProfit before taxation 895 670 564Net interest payable 7 15 40 66Depreciation, amortisation and impairment 273 298 275Loss on disposal of property, plant and equipment and software 15 14 12Share based payments expense 21 18 24Utilisation of Plus inventory stepped-up on acquisition - - 15Share of results of associates - (2) (1)Decrease in retirement benefit obligations (31) (2) (14)Decrease/(Increase) in inventories 21 (17) (117)(Increase)/Decrease in trade and other receivables (100) 46 (54)Increase/(Decrease) in trade and other payables and provisions 2 (35) 45
Cash generated from operations (i) (ii) 1,111 1,030 815Interest received 3 2 5Interest paid (20) (43) (68)Income taxes paid (235) (270) (186)
Net cash inflow from operating activities 859 719 566
Cash flows from investing activitiesAcquisitions 29 - (25) (16)Cash received from Plus settlement 29 - 137 -Capital expenditure (315) (318) (292)Proceeds on disposal of property, plant and equipment and software 8 - 3
Net cash used in investing activities (307) (206) (305)
Cash flows from financing activitiesProceeds from issue of ordinary share capital 15 7 19Treasury shares purchased (5) - (193)Proceeds/(settlement) of borrowings due within one year 27 17 (66) (49)Proceeds on borrowings due after one year 27 277 526 1,108Settlement of borrowings due after one year 27 (714) (814) (1,028)Proceeds from own shares 8 10 4Settlement of currency swaps 27 (3) (12) 5Equity dividends paid 10 (132) (120) (109)
Net cash used in financing activities (537) (469) (243)
Net increase in cash and cash equivalents 15 44 18Cash and cash equivalents at beginning of year 27 174 122 109Exchange adjustments 27 6 8 (5)
Cash and cash equivalents at end of year 27 195 174 122
(i) Includes $16m (2009 – $32m, 2008 – $28m) of outgoings on restructuring and rationalisation expenses.
(ii) Includes $nil (2009 – $22m, 2008 – $48m) of acquisition related costs and $5m (2009 – $5m, 2008 – $10m) unreimbursed by insurers relatingto macrotextured knee revisions.
The Notes on pages 84 to 128 are an integral part of these accounts.
82 2010 Annual Report

Des
crip
tion
ofth
eG
roup
Busi
ness
Revi
ew,
Liqui
dity
and
Pros
pect
sCo
rpor
ate
Gov
erna
nce
Stat
emen
tD
irect
ors’
Rem
uner
atio
nRe
port
Gro
upA
ccou
nts
Com
pany
Acc
ount
sIn
vest
orIn
form
atio
n
GROUP STATEMENT OF CHANGES IN EQUITYShare
capital$ million
Sharepremium$ million
Treasuryshares (ii)$ million
Otherreserves (iii)
$ million
Retainedearnings$ million
Totalequity
$ million
At 1 January 2008 190 356 (637) 96 1,811 1,816Total comprehensive income (i) - - - (95) 233 138Equity dividends declared and paid - - - - (109) (109)Share based payments recognised - - - - 24 24Treasury shares purchased - - (193) - - (193)Cost of shares transferred to
beneficiaries - - 7 - (3) 4Issue of ordinary share capital (iv) - 19 - - - 19
At 1 January 2009 190 375 (823) 1 1,956 1,699Total comprehensive income (i) - - - 62 501 563Equity dividends declared and paid - - - - (120) (120)Share based payments recognised - - - - 18 18Deferred taxation on share based
payment - - - - 2 2Cost of shares transferred to
beneficiaries - - 29 - (19) 10Issue of ordinary share capital (iv) - 7 - - - 7
At 1 January 2010 190 382 (794) 63 2,338 2,179Total comprehensive income (i) - - - 53 634 687Equity dividends declared and paid - - - - (132) (132)Purchase of own shares - - (5) - - (5)Share based payments recognised - - - - 21 21Cost of shares transferred to
beneficiaries - - 21 - (13) 8Issue of ordinary share capital (iv) 1 14 - - - 15
At 31 December 2010 191 396 (778) 116 2,848 2,773
(i) Attributable to equity holders of the Company and wholly derived from continuing operations.
(ii) Refer to Note 26 of the Group Financial Statements for further information.
(iii) Other reserves comprise gains and losses on cash flow hedges, exchange differences on translation of foreign operations and the differencearising as a result of translating share capital and share premium at the rate on the date of redenomination instead of the rate at the balancesheet date. The cumulative translation adjustments within Other Reserves at 31 December 2010 were $123m (2009 – $71m, 2008 – $11m).
(iv) Issue of ordinary share capital as a result of options being exercised.
The Notes on pages 84 to 128 are an integral part of these accounts.
2010 Annual Report 83

NOTES TO THE GROUP ACCOUNTS
1. General Information
Smith & Nephew plc (the “Company”) is a public limited company incorporated in England and Wales. In these accounts, “Group”means the Company and all its subsidiaries. The principal activities of the Group are to develop, manufacture, market and sell medicaldevices in the sectors of Orthopaedics, Endoscopy and Advanced Wound Management.
Presentation of financial informationAs required by the European Union’s IAS Regulation and the Companies Act 2006, the Group has prepared its accounts in accordancewith International Financial Reporting Standards (“IFRS”) as adopted by the European Union (“EU”) effective as at 31 December 2010.The Group has also prepared its accounts in accordance with IFRS as issued by the International Accounting Standards Board (“IASB”)effective as at 31 December 2010. IFRS as adopted by the EU differs in certain respects from IFRS as issued by the IASB. However, thedifferences have no impact for the periods presented.
2(a). Accounting Policies
The Group has adopted IFRS 3 (Revised) Business Combinations and IAS 27 (Revised) Consolidated and Separate Financial Statements.These standards are being applied prospectively and have no impact on the current presentation or disclosure of information, andtherefore no comparative amounts require restatement. No other standard or interpretation coming into effect during the year had asignificant effect on the reported results or the financial position of the Group.
The significant accounting policies adopted in the preparation of the Group’s accounts are set out below:
Basis of PreparationThe preparation of accounts in conformity with IFRS requires management to use estimates and assumptions that affect the reportedamounts of assets and liabilities and disclosure of contingent assets and liabilities at the date of the accounts and the reportedamounts of revenues and expenses during the reporting period. The accounting policies requiring management to use significantestimates and assumptions; Inventories, Impairment, Retirement Benefits and Contingencies and Provisions, are discussed underCritical Accounting Policies within the “Business Review, Liquidity and Prospects” section on pages 28 to 29. Although these estimatesare based on management’s best knowledge of current events and actions, actual results ultimately may differ from those estimates.
The directors continue to adopt the going concern basis for accounting in preparing the annual financial statements. The directors havea reasonable expectation that the Group has adequate resources to continue in operational existence for the foreseeable future.
ConsolidationThe Group accounts include the accounts of Smith & Nephew plc (the “Company”) and its subsidiaries for the periods during whichthey were members of the Group.
A subsidiary is an entity controlled by the Group. Control comprises the power to govern the financial and operating policies of theinvestee so as to obtain benefit from its activities and is achieved through direct or indirect ownership of voting rights. Subsidiaries areconsolidated in the Group accounts from the date that the Group obtains control, and continue to be consolidated until the date thatsuch control ceases. Intercompany transactions, balances and unrealised gains and losses on transactions between group companiesare eliminated on consolidation. All subsidiaries have year ends which are co-terminous with the Group’s.
Business Combinations and GoodwillOn acquisition, identifiable assets and liabilities (including contingent liabilities) of subsidiaries and associates are measured at theirfair values at the date of acquisition using the acquisition method. The fair value of assets includes the taxation benefits resulting fromamortisation for income taxation purposes from which a third party separately acquiring the assets would reasonably be expected tobenefit. Goodwill, representing the excess of purchase consideration over the Group’s share of the fair value of net assets acquired, iscapitalised. Goodwill is not amortised but is reviewed for impairment annually. For purposes of impairment testing, goodwill is allocatedto the related cash-generating units monitored by management, being the operating segment level, Orthopaedics, Endoscopy andAdvanced Wound Management.
84 2010 Annual Report

Des
crip
tion
ofth
eG
roup
Busi
ness
Revi
ew,
Liqui
dity
and
Pros
pect
sCo
rpor
ate
Gov
erna
nce
Stat
emen
tD
irect
ors’
Rem
uner
atio
nRe
port
Gro
upA
ccou
nts
Com
pany
Acc
ount
sIn
vest
orIn
form
atio
n
2(a). Accounting Policies – (continued)
Investments in AssociatesInvestments in associates, being those entities over which the Group has a significant influence and which is neither a subsidiary or ajoint venture, are accounted for using the equity method, with the Group recording its share of the associate’s net income and equity.The Group’s share in the results of its associates is included in one separate income statement line and is calculated after deduction oftheir respective taxes.
RevenueRevenue comprises sales of products and services to third parties at amounts invoiced net of trade discounts and rebates, excludingtaxes on revenue. Revenue from the sale of products is recognised upon transfer to the customer of the significant risks and rewards ofownership. This is generally when goods are delivered to customers. Sales of inventory located at customer premises and available forcustomers’ immediate use are recognised when notification is received that the product has been implanted or used. Appropriateprovisions for returns, trade discounts and rebates are deducted from revenue. Rebates comprise retrospective volume discountsgranted to certain customers on attainment of certain levels of purchases from the Group. These are accrued over the course of thearrangement based on estimates of the level of business expected and adjusted at the end of the arrangement to reflect actualvolumes.
Foreign CurrenciesBalance sheet items of foreign operations and foreign currency borrowings are translated into US Dollars on consolidation at year endrates of exchange. Income statement items and the cash flows of overseas subsidiary undertakings and associated undertakings aretranslated at average rates as an approximation to actual transaction rates, with actual transaction rates used for large one offtransactions.
Goodwill and fair value adjustments arising on the acquisition of a foreign entity are treated as assets and liabilities of the foreign entityand translated at the closing rate.
Transactions in foreign currencies are recorded at the exchange rate ruling at the date of the transaction. Monetary assets andliabilities denominated in foreign currencies are retranslated at the rate of exchange ruling at the balance sheet date.
The following are recorded as movements in ‘Other reserves’ within other comprehensive income: exchange differences on thetranslation at closing rates of exchange of non-US Dollar opening net assets; the differences arising between the translation of profitsinto US Dollars at average and closing exchange rates; to the extent that the hedging relationship is effective, the difference ontranslation of foreign currency borrowings or swaps that are used to finance or hedge the Group’s net investments in foreignoperations; and the movement in the fair value of forward foreign exchange contracts used to hedge forecast foreign exchange cashflows. All other exchange differences are taken to the income statement.
TaxationThe charge for current taxation is based on the results for the year as adjusted for items which are non-assessable or disallowed. It iscalculated using rates that have been enacted or substantively enacted by the balance sheet date.
Deferred taxation is accounted for using the balance sheet liability method in respect of temporary differences arising between thecarrying amount of assets and liabilities in the accounts and the corresponding tax bases used in computation of taxable profit.
Deferred tax liabilities are recognised for all taxable temporary differences except in respect of investments in subsidiaries where theGroup is able to control the timing of the reversal of the temporary difference and it is probable that this will not reverse in theforeseeable future; on the initial recognition of non-deductible goodwill; and on the initial recognition of an asset or liability in atransaction that is not a business combination and that, at the time of the transaction, does not affect the accounting or taxable profit.
Deferred tax assets are recognised to the extent that it is probable that future taxable profit will be available against which thetemporary difference can be utilised. Their carrying amount is reviewed at each balance sheet date on the same basis.
Deferred tax is measured on an undiscounted basis, and at the tax rates that have been enacted or substantively enacted by thebalance sheet date that are expected to apply in the periods in which the asset or liability is settled. It is recognised in the incomestatement except when it relates to items credited or charged directly to other comprehensive income or equity, in which case thedeferred tax is also dealt with in other comprehensive income or equity respectively.
Deferred tax assets and liabilities are offset when they relate to income taxes levied by the same taxation authority, when the Groupintends to settle its current tax assets and liabilities on a net basis and that authority permits the Group to make a single net payment.
2010 Annual Report 85

2(a). Accounting Policies – (continued)
Advertising CostsExpenditure on advertising costs is expensed as incurred.
Intangible AssetsIntangible assets acquired separately (including purchased patents, know-how, trademarks, licences and distribution rights) are initiallymeasured at cost. The cost of intangible assets acquired in a material business combination (referred to as acquisition intangibles) isthe fair value as at the date of acquisition. Following initial recognition, intangible assets are carried at cost less any accumulatedamortisation and any accumulated impairment losses. All intangible assets are amortised on a straight line basis over their estimateduseful economic lives. The estimated useful economic life of an intangible asset ranges between three and 20 years depending on itsnature. Internally generated intangible assets are expensed in the income statement as incurred.
Purchased computer software and certain costs of information technology projects are capitalised as intangible assets. Software that isintegral to computer hardware is capitalised as plant and equipment.
Research and DevelopmentThe Group considers that the regulatory, technical and market uncertainties inherent in the development of new products means thatdevelopment costs should not be capitalised as intangible assets until products receive approval from the appropriate regulatory body.Substantially all development expenditure is complete by the time the product is submitted for regulatory approval. Consequently themajority of expenditure on research and development is expensed as incurred.
Property, Plant and EquipmentProperty, plant and equipment are stated at cost less depreciation and provision for impairment where appropriate. Freehold land is notdepreciated. Freehold buildings are depreciated on a straight-line basis at between 2% and 5% per annum. Leasehold land andbuildings are depreciated on a straight-line basis over the shorter of their estimated useful economic lives and the terms of the leases.
Plant and equipment is depreciated over lives ranging between three and 20 years by equal annual instalments to write down theassets to their estimated residual value at the end of their working lives. Assets in course of construction are not depreciated until theyare brought into use.
The useful lives and residual values of all property, plant and equipment are reviewed each financial year end, and where adjustmentsare required, these are made prospectively.
Finance costs relating to the purchase or construction of property, plant and equipment and intangible assets that take longer than oneyear to complete are capitalised based on the Group weighted average borrowing costs. All other finance costs are expensed asincurred.
Impairment of assetsThe recoverable amount of cash-generating units to which goodwill has been allocated is tested for impairment annually or whenevents or changes in circumstances indicate that it might be impaired.
The carrying values of property, plant and equipment, and intangible assets are reviewed for impairment when events or changes incircumstances indicate the carrying value may be impaired. If any such indication exists, the recoverable amount of the asset isestimated in order to determine the extent of impairment loss. Where it is not possible to estimate the recoverable amount of anindividual asset, the Group estimates the recoverable amount of the cash-generating unit to which it belongs.
An asset’s recoverable amount is the higher of an asset’s or cash-generating unit’s fair value less costs to sell and its value-in-use. Inassessing value-in-use, its estimated future cash flow is discounted to its present value using a pre-tax discount rate that reflects thecurrent market assessments of the time value of money and the risks specific to the asset.
In carrying out impairment reviews of goodwill and intangible assets a number of significant assumptions have to be made whenpreparing cash flow projections. These include annual sales growth, trading margins, capital utilisation and anticipated volume andvalue growth in the markets served by the Group. If actual results should differ, or changes in expectations arise, impairment chargesmay be required which would adversely impact operating results.
86 2010 Annual Report

Des
crip
tion
ofth
eG
roup
Busi
ness
Revi
ew,
Liqui
dity
and
Pros
pect
sCo
rpor
ate
Gov
erna
nce
Stat
emen
tD
irect
ors’
Rem
uner
atio
nRe
port
Gro
upA
ccou
nts
Com
pany
Acc
ount
sIn
vest
orIn
form
atio
n
2(a). Accounting Policies – (continued)
LeasesLeases are classified as finance leases when the terms of the lease transfer substantially all the risks and rewards of ownership to theGroup. All other leases are classified as operating leases.
Assets held under finance leases are capitalised as property, plant or equipment and depreciated accordingly. The capital element offuture lease payments is included in borrowings and interest is charged to profit before taxation on a reducing balance basis over theterm of the lease.
Rentals payable under operating leases are expensed in the income statement on a straight line basis over the term of the relevantlease.
Investments and Other Financial AssetsInvestments, other than those related to associates, are initially recorded at fair value plus transaction costs on the trade date. TheGroup holds an investment in an entity that holds mainly unquoted equity securities, which is classed as “available-for-sale” andcarried at fair value. The fair value of the investment is based on the underlying fair value of the equity securities: marketable securitiesare valued by reference to closing prices in the market; non-marketable securities are estimated considering factors including thepurchase price, prices of recent significant private placements of securities of the same issuer and estimates of liquidation value.Changes in fair value are recognised in other comprehensive income except where management considers that there is objectiveevidence of an impairment of the underlying equity securities, whereupon an impairment is recognised as an expense immediately.
Loans and receivables are carried at amortised cost, less any allowances for uncollectible amounts. They are included in currentassets, except for maturities greater than 12 months after the balance sheet date. These are classified as non-current assets. Loansand other receivables are classified as ‘Trade and other receivables’ in the balance sheet.
InventoriesFinished goods and work-in-progress are valued at factory cost, including appropriate overheads, on a first-in first-out basis. Rawmaterials and bought-in finished goods are valued at purchase price. All inventories are reduced to net realisable value where lowerthan cost. Inventory acquired as part of a business acquisition is valued at selling price less costs of disposal and a profit allowance forselling efforts.
Orthopaedic instruments are generally not sold but provided to customers and distributors for use in surgery. They are recorded asinventory until they are deployed at which point they are transferred to plant and equipment and depreciated over their usefuleconomic lives of between three and five years.
A feature of the orthopaedic business is the high level of product inventory required, some of which is located at customer premisesand is available for customers’ immediate use (referred to as consignment inventory). Complete sets of product, including large andsmall sizes, have to be made available in this way. These outer sizes are used less frequently than standard sizes and towards the endof the product life cycle are inevitably in excess of requirements. Adjustments to carrying value are therefore required to be made toorthopaedic inventory to anticipate this situation. These adjustments are calculated in accordance with a formula based on levels ofinventory compared with historical or forecast usage. This formula is applied on an individual product line basis and is first appliedwhen a product group has been on the market for two years. This method of calculation is considered appropriate based onexperience but it involves management judgements on effectiveness of inventory deployment, length of product lives, phase-out of oldproducts and efficiency of manufacturing planning systems.
Derivative Financial InstrumentsDerivative financial instruments are initially recognised at fair value on the date a derivative contract is entered into and aresubsequently remeasured at their fair value at subsequent balance sheet dates. The fair value of forward currency contracts iscalculated by reference to current forward exchange rates for contracts with similar maturity profiles. The fair value of interest rate swapcontracts is determined by reference to market values for similar instruments.
Changes in the fair value of derivative financial instruments that are designated and effective as cash flow hedges of forecast thirdparty and intercompany transactions are recognised in other comprehensive income until the associated asset or liability is recognised.Amounts taken to other comprehensive income are transferred to the income statement when the hedged transaction affects profit andloss. Where the hedged item is the cost of a non-financial asset, the amounts taken to other comprehensive income are transferred tothe initial carrying value of the asset.
2010 Annual Report 87

2(a). Accounting Policies – (continued)
Derivative Financial Instruments – (continued)Currency swaps to match foreign currency net assets with foreign currency liabilities are fair valued at year end. Changes in the fairvalues of currency swaps that are designated and effective as net investment hedges are matched in other comprehensive incomeagainst changes in value of the related net assets.
Interest rate swaps transacted to fix interest rates on floating rate borrowings are accounted for as cash flow hedges and changes inthe fair values resulting from changes in market interest rates are recognised in other comprehensive income.
Any ineffectiveness on hedging instruments and changes in the fair value of derivative financial instruments that do not qualify forhedge accounting are recognised in the income statement within other finance income/(costs) as they arise.
Hedge accounting is discontinued when the hedging instrument expires or is sold, terminated or exercised, or no longer qualifies forhedge accounting. At that point in time, any cumulative gain or loss on the hedging instrument recognised in other comprehensiveincome is retained there until the forecast transaction occurs. If a hedged transaction is no longer expected to occur, the net cumulativegain or loss recognised in other comprehensive income is transferred to the income statement for the period.
Recognition of Financial Assets and LiabilitiesFinancial assets and liabilities are recognised on a trade date basis in the Group’s balance sheet when the Group becomes party to thecontractual provisions of the instrument. The Group carries borrowings in the Balance Sheet at amortised cost.
Retirement BenefitsThe Group’s major pension plans are of the defined benefit type. For these plans, the employer’s portion of past and current servicecost is charged to operating profit, with the interest cost net of expected return on assets in the plans reported within other financeincome/(costs). Actuarial gains or losses are recognised in full directly in other comprehensive income such that the balance sheetreflects the plan’s surpluses or deficits as at the balance sheet date.
The defined benefit obligation is calculated annually by external actuaries using the projected unit credit method. The present value ofthe defined benefit obligation is determined by discounting the estimated future cash flows using interest rates of high-qualitycorporate bonds that are denominated in the currency in which the benefits will be paid, and that have terms to maturity approximatingto the terms of the related pension liability.
A number of key assumptions have to be made in calculating the fair value of the Group’s defined benefit pension plans. Theseassumptions impact the balance sheet assets and liabilities, operating profit and finance income/(costs). The most critical assumptionsare the discount rate, inflation and mortality assumptions to be applied to future pension plan liabilities. The most critical assumption forthe plan assets is the future expected return. In determining these assumptions management takes into account the advice ofprofessional external actuaries and benchmarks its assumptions against external data.
Where defined contribution plans operate, the contributions to these plans are charged to operating profit as they become payable.
Share Based PaymentsThe Group operates a number of equity-settled executive and employee share plans. For all grants of share options and awards, thefair value at the grant date is calculated using appropriate option pricing models and the corresponding expense is recognised over thevesting period.
Contingencies and ProvisionsIn the normal course of business the Group is involved in numerous legal disputes. Provision is made for loss contingencies when it isdeemed probable that an adverse outcome will occur and the amount of the loss can be reasonably estimated. Where the Group is theplaintiff in pursuing claims against third parties legal and associated expenses are charged to the income statement as incurred.Contingent assets are not recognised in the accounts.
The recognition of provisions for legal disputes is subject to a significant degree of estimation. In making its estimates managementtakes into account the advice of internal and external legal counsel. Provisions are reviewed regularly and amounts updated wherenecessary to reflect developments in the disputes. The ultimate liability may differ from the amount provided depending on the outcomeof court proceedings and settlement negotiations or as new facts emerge.
88 2010 Annual Report

Des
crip
tion
ofth
eG
roup
Busi
ness
Revi
ew,
Liqui
dity
and
Pros
pect
sCo
rpor
ate
Gov
erna
nce
Stat
emen
tD
irect
ors’
Rem
uner
atio
nRe
port
Gro
upA
ccou
nts
Com
pany
Acc
ount
sIn
vest
orIn
form
atio
n
2(a). Accounting Policies – (continued)
Contingencies and Provisions – (continued)
The Group operates in multiple tax jurisdictions around the world and records provisions for taxation liabilities and tax audits when it isconsidered probable that a tax charge will arise and the amount can be reasonably estimated. Although Group policy is to submit itstax returns to the relevant tax authorities as promptly as possible, at any time the Group has unagreed years outstanding and isinvolved in disputes and tax audits. Significant issues may take many years to resolve. In estimating the probability and amount of anytax charge management takes into account the views of internal and external advisors and updates the amount of the provisionwhenever necessary. The ultimate tax liability may differ from the amount provided depending on interpretations of tax law, settlementnegotiations or changes in legislation.
A provision for onerous contracts is recognised when the expected benefits to be derived by the Group from a contract are lower thanthe unavoidable cost of meeting its obligations under the contract. For the purposes of calculating any onerous lease provision, theGroup has taken the discounted future lease payments, net of expected rental income. Before a provision is established, the Grouprecognises any impairment loss on the assets associated with that contract.
Adjusted Earnings Per ShareAdjusted earnings per share is a trend measure which presents the long-term profitability of the Group excluding the impact of specifictransactions that management considers affect the Group’s short-term profitability. Adjusted attributable profit is the numerator usedfor this measure, reconciliation from attributable profit to adjusted attributable profit is included in Note 11 of the Notes to the GroupAccounts. The Group has identified the following items, where material, as those to be excluded when arriving at adjusted attributableprofit: acquisition and disposal related items including amortisation of acquisition intangible assets and impairments; significantrestructuring events; gains and losses arising from legal disputes and uninsured losses; and taxation thereon.
2(b).New Accounting Standards
New IFRS Accounting StandardsThe following IFRS standard, which is relevant to the Group, has been issued by the International Accounting Standards Board (“IASB”)but is not yet effective or has not yet been adopted by the Group. Unless otherwise listed below, no other standard, amendment orinterpretation is likely to have a material effect on the Group’s results of operations or financial position.
In November 2009, the IASB issued IFRS 9 Financial Instruments. This standard specifies how the Group should classify and measurefinancial assets. It requires all financial assets to be either classified on the basis of the entity’s business model and the contractualcash flow characteristics of the financial asset or initially measured at fair value. This standard has not been endorsed by the EU.
3(a). Operating Segment Information
For management purposes, the Group is organised into business units according to the nature of its products and has three operatingsegments – Orthopaedics, Endoscopy and Advanced Wound Management. The types of products and services offered by eachoperating unit are:
Š Orthopaedic reconstruction implants include hip, knee and shoulder joints as well as ancillary products such as bone cement andmixing systems used in cemented reconstruction joint surgery. Orthopaedic trauma fixation products consist of internal andexternal devices and other products, including shoulder fixation and orthobiological materials used in the stabilisation of severefractures and deformity correction procedures. Clinical therapies products are those that are applied in an orthopaedic office orclinic setting and include bone growth stimulation, joint fluid therapies and outpatient spine products.
Š Smith & Nephew’s Endoscopy business develops and commercialises endoscopic (minimally invasive surgery) techniques,educational programmes and value-added services for surgeons to treat and repair soft tissue and articulating joints. Thebusiness focuses on the arthroscopy sector of the endoscopy market. Arthroscopy is the minimally invasive surgery of joints, inparticular the knee, shoulder and hip.
Š Smith & Nephew’s Advanced Wound Management business offers a range of products from initial wound bed preparationthrough to full wound closure. These products are targeted at chronic wounds associated with the older population, such aspressure sores and venous leg ulcers. There are also products for the treatment of wounds such as burns and invasive surgerythat impact the wider population.
2010 Annual Report 89

3(a). Operating Segment Information – (continued)
Management monitors the operating results of its business units separately for the purposes of making decisions about resourceallocation and performance assessment. Group financing (including interest receivable and payable) and income taxes are managedon a group basis and are not allocated to operating segments.
The following tables present revenue, profit, asset and liability information regarding the Group’s operating segments. The share ofresults of associates is segmentally allocated to Orthopaedics.
2010$ million
2009$ million
2008$ million
Revenue by operating segmentOrthopaedics 2,195 2,135 2,158Endoscopy 855 791 800Advanced Wound Management 912 846 843
3,962 3,772 3,801
There are no material sales between operating segments.
Trading profit is a trend measure which presents the long-term profitability of the Group excluding the impact of specific transactionsthat management considers affect the Group’s short-term profitability. The Group presents this measure to assist investors in theirunderstanding of trends. The Group has identified the following items, where material, as those to be excluded from operating profitwhen arriving at trading profit: acquisition and disposal related items including amortisation of acquisition intangibles and impairments;significant restructuring events; gains and losses arising from legal disputes; and uninsured losses. Operating profit reconciles totrading profit as follows:
Notes2010
$ million2009
$ million2008
$ million
Operating profit 920 723 630Acquisition related costs 5 - 26 61Restructuring and rationalisation expenses 6 15 42 34Amortisation of acquisition intangibles and impairments 13 & 16 34 66 51
Trading profit 969 857 776
Trading profit by operating segmentOrthopaedics 536 508 481Endoscopy 200 189 166Advanced Wound Management 233 160 129
969 857 776
Operating profit by operating segment reconciled to attributableprofit for the year
Orthopaedics 503 410 382Endoscopy 197 169 146Advanced Wound Management 220 144 102
Operating profit 920 723 630Net interest payable (15) (40) (66)Other finance costs (10) (15) (1)Share of results of associates - 2 1Taxation (280) (198) (187)
Attributable profit for the year 615 472 377
90 2010 Annual Report

Des
crip
tion
ofth
eG
roup
Busi
ness
Revi
ew,
Liqui
dity
and
Pros
pect
sCo
rpor
ate
Gov
erna
nce
Stat
emen
tD
irect
ors’
Rem
uner
atio
nRe
port
Gro
upA
ccou
nts
Com
pany
Acc
ount
sIn
vest
orIn
form
atio
n
3(a). Operating Segment Information – (continued)
2010$ million
2009$ million
2008$ million
Capital expenditureOrthopaedics 227 235 219Endoscopy 58 41 29Advanced Wound Management 30 63 45
315 339 293
Capital expenditure segmentally allocated above comprises:Additions to property, plant and equipment 250 216 259Additions to intangible assets 65 102 33
Capital expenditure as per cash flow statement 315 318 292Acquisitions – Goodwill - 3 -Acquisitions – Intangible assets - 12 1Acquisitions – Property, plant and equipment - 6 -
Capital expenditure 315 339 293
Depreciation, amortisation and impairmentOrthopaedics 195 206 177Endoscopy 41 52 57Advanced Wound Management 37 40 41
273 298 275
Amounts comprise depreciation of property, plant and equipment, amortisation of other intangible assets, impairment of investmentsand amortisation of acquisition intangibles and impairments as follows:
2010$ million
2009$ million
2008$ million
Impairment of intangibles and goodwill - 32 14Amortisation of acquisition intangibles 34 34 37
34 66 51Depreciation of property, plant and equipment 203 206 204Amortisation of other intangible assets 34 26 18Impairment of investments 2 - 2
273 298 275
Impairments of $2m were recognised within operating profit in 2010 and included within the administrative expenses line (2009 –$32m, 2008 – $16m). This is segmentally allocated to Orthopaedics (2009 – Orthopaedics $19m and Endoscopy $13m, 2008 –Orthopaedics $2m and Endoscopy $14m).
Other significant non-cash expenses recognised within operating profit
2010$ million
2009$ million
2008$ million
Orthopaedics 8 22 23Endoscopy 2 2 -Advanced Wound Management 5 6 6
15 30 29
The $15m incurred in 2010 relates to restructuring and rationalisation expenses (2009 – $30m relates to acquisitions related costs andrestructuring and rationalisation expenses). In 2008, the $29m relates to the utilisation of Plus inventory stepped-up on acquisition,acquisition related costs and restructuring and rationalisation expenses.
2010 Annual Report 91

3(a). Operating Segment Information – (continued)
Average number of employees2010
numbers2009
numbers2008
numbers
Orthopaedics 5,045 4,853 4,840Endoscopy 2,134 1,888 1,849Advanced Wound Management 2,993 3,023 3,068
10,172 9,764 9,757
2010$ million
2009$ million
2008$ million
Balance SheetAssets:Orthopaedics 2,778 2,656 2,755Endoscopy 769 705 690Advanced Wound Management 755 810 704
Operating assets by segment 4,302 4,171 4,149Unallocated corporate assets 431 394 359
Total assets 4,733 4,565 4,508
Liabilities:Orthopaedics 457 426 448Endoscopy 124 111 107Advanced Wound Management 146 194 189
Operating liabilities by segment 727 731 744Unallocated corporate liabilities 1,233 1,655 2,065
Total liabilities 1,960 2,386 2,809
Unallocated corporate assets and liabilities comprise the following:
Deferred tax assets 224 202 214Cash and bank 207 192 145
Unallocated corporate assets 431 394 359
Long-term borrowings 642 1,090 1,358Retirement benefit obligations 262 322 350Deferred tax liabilities 69 31 46Current liability derivatives – credit balances on currency swaps - - 4Bank overdrafts and loans due within one year 57 45 115Current tax payable 203 167 192
Unallocated corporate liabilities 1,233 1,655 2,065
3(b).Geographic Information
2010$ million
2009$ million
2008$ million
Revenue by geographic marketUnited Kingdom 283 286 321Continental Europe 1,032 1,027 1,077United States 1,707 1,664 1,657Africa, Asia, Australasia and Other America 940 795 746
3,962 3,772 3,801
Revenue has been allocated by basis of origin. No revenue from a single customer is in excess of 10% of the group’s revenue.
92 2010 Annual Report

Des
crip
tion
ofth
eG
roup
Busi
ness
Revi
ew,
Liqui
dity
and
Pros
pect
sCo
rpor
ate
Gov
erna
nce
Stat
emen
tD
irect
ors’
Rem
uner
atio
nRe
port
Gro
upA
ccou
nts
Com
pany
Acc
ount
sIn
vest
orIn
form
atio
n
4. Operating Profit
2010$ million
2009$ million
2008$ million
Revenue 3,962 3,772 3,801Cost of goods sold (i) (1,031) (1,030) (1,077)
Gross profit 2,931 2,742 2,724
Research and development expenses (151) (155) (152)Selling, general and administrative expenses:
Marketing, selling and distribution expenses (ii) (1,414) (1,351) (1,416)Administrative expenses (iii) (iv) (446) (513) (526)
(1,860) (1,864) (1,942)
Operating profit 920 723 630
(i) In 2010, no restructuring and rationalisation expenses or acquisition related costs related to cost of goods sold (2009 – $15m ofrestructuring and rationalisation expenses and $12m of acquisition related costs, 2008 – $15m in respect of the utilisation of Plus inventorystepped-up to fair value on acquisition, $18m of restructuring and rationalisation expenses and $8m of acquisition related costs).
(ii) 2010 includes $3m of restructuring and rationalisation expenses (2009 – $7m of acquisition related costs and $10m of restructuring andrationalisation expenses, 2008 – $7m of acquisition related costs and $3m of restructuring and rationalisation expenses).
(iii) 2010 includes $34m of amortisation of other intangible assets (2009 – $26m, 2008 – $18m).
(iv) 2010 includes $12m of restructuring and rationalisation expenses and $34m of amortisation acquisition intangibles (2009 – $7m ofacquisition related costs, $17m of restructuring and rationalisation expenses and $66m of amortisation of acquisition intangibles andimpairments, 2008 – $31m of acquisition related costs, $13m of restructuring and rationalisation expenses and $51m of amortisation ofacquisition intangibles and impairments).
(v) Items detailed in (i), (ii) and (iv) are excluded from the calculation of trading profit.
Operating Profit is stated after charging the following items:
2010$ million
2009$ million
2008$ million
Amortisation of acquisition intangibles 34 34 37Amortisation of other intangible assets 34 26 18Impairment of intangible assets and goodwill - 32 14Depreciation of property, plant and equipment 203 206 204Loss on disposal of property, plant and equipment and software 15 14 12Impairment of investments 2 - 2Minimum operating lease payments for land and buildings 31 27 28Minimum operating lease payments for other assets 28 28 29Advertising costs 83 71 56
Staff costs during the year amounted to:
Notes 2010$ million
2009$ million
2008$ million
Wages and salaries 817 768 795Social security costs 91 86 87Pension costs (including retirement healthcare) 33 60 64 53Share based payments 25 21 18 24
989 936 959
2010 Annual Report 93

5. Acquisition Related Costs
During the year no “acquisition related costs” were incurred. In 2009 and 2008 (2009 – $26m, 2008 – $61m) acquisition costs relatedto the integration of the Plus business. For 2008, this includes $15m relating to the utilisation of the stepped-up Plus inventory to fairvalue on acquisition.
6. Restructuring and Rationalisation Expenses
In 2010, restructuring and rationalisation costs comprised $15m (2009 – $42m, 2008 – $34m) relating to the Earnings ImprovementProgramme and mainly comprise costs associated with the rationalisation of operational sites.
7. Interest (Payable)/Receivable
2010$ million
2009$ million
2008$ million
Interest receivable 3 2 5
Interest payable:Bank borrowings (7) (16) (62)Other (11) (26) (9)
(18) (42) (71)
Net interest payable (15) (40) (66)
Interest receivable includes net interest receivable of $nil (2009 – $nil, 2008 – $1m) on interest rate and currency swaps and interestpayable includes $5m (2009 – $23m, 2008 – $7m) of net interest payable on currency and interest rate swaps. The gross interestreceivable on these swaps was $4m (2009 – $14m, 2008 – $5m) and the gross interest payable was $9m (2009 – $37m, 2008 –$11m).
8. Other Finance Costs
Notes2010
$ million2009
$ million2008
$ million
Retirement benefits: Interest cost 33 (64) (61) (66)Retirement benefits: Expected return on plan assets 33 55 48 66Other (1) (2) (1)
Other finance costs (10) (15) (1)
Foreign exchange gains or losses recognised in the income statement arose primarily on the translation of intercompany and third partyborrowings and amounted to a net $8m gain in 2010 (2009 – net $14m gain, 2008 – net $4m loss). These amounts were fully matchedin the income statement by the fair value gains or losses on currency swaps (carried at fair value through profit and loss) held tomanage this currency risk.
94 2010 Annual Report
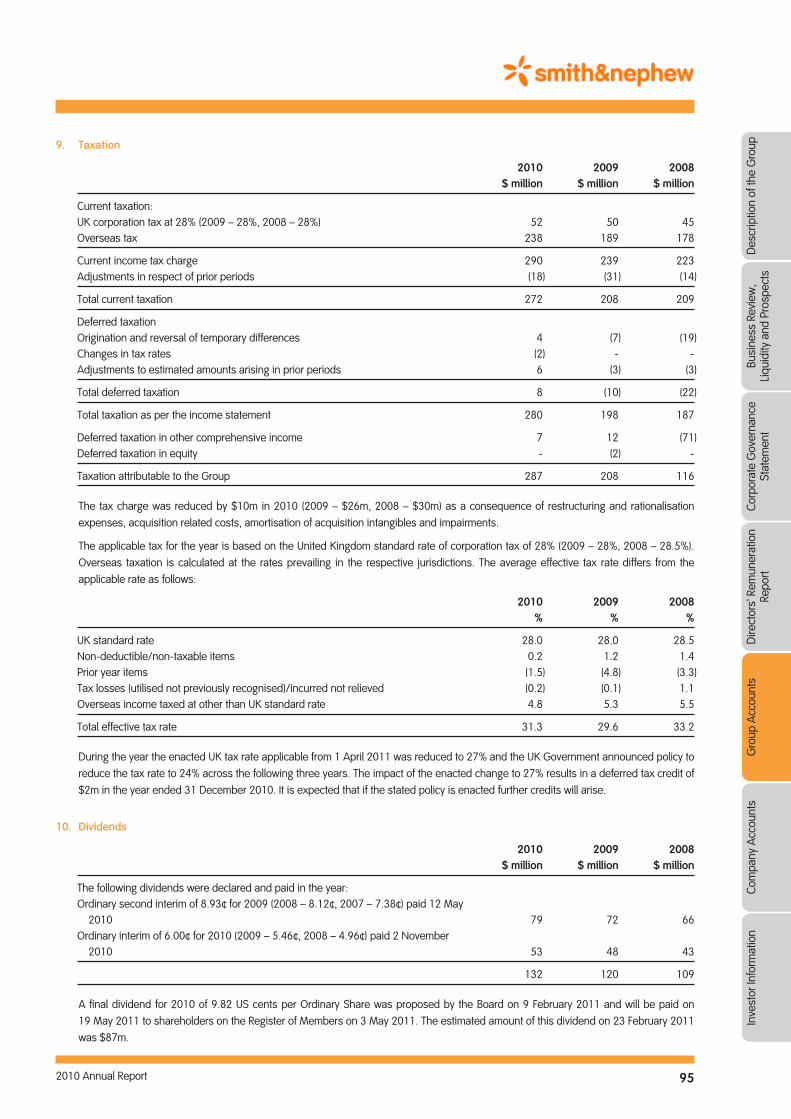
Des
crip
tion
ofth
eG
roup
Busi
ness
Revi
ew,
Liqui
dity
and
Pros
pect
sCo
rpor
ate
Gov
erna
nce
Stat
emen
tD
irect
ors’
Rem
uner
atio
nRe
port
Gro
upA
ccou
nts
Com
pany
Acc
ount
sIn
vest
orIn
form
atio
n
9. Taxation
2010$ million
2009$ million
2008$ million
Current taxation:UK corporation tax at 28% (2009 – 28%, 2008 – 28%) 52 50 45Overseas tax 238 189 178
Current income tax charge 290 239 223Adjustments in respect of prior periods (18) (31) (14)
Total current taxation 272 208 209
Deferred taxationOrigination and reversal of temporary differences 4 (7) (19)Changes in tax rates (2) - -Adjustments to estimated amounts arising in prior periods 6 (3) (3)
Total deferred taxation 8 (10) (22)
Total taxation as per the income statement 280 198 187
Deferred taxation in other comprehensive income 7 12 (71)Deferred taxation in equity - (2) -
Taxation attributable to the Group 287 208 116
The tax charge was reduced by $10m in 2010 (2009 – $26m, 2008 – $30m) as a consequence of restructuring and rationalisationexpenses, acquisition related costs, amortisation of acquisition intangibles and impairments.
The applicable tax for the year is based on the United Kingdom standard rate of corporation tax of 28% (2009 – 28%, 2008 – 28.5%).Overseas taxation is calculated at the rates prevailing in the respective jurisdictions. The average effective tax rate differs from theapplicable rate as follows:
2010%
2009%
2008%
UK standard rate 28.0 28.0 28.5Non-deductible/non-taxable items 0.2 1.2 1.4Prior year items (1.5) (4.8) (3.3)Tax losses (utilised not previously recognised)/incurred not relieved (0.2) (0.1) 1.1Overseas income taxed at other than UK standard rate 4.8 5.3 5.5
Total effective tax rate 31.3 29.6 33.2
During the year the enacted UK tax rate applicable from 1 April 2011 was reduced to 27% and the UK Government announced policy toreduce the tax rate to 24% across the following three years. The impact of the enacted change to 27% results in a deferred tax credit of$2m in the year ended 31 December 2010. It is expected that if the stated policy is enacted further credits will arise.
10. Dividends
2010$ million
2009$ million
2008$ million
The following dividends were declared and paid in the year:Ordinary second interim of 8.93¢ for 2009 (2008 – 8.12¢, 2007 – 7.38¢) paid 12 May
2010 79 72 66Ordinary interim of 6.00¢ for 2010 (2009 – 5.46¢, 2008 – 4.96¢) paid 2 November
2010 53 48 43
132 120 109
A final dividend for 2010 of 9.82 US cents per Ordinary Share was proposed by the Board on 9 February 2011 and will be paid on19 May 2011 to shareholders on the Register of Members on 3 May 2011. The estimated amount of this dividend on 23 February 2011was $87m.
2010 Annual Report 95

11. Earnings per Ordinary Share
The calculations of the basic, diluted and adjusted earnings per Ordinary Share are based on the following earnings and numbers ofshares:
2010$ million
2009$ million
2008$ million
EarningsAttributable profit for the year 615 472 377Adjusted attributable profit (see below) 654 580 493
Adjusted attributable profit
Adjusted earnings per Ordinary Share is a trend measure which presents the long-term profitability of the Group excluding the impactof specific transactions that management considers affect the Group’s short-term profitability. The Group presents this measure toassist investors in their understanding of trends. Adjusted attributable profit is the numerator used for this measure.
Attributable profit is reconciled to adjusted attributable profit as follows:
Notes 2010$ million
2009$ million
2008$ million
Attributable profit for the year 615 472 377Acquisition related costs 5 - 26 61Restructuring and rationalisation expenses 6 15 42 34Amortisation of acquisition intangibles and impairments 13 & 16 34 66 51Taxation on excluded items 9 (10) (26) (30)
Adjusted attributable profit 654 580 493
The numerators used for basic and diluted earnings per Ordinary Share are the same. The denominators used for all categories ofearnings for basic and diluted earnings per Ordinary Share are as follows:
2010 2009 2008
Number of shares (millions)Basic weighted average number of shares 888 884 886Dilutive impact of share options outstanding 1 1 4
Diluted weighted average number of shares 889 885 890
Earnings per Ordinary shareBasic 69.3¢ 53.4¢ 42.6¢Diluted 69.2¢ 53.3¢ 42.4¢Adjusted: Basic 73.6¢ 65.6¢ 55.6¢Adjusted: Diluted 73.6¢ 65.5¢ 55.4¢
Share options not included in the diluted EPS calculation because they were non-dilutive in the period totalled 2.5 million (2009 –21.4 million, 2008 – 18.7 million).
96 2010 Annual Report

Des
crip
tion
ofth
eG
roup
Busi
ness
Revi
ew,
Liqui
dity
and
Pros
pect
sCo
rpor
ate
Gov
erna
nce
Stat
emen
tD
irect
ors’
Rem
uner
atio
nRe
port
Gro
upA
ccou
nts
Com
pany
Acc
ount
sIn
vest
orIn
form
atio
n
12. Property, Plant and Equipment
Land and buildings Plant and equipmentAssets incourse of
constructionFreehold Leasehold Instruments Other Total$ million $ million $ million $ million $ million $ million
CostAt 1 January 2009 153 54 767 669 59 1,702Exchange adjustment 5 2 35 32 2 76Acquisitions – (Note 29) - - - 6 - 6Additions 4 3 133 75 1 216Disposals - (2) (57) (26) - (85)Transfer to assets held for sale (34) - - - - (34)Transfers 1 (5) 11 28 (35) -
At 31 December 2009 129 52 889 784 27 1,881Exchange adjustment (2) - 9 - - 7Additions 1 1 145 48 55 250Disposals (8) - (81) (43) (3) (135)Transfers 11 - 2 (3) (12) (2)
At 31 December 2010 131 53 964 786 67 2,001
Depreciation and ImpairmentAt 1 January 2009 44 20 472 441 - 977Exchange adjustment 1 1 22 22 - 46Charge for the year 10 4 131 61 - 206Disposals - (1) (52) (22) - (75)Transfer to assets held for sale (26) - - - - (26)Transfers - (2) 2 - - -
At 31 December 2009 29 22 575 502 - 1,128Exchange adjustment (1) - 7 (2) - 4Charge for the year 4 4 130 65 - 203Disposals (5) (1) (74) (41) - (121)Transfers 14 - - (14) - -
At 31 December 2010 41 25 638 510 - 1,214
Net book amounts
At 31 December 2010 90 28 326 276 67 787
At 31 December 2009 100 30 314 282 27 753
Land and buildings includes land with a cost of $10m (2009 – $14m) that is not subject to depreciation. Assets held under financeleases with a net book amount of $14m (2009 – $15m) are included within land and buildings and $10m (2009 – $10m) are includedwithin plant and equipment.
2010 Annual Report 97

13. Intangible Assets
Acquisitionintangibles
$ millionSoftware$ million
DistributionRights
$ million
Patents &Intellectual
Property$ million
Total$ million
CostAt 1 January 2009 387 68 33 66 554Exchange adjustment 18 3 - 1 22Acquisitions – (Note 29) 12 - - - 12Disposals - (4) - - (4)Additions - 44 34 24 102
At 31 December 2009 417 111 67 91 686Exchange adjustment 23 1 - - 24Disposals - (1) (25) - (26)Additions - 32 11 22 65Transfers - 2 - - 2
At 31 December 2010 440 145 53 113 751
Amortisation and ImpairmentAt 1 January 2009 103 15 26 34 178Exchange adjustment 9 1 1 - 11Charge for the year 34 13 8 5 60Impairment 13 - - 12 25
At 31 December 2009 159 29 35 51 274Exchange adjustment 7 1 - - 8Charge for the year 34 17 14 3 68Disposals - - (25) - (25)
At 31 December 2010 200 47 24 54 325
Net book amountsAt 31 December 2010 240 98 29 59 426
At 31 December 2009 258 82 32 40 412
In 2009, the Group incurred $25m of impairment charges against certain intangible assets arising from the acquisition ofOsteobiologics Inc. and the pain management business (2010 – $nil).
14. Investments
2010$ million
2009$ million
At 1 January 7 7Impairment (1) -
At 31 December 6 7
The investment is an available-for-sale investment of a non-controlling interest in an entity that holds mainly unquoted equity securitieswhich by their very nature have no fixed maturity date or coupon rate. The value of the investment is based on the underlying fair valueof the equity securities: marketable securities are valued by reference to closing prices in the market; non-marketable securities areestimated considering factors including the purchase price, prices of recent significant private placements of securities of the sameissuer and estimates of liquidation value. At year-end, the Group assesses whether there is objective evidence that the investment isimpaired. Any objective evidence would include a significant or prolonged decline in the fair value of the investment below its cost.
98 2010 Annual Report

Des
crip
tion
ofth
eG
roup
Busi
ness
Revi
ew,
Liqui
dity
and
Pros
pect
sCo
rpor
ate
Gov
erna
nce
Stat
emen
tD
irect
ors’
Rem
uner
atio
nRe
port
Gro
upA
ccou
nts
Com
pany
Acc
ount
sIn
vest
orIn
form
atio
n
15. Investments in Associates
The Group holds 49% of the Austrian entities Plus Orthopedics GmbH and Intraplant GmbH and 20% of the German entity IntercusGmbH. The following table summarises the financial position of the Group’s investment in these associates.
2010$ million
2009$ million
Share of results of associates:Revenue 11 10Operating costs and taxation (11) (8)
Profit after taxation recognised in the income statement - 2Dividends paid (1) (1)
Net (loss)/profit attributable to the Group (1) 1Investments in associates at 1 January 13 12Exchange adjustment 1 -
Investments in associates at 31 December 13 13
Investments in associates is represented by:
Assets 11 14Liabilities (2) (5)
Net assets 9 9Goodwill 4 4
13 13
16. Goodwill
Notes2010
$ million2009
$ million
CostAt 1 January 1,100 1,189Exchange adjustment 12 20Acquisitions 29 - 3Plus settlement 29 - (112)Adjustment to contingent consideration (4) -
At 31 December 1,108 1,100
ImpairmentAt 1 January 7 -Impairment in the year - 7
At 31 December 7 7
Net book amounts 1,101 1,093
Goodwill arising on acquisition is not amortised but reviewed for impairment on an annual basis. Goodwill is allocated to the cash-generating unit that is expected to benefit from the acquisition. If the recoverable amount of the cash-generating unit is less than itscarrying amount then an impairment loss is determined to have occurred. Any impairment losses that arise are recognised immediatelyin the income statement and are allocated first to reduce the carrying amount of goodwill and then to the carrying amounts of the otherassets.
2010 Annual Report 99
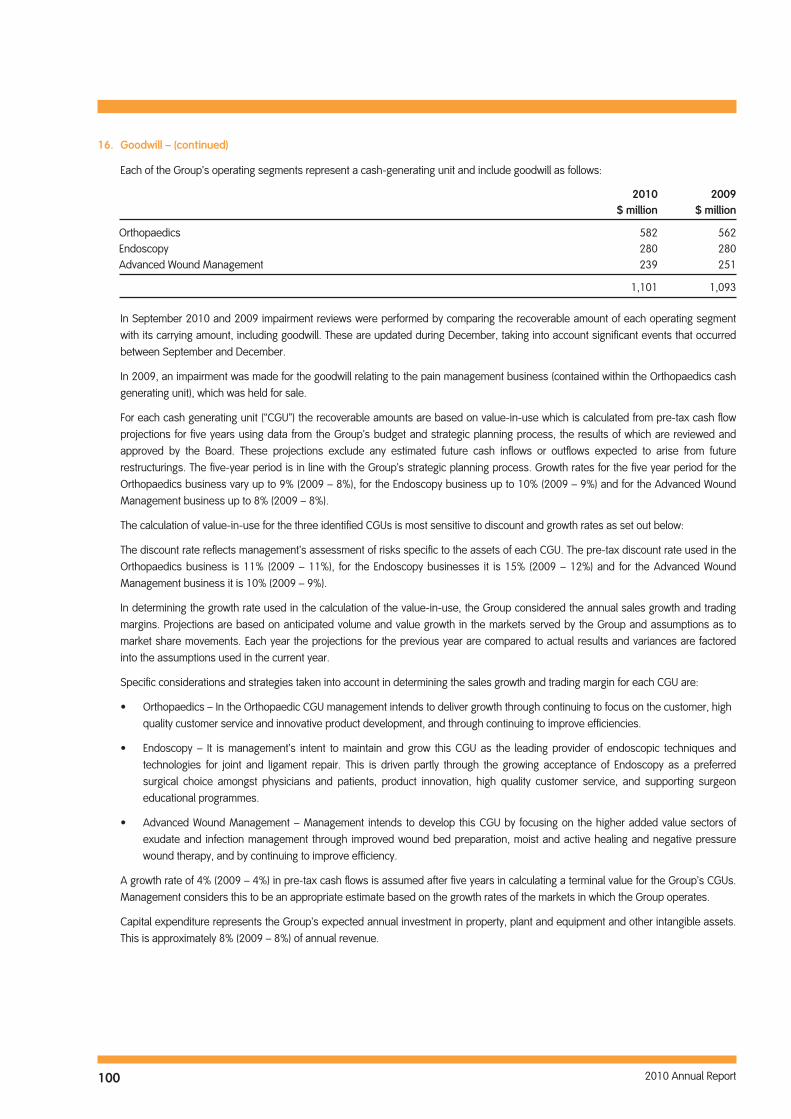
16. Goodwill – (continued)
Each of the Group’s operating segments represent a cash-generating unit and include goodwill as follows:
2010$ million
2009$ million
Orthopaedics 582 562Endoscopy 280 280Advanced Wound Management 239 251
1,101 1,093
In September 2010 and 2009 impairment reviews were performed by comparing the recoverable amount of each operating segmentwith its carrying amount, including goodwill. These are updated during December, taking into account significant events that occurredbetween September and December.
In 2009, an impairment was made for the goodwill relating to the pain management business (contained within the Orthopaedics cashgenerating unit), which was held for sale.
For each cash generating unit (“CGU”) the recoverable amounts are based on value-in-use which is calculated from pre-tax cash flowprojections for five years using data from the Group’s budget and strategic planning process, the results of which are reviewed andapproved by the Board. These projections exclude any estimated future cash inflows or outflows expected to arise from futurerestructurings. The five-year period is in line with the Group’s strategic planning process. Growth rates for the five year period for theOrthopaedics business vary up to 9% (2009 – 8%), for the Endoscopy business up to 10% (2009 – 9%) and for the Advanced WoundManagement business up to 8% (2009 – 8%).
The calculation of value-in-use for the three identified CGUs is most sensitive to discount and growth rates as set out below:
The discount rate reflects management’s assessment of risks specific to the assets of each CGU. The pre-tax discount rate used in theOrthopaedics business is 11% (2009 – 11%), for the Endoscopy businesses it is 15% (2009 – 12%) and for the Advanced WoundManagement business it is 10% (2009 – 9%).
In determining the growth rate used in the calculation of the value-in-use, the Group considered the annual sales growth and tradingmargins. Projections are based on anticipated volume and value growth in the markets served by the Group and assumptions as tomarket share movements. Each year the projections for the previous year are compared to actual results and variances are factoredinto the assumptions used in the current year.
Specific considerations and strategies taken into account in determining the sales growth and trading margin for each CGU are:
• Orthopaedics – In the Orthopaedic CGU management intends to deliver growth through continuing to focus on the customer, highquality customer service and innovative product development, and through continuing to improve efficiencies.
• Endoscopy – It is management’s intent to maintain and grow this CGU as the leading provider of endoscopic techniques andtechnologies for joint and ligament repair. This is driven partly through the growing acceptance of Endoscopy as a preferredsurgical choice amongst physicians and patients, product innovation, high quality customer service, and supporting surgeoneducational programmes.
• Advanced Wound Management – Management intends to develop this CGU by focusing on the higher added value sectors ofexudate and infection management through improved wound bed preparation, moist and active healing and negative pressurewound therapy, and by continuing to improve efficiency.
A growth rate of 4% (2009 – 4%) in pre-tax cash flows is assumed after five years in calculating a terminal value for the Group’s CGUs.Management considers this to be an appropriate estimate based on the growth rates of the markets in which the Group operates.
Capital expenditure represents the Group’s expected annual investment in property, plant and equipment and other intangible assets.This is approximately 8% (2009 – 8%) of annual revenue.
100 2010 Annual Report

Des
crip
tion
ofth
eG
roup
Busi
ness
Revi
ew,
Liqui
dity
and
Pros
pect
sCo
rpor
ate
Gov
erna
nce
Stat
emen
tD
irect
ors’
Rem
uner
atio
nRe
port
Gro
upA
ccou
nts
Com
pany
Acc
ount
sIn
vest
orIn
form
atio
n
16. Goodwill – (continued)
Management has considered the following sensitivities:
• Growth of Market and Market Share – Management has considered the impact of a variance in market growth and market share.The value-in-use calculation shows that if the assumed long-term growth rate was reduced to nil, the recoverable amount of all ofthe CGUs independently would still be greater than their carrying values.
• Discount Rate – Management has considered the impact of an increase in the discount rate applied to the calculation. Thevalue-in-use calculation shows that for the recoverable amount of the CGU to be less than its carrying value, the discount ratewould have to be increased to 31% (2009 – 31%) for the Orthopaedics business, 43% (2009 – 37%) for the Endoscopy businessand 53% (2009 – 39%) for the Advanced Wound Management business.
17. Inventories
2010$ million
2009$ million
2008$ million
Raw materials and consumables 159 157 131Work-in-progress 23 28 32Finished goods and goods for resale 741 748 716
923 933 879
Reserves for excess and obsolete inventories were $322m (2009 – $303m, 2008 – $232m). During 2010, $66m was recognised as anexpense within cost of goods sold resulting from the write down of excess and obsolete inventory (2009 – $92m, 2008 – $69m). Thecost of inventories recognised as an expense and included in cost of goods sold amounted to $909m (2009 – $866m, 2008 – $922m).
No inventory is carried at fair value less costs to sell in any year.
18. Trade and Other Receivables
2010$ million
2009$ million
2008$ million
Trade receivables 952 843 826Less: provision for bad and doubtful debts (49) (47) (40)
Trade receivables – net (loans and receivables) 903 796 786Current asset derivatives – forward foreign exchange contracts 23 13 38Other receivables 55 71 73Amounts owed by associates - 2 2Prepayments and accrued income 65 64 62
1,046 946 961Less non-current portion: Trade receivables (22) - -
Current portion 1,024 946 961
All non-current receivables are due within five years from the balance sheet date.
Management considers that the carrying amount of trade and other receivables approximates to the fair value.
2010 Annual Report 101

18. Trade and Other Receivables – (continued)
The provision for bad and doubtful debts is based on specific assessments of risk and reference to past default experience. The baddebt expense (excluding the macrotextured claim) for the year was $30m (2009 – $33m, 2008 – $30m). Amounts due from insurers inrespect of the macrotextured claim of $133m (2009 – $128m, 2008 – $124m) are included within other receivables and have beenprovided in full.
The Group manages credit risk through credit limits which require authorisation commensurate with the size of the limit and which areregularly reviewed. Credit limit decisions are made based on available financial information and the business case. Significantreceivables are regularly reviewed and monitored at Group level. The Group has no significant concentration of credit risk, withexposure spread over a large number of customers. Furthermore the Group’s principal customers are backed by government andpublic or private medical insurance funding, which represent a lower risk of default. The maximum exposure to credit risk at thereporting date is the fair value of each class of receivable. The Group does not hold any collateral as security.
The amount of trade receivables that were past due but not impaired were as follows:
2010$ million
2009$ million
2008$ million
Past due not more than three months 168 202 242Past due more than three months and not more than six months 52 56 47Past due more than six months and not more than one year 57 46 41Past due more than one year 59 80 91
336 384 421Neither past due nor impaired 616 459 405Provision for bad and doubtful debts (49) (47) (40)
Trade receivables – net (loans and receivables) 903 796 786
Movements in the provision for bad and doubtful debts were as follows:
At 1 January 47 40 22Exchange adjustment - 1 -Receivables provided for during the year 30 33 30Utilisation of provision (28) (27) (12)
At 31 December 49 47 40
Trade receivables include amounts denominated in the following major currencies:
US Dollar 282 281 299Sterling 72 55 52Euro 283 280 273Other 266 180 162
Trade receivables – net (loans and receivables) 903 796 786
Trade receivables of $11m (2009 – $20m, 2008 – $23m) are under a factoring agreement with third parties. The arrangement does notqualify for de-recognition as the Group retains part of the credit risks – the associated liability amounts to $4m (2009 – $12m, 2008 –$20m) and is accounted for as a part of current payables.
102 2010 Annual Report

Des
crip
tion
ofth
eG
roup
Busi
ness
Revi
ew,
Liqui
dity
and
Pros
pect
sCo
rpor
ate
Gov
erna
nce
Stat
emen
tD
irect
ors’
Rem
uner
atio
nRe
port
Gro
upA
ccou
nts
Com
pany
Acc
ount
sIn
vest
orIn
form
atio
n
19. Cash and Borrowings
Net debt comprises borrowings and credit balances on currency swaps less cash and bank.
2010$ million
2009$ million
Bank overdrafts and loans due within one year 57 45Long-term borrowings 642 1,090
Borrowings 699 1,135Cash and bank (207) (192)
Net debt 492 943
Borrowings are repayable as follows:
Within oneyear or on
demand$ million
Between oneand two
years$ million
Between twoand three
years$ million
Betweenthree andfour years
$ million
Betweenfour and five
years$ million
After fiveyears
$ millionTotal
$ million
At 31 December 2010:Bank loans 41 498 - 126 - - 665Bank overdrafts 12 - - - - - 12Finance lease liabilities 4 2 2 2 2 10 22
57 500 2 128 2 10 699
At 31 December 2009:Bank loans 24 1 1,066 - - - 1,091Bank overdrafts 18 - - - - - 18Finance lease liabilities 3 3 3 3 2 12 26
45 4 1,069 3 2 12 1,135
Assets are pledged as security under normal market conditions. Secured borrowings and pledged assets are as follows:
2010$ million
2009$ million
Finance lease liabilities – due within one year 4 3Secured bank overdrafts and loans - 1Finance lease liabilities – due after one year 18 23Secured long-term borrowings - 1
Total amount of secured borrowings 22 28
Total net book value of assets pledged as security:Property, plant and equipment 22 28
22 28
All currency swaps are stated at fair value. Gross US Dollar equivalents of $61m (2009 – $95m) receivable and $61m (2009 – $95m)payable have been netted and the difference of $nil (2009 – $nil) is reported as a $nil balance on currency swaps. Currency swapscomprise foreign exchange swaps and were used in 2010 and 2009 to hedge intragroup loans.
2010 Annual Report 103

19. Cash and Borrowings – (continued)
Currency swaps mature as follows:
Amountreceivable
Amountpayable
At 31 December 2010 $ millionCurrency
million
Within one year:Japanese Yen 18 Yen 1,500Canadian Dollar 25 C$24
43
Amountreceivable
Amountpayable
At 31 December 2010Currency
million $ million
Within one year:New Zealand Dollar NZ$5 4Australian Dollar AUS$14 14
18
Amountreceivable
Amountpayable
At 31 December 2009 $ millionCurrency
million
Within one year:Australian Dollar 28 Aus$31Japanese Yen 17 Yen 1,500Canadian Dollar 35 C$37Swiss Franc 6 CHF6New Zealand Dollar 1 NZ$1
87
Amountreceivable
Amountpayable
At 31 December 2009Currency
million $ million
Within one year:Sterling £5 8
104 2010 Annual Report

Des
crip
tion
ofth
eG
roup
Busi
ness
Revi
ew,
Liqui
dity
and
Pros
pect
sCo
rpor
ate
Gov
erna
nce
Stat
emen
tD
irect
ors’
Rem
uner
atio
nRe
port
Gro
upA
ccou
nts
Com
pany
Acc
ount
sIn
vest
orIn
form
atio
n
19. Cash and Borrowings – (continued)
Liquidity Risk ExposuresThe Board has established a set of policies to manage funding and currency risks. The Group uses derivative financial instruments onlyto manage the financial risks associated with underlying business activities and their financing.
Liquidity risk is the risk that the Group is not able to settle or meet its obligations on time or at a reasonable price. The Group’s policy isto ensure that there is sufficient funding and facilities in place to meet foreseeable borrowing requirements. The Group manages andmonitors liquidity risk through regular reporting of current cash and borrowing balances and periodic preparation and review of shortand medium term cash forecasts having regard to the maturities of investments and borrowing facilities.
Bank loans and overdrafts represent drawings under total committed facilities of $1,511m (2009 – $2,503m) and total uncommittedfacilities of $332m (2009 – $415m). The Group has undrawn committed facilities of $884m (2009 – $1,436m). Of the undrawncommitted facilities, $7m expires within one year and $877m after two but within five years (2009 – $1m expired within one year and$1,435m after two but within five years). The interest payable on borrowings under committed facilities is at floating rate and is typicallybased on the LIBOR interest rate relevant to the term and currency concerned. Borrowings are shown at book value which is the sameas fair value.
In December 2010 the Company reviewed and replaced its principal banking facilities ahead of their maturity in May 2012. TheCompany has reduced its $1 billion 5-year term facility to $500 million with effect from 20 December 2010. The interest rate for thismulti-currency facility, at 20 basis points over LIBOR, is unchanged. Smith & Nephew has also cancelled its $1.5 billion multi-currencyrevolving facility and replaced it with a new 5-year $1 billion multi-currency revolving facility with an initial interest rate of 70 basispoints over LIBOR. The commitment fee on the undrawn amount of the revolving facility is 24.5 basis points. The Company is subject torestrictive covenants under the facility agreement requiring the Group’s ratio of net debt to EBITDA to not exceed 3.0 to 1 and the ratioof EBITA to net interest to not be less than 3.0 to 1, with net debt, EBITDA, EBITA and net interest all being calculated as defined in theagreement. These financial covenants are tested at the end of each half year for the 12 months ending on the last day of the testingperiod. As of 31 December 2010, the Company was in compliance with these covenants. The facility is also subject to customaryevents of default, none of which are currently anticipated to occur.
2010 Annual Report 105

19. Cash and Borrowings – (continued)
The table below analyses the Group’s year end financial liabilities by contractual maturity date, including interest payments andexcluding the impact of netting arrangements:
Withinone year oron demand
$ million
Between oneand
two years$ million
Between twoand
five years$ million
Afterfive years$ million
Total$ million
At 31 December 2010:Non-derivative financial liabilities:Bank overdrafts and loans 59 500 130 - 689Trade and other payables 584 - - - 584Finance lease liabilities 5 4 9 12 30Derivative financial liabilities:Currency swaps/forward foreign
exchange contracts – outflow 1,008 - - - 1,008Currency swaps/forward foreign
exchange contracts – inflow (1,000) - - - (1,000)Interest rate basis swaps – gross outflow 2 - - - 2Interest rate basis swaps – gross inflow (2) - - - (2)
656 504 139 12 1,311
At 31 December 2009:Non-derivative financial liabilities:Bank overdrafts and loans 48 7 1,069 - 1,124Trade and other payables 547 - - - 547Acquisition consideration 19 28 - - 47Finance lease liabilities 5 5 10 15 35Derivative financial liabilities:Currency swaps/forward foreign
exchange contracts – outflow 1,033 - - - 1,033Currency swaps/forward foreign
exchange contracts – inflow (1,023) - - - (1,023)Interest rate basis swaps – gross outflow 10 - - - 10Interest rate basis swaps – gross inflow (5) - - - (5)
634 40 1,079 15 1,768
The amounts in the tables above are undiscounted cash flows, which differ from the amounts included in the balance sheet where theunderlying cash flows have been discounted.
20. Financial Instruments and Risk Management
Foreign Exchange ExposuresThe Group operates in over 90 countries and as a consequence has transactional and translational foreign exchange exposure. TheGroup’s policy is to limit the impact of foreign exchange movements on equity by holding liabilities where practical in the samecurrencies as the Group’s non US Dollar assets. These liabilities take the form of either borrowings or currency swaps. The Groupdesignates a portion of foreign currency borrowings in non-operating units as net investment hedges. As at 31 December 2010,CHF125m (2009 – CHF261m) of Group borrowings and nil (2009 – $6m) of currency swaps were designated as net investment hedges;the movement in the fair value of these hedges attributable to changes in exchange rates is recognised directly in reserves. The fairvalue of these hedges at 31 December 2010 was $134m (2009 – $252m). It is Group policy for operating units not to hold materialunhedged monetary assets or liabilities other than in their functional currencies.
Foreign exchange variations affect trading results in two ways. Firstly, on translation of overseas sales and profits into US Dollars andsecondly, transactional exposures arising where some or all of the costs of sale are incurred in a different currency from the sale. Theprincipal transactional exposures arise as the proportion of costs in US Dollars, Sterling and Swiss Francs exceed the proportion ofsales in each of these currencies and correspondingly the proportion of sales in Euros exceeds the proportion of costs in Euros.
106 2010 Annual Report

Des
crip
tion
ofth
eG
roup
Busi
ness
Revi
ew,
Liqui
dity
and
Pros
pect
sCo
rpor
ate
Gov
erna
nce
Stat
emen
tD
irect
ors’
Rem
uner
atio
nRe
port
Gro
upA
ccou
nts
Com
pany
Acc
ount
sIn
vest
orIn
form
atio
n
20. Financial Instruments and Risk Management – (continued)
The impact of currency movements on the cost of purchases is partly mitigated by the use of forward foreign exchange contracts. TheGroup uses forward foreign exchange contracts, designated as cash flow hedges, to hedge forecast third party and intercompanytrading cash flows for forecast foreign currency inventory purchases for up to one year. When a commitment is entered into, forwardforeign exchange contracts are normally used to increase the hedge to 100% of the exposure. Cash flows relating to cash flow hedgesare expected to occur within twelve months of inception and profits and losses on hedges are expected to enter into the determinationof profit (within cost of goods sold) within a further twelve month period. The principal currencies hedged by forward foreign exchangecontracts are US Dollars, Euros and Sterling. At 31 December 2010, the Group had contracted to exchange within one year theequivalent of $944m (2009 – $933m).
Based on the Group’s borrowings as at 31 December 2010, if the US Dollar were to weaken against all currencies by 10%, the Group’snet borrowings would increase by $24m (2009 – $52m). In respect of borrowings held in a different currency to the relevant reportingentity, if the US Dollar were to weaken by 10% against all other currencies, the Group’s borrowings would increase by $35m (2009 –$63m). Excluding borrowings designated as net investment hedges, the increase would be $21m (2009 – $37m); this increase wouldbe fully offset by corresponding movements in group loan values.
If the US Dollar were to weaken by 10% against all other currencies, then the fair value of the forward foreign exchange contracts as at31 December 2010 would have been $20m lower (2009 – $19m), which would be recognised through the hedging reserve. Similarly, ifthe Euro were to weaken by 10% against all other currencies, then the fair value of the forward foreign exchange contracts as at31 December 2010 would have been $19m higher (2009 – $19m).
A 10% strengthening of the US Dollar against all other currencies at 31 December would have had the equal but opposite effect to theamounts shown above, on the basis that all other variables remain constant.
Since it is the Group’s policy to hedge all actual foreign exchange exposures and the Group’s forward foreign exchange contracts aredesignated as cash flow hedges, the net impact of transaction related foreign exchange on the income statement from a movement inexchange rates on the value of forward foreign exchange contracts is not significant.
Interest Rate ExposuresThe Group is exposed to interest rate risk on cash, borrowings and currency swaps which are all at floating rates. The Group usesfloating to fixed interest swaps to meet its objective of protecting borrowing costs within parameters set by the Board. Interest rateswaps are accounted for as cash flow hedges and, as such, changes in fair value resulting from changes in market interest rates arerecognised in other comprehensive income, with the fair value of the interest rate swaps recorded in the balance sheet. The cash flowsresulting from interest rate swaps match cash flows on the underlying borrowings so that there is no net cash flow from movements inmarket interest rates on the hedged items. At 31 December 2010 the Group had fixed future interest rates on borrowings totaling$98m for a period of six months and $112m for a period of one year (2009 – $515m for a period of one year).
Based on the Group’s gross borrowings as at 31 December 2010, if interest rates were to increase by 100 basis points in all currenciesthen the annual net interest charge would increase by $5m (2009 – $6m). Excluding the impact of the Group’s interest rate hedges, theincrease in the interest charge would be $7m (2009 – $11m). Similarly if interest rates were to increase by 100 basis points in allcurrencies, the fair value of the Group’s interest rate swaps would increase equity by $2m (2009 – $5m). A decrease in interest ratesby 100 basis points in all currencies would have an equal but opposite effect to the amounts shown above.
Credit Risk ExposuresThe Group limits exposure to credit risk on counterparties used for financial instruments through a system of internal credit limits which,with certain minor exceptions due to local market conditions, require counterparties to have a minimum “A” rating from one of the majorratings agencies. The financial exposure of a counterparty is determined as the total of cash and deposits, plus the risk on derivativeinstruments, assessed as the fair value of the instrument plus a risk element based on the nominal value and the historic volatility ofthe market value of the instrument. The Group does not anticipate non-performance of counterparties and believes it is not subject tomaterial concentration of credit risk as the Group operates within a policy of counterparty limits designed to reduce exposure to anysingle counterparty.
The maximum credit risk exposure on derivatives at 31 December 2010 was $23m (2009 – $13m), being the total debit fair values onforward foreign exchange contracts, interest rate swaps and currency swaps. The maximum credit risk exposure on cash and bank at31 December 2010 was $207m (2009 – $192m). The Group’s exposure to credit risk is not material as the amounts are held in a widenumber of banks in a number of different countries.
Credit risk on trade receivables is detailed in Note 18 of the Notes to the Group Accounts.
2010 Annual Report 107

20. Financial Instruments and Risk Management – (continued)
Currency and Interest Rate Profile of Interest Bearing Liabilities and AssetsIn 2010, the Group entered into a series of interest rate swaps to fix the monthly interest payable on $98m for a period of six monthsand $112m for a period of one year (2009 – $515m for a period of one year) of the Group’s floating rate borrowings. The swaps aredenominated in US Dollars, Euros and Swiss Francs. Short-term debtors and creditors are excluded from the following disclosures.
Currency and Interest Rate Profile of Interest Bearing Liabilities:
Fixed rate liabilities
Grossborrowings
$ million
Currencyswaps
$ million
Totalliabilities$ million
Floatingrate
liabilities$ million
Fixedrate
liabilities$ million
Weightedaverageinterest
rate%
Weightedaveragetime for
whichrate is
fixedYears
At 31 December 2010:US Dollar 294 18 312 244 68 2.5 2Swiss Franc 137 - 137 80 57 0.6 1Euro 167 - 167 100 67 1.0 1Other 101 43 144 104 40 0.9 1
Total interest bearing liabilities 699 61 760 528 232
At 31 December 2009:US Dollar 462 - 462 292 170 2.5 2Swiss Franc 257 6 263 93 170 0.8 1Euro 306 - 306 105 201 1.8 1Other 110 89 199 199 - - -
Total interest bearing liabilities 1,135 95 1,230 689 541
$22m (2009 – $26m) of fixed rate liabilities relate to finance leases and $210m (2009 – $515m) relate to hedged borrowings under the$500m term facility. In 2009, the Group also had liabilities due for deferred acquisition consideration (denominated in US Dollars, Euroand Yen) totalling $46m on which no interest was payable (see Note 21 of the Notes to the Group Accounts). There are no othersignificant interest bearing financial liabilities.
Floating rates on liabilities are typically based on the one or three-month LIBOR interest rate relevant to the currency concerned. Theweighted average interest rate on floating rate borrowings as at 31 December 2010 was 1% (2009 – 1%).
Currency and Interest Rate Profile of Interest Bearing Assets:
Cash and bank$ million
Currencyswaps
$ millionTotal assets
$ million
Floating rateassets
$ million
At 31 December 2010:US Dollars 46 43 89 89Other 161 18 179 179
Total interest bearing assets 207 61 268 268
At 31 December 2009:US Dollars 41 87 128 128Other 151 8 159 159
Total interest bearing assets 192 95 287 287
Floating rates on assets are typically based on the short-term deposit rates relevant to the currency concerned. There were no fixedrate assets at 31 December 2010 or 31 December 2009.
108 2010 Annual Report

Des
crip
tion
ofth
eG
roup
Busi
ness
Revi
ew,
Liqui
dity
and
Pros
pect
sCo
rpor
ate
Gov
erna
nce
Stat
emen
tD
irect
ors’
Rem
uner
atio
nRe
port
Gro
upA
ccou
nts
Com
pany
Acc
ount
sIn
vest
orIn
form
atio
n
20. Financial Instruments and Risk Management – (continued)
Fair Value of Financial Assets and LiabilitiesFor cash and cash equivalents, short-term loans and receivables, overdrafts and other short-term liabilities which have a maturity ofless than three months the book values approximate the fair values because of their short-term nature.
Forward foreign exchange contracts that are taken out as hedges are fair valued. These are regarded as Level 2 financial instrumentsmeasured at fair value. Level 2 financial investments are defined as: Valuation techniques for which all observable inputs have asignificant effect on the recorded fair values, either directly or indirectly. The Group only has Level 2 financial instruments measured atfair value.
The Group enters into derivative financial instruments with financial institutions with investment grade credit ratings. Derivatives valuedusing valuation techniques with market observable inputs are mainly interest rate swaps and forward foreign exchange contracts. Themost frequently applied valuation techniques include forward pricing and swap models, using present value calculations. The modelsincorporate various inputs including the credit quality of counterparties, foreign exchange spot and forward rates, interest rate curvesand forward rate curves.
As at 31 December 2010 and 31 December 2009, the mark-to-market value of a derivative asset position is net of a credit valuationadjustment attributable to derivative counterparty default risk. The changes in counterparty credit risk had no material effect on thehedge effectiveness for derivatives designated in hedge relationships and other financial instruments recognised at fair value.
Long-term borrowings are measured in the balance sheet at amortised cost. As the Group’s long-term borrowings are not quotedpublicly and as market prices are not available their fair values are estimated by discounting future contractual cash flows to netpresent values at the current market interest rates available to the Group for similar financial instruments as at the year end. At31 December 2010 and 31 December 2009, the fair value of the Group’s long-term borrowing was not materially different fromamortised cost.
21. Payables
2010$ million
2009$ million
Trade and other payables due within one yearTrade and other payables 584 547Current liability derivatives – forward foreign exchange contracts 33 24Current liability derivatives – interest rate swaps - 6Acquisition consideration - 19
617 596
Other payables due after one year:Acquisition consideration - 27
The amount of $27m due after more than one year in the prior year was settled early during 2010. Trade payables are not interestbearing and are stated at their nominal value. Management considers that the carrying amount of trade payables approximates the fairvalue.
2010 Annual Report 109

22. Provisions
Rationalisationand integration
$ million
Legal and otherprovision$ million
Total$ million
At 1 January 2010 18 90 108Charge to income statement 7 18 25Utilisation (11) (12) (23)
At 31 December 2010 14 96 110
Provisions – due within one year 14 23 37Provisions – due after one year - 73 73
At 31 December 2010 14 96 110
Provisions – due within one year 16 39 55Provisions – due after one year 2 51 53
At 31 December 2009 18 90 108
The principal provisions within rationalisation and integration provisions relate to the rationalisation of operational sites (mainlyseverance and legal costs) arising from the Earnings Improvement Programme, integration expenses relating to severance, legal andonerous leases arising from the acquisition of Plus and an onerous lease obligation on the exit from the tissue engineering operation.
Included within the legal and other provision is $20m (2009 – $25m) relating to the declination of insurance coverage for macrotexturedknee revisions (see Note 32 of the Notes to the Group Accounts). The remaining balance largely represents provisions for variouslitigation and patent disputes.
All provisions are expected to be substantially utilised within four years of 31 December 2010 and none are treated as financialinstruments.
23. Deferred Taxation
2010$ million
2009$ million
Deferred tax assets 224 202Deferred tax liabilities (69) (31)
Net position at 31 December 155 171
The movement in the year in the Group’s net deferred tax position was as follows:
Notes2010
$ million2009
$ million
At 1 January 171 168Exchange adjustment (1) 4Movement in income statement – current year (4) 7Movement in income statement – prior years (4) 3Acquisitions 29 - 1Other intangible assets - (2)Movement in other comprehensive income (7) (12)Movement in shareholders’ equity - 2
At 31 December 155 171
110 2010 Annual Report

Des
crip
tion
ofth
eG
roup
Busi
ness
Revi
ew,
Liqui
dity
and
Pros
pect
sCo
rpor
ate
Gov
erna
nce
Stat
emen
tD
irect
ors’
Rem
uner
atio
nRe
port
Gro
upA
ccou
nts
Com
pany
Acc
ount
sIn
vest
orIn
form
atio
n
23. Deferred Taxation – (continued)
Movements in the main components of deferred tax assets and liabilities were as follows:
Deferred tax assets:
Retirementbenefit
obligation$ million
Macro-textured
claim$ million
Other$ million
Total$ million
At 1 January 2009 66 52 96 214Exchange adjustment 2 - 3 5Movement in income statement – current year (1) - 2 1Movement in income statement – prior years 1 - 3 4Movement in other comprehensive income (20) - - (20)Movement in shareholders’ equity - - 1 1Acquisitions - - 1 1Other intangible assets - - (2) (2)Transfers 6 - (8) (2)
At 31 December 2009 54 52 96 202Exchange adjustment - - 1 1Movement in income statement – current year (5) - 18 13Movement in income statement – prior years - - (1) (1)Movement in other comprehensive income 6 - - 6Transfers (1) - 4 3
At 31 December 2010 54 52 118 224
The Group has unused tax losses of $21m (2009 – $25m) available for offset against future profits. A deferred tax asset has beenrecognised in respect of $1m (2009 – $1m) of such losses. No deferred tax asset has been recognised on the remaining unused taxlosses as these are not expected to be realised in the foreseeable future.
Deferred tax liabilities:
Acceleratedtax
depreciation$ million
Intangibleassets
$ millionOther
$ millionTotal
$ million
At 1 January 2009 (41) (34) 29 (46)Exchange adjustment (1) (2) 2 (1)Movement in income statement – current year 2 2 2 6Movement in income statement – prior years 5 (2) (4) (1)Movement in other comprehensive income - - 8 8Movement in shareholders’ equity - - 1 1Transfers - 2 - 2
At 31 December 2009 (35) (34) 38 (31)Exchange adjustment 2 (1) (3) (2)Movement in income statement – current year 2 4 (23) (17)Movement in income statement – prior years 1 1 (5) (3)Movement in other comprehensive income - - (13) (13)Transfers 5 (3) (5) (3)
At 31 December 2010 (25) (33) (11) (69)
2010 Annual Report 111

24. Share Capital
Ordinary Shares(20¢)
Deferred Shares(£1.00) Total
Thousand $ million Thousand $ million $ million
AuthorisedAt 31 December 2008 1,223,591 245 50 - 245At 31 December 2009 1,223,591 245 50 - 245At 31 December 2010 1,223,591 245 50 - 245
Allotted, issued and fully paidAt 1 January 2008 947,508 190 50 - 190Share options 2,382 - - - -
At 31 December 2008 949,890 190 50 - 190Share options 1,131 - - - -
At 31 December 2009 951,021 190 50 - 190Share options 1,816 1 - - 1
At 31 December 2010 952,837 191 50 - 191
The deferred shares were issued in 2006 in order to comply with English Company law. They are not listed on any stock exchange andhave extremely limited rights and effectively have no value. These rights are summarised as follows:
Š The holder shall not be entitled to participate in the profits of the Company;
Š The holder shall not have any right to participate in any distribution of the Company’s assets on a winding up or other distributionexcept that after the return of the nominal amount paid up on each share in the capital of the company of any class other than theDeferred Shares and the distribution of a further $1,000 in respect of each such share there shall be distributed to a holder of aDeferred Share (for each Deferred Share held by him) an amount equal to the nominal value of the Deferred Share;
Š The holder shall not be entitled to receive notice, attend, speak or vote at any general meeting of the Company; and
Š The Company may create, allot and issue further shares or reduce or repay the whole or any part of its share capital or othercapital reserves without obtaining the consent of the holders of the Deferred Shares.
The Group’s objectives when managing capital are to ensure the Group has adequate funds to continue as a going concern andsufficient flexibility within the capital structure to fund the ongoing growth of the business and to take advantage of businessdevelopment opportunities including acquisitions.
The Group determines the amount of capital taking into account changes in business risks and future cash requirements. The Groupreviews its capital structure on an ongoing basis and uses share buy-backs, dividends and the issue of new shares to adjust theretained capital.
The Group considers the capital that it manages to be as follows:
2010$ million
2009$ million
2008$ million
Share capital 191 190 190Share premium 396 382 375Treasury shares (778) (794) (823)Retained earnings and other reserves 2,964 2,401 1,957
2,773 2,179 1,699
112 2010 Annual Report

Des
crip
tion
ofth
eG
roup
Busi
ness
Revi
ew,
Liqui
dity
and
Pros
pect
sCo
rpor
ate
Gov
erna
nce
Stat
emen
tD
irect
ors’
Rem
uner
atio
nRe
port
Gro
upA
ccou
nts
Com
pany
Acc
ount
sIn
vest
orIn
form
atio
n
25(a). Share Based Payments – Share Options Plans
Employee PlansThe Smith & Nephew Sharesave Plan (2002) (adopted by shareholders on 3 April 2002) (the Save As You Earn (“SAYE”) plan) isavailable to all employees in the UK employed by participating Group companies, subject to three months’ service. The schemeprovides for employees to save up to £250 per month and gives them an option to acquire shares based on the committed amount tobe saved. The option price is not less than 80% of the average of middle market quotations of the Ordinary Shares on the three dealingdays preceding the date of invitation. The Smith & Nephew International Sharesave Plan (2002) is offered to employees in Australia,Austria, Belgium, Canada, Denmark, Finland, Germany, Hong Kong, Japan, South Korea, Mexico, New Zealand, Norway, Poland,Portugal, Puerto Rico, Singapore, South Africa, Spain, Sweden, Switzerland and the United Arab Emirates. Employees in Belgium, Italy,the Netherlands and France are able to participate respectively in the Smith & Nephew Belgian Sharesave Plan (2002), the Smith &Nephew Italian Sharesave Plan (2002), the Smith & Nephew Dutch Sharesave Plan (2002) and the Smith & Nephew France SharesavePlan (2002). Participants in Ireland are able to participate in the Smith & Nephew Irish Employee Share Option Scheme. These plansoperate on a substantially similar basis to the Smith & Nephew Sharesave Plan (2002). Employees in Belgium participated in theSmith & Nephew International Sharesave Plan (2002) from September 2010 onwards. Together all of the plans referred to above aretermed the “Employee Plans”.
Employees in the US are able to participate in the Employee Stock Purchase Plan, which gives them the opportunity to acquire shares,in the form of ADSs, at a discount of 15% (or more if the shares appreciate in value during the plan’s quarterly purchase period) to themarket price, through a regular savings plan.
Executive PlansThe Smith & Nephew 1985 Share Option Scheme (adopted by shareholders on 9 May 1985), the Smith & Nephew 1990 InternationalExecutive Share Option Scheme (adopted by shareholders on 15 May 1990), the Smith & Nephew 2001 UK Approved Share OptionPlan, the Smith & Nephew 2001 UK Unapproved Share Option Plan, the Smith & Nephew 2001 US Share Plan (adopted byshareholders on 4 April 2001), the Smith & Nephew 2004 Executive Share Option Plan (adopted by shareholders on 6 May 2004) andthe Smith & Nephew Global Share Plan 2010 (adopted by shareholders on 6 May 2010) are together termed the “Executive Plans”. TheSmith & Nephew 1985 Share Option Scheme and the Smith & Nephew 1990 International Executive Share Option Scheme expiredduring 2010 and no options remain outstanding as at 31 December 2010.
Under the terms of the Executive Plans, the Remuneration Committee, consisting of non-executive directors, may at their discretionapprove the grant of options to employees of the Group to acquire Ordinary Shares in the Company. Options granted under theSmith & Nephew 2001 US Share Plan (the “US Plan”) and the Smith & Nephew 2004 Executive Share Option Plan are to acquire ADSsor Ordinary Shares. For options granted prior to 2001, the option price was not less than the market value of an Ordinary Share, or thenominal value if higher (the market value being the quoted price on the business day preceding the date of grant or the quoted price onthe date of grant). For Executive Plans adopted in 2001 and 2004, the market value is the average quoted price of an Ordinary Sharefor the three business days preceding the date of grant or the average quoted price of an ADS or Ordinary Share, for the threebusiness days preceding the date of grant or the quoted price on the date of grant if higher. For the Global Share Plan adopted in 2010the market value is the closing price of an Ordinary Share or ADS on the last trading day prior to the grant date. With the exception ofoptions granted under the 2001 US Plan and the Global Share Plan 2010, the vesting of options granted from 1997 are subject toachievement of a performance condition. Options granted under the 2001 US Plan and the Global Share Plan 2010 are not subject toany performance conditions. Prior to 2008, the 2001 US Plan options became cumulatively exercisable as to 10% after one year, 30%after two years, 60% after three years and the remaining balance after four years. With effect from 2008, options granted under the2001 US Plan became cumulatively exercisable as to 33.3% after one year, 66.7% after two years and the remaining balance after thethird year. The 2001 UK Unapproved Share Option Plan was open to certain employees outside the US and the US Plan is open tocertain employees in the US, Canada, Mexico and Puerto Rico. The Global Share Plan 2010 is open to employees globally. The 2004Plan is open to executive directors only.
2010 Annual Report 113

25(a). Share Based Payments – Share Options Plans – (continued)
The maximum term of options granted, under all plans, is 10 years from the date of grant. All share option plans except for the StockAppreciation Rights Plan (detailed on page 116) are settled in shares.
At 31 December 2010 25,753,000 (2009 – 23,383,000, 2008 – 21,681,000) options were outstanding under share option plans asfollows:
Number of sharesThousand
Range of optionexercise prices
Pence
Weighted averageexercise price
Pence
Employee Plans:Outstanding at 1 January 2008 3,678 296.0 – 600.5 397.9Granted 906 507.0 – 640.0 509.3Forfeited (359) 296.0 – 581.0 408.7Exercised (633) 296.0 – 526.0 368.2Expired (59) 296.0 – 498.0 379.9
Outstanding at 31 December 2008 3,533 321.0 – 640.0 427.4Granted 1,563 380.0 – 519.0 381.6Forfeited (680) 321.0 – 640.0 436.1Exercised (1,029) 321.0 – 507.0 362.7Expired (4) 321.0 – 600.5 427.9
Outstanding at 31 December 2009 3,383 348.0 – 640.0 422.7Granted 986 459.0 – 556.0 462.2Forfeited (364) 348.0 – 609.0 439.8Exercised (625) 348.0 – 576.5 435.2Expired (22) 348.0 – 640.0 431.7
Outstanding at 31 December 2010 3,358 348.0 – 640.0 430.1
Options exercisable at 31 December 2010 87 425.0 – 576.5 466.5Options exercisable at 31 December 2009 109 348.0 – 498.0 362.4Options exercisable at 31 December 2008 168 321.0 – 526.0 398.3
Executive Plans:Outstanding at 1 January 2008 17,350 145.0 – 637.7 525.0Granted 5,129 465.5 – 680.5 615.1Forfeited (1,073) 409.5 – 637.5 559.5Exercised (2,696) 265.0 – 637.5 584.1Expired (562) 145.0 – 637.7 575.3
Outstanding at 31 December 2008 18,148 183.5 – 680.5 592.5Granted 5,849 448.0 – 595.0 477.0Forfeited (1,348) 409.5 – 680.5 565.9Exercised (1,754) 183.5 – 637.8 428.3Expired (895) 185.8 – 574.5 492.8
Outstanding at 31 December 2009 20,000 265.0 – 637.5 547.1Granted 6,249 424.0 – 675.0 520.9Forfeited (977) 479.0 – 680.5 581.3Exercised (2,386) 265.0 – 637.5 479.2Expired (491) 418.0 – 637.8 575.6
Outstanding at 31 December 2010 22,395 409.5 – 680.5 544.9
Options exercisable at 31 December 2010 5,153 409.5 – 627.0 548.3Options exercisable at 31 December 2009 6,668 265.0 – 637.5 532.0Options exercisable at 31 December 2008 5,049 183.5 – 672.5 593.2
114 2010 Annual Report

Des
crip
tion
ofth
eG
roup
Busi
ness
Revi
ew,
Liqui
dity
and
Pros
pect
sCo
rpor
ate
Gov
erna
nce
Stat
emen
tD
irect
ors’
Rem
uner
atio
nRe
port
Gro
upA
ccou
nts
Com
pany
Acc
ount
sIn
vest
orIn
form
atio
n
25(a). Share Based Payments – Share Options Plans – (continued)
The weighted average remaining contractual life of options outstanding at 31 December 2010 was 6.1 (2009 – 5.9 years, 2008 – 5.8years) years for Executive Plans and 2.7 (2009 – 2.7 years, 2008 – 1.7 years) years for Employee Plans.
2010pence
2009pence
2008pence
Weighted average share price 619.3 504.0 579.5
Options granted during the year were as follows:
Options grantedThousand
Weightedaverage fair
value per optionat grant date
Pence
Weightedaverage shareprice at grant
date Pence
Weighted averageexercise price
Pence
Weightedaverage option
lifeYears
Employee Plans 986 170.2 566.0 462.2 3.9Executive Plans 6,249 173.7 553.2 528.1 9.8
The weighted average fair value of options granted under employee plans during 2009 was 212.0p (2008 – 192.0p) and those underexecutive plans during 2009 was 147.9p (2008 – 191.3p).
Options granted under the executive plans are valued using a binomial model. Options granted under employee plans are valued usingthe Black-Scholes option model as management consider that options granted under these plans are exercised within a short period oftime after the vesting date. Options granted under each plans are valued separately and a weighted average fair value calculated.
The binomial model is used for executive plans so that proper allowance is made for the possibility of early exercise. At the 2010 grantmanagement expected 90% of the options granted under the 2001 Executive Scheme to vest (2009 – 95%, 2008 – 95%) and 90% ofthe 2004 Executive Scheme to vest (2009 – 60%, 2008 – 60%). Each year an assessment is made of the current vesting estimates andthey are updated to reflect revised expectations of the number of grants that will vest.
For all plans the inputs to the option pricing models are reassessed for each grant. The following assumptions were used in calculatingthe fair value of options granted:
Employee plans Executive plans
2010 2009 2008 2010 2009 2008
Dividend yield (%) 1.5 1.5 1.0 1.5 1.5 1.0Expected volatility (%) (i) 30.0 30.0 25.0 30 30.0 25.0Risk free interest rate (%) (ii) 2.5 3.3 4.5 2.5 3.3 4.5Expected life in years (iii) 3.9 3.9 3.9 9.8 6.8 6.5
(i) Volatility is assessed on a historic basis primarily based on past share price movements over the expected life of the options.
(ii) The risk free interest rate reflects the yields available on zero coupon government bonds over the option term and currency.
(iii) An assessment of an Executive Plan’s option life is based on an exercise model. This is based on a mixture of historic experience andgenerally accepted behavioural traits. 5% (2009 – 5%, 2008 – 5%) of Executive Plan option holders are assumed to leave and exercise theiroptions (or forfeit them if under water) each year after vesting. In addition, 50% (2009 – 50%, 2008 – 50%) of Executive Plan option holdersare assumed to exercise by choice per annum providing the gain available is at least 50% for the 2004 Plan and 50% for the optionsgranted to executives and 25% for other recipients under the Global Share Plan 2010 (2009 – 50% for the 2004 Plan and 25% for the 2001Plans, 2008 – 50% for the 2004 Plan and 25% for the 2001 Plans).
2010 Annual Report 115

25(a). Share Based Payments – Share Options Plans – (continued)
Summarised information about options outstanding under the share option plans at 31 December 2010 is as follows:
Number outstandingThousand
Weighted averageremaining contract life
Years
Employee Plans:348.0p to 619.3p* 3,355 2.7619.3p* to 640.0p 3 1.3
3,358 2.7
Executive Plans:409.5p to 619.3p* 15,527 6.6619.3p* to 680.5p 6,868 4.8
22,395 6.1
* The split has been determined based on the weighted average share price of 619.3p.
As at 31 December 2010 nil (2009 – 77,669, 2008 – 85,135) options remain outstanding under the 1999 and 2000 Stock AppreciationRights Plan. The fair value liability related to these schemes was nil in both 2009 and 2008, this was materially the same as intrinsicvalue.
25(b). Share Based Payments – Long-Term Incentive Plans
In 2004, a share based incentive plan was introduced for executive directors, executive officers and the next level of senior executives,which replaced the Long-term Incentive Plan (LTIP). The plan includes a Performance Share Plan (“PSP”) and a Bonus Co-InvestmentPlan (“CIP”).
Vesting of the PSP award shares is dependent upon performance relative to the FTSE 100 and an index based on major internationalcompanies in the medical devices industry.
Under the CIP, participants could elect to use up to a maximum of one-half of their annual bonus to purchase shares. If the shares areheld for three years and the Group’s EPSA growth targets are achieved participants receive an award of matching shares for eachshare purchased.
From 2009, the CIP was replaced by the Deferred Bonus Plan. This plan is designed to encourage executives to build up and maintaina significant shareholding in the Company. Under the plan, up to one third of any bonus earned at target level or above by an eligibleemployee will be compulsorily deferred into shares which vest, subject to continued employment, in equal annual tranches over threeyears (i.e. one third each year). No further performance conditions will apply to the deferred shares.
From 2010, Performance Share awards are granted under the Global Share Plan 2010 for all executives other than Executive Directors.Awards granted under both plans are combined to provide the figures below. Vesting of the share awards is dependent uponperformance relative to the FTSE 100 and an index based on major international companies in the medical devices industry.
The fair values of awards granted under long term incentive plans are calculated using a binomial model. The exercise price for allawards granted under the long term incentive plans is nil. Performance Share awards under both the PSP and Global Share Plan 2010contain vesting conditions based on TSR versus a comparator group which represent market-based performance conditions forvaluation purposes and an assessment of vesting probability is therefore factored into the award date calculations. The assumptionsinclude the volatilities for the comparator groups. Given the wide range of companies within the FTSE 100 a correlation of 35% (2009 –30%, 2008 – 15%) has been assumed with the constituents of the group. A correlation of 35% (2009 – 30%, 2008 – 15%) has alsobeen assumed for the companies in the medical devices sector as they are impacted by similar factors. The Performance Target for theGlobal Share Plan 2010 is a combination of EPSA growth and the Group’s Total Shareholder Return (“TSR”) performance over the threeyear performance period.
The other assumptions used are consistent with the executive scheme assumptions disclosed in Note 25(a) of the Notes to the GroupAccounts.
116 2010 Annual Report

Des
crip
tion
ofth
eG
roup
Busi
ness
Revi
ew,
Liqui
dity
and
Pros
pect
sCo
rpor
ate
Gov
erna
nce
Stat
emen
tD
irect
ors’
Rem
uner
atio
nRe
port
Gro
upA
ccou
nts
Com
pany
Acc
ount
sIn
vest
orIn
form
atio
n
25(b). Share Based Payments – Long-Term Incentive Plans – (continued)
At 31 December 2010 the maximum number of shares that could be awarded under the Group’s long-term incentive plans were:
PSP CIP
DeferredBonus
Plan Total
Number of shares in thousands
Outstanding at 1 January 2008 3,323 760 - 4,083Awarded 1,588 384 - 1,972Vested (135) (89) - (224)Forfeited (959) (305) - (1,264)
Outstanding at 31 December 2008 3,817 750 - 4,567Awarded 2,372 - 305 2,677Vested (334) (99) (7) (440)Forfeited (975) (206) (6) (1,187)
Outstanding at 31 December 2009 4,880 445 292 5,617Awarded 2,386 - 338 2,724Vested (501) (116) (101) (718)Forfeited (753) (132) (7) (892)
Outstanding at 31 December 2010 6,012 197 522 6,731
The weighted average remaining contractual life of awards outstanding at 31 December 2010 was 1.8 years (2009 – 1.8 years, 2008 –1.5 years) for the PSP, 0.2 years (2009 – 0.7 years, 2008 – 1.3 years) for the CIP and 1.9 years (2009 – 2.2 years) for the DeferredBonus Plan.
25(c). Share Based Payments – Charge to Income Statement
The expense charged to the income statement for share based payments is as follows:
2010$ million
2009$ million
2008$ million
Granted in current year 5 2 4Granted in prior years 16 16 20
Total share based expense for the year 21 18 24
Under the Executive Plans, PSP and CIP the number of Ordinary Shares over which options and share awards may be granted is limitedso that the number of Ordinary Shares issued or that may be issued during the ten years preceding the date of grant shall not exceed5% of the Ordinary Share capital at the date of grant. The total number of Ordinary Shares which may be issuable in any ten-yearperiod under all share plans operated by the Company may not exceed 10% of the Ordinary Share capital at the date of grant.
26. Treasury Shares
Treasury shares represents the holding of the Company’s own shares in respect of the Smith & Nephew Employee’s Share Trust andshares bought back as part of the share buy-back programme, which was suspended in 2008.
The Smith & Nephew 2004 Employees’ Share Trust (“Trust”) was established to hold shares relating to the long-term incentive plansreferred to in the “Directors’ Remuneration Report”. The Trust is administered by an independent professional trust company resident inJersey and is funded by a loan from the Company. The cost of the Trust is charged to the income statement as it accrues. A partialdividend waiver is in place in respect of those shares held under the long-term incentive plans. The trust only accepts dividends inrespect of nil-cost options and deferred bonus plan shares. The waiver represents less than 1% of the total dividends paid.
2010 Annual Report 117

26. Treasury Shares – (continued)
The movements in Treasury shares and the Employees’ Share Trust are as follows:
Treasury$ million
Employees’Share Trust
$ millionTotal
$ million
At 1 January 2009 816 7 823Shares transferred from treasury (14) 14 -Shares transferred to group beneficiaries (9) (20) (29)
At 31 December 2009 793 1 794Shares purchased - 5 5Shares transferred from treasury (19) 19 -Shares transferred to group beneficiaries (5) (16) (21)
At 31 December 2010 769 9 778
No of Shares(million)
No of Shares(million)
No of Shares(million)
At 1 January 2009 66.6 0.5 67.1Shares transferred from treasury (1.1) 1.1 -Shares transferred to group beneficiaries (0.8) (1.5) (2.3)
At 31 December 2009 64.7 0.1 64.8Shares purchased - 0.6 0.6Shares transferred from treasury (1.6) 1.6 -Shares transferred to group beneficiaries (0.4) (1.5) (1.9)
At 31 December 2010 62.7 0.8 63.5
27. Cash Flow Statement
Analysis of Net Debt
Borrowings
Cash$ million
Overdrafts$ million
due withinone year$ million
due afterone year$ million
Net currencyswaps
$ millionTotal
$ million
At 1 January 2008 170 (61) (1,381) (36) (2) (1,310)Net cash flow (16) 34 49 (80) (5) (18)Other non-cash changes - - 1,248 (1,248) - -Facility fee (i) - - - 2 - 2Exchange adjustment (9) 4 (8) 4 3 (6)
At 31 December 2008 145 (23) (92) (1,358) (4) (1,332)Net cash flow 38 6 66 288 12 410Exchange adjustment 9 (1) (1) (20) (8) (21)
At 31 December 2009 192 (18) (27) (1,090) - (943)Net cash flow 9 6 (17) 437 3 438Exchange adjustment 6 - (1) 11 (3) 13
At 31 December 2010 207 (12) (45) (642) - (492)
(i) During 2008, $2m of the facility fee prepayment was reclassified as borrowings following the term-out of the loan.
118 2010 Annual Report

Des
crip
tion
ofth
eG
roup
Busi
ness
Revi
ew,
Liqui
dity
and
Pros
pect
sCo
rpor
ate
Gov
erna
nce
Stat
emen
tD
irect
ors’
Rem
uner
atio
nRe
port
Gro
upA
ccou
nts
Com
pany
Acc
ount
sIn
vest
orIn
form
atio
n
27. Cash Flow Statement – (continued)
Reconciliation of Net Cash Flow to Movement in Net Debt
2010$ million
2009$ million
2008$ million
Change in cash net of overdrafts in the year 15 44 18Settlement of currency swaps 3 12 (5)Net change in borrowings 420 354 (31)
Change in net debt from net cash flow 438 410 (18)Facility fee paid - - 2Exchange adjustment 13 (21) (6)
Change in net debt in the year 451 389 (22)Opening net debt (943) (1,332) (1,310)
Closing net debt (492) (943) (1,332)
Cash and Cash EquivalentsFor the purposes of the Group Cash Flow Statement cash and cash equivalents at 31 December comprise cash at bank and in handnet of bank overdrafts.
2010$ million
2009$ million
2008$ million
Cash at bank and in hand 207 192 145Bank overdrafts (12) (18) (23)
Cash and cash equivalents 195 174 122
28. Currency Translation
The exchange rates used for the translation of currencies into US Dollars that have the most significant impact on the Group resultswere:
Average rates2010 2009 2008
Sterling 1.54 1.56 1.84Euro 1.32 1.39 1.46Swiss Franc 0.96 0.92 0.92
Year-end rates2010 2009 2008
Sterling 1.57 1.61 1.44Euro 1.34 1.43 1.39Swiss Franc 1.07 0.97 0.94
29. Acquisitions
Year ended 31 December 2010In the year ended 31 December 2010 there were no acquisitions.
Year ended 31 December 2009
Plus Orthopedics Holdings AGIn January 2009, the Group reached an agreement with the vendors of Plus to reduce the total original purchase price by CHF159m. Aspart of the agreement the Group dropped all its claims and released the vendors from substantially all of the remaining warrantiesunder the original purchase agreement as well as resolving the contractual price adjustments.
2010 Annual Report 119

29. Acquisitions – (continued)
Nucryst Pharmaceuticals, Corp.On 22 December 2009, the Group acquired substantially all of the assets and liabilities of Nucryst Pharmaceuticals, Corp, whichmanufactures and licences exclusively to the Group our range of ACTICOAT products, using its nanocrystalline silver technology,SILCRYST.
Under the agreement the Group acquired the manufacturing assets from Nucryst’s operations in Canada and intellectual property rightsrelating to the nanocrystalline silver technology used in the manufacture of ACTICOAT product range. Nucryst has manufacturedACTICOAT products for Smith & Nephew since the Group’s acquisition of the product right in 2001.
Pre-acquisitioncarrying amounts
$ million
Fair valueadjustments
$ million
Fair value to Groupreported in 2009
$ million
Property, plant and equipment 10 (4) 6Intangible assets – acquisition intangibles - 12 12Inventories 4 - 4Trade and other payables (1) - (1)Deferred taxation - 1 1
Net assets 13 9 22Goodwill on acquisition 3
Cost of acquisition 25
Discharged by:Cash 25
Management believes that goodwill represents the value of the workforce and synergies that are expected to arise from the combinedgroup.
As the Group was the only material customer of Nucryst Pharmaceuticals, Corp., no contribution to revenue was achieved in 2009. Thepost-acquisition contribution to attributable profit for 2009 was immaterial.
Year ended 31 December 2008The aggregate impact of acquisitions that occurred during 2008 is set out below. The acquisitions primarily relate to minority interestand distributor buyouts, as a result of the Plus acquisition concluded in 2007. There is no material difference between the fair valueand book value of the net assets acquired.
$ millionDeferred taxation 1Intangible assets 1
Assets acquired 2Goodwill (i) (2)
Cost of acquisition -
Discharged byCash 2Deferred consideration (i) (2)
-
(i) Relating to the reversal of goodwill allocated previously on the basis of contingent consideration.
In 2008, deferred consideration of $14m in respect of the previous years’ acquisitions was paid.
120 2010 Annual Report

Des
crip
tion
ofth
eG
roup
Busi
ness
Revi
ew,
Liqui
dity
and
Pros
pect
sCo
rpor
ate
Gov
erna
nce
Stat
emen
tD
irect
ors’
Rem
uner
atio
nRe
port
Gro
upA
ccou
nts
Com
pany
Acc
ount
sIn
vest
orIn
form
atio
n
30. Assets held for sale
The Group has classified following assets as held for sale:
2010$ million
2009$ million
Property, plant and equipment - 8Inventory - 6
- 14
In 2009, the Group closed the Largo manufacturing site. The property, plant and equipment was disposed of in 2010. The property wasvalued at the net realisable value less any costs to sell.
The Group had committed to the disposal of its pain management business at 31 December 2009, which occurred during 2010. Therelated goodwill and intangible assets were impaired by $19m to their estimated net realisable value. As part of this disposal, inventoryto the value of $6m was held for sale.
31. Financial Commitments
Group capital expenditure relating to property, plant and equipment contracted but not provided for amounted to $15m (2009 – $7m).
The Group is contractually committed to four milestone payments, which total $60m (2009 – $60m), related to the US approval andcommercialisation of DUROLANE which may become payable under the terms of the agreement with Q-MED AB signed in June 2006.
Future minimum lease payments under non-cancellable operating leases fall due as follows:
2010$ million
2009$ million
Land and buildings:Within one year 30 28After one and within two years 25 20After two and within three years 19 17After three and within four years 18 12After four and within five years 14 11After five years 21 17
127 105
Other assets:Within one year 23 25After one and within two years 10 18After two and within three years 5 6After three and within four years 1 2
39 51
Future minimum lease payments under finance leases together with the present value of the minimum lease payments are as follows:
2010$ million
2009$ million
Within one year 5 5After one and within two years 4 5After two and within three years 3 4After three and within four years 3 3After four and within five years 3 3After five years 12 15
Total minimum lease payments 30 35Discounted by imputed interest (8) (9)
Present value of minimum lease payments 22 26
Present value of minimum lease payments can be split out as: $4m (2009 – $3m) due within one year, $8m (2009 – $11m) duebetween one to five years and $10m (2009 – $12m) due after five years.
2010 Annual Report 121

32. Contingencies
The Company and its subsidiaries are parties to various legal proceedings, some of which include claims for substantial damages. Theoutcome of these proceedings cannot readily be foreseen, but with the possible exception of those detailed below, managementbelieves none of them will result in a material adverse effect on the financial position of the Group. The Group provides for outcomesthat are deemed to be probable and can be reliably estimated. There is no assurance that losses will not exceed provisions or will nothave a significant impact on the Group’s results of operations in the period in which they are realised.
In August 2003, the Group withdrew voluntarily from all markets the macrotextured versions of its OXINIUM femoral knee components.A number of related claims have been filed, most of which have been settled. The aggregate cost to date related to this matter isapproximately $212m. The Group has sought recovery from its insurers.
To date the primary insurance carrier has paid $60m in full settlement of its policy liability. An additional $22m was received from asuccessful legal settlement. At 31 December 2010, at least $133m remains due, and the Group has sought coverage from five excessinsurance carriers. However, these excess carriers have denied coverage, citing defences relating to the wording of the insurancepolicies and other matters. In December 2004, the Group brought suit against them in the US District Court for the Western District ofTennessee, and trial is expected to commence in 2012.
A charge of $154m was recorded in 2004 for anticipated expenses in connection with macrotexture claims. Most of that amount hassince been applied to settlements of such claims. Management believes that the $20m provision remaining is adequate to coverremaining claims. Given the uncertainty inherent in such matters, however, there can be no assurance on this point.
In September 2007, the US Securities and Exchange Commission (“SEC”) notified the Group that it was conducting an informalinvestigation of companies in the medical devices industry, including the Group, regarding possible violations of the Foreign CorruptPractices Act (“FCPA”) in connection with the sale of products in certain foreign countries. The US Department of Justice subsequentlyjoined the SEC’s request. The Group is cooperating fully with the US Department of Justice and the SEC regarding these matters, hasconducted a broader review on its own initiative, and has disclosed to them information indicating that at least one independentdistributor of the Group’s products may have made payments that could have FCPA implications. The Group is engaged in discussionsto resolve these matters, which might include a settlement by which the Group would pay certain amounts, and submit to compliancereporting and oversight obligations. There is no assurance that a settlement will be reached, however.
The Group is engaged, as both plaintiff and defendant, in litigation with various competitors and others over claims of patentinfringement and, in some cases, breach of licence agreement. These disputes are being heard in courts in the United States and otherjurisdictions and also before agencies that examine patents. Outcomes are rarely certain and costs are often significant.
33. Retirement Benefit Obligations
The Group’s retirement benefit obligations comprise:
2010$ million
2009$ million
Funded Plans:UK Plan 59 134US Plan 110 109Other Plans (i) 36 28
205 271Unfunded Plans:Other Plans (i) 22 22Retirement Healthcare 35 29
262 322
(i) The analysis in this note for “Other Plans” combines both the funded and unfunded retirement benefit obligations.
The Group sponsors pension plans for its employees in most of the countries in which it has major operating companies. Pension plansare established under the laws of the relevant country. Funded plans are funded by the payment of contributions to, and the assetsheld by, separate trust funds or insurance companies. In those countries where there is no company-sponsored pension plan, statebenefits are considered adequate. Employees’ retirement benefits are the subject of regular management review. The Group’s majordefined benefit pension plans in the UK and US were closed to new employees in 2003 and replaced by defined contribution plans.
Defined benefit plans provide employees with an entitlement to retirement benefits varying between 1.3% and 66.7% of final salary onattainment of retirement age. The level of entitlement is dependent on the years of service of the employee.
122 2010 Annual Report

Des
crip
tion
ofth
eG
roup
Busi
ness
Revi
ew,
Liqui
dity
and
Pros
pect
sCo
rpor
ate
Gov
erna
nce
Stat
emen
tD
irect
ors’
Rem
uner
atio
nRe
port
Gro
upA
ccou
nts
Com
pany
Acc
ount
sIn
vest
orIn
form
atio
n
33. Retirement Benefit Obligations – (continued)
In July 2010, the UK Government announced that it would, in future, link the statutory minimum pension indexation to the ConsumerPrices Index (CPI) rather than the Retail Prices Index (RPI). In December 2010, the Government issued statutory orders for theindexation of benefits in 2011 based on CPI. The Group has assessed that this change will reduce the UK pension liabilities. To reflectthis, in 2010 the Group has recognised an actuarial gain of $13m outside profit and loss through Other Comprehensive Income.
The present value of the defined benefit obligation and the related current service cost are measured using the projected unit method.Under the projected unit method, the current service cost will increase as the members of the defined benefit plans approachretirement. The principal actuarial assumptions used by the independent qualified actuaries in valuing the major plans in the UnitedKingdom (“UK Plan”), the United States (“US Plan”) and all other plans (“Other Plans”) and a breakdown of the pension costs charged toincome are as follows:
Principal actuarial assumptions:
2010 2009 2008% per annum
UK Plan:Discount rate 5.5 5.7 6.1Expected return on plan assets (i) 5.9 6.4 6.5Expected rate of salary increases 5.5 5.6 5.2Future pension increases 3.5 3.6 3.2Inflation 3.5 3.6 3.2Life expectancy of male aged 60 (in years) 28.2 28.1 28.6Life expectancy of male aged 60 in 20 years time (in years) 31.5 31.3 31.9
US Plan:Discount rate 5.6 6.0 5.9Expected return on plan assets (i) 7.5 7.5 8.2Expected rate of salary increases 4.7 4.7 5.0Future pension increases - - -Inflation 2.7 2.7 2.7Life expectancy of male aged 60 (in years) 22.8 23.0 23.0Life expectancy of male aged 60 in 20 years time (in years) 24.7 25.8 25.8
Other Plans:Discount rate (ii) 4.2 4.6 3.5Expected return on plan assets (i) (ii) 5.1 5.0 5.2Expected rate of salary increases (ii) 3.0 3.3 2.2Future pension increases (ii) 2.3 1.9 0.8Inflation (ii) 2.1 1.0 1.0
(i) The assumption for the expected return on plan assets has been determined using a combination of past experience and marketexpectations.
(ii) Other Plans’ actuarial assumptions are presented on a weighted average basis and include all funded and unfunded plans.
Pension costs (including retirement healthcare):
2010 2009 2008$ million $ million $ million
Current service cost – employer’s portion 26 26 29Other finance cost 64 61 66Expected return on assets in the plan (55) (48) (66)
Net defined benefit pension costs 35 39 29Net defined contribution pension costs 25 25 24
Total pension costs charged to profit before taxation 60 64 53
2010 Annual Report 123

33. Retirement Benefit Obligations – (continued)
Actuarial gains/(losses) recognised in Group Statement of Comprehensive Income:
2010 2009 2008$ million $ million $ million
Experience gains/(losses) in pension scheme assets 34 71 (236)Experience gains on scheme liabilities 21 17 1(Losses)/gains due to changes in assumptions underlying scheme liabilities (29) (47) 20
26 41 (215)
Of the $60m (2009 – $64m, 2008 – $53m) net cost for the year, $51m (2009 – $51m, 2008 – $53m) was charged to operating profit.The interest cost and expected return on plan assets are reported as other finance costs. The actuarial gains of $26m (2009 – gain of$41m, 2008 – loss of $215m) were reported in the statement of other comprehensive income making the cumulative charge to date$228m (2009 – $254m, 2008 – $295m).
The contributions made in the year in respect of defined benefit plans were: UK Plan $37m (2009 – $19m, 2008 – $23m); US Plan$20m (2009 – $14m, 2008 – $11m); and Other Plans $8m (2009 – $8m, 2008 – $9m). The agreed contributions for 2011 in respect ofthe Group’s defined benefit plans are: $38m for the UK Plan (including $29m of supplementary payments), $30m for the US Plan and$7m for other defined benefit plans.
The total cost charged to income in respect of the Group’s defined contribution plans represents contributions payable to these plansby the Group at rates specified in the rules of the plans. As at 31 December 2010 there were nil outstanding payments due to be paidover to the plans (2009 – nil, 2008 – nil).
The amount included in the balance sheet arising from the Group’s obligations in respect of its defined benefit retirement plans and theexpected rates of return on investments were:
UK Plan US Plan Other Plans
Rateof Return Value
Rateof Return Value
Rateof Return Value
% $ million % $ million % $ million
31 December 2010Equities 7.4 324 8.4 192 8.3 33Bonds 4.0 262 4.2 70 4.5 33Property - - - - 5.8 5Other 4.1 9 2.8 10 4.1 29
Market value of assets 595 272 100Present value of defined benefit
obligations (654) (382) (158)
Deficit: non-current liability recognisedin the balance sheet (59) (110) (58)
31 December 2009Equities 7.7 310 8.7 161 7.1 29Bonds 4.7 203 4.2 68 4.1 34Property 6.2 16 - - 5.0 5Other 4.1 5 3.3 5 5.3 19
Market value of assets 534 234 87Present value of defined benefit
obligations (668) (343) (137)
Deficit: non-current liability recognisedin the balance sheet (134) (109) (50)
124 2010 Annual Report

Des
crip
tion
ofth
eG
roup
Busi
ness
Revi
ew,
Liqui
dity
and
Pros
pect
sCo
rpor
ate
Gov
erna
nce
Stat
emen
tD
irect
ors’
Rem
uner
atio
nRe
port
Gro
upA
ccou
nts
Com
pany
Acc
ount
sIn
vest
orIn
form
atio
n
33. Retirement Benefit Obligations – (continued)
The following tables set out the pension plan asset allocations in the funded UK, US and Other Plans as at 31 December for the last twoyears:
UK Plan US Plan Other Plans% 2010 2009 2010 2009 2010 2009
Asset Category:Equity securities 55 58 71 69 33 33Debt securities 44 38 26 29 33 39Property - 3 - - 5 6Other 1 1 3 2 29 22
Total 100 100 100 100 100 100
A reconciliation of the present value of defined benefit obligations is shown in the following tables:
UK Plan US PlanOtherPlans
RetirementHealthcare Total
$ million $ million $ million $ million $ million
Present value of defined benefit obligations at1 January 2009 516 337 141 28 1,022
Current service cost 8 9 9 - 26Settlements to members - - (3) - (3)Other finance cost 34 20 6 1 61Experience gains on plan liabilities (10) - (7) - (17)Losses/(gains) on change of assumptions 73 (14) (11) (1) 47Plan participant contributions 2 - 3 - 5Benefits paid (22) (9) (11) (1) (43)Exchange adjustment 67 - 10 2 79
Present value of defined benefit obligations at31 December 2009 668 343 137 29 1,177
Current service cost 9 8 9 - 26Settlements to members - - (2) - (2)Other finance cost 36 20 6 2 64Experience (gains)/losses on plan liabilities (21) 2 (2) - (21)Losses on change of assumptions 1 19 4 5 29Plan participant contributions 2 - 6 - 8Benefits paid (21) (10) (5) (1) (37)Exchange adjustment (20) - 5 - (15)
Present value of defined benefit obligations at31 December 2010 654 382 158 35 1,229
2010 Annual Report 125

33. Retirement Benefit Obligations – (continued)
A reconciliation of the fair value of plan assets is shown in the following tables:
UK Plan US PlanOtherPlans
RetirementHealthcare Total
$ million $ million $ million $ million $ million
Fair value of plan assets at 1 January 2009 416 180 76 - 672Expected return on plan assets 29 15 4 - 48Settlements to members - - (3) - (3)Experience gains on plan assets 36 34 1 - 71Plan participant contributions 2 - 3 - 5Company contributions 19 14 8 - 41Benefits paid (22) (9) (11) - (42)Exchange adjustment 54 - 9 - 63
Fair value of plan assets at 31 December 2009 534 234 87 - 855Expected return on plan assets 33 17 5 - 55Settlements to members - - (2) - (2)Experience gains/(losses) on plan assets 26 11 (3) - 34Plan participant contributions 2 - 6 - 8Company contributions 37 20 8 - 65Benefits paid (21) (10) (5) - (36)Exchange adjustment (16) - 4 - (12)
Fair value of plan assets at 31 December 2010 595 272 100 - 967
The history of experience adjustments is as follows:
Presentvalue ofDefinedbenefit
obligations
Fair valueof planassets
Deficitin plan
Experience (losses)/gains on plan liabilities
Experience gains/(losses)on plan assets
Amount –gain/(loss)
Percentageof plan
liabilitiesAmount –
gain/(loss)
Percentageof planassets
$ million $ million $ million $ million % $ million %
At 31 December 2010:UK Plan (654) 595 (59) 21 3 26 4US Plan (382) 272 (110) (2) - 11 4Other Plans (158) 100 (58) 2 1 (3) 3At 31 December 2009:UK Plan (668) 534 (134) 10 2 36 7US Plan (343) 234 (109) - - 34 15Other Plans (137) 87 (50) 7 5 1 1At 31 December 2008:UK Plan (516) 416 (100) 1 - (126) 30US Plan (337) 180 (157) (5) 1 (100) 56Other Plans (141) 76 (65) 5 4 (10) 13At 31 December 2007:UK Plan (753) 673 (80) - - 8 1US Plan (283) 256 (27) 1 - (5) 2Other Plans (145) 98 (47) (1) 1 12 12At 31 December 2006:UK Plan (661) 617 (44) 15 2 20 3US Plan (295) 238 (57) 3 1 14 6Other Plans (60) 36 (24) 1 2 1 3
The Group recharges the UK pension plan with the costs of administration and independent advisers. The amount recharged in theyear was $2m (2009 – $2m, 2008 – $3m). The amount receivable at 31 December 2010 was $nil (2009 – $nil, 2008 – $nil).
126 2010 Annual Report

Des
crip
tion
ofth
eG
roup
Busi
ness
Revi
ew,
Liqui
dity
and
Pros
pect
sCo
rpor
ate
Gov
erna
nce
Stat
emen
tD
irect
ors’
Rem
uner
atio
nRe
port
Gro
upA
ccou
nts
Com
pany
Acc
ount
sIn
vest
orIn
form
atio
n
33. Retirement Benefit Obligations – (continued)
Retirement HealthcareThe cost of providing healthcare benefits after retirement is determined by independent actuaries. The principal actuarial assumptionsin determining the cost of providing healthcare benefits are those in the UK and the US and are as follows:
2010 2009 2008% per annum UK US UK US UK US
Discount rate 5.5 5.6 5.7 6.0 6.1 5.9Medical cost inflation 7.0 8.0 7.0 8.0 6.5 8.7
A one percentage point change in the rate of medical cost inflation would not affect the accumulated retirement benefit obligations, orthe aggregate of the current service and interest costs, of the UK or US plans in 2010 by more than $2m (2009 – more than $2m,2008 – more than $1m).
For the US the retirement healthcare cost trend for 2011 is expected to be 2.4% above the discount rate. Thereafter the healthcare costtrend rate is assumed to decrease by 0.5% per year to an ultimate rate of 5.0%. For the UK it will remain flat at 7%.
34. Related Party Transactions
Trading TransactionsIn the course of normal operations, the Group traded with its associates detailed in Note 15 of the Notes to the Group Accounts. Theaggregated transactions, which have not been disclosed elsewhere in the financial statements, are summarised below:
2010 2009 2008$ million $ million $ million
Sales to the associates 8 7 4Purchases from the associates 4 4 4
All sale and purchase transactions occur on an arm’s length basis.
Key Management PersonnelThe remuneration of executive officers (including non-executive directors) during the year is summarised below:
2010 2009 2008$ million $ million $ million
Short-term employee benefits 13 14 12Share-based payment 3 6 9Pension and post employment benefit entitlements 1 1 1Termination benefits - - 1
17 21 23
35. Information About the Nature and Cost of Services Provided by Auditors
2010 2009 2008$ million $ million $ million
Audit services: Group accounts 1 1 1Other services:
Local statutory audit pursuant to legislation 2 2 3Other services pursuant to legislation - - 1
Taxation services:Compliance services 1 1 1Advisory services 1 1 2
Corporate finance transactions - - 1
Total auditors’ remuneration 5 5 9
Arising:In the UK 2 2 5Outside the UK 3 3 4
5 5 9
2010 Annual Report 127

36. Principal Subsidiary Undertakings
The information provided below is given for principal trading and manufacturing subsidiary undertakings, all of which are 100% owned,in accordance with Section 410 of the Companies Act 2006. A full list will be appended to Smith & Nephew’s next annual return toCompanies House:
Company Name ActivityCountry of operation andincorporation
United Kingdom:Smith & Nephew Healthcare Limited Medical Devices England & WalesSmith & Nephew Medical Limited Medical Devices England & WalesT. J. Smith & Nephew, Limited Medical Devices England & Wales
Continental Europe:Smith & Nephew GmbH Medical Devices AustriaSmith & Nephew SA-NV Medical Devices BelgiumSmith & Nephew A/S Medical Devices DenmarkSmith & Nephew OY Medical Devices FinlandSmith & Nephew SAS Medical Devices FranceSmith & Nephew Orthopedics GmbH Medical Devices GermanySmith & Nephew Orthopedics Hellas SA Medical Devices GreeceSmith & Nephew Limited Medical Devices IrelandSmith & Nephew Srl Medical Devices ItalySmith & Nephew Nederland CV Medical Devices NetherlandsSmith & Nephew A/S Medical Devices NorwaySmith & Nephew Sp Zoo Medical Devices PolandSmith & Nephew Lda Medical Devices PortugalSmith & Nephew SA Medical Devices SpainSmith & Nephew AB Medical Devices SwedenSmith & Nephew Orthopaedics AG Medical Devices Switzerland
USA:Smith & Nephew Inc. Medical Devices United States
Africa, Asia, Australasia and Other America:Smith & Nephew Pty Limited Medical Devices AustraliaSmith & Nephew Inc. Medical Devices CanadaSmith & Nephew Medical (Shanghai) Co Limited Medical Devices ChinaSmith & Nephew Limited Medical Devices Hong KongSmith & Nephew Healthcare Private Limited Medical Devices IndiaSmith & Nephew KK Medical Devices JapanSmith & Nephew Limited Medical Devices KoreaSmith & Nephew Healthcare Sdn Berhad Medical Devices MalaysiaSmith & Nephew SA de CV Medical Devices MexicoSmith & Nephew Limited Medical Devices New ZealandSmith & Nephew Inc. Medical Devices Puerto RicoSmith & Nephew Pte Limited Medical Devices SingaporeSmith & Nephew (Pty) Limited Medical Devices South AfricaSmith & Nephew Limited Medical Devices ThailandSmith & Nephew FZE Medical Devices United Arab Emirates
128 2010 Annual Report

Des
crip
tion
ofth
eG
roup
Busi
ness
Revi
ew,
Liqui
dity
and
Pros
pect
sCo
rpor
ate
Gov
erna
nce
Stat
emen
tD
irect
ors’
Rem
uner
atio
nRe
port
Gro
upA
ccou
nts
Com
pany
Acc
ount
sIn
vest
orIn
form
atio
n
COMPANY AUDITOR’S REPORTIndependent Auditor’s Report to the Members of Smith & Nephew plc
We have audited the parent company accounts of Smith & Nephew plc for the year ended 31 December 2010 which comprise the Parentcompany balance sheet and the related notes A to G. The financial reporting framework that has been applied in their preparation isapplicable law and United Kingdom Accounting Standards (United Kingdom Generally Accepted Accounting Practice).
This report is made solely to the company’s members, as a body, in accordance with Chapter 3 of Part 16 of the Companies Act 2006. Ouraudit work has been undertaken so that we might state to the company’s members those matters we are required to state to them in anauditor’s report and for no other purpose. To the fullest extent permitted by law, we do not accept or assume responsibility to anyone otherthan the company and the company’s members as a body, for our audit work, for this report, or for the opinions we have formed.
Respective responsibilities of directors and auditor
As explained more fully in the Directors’ Responsibility Statement set out on page 75, the directors are responsible for the preparation of theparent company accounts and for being satisfied that they give a true and fair view. Our responsibility is to audit and express an opinion onthe parent company accounts in accordance with applicable law and International Standards on Auditing (UK and Ireland). Those standardsrequire us to comply with the Auditing Practices Board’s (APB’s) Ethical Standards for Auditors.
Scope of the audit of the accounts
An audit involves obtaining evidence about the amounts and disclosures in the accounts sufficient to give reasonable assurance that theaccounts are free from material misstatement, whether caused by fraud or error. This includes an assessment of: whether the accountingpolicies are appropriate to the parent company’s circumstances and have been consistently applied and adequately disclosed; thereasonableness of significant accounting estimates made by the directors; and the overall presentation of the accounts.
Opinion on accounts
In our opinion the parent company accounts:
• give a true and fair view of the state of the company’s affairs as at 31 December 2010;
• have been properly prepared in accordance with United Kingdom Generally Accepted Accounting Practice; and
• have been prepared in accordance with the requirements of the Companies Act 2006.
Opinion on other matters prescribed by the Companies Act 2006
In our opinion:
• the part of the Directors’ Remuneration Report to be audited has been properly prepared in accordance with the Companies Act 2006;and
• the information given in the Directors’ Report for the financial year for which the accounts are prepared is consistent with the parentcompany accounts.
Matters on which we are required to report by exception
We have nothing to report in respect of the following matters where the Companies Act 2006 requires us to report to you if, in our opinion:
• adequate accounting records have not been kept by the parent company, or returns adequate for our audit have not been received frombranches not visited by us; or
• the parent company accounts and the part of the Directors’ Remuneration Report to be audited are not in agreement with the accountingrecords and returns; or
• certain disclosures of directors’ remuneration specified by law are not made; or
• we have not received all the information and explanations we require for our audit.
2010 Annual Report 129

Other matter
We have reported separately on the group accounts of Smith & Nephew plc for the year ended 31 December 2010.
Les Clifford (Senior statutory auditor)for and on behalf of Ernst & Young LLP Statutory AuditorLondon24 February 2011
130 2010 Annual Report

Des
crip
tion
ofth
eG
roup
Busi
ness
Revi
ew,
Liqui
dity
and
Pros
pect
sCo
rpor
ate
Gov
erna
nce
Stat
emen
tD
irect
ors’
Rem
uner
atio
nRe
port
Gro
upA
ccou
nts
Com
pany
Acc
ount
sIn
vest
orIn
form
atio
n
COMPANY BALANCE SHEETNotes At 31 December
2010$million
2009$million
Fixed assets:Investments B 3,598 3,598
Current assets:Debtors C 2,523 2,337Cash and bank D 21 3
2,544 2,340Creditors: amounts falling due within one year:Borrowings D (1) (8)Other creditors E (1,675) (1,086)
(1,676) (1,094)Net current assets 868 1,246
Total assets less current liabilities 4,466 4,844
Creditors: amounts falling due after one year:Borrowings D (623) (1,065)
Total assets less total liabilities 3,843 3,779
Capital and reservesEquity shareholders’ funds:Called up equity share capital F 191 190Share premium account F 396 382Capital reserve F 2,266 2,266Treasury shares F (778) (794)Exchange reserve F (52) (52)Profit and loss account F 1,820 1,787
Shareholders’ funds 3,843 3,779
The accounts were approved by the Board and authorised for issue on 24 February 2011 and signed on its behalf by: John BuchananChairman David J. Illingworth Chief Executive Adrian Hennah Chief Financial Officer
2010 Annual Report 131

NOTES TO THE COMPANY ACCOUNTSA. Accounting Policies
The separate accounts of the Company are presented as required by the Companies Act 2006. The accounts have been prepared underthe historical cost convention, modified to include revaluation to fair value of certain financial instruments as described below, and inaccordance with applicable UK accounting standards. As consolidated financial information has been disclosed under IFRS 7, FinancialInstruments: Disclosures, the Company is exempt from FRS 29, Financial Instruments: Disclosures. The Group accounts have been preparedin accordance with International Financial Reporting Standards as adopted by the European Union and are presented on pages 80 to 128.
The Company has taken advantage of the exemption in FRS 8, Related Party Disclosures not to present its related party disclosures as theGroup accounts contain these disclosures. In addition, the Company has taken advantage of the exemption in FRS 1, Cash Flow Statementsnot to present its own cash flow statement as the Group accounts contain a consolidated cash flow.
In applying these policies management is required to make estimates and assumptions that affect the reported amounts of assets andliabilities and disclosure of contingent assets and liabilities at the date of the accounts and the reported amounts of revenues and expensesduring the reporting period. Although these estimates are based on management’s best knowledge of current events and actions, actualresults ultimately may differ from those estimates.
Foreign CurrenciesTransactions in foreign currencies are initially recorded at the exchange rate ruling at the date of the transaction. Monetary assets andliabilities denominated in foreign currencies are retranslated at the rate of exchange ruling at the balance sheet date. All exchangedifferences are dealt with in arriving at profit before taxation.
InvestmentsInvestments in subsidiaries are stated at cost less provision for impairment.
Financial InstrumentsCurrency swaps are used to match foreign currency net assets with foreign currency liabilities. They are initially recorded at fair value andthen for reporting purposes remeasured to fair value at exchange rates and interest rates at subsequent balance sheet dates.
Changes in the fair value of derivative financial instruments are recognised in the profit and loss account as they arise.
Deferred TaxationDeferred taxation is recognised in respect of all timing differences that have originated but not reversed at the balance sheet date wheretransactions or events have occurred at that date that will result in an obligation to pay more, or a right to pay less or to receive more, tax.
Deferred tax is measured on an undiscounted basis at the tax rates that are expected to apply in the periods in which timing differences areexpected to reverse. These are based on tax rates and laws substantively enacted at the balance sheet date.
Share Based PaymentsThe Company operates a number of equity-settled executive and employee share plans. For all grants of share options and awards, the fairvalue as at the date of grant is calculated using an appropriate option pricing model and the corresponding expense is recognised over thevesting period. Subsidiary companies are recharged for the fair value of share options that relate to their employees.
The disclosure relating to the Company is detailed in Note 25 of the Notes to the Group accounts.
132 2010 Annual Report

Des
crip
tion
ofth
eG
roup
Busi
ness
Revi
ew,
Liqui
dity
and
Pros
pect
sCo
rpor
ate
Gov
erna
nce
Stat
emen
tD
irect
ors’
Rem
uner
atio
nRe
port
Gro
upA
ccou
nts
Com
pany
Acc
ount
sIn
vest
orIn
form
atio
n
B. Investments
$ million
At 1 January 2010 and 31 December 2010 3,598
Investments represent holdings in subsidiary undertakings.
The information provided below is given for the principal direct subsidiary undertakings, all of which are 100% owned and, in accordancewith Section 410 of the Companies Act 2006, a full list will be appended to Smith & Nephew’s next annual return to Companies House.
Company Name ActivityCountry of operation andincorporation
Smith & Nephew UK Limited Holding Company England & WalesSmith & Nephew (Overseas) Limited Holding Company England & Wales
Refer to Note 36 of the Notes to the Group accounts for the principal trading and manufacturing subsidiary undertakings of the Group.
C. Debtors
2010$ million
2009$ million
Amounts falling due within one year:Amounts owed by subsidiary undertakings 2,514 2,335Prepayments and accrued income 6 2Current asset derivatives – forward foreign exchange contracts 3 -
2,523 2,337
D. Cash and Borrowings
2010$ million
2009$ million
Bank loans and overdrafts due within one year or on demand 1 8Bank loans due after one year 623 1,065
Borrowings 624 1,073Cash and bank (21) (3)
Net debt 603 1,070
All currency swaps are stated at fair value. Gross US Dollar equivalents of $61m (2009 – $95m) receivable and $61m (2009 – $95m)payable have been netted. Currency swaps comprise foreign exchange swaps and were used in 2010 and 2009 to hedge Intragroup loans.
E. Other Creditors
2010$ million
2009$ million
Amounts falling due within one year:Amounts owed to subsidiary undertakings 1,646 1,067Other creditors 14 5Current taxation 12 8Current liability derivatives – interest rate swaps - 6Current liability derivatives – forward foreign exchange contracts 3 -
1,675 1,086
2010 Annual Report 133

F. Equity and Reserves
2010 2009
ShareCapital
SharePremium
Capitalreserves
TreasuryShares
Exchangereserves
Profit andloss
account
Total share-holders’
funds
Totalshare-
holders’funds
$ million $ million $ million $ million $ million $ million $ million $ million
At 1 January 190 382 2,266 (794) (52) 1,787 3,779 3,751Attributable profit for the year - - - - - 157 157 113Equity dividends paid in the year - - - - - (132) (132) (120)Share-based payments recognised - - - - - 21 21 18Cost of shares transferred to
beneficiaries - - - 21 - (13) 8 10New shares issued on exercise of
share options 1 14 - - - - 15 7Treasury shares purchased - - - (5) - - (5) -
At 31 December 191 396 2,266 (778) (52) 1,820 3,843 3,779
Further information on the share capital of the Company can be found in Note 24 of the Notes to the Group Accounts.
The total distributable reserves of the Company are $990m (2009 – $941m). In accordance with the exemption permitted by Section 408 ofthe Companies Act 2006, the Company has not presented its own profit and loss account. The attributable profit for the year dealt with inthe accounts of the Company is $157m (2009 – $113m).
Fees paid to Ernst & Young LLP for audit and non-audit services to the Company itself are not disclosed in the individual accounts becausegroup financial statements are prepared which are required to disclose such fees on a consolidated basis. The fees for the consolidatedGroup are disclosed in Note 35 of the Notes to the Group Accounts.
G. Contingencies
2010$ million
2009$ million
Guarantees in respect of subsidiary undertakings 33 27
The Company has given guarantees to banks to support liabilities under foreign exchange and other contracts and cross guarantees tosupport overdrafts. Such guarantees are not considered to be liabilities as all subsidiary undertakings are trading as going concerns.
The Company operated defined benefit pension plans in 2004 but at the end of 2005 its pension plan obligations were transferred toSmith & Nephew UK Limited. The Company has provided guarantees to the Trustees of the pension plans to support future amounts duefrom participating employers (see Note 33 of the Notes to the Group Accounts).
134 2010 Annual Report

Des
crip
tion
ofth
eG
roup
Busi
ness
Revi
ew,
Liqui
dity
and
Pros
pect
sCo
rpor
ate
Gov
erna
nce
Stat
emen
tD
irect
ors’
Rem
uner
atio
nRe
port
Gro
upA
ccou
nts
Com
pany
Acc
ount
sIn
vest
orIn
form
atio
n
INVESTOR INFORMATIONShareholder Return (Dividends and share price movements) * 136Information for Shareholders 138Share Capital 141Selected Financial Data 143Taxation Information for Shareholders 145Articles of Association 147Cross Reference to Form 20-F 150Glossary of Terms 152Index 155
* A graph showing total shareholder return can be found in the Directors’ Remuneration Report on page 71.
The report and financial statements, share and ADR price information, company presentations, the financial calendar, Corporate GovernanceStatement, contact details and other investor information on the Group are available in the ‘Investor Centre’ section of the Company’swebsite at www.smith-nephew.com.
2010 Annual Report 135

SHAREHOLDER RETURNDividends
Dividend HistorySmith & Nephew has paid dividends on its Ordinary Shares in each year since 1937. Following the capital restructuring and dividendreduction in 2000 the Group adopted a policy of increasing its dividend cover (the ratio of EPSA, as set out in the “Selected Financial Data”,to ordinary dividends declared for the year). This was intended to increase the financing capability of the Group for acquisitions and otherinvestments. From 2000 to 2004 the dividend increased in line with inflation and, in 2004, dividend cover stood at 4.1 times. Havingachieved this level of dividend cover the Board changed its policy, from that of increasing dividends in line with inflation, to that of increasingdividends for 2005 and after by 10%. Following the redenomination of the Company’s share capital into US Dollars the Board re-affirmed itspolicy of increasing the dividend by 10% a year in US Dollar terms.
An interim dividend in respect of each fiscal year is normally declared in August and paid in November. Up to 2004 a final dividend for eachyear was recommended by the Board of Directors in the following February and paid in May after approval by shareholders at theCompany’s Annual General Meeting. Following shareholder approval in December 2005, the directors were able to declare and pay interimdividends. The second interim dividend replaced the final dividend and was usually payable in May and accordingly in 2008 and 2009shareholders received two interim dividends. From 2010, the Company is reverting to paying an interim and final dividend each year; a finaldividend will be recommended by the Board of Directors and paid subject to approval by shareholders at the Company’s Annual GeneralMeeting.
Future dividends of Smith & Nephew will be dependent upon: future earnings; the future financial condition of the Group; the Board’sdividend policy; and the additional factors that might affect the business of the Group set out in “Special Note Regarding Forward-LookingStatements” and “Risk Factors”.
Dividends per ShareThe table below sets out the dividends per Ordinary share in the last five years.
Years ended 31 December2010 2009 2008 2007 2006
Pence per share:Interim 4.233 3.650 3.194 2.450 2.456Final/Second interim (ii) (i) 6.720 6.494 6.194 4.059 3.789
Total 10.953 10.144 9.388 6.509 6.245
US cents per share:Interim 6.667 6.067 5.511 5.011 4.556Final/Second interim (ii) 10.911 9.922 9.022 8.200 7.456
Total 17.578 15.989 14.533 13.211 12.012
(i) Translated at the Bank of England rate on 23 February 2011.
(ii) 2006 to 2009 Second interim, 2010 Final
Dividends above include the associated UK tax credit of 10%, but exclude the deduction of withholding taxes. All dividends, up to thesecond interim dividend for 2005, were declared in pence per Ordinary Share and translated into US cents per Ordinary Share at the NoonBuying Rate on the payment date. Since the second interim dividend for 2005 all dividends have been declared in US cents per OrdinaryShare.
The 2010 final dividend will be payable on 19 May 2011, subject to shareholder approval.
The Ordinary Shares will trade ex-dividend on the London Stock Exchange from 27 April 2011. The ADSs will trade ex-dividend on the NewYork Stock Exchange from 29 April 2011. In respect of the final dividend for the year ended 31 December 2010 of 9.82 US cents perOrdinary Share, the record date will be 3 May 2011 and the payment date will be 19 May 2011. The Sterling equivalent per Ordinary Sharewill be set following the record date. Shareholders may elect to receive their dividend in either Sterling or US Dollars and the last day forelection will be 3 May 2011.
136 2010 Annual Report

Des
crip
tion
ofth
eG
roup
Busi
ness
Revi
ew,
Liqui
dity
and
Pros
pect
sCo
rpor
ate
Gov
erna
nce
Stat
emen
tD
irect
ors’
Rem
uner
atio
nRe
port
Gro
upA
ccou
nts
Com
pany
Acc
ount
sIn
vest
orIn
form
atio
n
Share PricesThe table below sets out, for the periods indicated, the highest and lowest middle market quotations for the Company’s Ordinary Shares (asderived from the Daily Official List of the UK Listing Authority) and the highest and lowest sales prices of its ADSs (as reported on the NewYork Stock Exchange composite tape).
Ordinary Shares ADSsHigh Low High Low
£ £ US$ US$
Year ended 31 December:
2006 5.71 4.00 52.65 36.952007 6.50 5.33 67.84 51.542008 6.91 4.13 68.87 30.392009 6.42 4.20 51.38 30.572010 6.97 5.38 53.94 41.29
Quarters in the year ended 31 December:
2009:1st Quarter 5.53 4.22 39.63 30.572nd Quarter 4.84 4.20 38.91 31.003rd Quarter 5.66 4.39 46.93 35.824th Quarter 6.42 5.27 51.38 42.55
2010:1st Quarter 6.97 6.25 53.23 48.982nd Quarter 6.95 6.05 53.94 43.263rd Quarter 6.16 5.38 47.45 41.294th Quarter 6.86 5.43 52.55 43.09
2011:1st Quarter (to 23 February 2011) 7.42 6.50 60.19 50.83
Last Six Months:
August 2010 5.78 5.41 45.88 41.29September 2010 5.81 5.38 45.60 41.52October 2010 5.83 5.43 46.23 43.09November 2010 5.97 5.50 48.14 43.93December 2010 6.86 5.94 52.55 46.41January 2011 7.14 6.50 56.83 50.83February 2011 (to 23 February 2011) 7.42 7.02 60.19 56.57
2010 Annual Report 137

INFORMATION FOR SHAREHOLDERSFinancial CalendarAnnual General Meeting 14 April 2011Quarter One results 5 May 2011Payment of 2010 final dividend 19 May 2011Half year results announced 5 August 2011 (i)Quarter Three results announced 4 November 2011Payment of 2011 first interim dividend November 2011Full year results announced February 2012 (i)Annual Report available February/March 2012Annual General Meeting April/May 2012
(i) Dividend declaration dates.
Ordinary ShareholdersRegistrar
All general enquiries concerning shareholdings, dividends, changes to shareholders’ personal details and the AGM should be addressed to:
Equiniti, Aspect House, Spencer Road, Lancing, West Sussex BN99 6DATel: 0871 384 2081 inside the UK *Tel: +44 (0) 121 415 7072 outside the UK.Website: www.shareview.co.uk
* Calls to this number are charged at 8p per minute from a BT landline; other telephony providers’ costs may vary.
Shareholder facilities:
• Shareview
Equiniti’s online enquiry and portfolio management service for shareholders. To view information about your shareholdings online, registerat www.shareview.co.uk. Once registered for Shareview, you will also be able to register your proxy instructions online and elect toreceive future shareholder communications via the Company’s website (www.smith-nephew.com).
• E-communications
In line with developing practice we encourage shareholders to elect to receive communications via e-mail as this has significantenvironmental and cost benefits. Shareholders may register for this service through Equiniti, at www.shareview.co.uk. Shareholders willreceive a confirmation letter from Equiniti at their registered address, containing an Activation Code for future use.
• Payment of dividends direct to your bank or building society account
Shareholders who wish to avoid the risk of their dividend payments getting lost or mislaid can arrange to have their cash dividends paiddirectly to a bank or building society account. This facility is available to UK resident shareholders who receive sterling dividends. If you donot live in the UK you may be able to register for the overseas payment service. Further Information is available at www.shareview.co.uk orby contacting Equiniti (UK and overseas helpline numbers as above).
• Dividend re-investment plan (DRIP)
The Company offers shareholders (except those in North America) the opportunity to participate in a DRIP. This enables shareholders toreinvest their cash dividends in further Ordinary shares of Smith & Nephew plc. These are purchased in the market at competitive dealingcosts. For further details plus an application form to re-invest future dividends, contact Equiniti (as above).
• Individual savings account (ISA)
Shareholders who are UK resident may hold Smith & Nephew plc shares in an Individual Savings Account (ISA), which is administered bythe Company’s registrar. For information about this service please contact Equiniti (as above).
138 2010 Annual Report

Des
crip
tion
ofth
eG
roup
Busi
ness
Revi
ew,
Liqui
dity
and
Pros
pect
sCo
rpor
ate
Gov
erna
nce
Stat
emen
tD
irect
ors’
Rem
uner
atio
nRe
port
Gro
upA
ccou
nts
Com
pany
Acc
ount
sIn
vest
orIn
form
atio
n
Shareholder CommunicationsThe Company makes quarterly financial announcements which are made available through Stock Exchange announcements and on theGroup’s website (www.smith-nephew.com). Copies of recent Annual Reports, press releases, institutional presentations and audio webcastsare also available on the website.
Following shareholder approval in 2007, the Company sends paper copies of the Annual Report only to those shareholders that haveelected to receive shareholder documentation by post. ADS holders will also not receive a paper copy unless they have elected to do so.Electronic copies of the Annual Report are available on the Group’s website at www.smith-nephew.com. Both Ordinary shareholders andADS holders can request paper copies of the Annual Report, which the Company provides free of charge. The Company will continue tosend to Ordinary shareholders by post the notice of the Annual General Meeting and an accompanying letter. The letter states that theAnnual Report is available on the Group’s website. Shareholders who elect to receive the notice of Annual General Meeting electronically areinformed by e-mail of the documents’ availability on the Group’s website. ADS holders receive the form of proxy by post but will not receivea paper copy of the notice of Annual General Meeting.
Investor CommunicationsThe Company maintains regular dialogue with individual institutional shareholders, together with results presentations. To ensure that allmembers of the Board develop an understanding of the views of major investors, the executive directors review significant issues raised byinvestors with the Board. Non-executive directors are sent copies of analysts’ and brokers’ briefings. There is an opportunity for individualshareholders to question the directors at the AGM and the Company regularly responds to letters from shareholders on a range of issues.
UK Capital Gains TaxFor the purposes of UK capital gains tax the price of the Company’s Ordinary Shares on 31 March 1982 was 35.04p.
Smith & Nephew Share PriceThe Company’s Ordinary Shares are quoted on the LSE under the symbol SN. The Company’s share price is available on the Smith &Nephew website www.smith-nephew.com and at www.londonstockexchange.com where it is updated at intervals throughout the day.
ShareGiftShareholders with only a small number of shares, which would cost more to sell than they are worth, may wish to consider donating them tothe charity ShareGift (registered charity 1052686) which specialises in accepting such shares as donations. There may be no implicationsfor Capital Gains Tax purposes (no gain or loss) and it may also be possible to obtain income tax relief. The relevant stock transfer form maybe obtained from Equiniti at the above address.
Further information about ShareGift is available at www.sharegift.org or by contacting ShareGift at:ShareGift, 17 Carlton House Terrace, London SW1Y 5AH. Tel: (+44) (0) 20 7930 3737.
American Depositary Shares (“ADSs”) and American Depositary Receipts(“ADRs”)In the US, the Company’s Ordinary Shares are traded in the form of ADSs, evidenced by ADRs, on the NYSE under the symbol SNN. EachAmerican Depositary Share represents five Ordinary Shares. The Bank of New York Mellon is the authorised depositary bank for theCompany’s ADR programme.
ADS EnquiriesAll enquiries regarding ADS holder accounts and payment of dividends should be addressed to:BNY Mellon Shareholder Services, PO Box 358516, Pittsburgh, PA 15252-8516, USA;Tel: +1-866-259-2287 inside the US (toll free)Tel: +1-201-680-6825 internationallyEmail: [email protected].
A Global BuyDIRECT plan is available for US residents, enabling investment directly in ADSs with reduced brokerage commissions andservice costs. For further information on Global BuyDIRECT contact: The Bank of New York Mellon (as above) or visit www.bnymellon.com/shareowner.
2010 Annual Report 139

The Company provides The Bank of New York Mellon, as depositary, with copies of Annual Reports containing Consolidated FinancialStatements and the opinion expressed thereon by its independent auditors. Such financial statements are prepared under IFRS. The Bank ofNew York Mellon will send these reports to recorded ADS holders who have elected to receive paper copies. The Company also provides toThe Bank of New York Mellon all notices of shareholders’ meetings and other reports and communications that are made generally availableto shareholders of the Company. The Bank of New York Mellon makes such notices, reports and communications available for inspection byrecorded holders of ADSs and sends forms of proxy by post to all recorded holders of ADSs.
Smith & Nephew ADS price
The Company’s ADS price can be obtained from the official New York Stock Exchange website at www.nyse.com, the Smith-Nephewwebsite www.smith-nephew.com and is quoted daily in the Wall Street Journal.
ADS payment information
The Company hereby discloses ADS payment information for the year ended 31 December 2010 in accordance with the Securities andExchange Commission rules 12.D.3 and 12.D.4 relating to Form 20-F filings by foreign private issuers.
The depositary collects its fees for delivery and surrender of ADSs directly from investors depositing shares or surrendering ADSs for thepurpose of withdrawal or from intermediaries acting for them. The depositary collects fees for making distributions to investors, includingpayment of dividends by the Company by deducting those fees from the amounts distributed or by selling a portion of distributable propertyto pay the fees. The depositary may collect its annual fee for depository services by deductions from cash distributions or by directly billinginvestors or by charging the book-entry system accounts of participants acting for them. The depositary may generally refuse to provide fee-attracting services until its fee for those services are paid.
Persons depositing or withdrawing shares must pay: For:
$5.00 (or less) per 100 ADSs (or portion of 100 ADSs) Issuance of ADSs, including issuances resulting from a distributionof shares or rights or other propertyCancellation of ADSs for the purpose of withdrawal, including if thedeposit agreement terminates
$0.02 (or less) per ADS Any cash distribution to ADS registered holders, including paymentof dividend
A fee equivalent to the fee that would be payable if securitiesdistributed to holders had been shares and the shares had beendeposited for issuance of ADSs
Distribution of securities distributed to holders of depositedsecurities which are distributed by the depositary to ADS registeredholders
$0.02 (or less) per ADS per calendar year Depositary services
Registration or transfer fees Transfer and registration of shares on our share register to or fromthe name of the depositary or its agent when shares are depositedor withdrawn
Taxes and other governmental charges the depositary or thecustodian have to pay on any ADS or share underlying an ADS, forexample, stock transfer taxes, stamp duty or withholding taxes
As necessary
Any charges incurred by the depositary or its agents for servicingthe deposited securities
As necessary
A fee of 2 US cents per ADS was paid on the 2009 second interim dividend and a fee of 1 US cent per ADS was deducted from the 2010first interim dividend paid in November. In the period 1 January 2010 to 23 February 2011 the total reimbursed by The Bank of New YorkMellon was $170,772.
140 2010 Annual Report

Des
crip
tion
ofth
eG
roup
Busi
ness
Revi
ew,
Liqui
dity
and
Pros
pect
sCo
rpor
ate
Gov
erna
nce
Stat
emen
tD
irect
ors’
Rem
uner
atio
nRe
port
Gro
upA
ccou
nts
Com
pany
Acc
ount
sIn
vest
orIn
form
atio
n
SHARE CAPITALThe principal trading market for the Ordinary Shares is the London Stock Exchange. The Ordinary Shares were listed on the New York StockExchange on 16 November 1999, trading in the form of ADSs evidenced by ADRs. Each ADS represents five Ordinary shares. The ADSfacility is sponsored by The Bank of New York Mellon acting as depositary.
All the Ordinary Shares, including those held by directors and executive officers, rank pari passu with each other. On 23 January 2006 theOrdinary Shares of 12 2/9 pence were redenominated as Ordinary Shares of US 20 cents (following approval by shareholders at theextraordinary general meeting in December 2005). The new US Dollar Ordinary Shares carry the same rights as the previous OrdinaryShares. The share price continues to be quoted in Sterling and the ADSs continue to represent five Ordinary Shares. In 2006 the Companyissued £50,000 of shares in Sterling in order to comply with English law. These were issued as Deferred Shares, which are not listed on anystock exchange. They have extremely limited rights and therefore effectively have no value. These shares were allotted to the ChiefExecutive, although the Board reserves the right to transfer them to another member of the Board should it so wish.
ShareholdingsAs at 23 February 2011, 6,910,750 ADSs equivalent to 34,553,750 Ordinary Shares or approximately 3.9% of the total Ordinary Shares inissue, were outstanding and were held by 91 registered holders.
As at 23 February 2011, to the knowledge of the Group, there were 20,410 registered holders of Ordinary Shares, of whom 83 hadregistered addresses in the US and held a total of 214,806 Ordinary Shares (less than 0.1% of the total issued). Because certain OrdinaryShares are registered in the names of nominees, the number of shareholders with registered addresses in the US is not representative ofthe number of beneficial owners of Ordinary Shares resident in the US.
Major ShareholdersAs far as is known to Smith & Nephew, the Group is not directly or indirectly owned or controlled by another corporation or by anygovernment and the Group has not entered into arrangements, the operation of which may at a subsequent date result in a change incontrol of the Group.
As at 23 February 2011, no persons are known to Smith & Nephew to have any interest (as defined in the Disclosure and TransparencyRules of the FSA) in 3% or more of the Ordinary Shares, other than as shown below. The following tables show changes over the last threeyears in the percentage and numbers of the issued share capital owned by shareholders holding 3% or more of Ordinary Shares, as notifiedto the Company under the Disclosure and Transparency Rules:
23 February 2011%
As at 31 December
2010%
2009%
2008%
Capital Group of Companies Inc 5.1 5.1 5.1 5.1Newton Investment Management Limited 5.0 5.0 5.1 5.0Legal and General Group plc 5.0 5.0 4.0 4.5BlackRock, Inc 4.7 5.0 - -Thornburg Investment Management Inc - 4.1 4.8 -FMR LLC - - 3.9 3.9Prudential plc - - - 3.1
23 February 2011‘000
As at 31 December
2010‘000
2009‘000
2008‘000
Capital Group of Companies Inc 44,594 44,594 44,594 44,594Newton Investment Management Limited 44,338 44,735 45,129 44,168Legal and General Group plc 44,704 44,704 35,329 40,040BlackRock, Inc 42,102 44,322 - -Thornburg Investment Management Inc - 36,164 44,852 -FMR LLC - - 34,101 34,101Prudential plc - - - 26,945
The Company is not aware of any person who has a significant direct or indirect holding of securities in the Company, and is not aware ofany persons holding securities which may control the Company. There are no securities in issue which have special rights as to the controlof the Company.
2010 Annual Report 141

Purchase of Ordinary Shares on behalf of the CompanyThe share buy-back programme was suspended in November 2008, in light of conditions in the financial markets. The programme is keptunder review and, although there is no current intention to re-instate the programme, the Company will seek a renewal of its permissionfrom shareholders to purchase up to 10% of its own shares at the AGM on 14 April 2011. As at 31 December 2010, 68,240,200 (2009 –68,240,200) ordinary shares had been purchased under the share buy-back programme that commenced in February 2007. No shareswere purchased in 2010 and 2009. The cost of the shares purchased in 2008 was $193m.
Exchange Controls and Other Limitations Affecting Security HoldersThere are no UK governmental laws, decrees or regulations that restrict the export or import of capital or that affect the payment ofdividends, interest or other payments to non-resident holders of Smith & Nephew’s securities, except for certain restrictions imposed fromtime to time by Her Majesty’s Treasury of the United Kingdom pursuant to legislation, such as the United Nations Act 1946 and theEmergency Laws Act 1964, against the government or residents of certain countries.
There are no limitations, either under the laws of the UK or under the articles of association of Smith & Nephew, restricting the right ofnon-UK residents to hold or to exercise voting rights in respect of Ordinary Shares, except that where any overseas shareholder has notprovided to the Company a UK address for the service of notices, the Company is under no obligation to send any notice or other documentto an overseas address. It is, however, the current practice of the Company to send every notice or other document to all shareholdersregardless of the country recorded in the register of members, with the exception of details of the Company’s dividend re-investment plan,which are not sent to shareholders with recorded addresses in the US and Canada.
142 2010 Annual Report

Des
crip
tion
ofth
eG
roup
Busi
ness
Revi
ew,
Liqui
dity
and
Pros
pect
sCo
rpor
ate
Gov
erna
nce
Stat
emen
tD
irect
ors’
Rem
uner
atio
nRe
port
Gro
upA
ccou
nts
Com
pany
Acc
ount
sIn
vest
orIn
form
atio
n
SELECTED FINANCIAL DATA2010
$ million2009
$ million2008
$ million2007
$ million2006
$ million
Income StatementRevenue 3,962 3,772 3,801 3,369 2,779Cost of goods sold (1,031) (1,030) (1,077) (994) (769)
Gross Profit 2,931 2,742 2,724 2,375 2,010Selling, general and administrative expenses (1,860) (1,864) (1,942) (1,740) (1,353)Research and development expenses (151) (155) (152) (142) (120)
Operating profit 920 723 630 493 537Net interest (payable)/receivable (15) (40) (66) (30) 10Other finance (costs)/income (10) (15) (1) 6 3Share of results of associates - 2 1 - -
Profit before taxation 895 670 564 469 550Taxation (280) (198) (187) (153) (156)
Profit from continuing operations 615 472 377 316 394Discontinued operations – net profit on disposal and
share of results of joint venture - - - - 351
Attributable profit for the year 615 472 377 316 745
Earnings per Ordinary ShareIncluding discontinued operations:Basic 69.3¢ 53.4¢ 42.6¢ 34.2¢ 79.2¢Diluted 69.2¢ 53.3¢ 42.4¢ 34.1¢ 78.9¢Continuing operations:Basic 69.3¢ 53.4¢ 42.6¢ 34.2¢ 41.9¢Diluted 69.2¢ 53.3¢ 42.4¢ 34.1¢ 41.7¢Discontinued operations:Basic - - - - 37.3¢Diluted - - - - 37.2¢
Adjusted attributable profitAttributable profit for the year 615 472 377 316 745Acquisition related costs - 26 61 111 20Restructuring and rationalisation expenses 15 42 34 42 -Legal settlement - - - 30 -Amortisation of acquisition intangibles and impairments 34 66 51 30 14Loss on hedge of the sale proceeds of the joint venture - - - - 3Net profit on disposal of the joint venture - - - - (351)Taxation on excluded items (10) (26) (30) (49) (6)
Adjusted attributable profit 654 580 493 480 425
Adjusted basic earnings per Ordinary Share (“EPSA”) (i) 73.6¢ 65.6¢ 55.6¢ 52.0¢ 45.2¢Adjusted diluted earnings per Ordinary Share (ii) 73.6¢ 65.5¢ 55.4¢ 51.7¢ 45.0¢
2010 Annual Report 143

2010$ million
2009$ million
2008$ million
2007 (iv)$ million
2006$ million
Group Balance SheetNon-current assets 2,579 2,480 2,523 2,542 1,586Current assets 2,154 2,071 1,985 1,919 1,645Held for sale - 14 - - -
Total assets 4,733 4,565 4,508 4,461 3,231
Share capital 191 190 190 190 189Share premium 396 382 375 356 329Treasury shares (778) (794) (823) (637) (1)Retained earnings and other reserves 2,964 2,401 1,957 1,907 1,657
Total equity 2,773 2,179 1,699 1,816 2,174
Non-current liabilities 1,046 1,523 1,841 357 241Current liabilities 914 863 968 2,288 816
Total liabilities 1,960 2,386 2,809 2,645 1,057
Total equity and liabilities 4,733 4,565 4,508 4,461 3,231
Group Cash FlowCash generated from operations 1,111 1,030 815 693 506Net interest (paid)/received (17) (41) (63) (30) 10Income taxes paid (235) (270) (186) (225) (144)
Net cash inflow from operating activities 859 719 566 438 372Capital expenditure (including trade investments and net
of disposals of property, plant and equipment) (307) (318) (289) (194) (222)Acquisitions and disposals - (25) (16) (781) 454Cash received from Plus settlement - 137 - - -Loan Notes issued - - - - (15)New finance leases - - - (7) -Facility fee paid - - 2 (6) -Borrowings and finance leases acquired - - - (181) -Proceeds from own shares 8 10 4 - -Equity dividends paid (132) (120) (109) (105) (96)Issue of ordinary capital and treasury shares purchased 10 7 (174) (612) 16
438 410 (16) (1,448) 509Exchange adjustments 13 (21) (6) (72) 7Opening (net debt)/net cash (943) (1,332) (1,310) 210 (306)
Closing (net debt)/net cash (492) (943) (1,332) (1,310) 210
Selected Financial RatiosGearing (closing net debt as a percentage of total equity) 18% 43% 78% 72% n/aDividends per Ordinary Share (iii) 15.82¢ 14.39¢ 13.08¢ 11.89¢ 10.81¢Research and development costs to Revenue 3.8% 4.1% 4.0% 4.2% 4.3%Capital expenditure (including intangibles but excluding
goodwill) to Revenue 8.0% 8.4% 7.7% 5.9% 8.3%
(i) Adjusted basic earnings per Ordinary Share is calculated by dividing adjusted attributable profit by the average number of shares.
(ii) Adjusted diluted earnings per Ordinary Share is calculated by dividing adjusted attributable profit by the diluted number of shares.
(iii) The Board has proposed a final dividend of 9.82 US cents per share which together with the first interim dividend of 6.00 US cents makes a totalfor 2010 of 15.82 US cents.
(iv) Restated due to Plus opening balance sheet adjustments.
144 2010 Annual Report

Des
crip
tion
ofth
eG
roup
Busi
ness
Revi
ew,
Liqui
dity
and
Pros
pect
sCo
rpor
ate
Gov
erna
nce
Stat
emen
tD
irect
ors’
Rem
uner
atio
nRe
port
Gro
upA
ccou
nts
Com
pany
Acc
ount
sIn
vest
orIn
form
atio
n
TAXATION INFORMATION FOR SHAREHOLDERSThe comments below are of a general and summary nature and are based on the Group’s understanding of certain aspects of current UKand US federal income tax law and practice relevant to the ADSs and Ordinary Shares not in ADS form. The comments address the materialUS and UK tax consequences generally applicable to a person who is the beneficial owner of ADSs or Ordinary Shares and who, for USfederal income tax purposes, is a citizen or resident of the United States, a corporation (or other entity taxable as a corporation) created ororganised in or under the laws of the United States, or an estate or trust the income of which is included in gross income for US federalincome tax purposes regardless of its source (each a “US Holder”). The comments set out below do not purport to address all taxconsequences of the ownership of ADSs or Ordinary Shares which may be material to a particular holder and in particular do not deal withthe position of shareholders who directly or indirectly own 10% or more of the Company’s issued Ordinary Shares. This discussion does notapply to persons whose holding of ADSs or Ordinary Shares is effectively connected with or pertains to either (i) a permanent establishmentin the United Kingdom through which a US Holder carries on a business in the United Kingdom, (ii) a fixed base from which a US Holderperforms independent personal services in the United Kingdom, or (iii) whose registered address is inside the UK. This discussion does notapply to certain investors subject to special rules, such as certain financial institutions, tax-exempt entities, insurance companies, broker-dealers, traders in securities that elect to mark to market, partnerships or other entities treated as partnerships for US federal income taxpurposes, US Holders holding ADSs or Ordinary Shares as part of a hedging, conversion or other integrated transaction or whose functionalcurrency for US federal income tax purposes is other than the US Dollar and investors liable for alternative minimum tax. In addition, thecomments below do not address US state, local or non-US (other than UK) taxes. The summary deals only with US Holders who hold ADSsor Ordinary Shares as capital assets. The summary is based on current UK and US law and practice which is subject to change, possiblywith retroactive effect. US Holders are recommended to consult their own tax advisors as to the particular tax consequences to them of theownership of ADSs or Ordinary Shares.
The Company believes, and this discussion assumes, that the Company was not a passive foreign investment company for its taxable yearended 31 December 2010.
This discussion is based in part on representations by the depositary and assumes that each obligation under the deposit agreement andany related agreement will be performed in accordance with its terms. For purposes of US federal income tax law, US Holders of ADSs willgenerally be treated as owners of the Ordinary Shares represented by the ADSs. However, the US Treasury has expressed concerns thatparties to whom depositary shares are pre-released may be taking actions that are inconsistent with the claiming of foreign tax credits byowners of depositary shares. Such actions would also be inconsistent with the claiming of the reduced rate of tax, described below,applicable to dividends received by certain non-corporate US Holders. Accordingly, the availability of the reduced tax rate for dividendsreceived by certain non corporate US Holders could be affected by actions that may be taken by parties to whom ADSs are pre-released.
Taxation of Dividends in the United Kingdom and the United StatesThe UK does not currently impose a withholding tax on dividends paid by a UK corporation, such as the Company.
Distributions paid by the Company will be treated for US federal income tax purposes as foreign source ordinary dividend income to a USHolder to the extent paid out of the Company’s current or accumulated earnings and profits as determined for US federal income taxpurposes. Such dividends will not be eligible for the dividends-received deduction generally allowed to corporate US Holders.
Dividends paid to certain non-corporate US Holders of Ordinary Shares or ADSs in taxable years beginning before 1 January 2013 may besubject to US federal income tax at lower rates than other types of ordinary income if certain conditions are met. Non-corporate US Holdersshould consult their own tax advisors to determine whether they are subject to any special rules that limit their ability to be taxed at thesefavourable rates.
Taxation of Capital GainsUS Holders, who are not resident or ordinarily resident for tax purposes in the UK, will not generally be liable for UK capital gains tax on anycapital gain realised upon the sale or other disposition of ADSs or Ordinary Shares unless the ADSs or Ordinary Shares are held inconnection with a trade carried on in the UK through a permanent establishment (or in the case of individuals, through a branch or agency).Furthermore, UK resident individuals who acquire ADSs or Ordinary Shares before becoming temporarily non-UK residents, may remainsubject to UK taxation of capital gains on gains realised while non-resident.
For US federal income tax purposes, gains or losses realised upon a taxable sale or other disposition of ADSs or Ordinary Shares by USHolders generally will be US source capital gains or losses and will be long-term capital gains or losses if the ADSs or Ordinary Shares wereheld for more than one year. The amount of the US Holder’s gain or loss will be equal to the difference between the amount realised on thesale or other disposition and such holder’s tax basis in the ADSs, or Ordinary Shares, determined in US Dollars.
2010 Annual Report 145

Inheritance and Estate TaxesThe HM Revenue & Customs imposes inheritance tax on capital transfers which occur on death, and in the seven years preceding death.The HM Revenue & Customs considers that the US/UK Double Taxation Convention on Estate and Gift Tax applies to inheritance tax.Consequently, a US citizen who is domiciled in the United States and is not a UK national or domiciled in the United Kingdom will not besubject to UK inheritance tax in respect of ADSs and Ordinary Shares. A UK national who is domiciled in the United States will be subject toboth UK inheritance tax and US federal estate tax but will be entitled to a credit for US federal estate tax charged in respect of ADSs andOrdinary Shares in computing the liability to UK inheritance tax. Conversely, a US citizen who is domiciled or deemed domiciled in the UnitedKingdom will be entitled to a credit for UK inheritance tax charged in respect of ADSs and Ordinary Shares in computing the liability for USfederal estate tax. Special rules apply where ADSs and Ordinary Shares are business property of a permanent establishment of anenterprise situated in the United Kingdom.
US Information Reporting and Backup WithholdingA US Holder may be subject to US information reporting and backup withholding on dividends paid on or the proceeds of sales of ADSs orOrdinary Shares made within the US or through certain US-related financial intermediaries, unless the US Holder is an exempt recipient or,in the case of backup withholding, provides a correct US taxpayer identification number and certain other conditions are met. US backupwithholding may also apply if there has been a notification from the US Internal Revenue Service of a failure to report all interest or dividends.
Any backup withholding deducted may be credited against the US Holder’s US federal income tax liability, and, where the withholding taxexceeds the actual liability, the US Holder may obtain a refund by timely filing the appropriate refund claim with the US Internal RevenueService.
UK Stamp Duty and Stamp Duty Reserve TaxUK stamp duty is charged on documents and in particular instruments for the transfer of registered ownership of Ordinary Shares. Transfersof Ordinary Shares in certificated form will generally be subject to UK stamp duty at the rate of 1⁄2% of the consideration given for thetransfer with the duty rounded up to the nearest £5.
UK stamp duty reserve tax (“SDRT”) arises when there is an agreement to transfer shares in UK companies “for consideration in money ormoney’s worth”, and so an agreement to transfer Ordinary Shares for money or other consideration may give rise to a charge to SDRT at therate of 1⁄2% (rounded up to the nearest penny). The charge of SDRT will be cancelled, and any SDRT already paid will be refunded, if withinsix years of the agreement an instrument of transfer is produced to HM Revenue & Customs and the appropriate stamp duty paid.
Transfers of Ordinary Shares into CREST (an electronic transfer system) are exempt from stamp duty so long as the transferee is a memberof CREST who will hold the Ordinary Shares as a nominee for the transferor and the transfer is in a form that will ensure that the securitiesbecome held in uncertificated form within CREST. Paperless transfers of Ordinary Shares within CREST for consideration in money ormoney’s worth are liable to SDRT rather than stamp duty. SDRT on relevant transactions will be collected by CREST at 1⁄2%, and this willapply whether or not the transfer is effected in the United Kingdom and whether or not the parties to it are resident or situated in the UnitedKingdom.
A charge of stamp duty or SDRT at the rates of 1 1⁄2% of the consideration (or, in some circumstances, the value of the shares concerned)will arise on a transfer or issue of Ordinary Shares to the Depositary or to certain persons providing a clearance service (or their nominees oragents) for the conversion into ADRs and will generally be payable by the Depositary or person providing clearance service. In accordancewith the terms of the Deposit Agreement, any tax or duty payable by the Depositary on deposits of Ordinary Shares will be charged by theDepositary to the party to whom ADRs are delivered against such deposits.
No liability for stamp duty or SDRT will arise on any transfer of, or agreement to transfer, an ADS or beneficial ownership of an ADS, providedthat the ADS and any instrument of transfer or written agreement to transfer remains at all times outside the United Kingdom, and providedfurther that any instrument of transfer or written agreement to transfer is not executed in the United Kingdom and the transfer does notrelate to any matter or thing done or to be done in the United Kingdom (the location of the custodian as a holder of Ordinary Shares notbeing relevant in this context). In any other case, any transfer of, or agreement to transfer, an ADS or beneficial ownership of an ADS could,depending on all the circumstances of the transfer, give rise to a charge to stamp duty or SDRT.
146 2010 Annual Report

Des
crip
tion
ofth
eG
roup
Busi
ness
Revi
ew,
Liqui
dity
and
Pros
pect
sCo
rpor
ate
Gov
erna
nce
Stat
emen
tD
irect
ors’
Rem
uner
atio
nRe
port
Gro
upA
ccou
nts
Com
pany
Acc
ount
sIn
vest
orIn
form
atio
n
ARTICLES OF ASSOCIATIONThe following summarises certain material rights of holders of the Company’s Ordinary Shares under the material provisions of theCompany’s articles of association and English law. This summary is qualified in its entirety by reference to the Companies Act and theCompany’s articles of association. In the following description, a “shareholder” is the person registered in the Company’s register ofmembers as the holder of an Ordinary Share.
The Company is incorporated under the name Smith & Nephew plc and is registered in England and Wales with registered number 324357.
The Company’s Ordinary Shares may be held in certificated or uncertificated form. No holder of the Company’s shares will be required tomake additional contributions of capital in respect of the Company’s shares in the future. In accordance with English law the Company’sOrdinary Shares rank equally.
DirectorsUnder the Company’s articles of association, a director may not vote in respect of any contract, arrangement, transaction or proposal inwhich he, or any person connected with him, has any material interest other than by virtue of his interests in securities of, or otherwise in orthrough, the Company. This is subject to certain exceptions relating to proposals (a) indemnifying him in respect of obligations incurred onbehalf of the Company, (b) indemnifying a third party in respect of obligations of the Company for which the director has assumedresponsibility under an indemnity or guarantee, (c) relating to an offer of securities in which he will be interested as an underwriter,(d) concerning another body corporate in which the director is beneficially interested in less than one percent of the issued shares of anyclass of shares of such a body corporate, (e) relating to an employee benefit in which the director will share equally with other employeesand (f) relating to any insurance that the Company is empowered to purchase for the benefit of directors of the Company in respect ofactions undertaken as directors (and/or officers) of the Company.
A director shall not vote or be counted in any quorum present at a meeting in relation to a resolution on which he is not entitled to vote.
The directors are empowered to exercise all the powers of the Company to borrow money, subject to the limitation that the aggregateamount of all monies borrowed after deducting cash and current asset investments by the Company and its subsidiaries shall not exceedthe sum of $6,500,000,000.
Any director who has been appointed by the directors since the previous Annual General Meeting of shareholders, either to fill a casualvacancy or as an additional director, holds office only until the conclusion of the next Annual General Meeting and then shall be eligible forre-election by the shareholders. The other directors retire and are eligible for re-appointment at the third Annual General Meeting after themeeting at which they were last re-appointed. If not re-appointed a director retiring at a meeting shall retain office until the meeting appointssomeone in his place, or if it does not do so, until the conclusion of the meeting. The directors are subject to removal with or without causeby the Board or the shareholders. Directors are not required to hold any shares of the Company by way of qualification.
Under the Company’s articles of association and English law, a director may be indemnified out of the assets of the Company againstliabilities he may sustain or incur in the execution of his duties.
Rights Attaching to Ordinary SharesUnder English law, dividends are payable on the Company’s Ordinary Shares only out of profits available for distribution, as determined inaccordance with accounting principles generally accepted in the United Kingdom and by the Companies Act 2006. Holders of theCompany’s Ordinary Shares are entitled to receive final dividends as may be declared by the directors and approved by the shareholders ingeneral meeting, rateable according to the amounts paid up on such shares, provided that the dividend cannot exceed the amountrecommended by the directors.
The Company’s Board of Directors may declare such interim dividends as appear to them to be justified by the Company’s financial position.If authorised by an ordinary resolution of the shareholders, the Board may also direct payment of a dividend in whole or in part by thedistribution of specific assets (and in particular of paid up shares or debentures of the Company).
Any dividend unclaimed after 12 years from the date the dividend was declared, or became due for payment, will be forfeited and will revertto the Company.
There were no material modifications to the rights of shareholders under the Articles during 2010.
2010 Annual Report 147

Voting Rights of Ordinary SharesVoting at any general meeting of shareholders is by a show of hands unless a poll, which is a written vote, is duly demanded and held. On ashow of hands, every shareholder who is present in person at a general meeting has one vote regardless of the number of shares held. Ona poll, every shareholder who is present in person or by proxy has one vote for each Ordinary Share held by that shareholder. A poll may bedemanded by any of the following:
• the chairman of the meeting;
• at least five shareholders present or by proxy entitled to vote on the resolution;
• any shareholder or shareholders representing in the aggregate not less than one-tenth of the total voting rights of all shareholdersentitled to vote on the resolution; or
• any shareholder or shareholders holding shares conferring a right to vote on the resolution on which there have been paid-up sums inaggregate equal to not less than one-tenth of the total sum paid up on all the shares conferring that right.
A form of proxy will be treated as giving the proxy the authority to demand a poll, or to join others in demanding one, as above.
The necessary quorum for a general meeting is two shareholders present in person or by proxy carrying the right to vote upon the businessto be transacted.
Matters are transacted at general meetings of the Company by the processing and passing of resolutions of which there are two kinds;ordinary or special resolutions:
• Ordinary resolutions include resolutions for the re-election of directors, the approval of financial statements, the declaration of dividends(other than interim dividends), the appointment and re-appointment of auditors or the grant of authority to allot shares. An Ordinaryresolution requires the affirmative vote of a majority of the votes of those persons voting at the meetings at which there is a quorum.
• Special resolutions include resolutions amending the Company’s articles of association, disapplying statutory pre-emption rights orchanging the Company’s name; modifying the rights of any class of the Company’s shares at a meeting of the holders of such class orrelating to certain matters concerning the Company’s winding up. A special resolution requires the affirmative vote of not less than three-quarters of the votes of the persons voting at the meeting at which there is a quorum.
Annual General Meetings must be convened upon advance written notice of 21 days. Other general meetings must be convened uponadvance written notice of at least 14 clear days. The days of delivery or receipt of notice are not included. The notice must specify the natureof the business to be transacted. Meetings are convened by the Board of directors. Members with 5% of the Ordinary Share capital of theCompany may requisition the Board to convene a meeting.
Variation of RightsIf, at any time, the Company’s share capital is divided into different classes of shares, the rights attached to any class may be varied, subjectto the provisions of the Companies Act, with the consent in writing of holders of three-quarters in nominal value of the issued shares of thatclass or upon the adoption of a special resolution passed at a separate meeting of the holders of the shares of that class. At every suchseparate meeting, all the provisions of the articles of association relating to proceedings at a general meeting apply, except that the quorumis to be the number of persons (which must be two or more) who hold or represent by proxy not less than one-third in nominal value of theissued shares of the class and at any such meeting a poll may be demanded in writing by any person or their proxy who hold shares of thatclass. Where a person is present by proxy or proxies, he is treated as holding only the shares in respect of which the proxies are authorisedto exercise voting rights.
Rights in a Winding-UpExcept as the Company’s shareholders have agreed or may otherwise agree, upon the Company’s winding up, the balance of assetsavailable for distribution:
• after the payment of all creditors including certain preferential creditors, whether statutorily preferred creditors or normal creditors; and
• subject to any special rights attaching to any other class of shares;
is to be distributed among the holders of Ordinary Shares according to the amounts paid-up on the shares held by them. This distribution isgenerally to be made in US Dollars. A liquidator may, however, upon the adoption of any extraordinary resolution of the shareholders andany other sanction required by law, divide among the shareholders the whole or any part of the Company’s assets in kind.
148 2010 Annual Report

Des
crip
tion
ofth
eG
roup
Busi
ness
Revi
ew,
Liqui
dity
and
Pros
pect
sCo
rpor
ate
Gov
erna
nce
Stat
emen
tD
irect
ors’
Rem
uner
atio
nRe
port
Gro
upA
ccou
nts
Com
pany
Acc
ount
sIn
vest
orIn
form
atio
n
Limitations on Voting and ShareholdingThere are no limitations imposed by English law or the Company’s articles of association on the right of non-residents or foreign persons tohold or vote the Company’s ordinary shares or ADSs, other than the limitations that would generally apply to all of the Company’sshareholders.
Transfers of SharesThe Board may refuse to register the transfer of shares held in certificated form which:
• are not fully paid (provided that it shall not exercise this discretion in such a way as to prevent stock market dealings in the shares of thatclass from taking place on an open and proper basis);
• are not duly stamped or duly certified or otherwise shown to the satisfaction of the Board to be exempt from stamp duty, lodged at theTransfer Office or at such other place as the Board may appoint and (save in the case of a transfer by a person to whom no certificate wasissued in respect of the shares in question) accompanied by the certificate for the shares to which it relates, and such other evidence asthe Board may reasonably require to show the right of the transferor to make the transfer and, if the instrument of transfer is executed bysome other person on his behalf, the authority of that person so to do;
• are in respect of more than one class of shares; or
• are in favour of more than four transferees.
Deferred SharesFollowing the redenomination of share capital on 23 January 2006 the Ordinary Shares’ nominal value became 20 US cents each. Therewere no changes to the rights or obligations of the Ordinary Shares. In order to comply with the Companies Act 2006, a new class of Sterlingshares was created, Deferred Shares, of which £50,000 were issued and allotted in 2006 as fully paid to the Chief Executive though theBoard reserves the right to transfer them to another member of the Board should it so wish. These Deferred Shares have no voting ordividend rights and on winding up only are entitled to repayment at nominal value only if all ordinary shareholders have received the nominalvalue of their shares plus an additional $1,000 each.
AmendmentsThe Company does not have any special rules about amendments to its articles of association beyond those imposed by law.
2010 Annual Report 149

CROSS REFERENCE TO FORM 20FThis table has been provided as a cross reference from the information included in this Annual Report to the requirements of Form 20-F.
Page
Part IItem 1 Identity of Directors, Senior Management and Advisors n/aItem 2 Offer Statistics and Expected Timetable n/aItem 3 Key Information
A – Selected Financial Data 143-144B – Capitalisation and Indebtedness n/aC – Reason for the Offer and Use of Proceeds n/aD – Risk Factors 18-21
Item 4 Information on the CompanyA – History and Development of the Company 4, 39-40B – Business Overview i, 4-12, 18, 24, 89-92C – Organisational Structure i, 4, 128D – Property, Plant and equipment 11
Item 4A Unresolved Staff Comments NoneItem 5 Operating and Financial Review and Prospects
A – Operating results 24-38B – Liquidity and Capital Resources 39-40C – Research and Development, patents and licenses, etc 11-12D – Trend information 27, 43E – Off Balance Sheet Arrangements 44F – Tabular Disclosure of Contractual Obligations 44G – Safe Harbor iv
Item 6 Directors, Senior Management and EmployeesA – Directors and Senior Management 46-47B – Compensation 59-71C – Board Practices 46-54, 66D – Employees 17E – Share Ownership 17, 68-70, 113-117
Item 7 Major Shareholders and Related Party TransactionsA – Major Shareholders 141
– Host Country Shareholders 141B – Related Party Transactions 44, 127C – Interests of experts and counsel n/a
Item 8 Financial informationA – Consolidated Statements and Other Financial Information 73-128
– Legal Proceedings 41-42– Dividends 136
B – Significant Changes n/aItem 9 The Offer and Listing
A – Offer and Listing Details 137, 141B – Plan and Distribution n/aC – Markets 141D – Selling Shareholders n/aE – Dilution n/aF – Expenses of the Issue n/a
Item 10 Additional InformationA – Share capital n/aB – Memorandum and Articles of Association 147-149C – Material Contracts 4, 44D – Exchange Controls 142
150 2010 Annual Report

Des
crip
tion
ofth
eG
roup
Busi
ness
Revi
ew,
Liqui
dity
and
Pros
pect
sCo
rpor
ate
Gov
erna
nce
Stat
emen
tD
irect
ors’
Rem
uner
atio
nRe
port
Gro
upA
ccou
nts
Com
pany
Acc
ount
sIn
vest
orIn
form
atio
n
Page
E – Taxation 145-146F – Dividends and Paying Agents n/aG – Statement by Experts n/aH – Documents on Display ivI – Subsidiary Information 128
Item 11 Quantitative and Qualitative Disclosure about Market Risk 18-21, 105-109Item 12 Description of Securities Other than Equity Securities n/aItem 12D American Depository shares 139-140
Part IIItem 13 Defaults, Dividend Arrearages and Delinquencies NoneItem 14 Material Modifications to the Rights of Security Holders and Use of Proceeds NoneItem 15A Controls and Procedures 55-57, 79Item 16 (Reserved) n/aItem 16A Audit Committee Financial Expert 51Item 16B Code of Ethics 56Item 16C Principal Accountant Fees and Services 56Item 16D Exemptions from the Listing Standards for Audit Committee n/aItem 16E Purchase of Equity Securities by the Issuer and Affiliated Purchase 142Item 16F Change in Registrants Certifying Accountant n/aItem 16G Corporate Governance Statement 45-57
Part IIIItem 17 Financial Statements n/aItem 18 Financial Statements 73-128Item 19 Exhibits
2010 Annual Report 151

GLOSSARY OF TERMSUnless the context indicates otherwise, the following terms have the meanings shown below:
Term Meaning
ACL The anterior cruciate ligament (ACL) is one of the four major ligaments in the human knee.
ADR In the US, the Company’s Ordinary Shares are traded in the form of ADSs evidenced by AmericanDepository Receipts (“ADRs”).
ADS In the US, the Company’s Ordinary Shares are traded in the form of American Depositary Shares(“ADSs”).
Advanced Wound Management A product group comprising products associated with the treatment of skin wounds, ranging fromproducts that provide moist wound healing using breathable films and polymers to productsproviding active wound healing by biochemical or cellular action.
AGM Annual General Meeting of the Company.
Arthoscopy Endoscopy of the joints is termed “arthroscopy”, with the principal applications being the knee andshoulder.
Basis Point One hundredth of one percentage point.
Chronic wounds Chronic wounds are those with long or unknown healing times including leg ulcers, pressuresores and diabetic foot ulcers.
Company Smith & Nephew plc or, where appropriate, the Company’s Board of Directors, unless the contextotherwise requires.
Companies Act Companies Act 2006, as amended, of England and Wales.
DUROLANE DUROLANE is a registered trademark of Q-MED AB.
EBITA Earnings before interest, tax and amortisation.
EBITDA Earnings before interest, tax, depreciation and amortisation.
EIP Earnings Improvement Programme, the objective of which is to enhance short and medium termperformance, to liberate resources for investment and to establish a culture of continuousimprovement.
EPSA Adjusted Earnings Per Share is a trend measure which presents the long-term profitability of theGroup excluding the impact of specific transactions that management considers affect the Group’sshort-term profitability. The Group presents this measure to assist investors in their understandingof trends. Adjusted attributable profit is the numerator used for this measure.
Endoscopy Endoscopy allows surgeons to operate through small openings in the body, rather than largeincisions.
Endoscopy products A product group comprising specialised viewing and access devices, surgical instruments andpowered equipment used in minimally invasive surgical procedures. Through a small incisionsurgeons are able to see inside the body using a monitor and identify and repair defects.
Euro or € References to the common currency used in the majority of the countries of the European Union.
External fixation The use of wires or pins transfixed through bone to hold a frame to the position of a fracture.
FDA US Food and Drug Administration.
Financial statements Refers to the consolidated Group Accounts of Smith & Nephew plc.
FTSE 100 Index of the largest 100 listed companies on the London Stock Exchange by market capitalisation.
Group or Smith & Nephew Used for convenience to refer to the Company and its consolidated subsidiaries, unless thecontext otherwise requires.
IFRIC International Financial Reporting Interpretations as adopted by the EU and as issued by theInternational Accounting Standards Board.
152 2010 Annual Report

Des
crip
tion
ofth
eG
roup
Busi
ness
Revi
ew,
Liqui
dity
and
Pros
pect
sCo
rpor
ate
Gov
erna
nce
Stat
emen
tD
irect
ors’
Rem
uner
atio
nRe
port
Gro
upA
ccou
nts
Com
pany
Acc
ount
sIn
vest
orIn
form
atio
n
Term Meaning
IFRS International Financial Reporting Standards as adopted by the EU and as issued by theInternational Accounting Standards Board.
Intramedullary nail system Stainless steel or titanium implants shaped like a nail implanted in the intramedullary canal indiaphyseal fractures.
Labrum Another name for cartilage found in the hip joint and shoulder joint.
LSE London Stock Exchange.
Metal-on-metal hip resurfacing A less invasive surgical approach to treating arthritis in younger patients whereby only thesurfaces of the hip joint are replaced leaving the hip head substantially preserved.
Negative Pressure Wound Therapy A technology used to treat chronic wounds such as diabetic ulcers, pressure sores and postoperative wounds through the application of sub-atmospheric pressure to an open wound.
NYSE New York Stock Exchange.
Orthobiologic products Any product that is primarily intended to act as a scaffold and/or actively stimulates bone growth.
Orthopaedic products Orthopaedic reconstruction products include joint replacement systems for knees, hips andshoulders and support products such as computer assisted surgery and minimally invasivesurgery techniques. Orthopaedic trauma devices are used in the treatment of bone fracturesincluding rods, pins, screws, plates and external frames. Clinical therapies products include jointfluid therapy for pain reduction of the knee and an ultrasound treatment to accelerate the healingof bone fractures.
OXINIUM OXINIUM material is an advanced load bearing technology. It is created through a proprietarymanufacturing process that enables zirconium to absorb oxygen and transform to a ceramic onthe surface, resulting in a material that incorporates the features of ceramic and metal.Management believes that OXINIUM material used in the production of components of knee andhip implants exhibits unique performance characteristics due to its hardness, low-friction andresistance to roughening and abrasion.
Parent Smith & Nephew plc.
Pound Sterling, Sterling, £, penceor p
References to UK currency. 1p is equivalent to one hundredth of £1.
Repair A product group within endoscopy comprising specialised devices, fixation systems and bio-absorbable materials to repair joints and associated tissue.
Resection Products that cut or ablate tissue within endoscopy comprising mechanical blades, radiofrequency wands, electromechanical and hand instruments for resecting tissue.
SUPARTZ SUPARTZ is a registered trademark of Seikagaku Corp.
Trading profit Trading profit is a trend which presents the long-term profitability of the Group excluding theimpact of specific transactions that management considers affect the Group’s short-termprofitability. The Group presents this measure to assist investors in their understanding of trends.The Group has identified the following items, where material, as those to be excluded fromoperating profit when arriving at trading profit: acquisition and disposal related items includingamortisation of acquisition intangible assets and impairments; significant restructuring events;and gains and losses resulting from legal disputes and uninsured losses.
Traditional woundcare Product group comprising medical textile products, adhesive tapes and fixative sheets to securewound management products to the body.
UK United Kingdom of Great Britain and Northern Ireland.
UK GAAP Accounting principles generally accepted in the United Kingdom
US United States of America.
US Dollars, US $ or cents References to US currency. 1 cent is equivalent to one hundredth of US$1
2010 Annual Report 153

Term Meaning
US GAAP Accounting principles generally accepted in the United States of America.
Visualisation Products within endoscopy comprising digital cameras, light sources, monitors, scopes, imagecapture, central control and multimedia broadcasting systems for use in endoscopic surgery withvisualisation.
Wound bed An area of healthy dermal and epidermal tissue of a wound.
154 2010 Annual Report

Des
crip
tion
ofth
eG
roup
Busi
ness
Revi
ew,
Liqui
dity
and
Pros
pect
sCo
rpor
ate
Gov
erna
nce
Stat
emen
tD
irect
ors’
Rem
uner
atio
nRe
port
Gro
upA
ccou
nts
Com
pany
Acc
ount
sIn
vest
orIn
form
atio
n
INDEX2009 Year 342010 Year 29Accountability, Audit and Internal Control Framework 55Accounting Policies 84Accounts Presentation 84Acquisitions 119Acquisition related costs 94Advanced Wound Management – Business Description 8American Depository Shares 139Articles of Association 147Assets held for sale 121Audit Fees 56, 127Board and Executive Officers 46Business and the Community 13Business Overview 24Business Review, Liquidity and Prospects 23Cash and Borrowings 103Company Auditor’s Report 129Company Balance Sheet 131Company Notes to the Accounts 132Contingencies 122Contractual Obligations 44Corporate Governance Statement 45Critical Accounting Policies 28Cross Reference to Form 20-F 150Currency Translation 119Deferred Taxation 110Directors’ Remuneration Report 59Directors’ Responsibilities for the Accounts 74Directors’ Responsibility Statement 75Dividends 95, 136Earnings per share 96Employees 17Employees’ Share Trust 117Endoscopy – Business Description 7Exchange and Interest Rate Risk and Financial
Instruments 21Factor’s Affecting Results of Operations 27Financial Commitments 121Financial Instruments 106Financial Position, Liquidity and Capital Resources 39Financial highlights iGlossary of terms 152Goodwill 99Governance and Policy 48Group Balance Sheet 81Group Cash Flow Statement 82
Group History 4Group Income Statement 80Group Notes to the Accounts 84Group Statement of Changes in Equity 83Group Statement of Comprehensive Income 80Group Strategy 4Group Organisation 4Independent Auditor’s Reports 76Information for Shareholders 138Intangible Assets 98Intellectual Property 12Interest 94Inventories 101Investments 98Investment in associates 99Investor information 135Key Performance Indicators iLegal Proceedings 41Manufacturing, Supply and Distribution 10New Accounting Standards 89Off-Balance Sheet Arrangements 44Operating profit 93Operating Segment Information 89Orthopaedics – Business Description 5Other Finance (Costs)/Income 94Outlook and Trend Information 43Payables 109Principal Subsidiary Undertakings 128Provisions 110Property, plant and equipment 11, 97Receivables 101Recent Developments 4Regulation 12Related Party Transactions 44, 127Research and Development 11Restructuring and Rationalisation Expenses 94Retirement Benefit Obligation 122Risk 18Sales and Marketing 10Selected Financial Data 143Share Based Payments 113Share Capital 112, 141Shareholder Return 136Taxation 95Taxation Information for Shareholders 145Treasury Shares 117
2010 Annual Report 155


2010 Annual Report
Enabling people to live healthier, more active lives.
Smith & Nephew plc15 Adam Street London WC2N 6LA United Kingdom
T +44 (0) 20 7401 7646 F +44 (0) 20 7960 2350
www.smith-nephew.com
2010 Annual Report
SN_AR2010_Cover_4.0.indd 1 23/02/2011 10:02