2010-11 annual update to the 2010-2015 comprehensive
TRANSCRIPT

2010-11 Annual Update to the 2010-2015
Comprehensive Economic Development Strategy
For the period covering July 1, 2010 through June 30, 2011
Eastern U.P. Regional Planning & Development Commission 125 Arlington Street, Unit 18 | P.O. Box 520
Sault Ste. Marie, MI 49783 Telephone: 906.635.1581
Fax: 906.635.9582 Email: [email protected]
Website: www.eup-planning.org

Eastern U.P. Regional Planning & Development Commission
Executive Committee
Billie Jo Hermanson, Chair
Jim Hill, Vice-Chair
Don McLean, Treasurer
Dean Reid, Secretary
COMMISSION MEMBERS – 2011/2012
CHIPPEWA COUNTY
Don McLean Jim Moore (George Kinsella, Alt.) Leisa Mansfield Barbara Lisiecki William Ferguson Greg Zimmerman LUCE COUNTY Mike Herbst Jill Maki Beverly Holmes Billie Jo Hermanson MACKINAC COUNTY Jim Hill Diane Patrick Jim Durm Eric Dodson Dean Reid OTHER MEMBERS Eric Becks, LSSU SmartZone Jeff Holt, Sault Ste. Marie Tribe of Chippewa Indians Michelle Walk, MSU Extension Eastern District Richard Timmer, Workforce Development
ABSTRACT
Title: 2010 Update to the 2010-2015 Comprehensive Economic Development Strategy
Author: Eastern U.P. Regional Planning & Development Commission
Subject: This annual update covers the economic development trends, conditions, need and
strategies for the three-county Eastern Upper Peninsula Region in Michigan.
Date: June 2011
Purpose: Since 1972 the County Board of Commissioners of Chippewa, Luce and Mackinac
Counties have cooperated annually to develop this report through the Eastern U.P.
Regional Planning & Development Commission (EUP) for the purpose of fostering
regional economic development. The annual update documents the Region’s current
conditions, economic challenges and strategies undertaken to improve the Region’s
environment, economy, and quality of life. The preparation and successful participation
of our member counties in the development of this report, the three county EUP Region
maintains its Economic Development District designation conferred upon it by the U.S.
Department of Commerce-Economic Development Administration (EDA). This district
designation qualifies the region’s counties, cities, villages, townships, economic
development organizations, non-profits, institutions and businesses to be eligible for
EDA assistance under its public works and economic facilities program, technical
assistance programs, loan programs, and planning programs.
This document is an update to the 2010-2015 Revised Comprehensive Economic
Development Strategy (CEDS), a five year plan that provides a much more in-depth
physical, economic, and social analysis of the Region. The CEDS can be downloaded
from the EUP website.
Copies of the report are available at: Eastern U.P. Regional Planning & Development Commission 125 Arlington Street, Unit 18 Sault Ste. Marie, MI 49783 Phone: 906.635.1581 Toll-Free: 855-885-3690 Fax: 906.635.9582 Email: [email protected] Website: http://www.eup-planning.org

TABLE OF CONTENTS
CHAPTER 1: INTRODUCTION 1 The Eastern U.P. Regional Planning & Development Commission 1 PURPOSE OF THE CEDS 4
EDA District Status 4 EDA Investment in the Region 4
BACKGROUND AND PROCESS 5 Regional Economic Development Advisory Committee (REDAC) 5 Public Participation 6 CHAPTER 2: POPULATION AND ECONOMIC TRENDS 7
POPULATION AND HOUSING TRENDS 7 Historic Population 7 Population Density 7
Housing Data 8 LABOR FORCE & UNEMPLOYMENT 10
Historic and Projected Labor Force 10 Annual Labor Force Characteristics 11
Employment Forecast 12 Regional Unemployment 12
WAGES & INCOME 14 Per Capita Personal Income 14 Average Weekly Wages 15
INDUSTRY GROUPS & CLUSTERS 16 Location Quotients 16 Industry Clusters 19
TRANSPORTATION NETWORK 21
CHAPTER 3: ACTION PLAN 24 EVALUATION OF CURRENT ACTIVITIES 24 GOALS 24
CHAPTER 4: EDA PROGRAM CRITERIA & REGIONAL PROJECT INVENTORY 27
INTRODUCTION 27 CRITERIA FOR SELECTING PRIORITY PROJECTS 27 EDA FUNDING PROGRAMS 28
EDA Investment Guidelines 29 Eligibility 29
OTHER FUNDING PROGRAMS 29 EASTERN UP REGION PROJECT INVENTORY RESULTS & ANALYSIS 30 Project Scoring Criteria 30
Key Projects – 2010 30 Priority Projects – 2011 32 Completed Projects – 2011 33 Projects That Need Funding 35 Planned/Funded Projects 36 Transportation Projects 38
Regional Opportunities 40 Goals and Objectives 42
Appendix 46

1
CHAPTER 1: INTRODUCTION
THE EASTERN U.P. REGIONAL PLANNING & DEVELOPMENT COMMISSION
The Eastern U.P. Region covers an area of 4,763 square miles and is located at the Eastern end of Michigan’s Upper
Peninsula. It is surrounded on three sides by water – Lakes Superior, Michigan and Huron, and the St. Mary’s
River. Approximately 80% of the land surface is forested, 6% under agricultural use, and less than 1% is urbanized.
Just less than one-half (47%) of the land in the Eastern U.P. falls under public ownership, with 30% owned by the
State, 16% by the Federal, and the balance by local government.
The Commission was established in 1968, and is a State Designated Planning and Development Region within the
State of Michigan, pursuant to Public Act 281 of 1945 for the purpose planning and coordinating the planning and
economic development programs and activities within the Region. The Eastern U.P. consists of three (3) counties,
three (3) cities, two (2) villages and 31 townships. Neighboring jurisdictions include Northern Ontario to the north,
Schoolcraft and Alger Counties to the west and Emmett and Cheboygan Counties to the South. The Region is
bordered by three regional planning commissions, Northeast Michigan Council of Governments, Northwest
Michigan Council of Governments and the Central U.P. Planning and Development Region.
The Region is sparsely populated, with only 56,264 persons, according to the 2010 Census, or roughly 12 persons
per square mile. The three-county area has had annual unemployment rates ranging from 10% - 15% since 1990,
which far exceeds state and national averages. Income levels in all three counties are far below those of the state
and nation. Tourism and services are the major industries clusters in the Region, and Government (Federal, State
and Local) are the major employers.
EUP is governed by a board of 19 Commissioners. Two elected County Commissioners from each of the three
counties in the Region, as well as representatives from Cities, Townships, Tribal Government, Private Sector,
Workforce Development, Chambers of Commerce and Higher Education, as depicted in Table 1 below.
Table 1: 2011 EASTERN U.P. REGIONAL PLANNING COMMISSION BOARD
NAME RACE ELECTED OFFICE SEX COUNTY APPT. DATE
Executive Committee
Billie Jo Hermanson, Chair Caucasian N F Luce Jan-11
Jim Hill, Vice-Chair Caucasian Y M Mackinac Jan-11
Dean Reid, Secretary Caucasian N M Mackinac Jan-11
Donald McLean, Treasurer Caucasian Y M Chippewa Jan-11
Jeff Holt, Minority Rep. American Indian N M Chippewa Jan-11
Chippewa County - Delegation (6)
William Ferguson Caucasian N M Chippewa Mar-10
Barbara Lisiecki Caucasian N F Chippewa Oct-10
Leisa Mansfield Caucasian N F Chippewa Jan-10
Don McLean Caucasian Y M Chippewa Jan-11
Jim Moore Caucasian Y M Chippewa Jan-11

2
Gregory Zimmerman Caucasian N M Chippewa Jul-10
Luce County - Delegation (4)
Billie Jo Hermanson Caucasian N F Luce Jul-10
Beverly Holmes Caucasian N F Luce Jan-10
Mike Herbst Caucasian Y M Luce Jan-11
Jill Maki Caucasian Y M Luce Jan-11
Mackinac County - Delegation (5)
Eric Dodson Caucasian N M Mackinac Jan-07
Jim Durm Caucasian Y M Mackinac Aug-09
Jim Hill Caucasian Y M Mackinac Jan-11
Diane Patrick Caucasian Y F Mackinac Jan-11
Dean Reid Caucasian N M Mackinac Jul-10
Minority Representatives (1)
Jeff Holt American Indian N F Chippewa Aug-10
Additional Membership (3)
Eric Becks Caucasian N M EUP Aug-10
Richard Timmer Caucasian N M Chippewa Jan-11
Michelle Walk Caucasian N F Mackinac Apr-10
Alternates
George Kinsella Caucasian Y M Chippewa Jan-11
Terry Webb Caucasian Y M Luce Jan-10
District active meeting participation
The Commission has experienced a marked increase in participation since 2008-2009 from the
Governing Board. During the 2008-2009 program year the Commission had a 50.5% attendance record,
and during program year 2009-2010 attendance record increased to 65%, this increase is in large part
due to outreach at the Executive level within the Commission, and the effort to align with the EDA
regulations on the composition of the Commission’s Governing Board, which has brought in new
members representing Lake Superior State University, Private Sector, Chambers of Commerce and
Workforce Development organizations in the Region.
EUPRPDC Staff Members 2010-11
Jeff Hagan Executive Director
Ellen Benoit Assistant Director
Nathan Fazer Planner II/GIS Coordinator
Neil Henne Planner I (Part-Time)

!!
!
!
!
!
!
!
!
!!
!
!
!
!
!
!
!
!
!
!!
!!!!
!!! !
!
!!
!
!
!! !!
!
!
!!
!!!
!
!!
!!
!
!
!
!
!
!
!
!!
! !
!
!
! !
! !! !
!
!
!!
! !!
! !! !
!!!
!!
!
!!!
!!
!
!!
! !
!!!
! ! !
! !!
!!
! !!
!
!!!!
!!
!
!
!
!!!
!
!!
!
!
!!!
!
!!
!
!!
!
!
!
! ! !
!
!
!
!
!!
!
!
!
!
!
!!
!
!
!
!
!
!!
!
!
!
!! !!!
!!
!
! !
!
! !! !
!!!!
!
!
!!
!
!
!
!
!
!
!
! !
!!!!!
!
!
!!
!
!!!
!
!
!
!
!
!
!
!
!!
!!
!!
!!
!!
!
!
!
!
!!
!! !
!
!
!
! !
! !
!
!
!
!
!
!! !!
!
!
!!
!!
!!
!
!
!
!!
!!!
!
!
!
!! !!
!
!
!!
!
!
!
!
!!!!
!!
!!
!
!
!
!
!!
!!!
!
!
!!
!!!!
!!
!
!
!!!
!!
!
!
!!
!!
!
!
!!
!
!!
!!!
!
!
!!!
!
!
!
!!
!!
!
!
!
!
!
!
!
!
!!
!!
!
!
!!!
!!
!
!
!!
!
!
!!
!
!!!!
!
!!
!!
!!
!!
!!
!!
!!
!!
!!
!!
! !! ! ! ! ! !
!
!!
! !
!!
! ! ! !!
^
^
^
^
SCH
OO
LCR
AFT
CO
UN
TYSC
HO
OLC
RAF
T C
OU
NTY
ALG
ER C
OU
NTY
ALG
ER C
OU
NTY
E M M E TE M M E TC O U N T YC O U N T Y C H E Y B O Y G A NC H E Y B O Y G A N
C O U N T YC O U N T Y
O N T A R I OO N T A R I OC A N A D AC A N A D A
L U C EL U C E
C H I P P E W AC H I P P E W A
M A C K I N A CM A C K I N A C
McMillan Twp
Whitefish Twp
Columbus Twp
Lakefield Twp
Portage Twp
Newton Twp
Pentland Twp
Garfield Twp Hudson Twp Hendricks Twp
Hulbert TwpChippewa Twp
Bay Mills Twp
Superior Twp
Kinross Twp
Trout Lake Twp
Moran TwpBrevort Twp St Ignace Twp
Rudyard Twp
Marquette Twp
Clark Twp
Pickford Twp
Bruce Twp
Dafter Twp
Soo Twp
Raber Twp
Detour Twp
¬«123
¬«28
¬«117
¬«123
¬«221
¬«129
¬«80
¬«48
¬«134
¬«48¬«134
£¤2
¬«185
Deer Park
Pine Stump Junction
Crisp Point VermillionWhitefish Point
Paradise
McMillan
Curtis
Newberry
Gould CityEngadine
Naubinway
Soo Junction
Trout Lake
EpoufetteBrevort
Pointe Aux Chenes
Moran
St. Ignace Mackinac Island
Bois Blanc Island
HulbertEckerman Strongs Raco
Iroquois Pt.
Bay MillsBrimley
Sault Ste. Marie Sugar Island
Dafter
Kinross
RudyardKincheloe Neebish Island
Barbeau
Pickford
Hessel Cedarville
RaberGoetzville
DeTour Village DrummondDrummond Island
Map 1EUP Political UnitsEUPRPDC
PO BOX 520SSM, MI 49783906.635.1581
0 12 24 36Miles1 in = 12 miles
Legend^ County Seat
Township BoundaryCounty Boundary
!
! !
!! Economic Development District

4
PURPOSE OF THE CEDS
The Comprehensive Economic Development Strategy for the Eastern U.P. is an evolving, living document that has
numerous uses across the Region. It is intended to provide a baseline of information, targeted strategies and
benchmarks for documenting progress in the Region. A key component of the CEDS is the annual project listing
which is utilized by Commissioners, elected officials, the REDAC, interest groups and citizens of the Region, while at
the same time maintaining a core requirement of the Economic Development District Planning Program.
EDA DISTRICT STATUS
In 1970 the Eastern U.P. Regional Planning & Development Commission was designated as an Economic
Development District (EDD) under the provisions of Title IV of the Public Works and Economic Development Act of
1965, as amended. As the EDD for the Eastern U.P., the commission is provided with financial assistance from the
U.S. Department of Commerce, Economic Development Administration (EDA) for economic development and
community development planning that is integral in easing economic distress and unemployment in the Region.
The CEDS document is a core component in maintaining the EDD status for the Region. Continued eligibility of the
Eastern U.P. Regional Planning & Development Commission EDD is based upon the Commission completing a
revised CEDS Five Year CEDS, in conformance with 13 CFR Chapter III §303.7, ever 5 years, and submitting an
annual update for all other years. The most recent Revised CEDS 5 Year Plan was submitted in 2010, and this
document serves as the 1st
of four annual reports.
EDA Investments in the Region
The Commission has successfully secured numerous EDA investments during the past 40 years, Table 2 below
outlines more recent investments during the past 10 year period. Continued maintenance of the CEDS ensures
that communities within the EUP Region will remain eligible for EDA funding for priority projects which leverage
additional private and public sector investments.
Table 2: EDA Investments in the EUP since 1990. Year Recipient County Project Description Program EDA
Funding
1990 Sault Ste. Marie Chippewa Public Water Supply System Public Works $1,200,000
1992 Rudyard Township Chippewa Public Water Supply System Public Works $199,000
1992 St. Ignace Mackinac Water System Improvements Public Works $1,250,000
1994 International Bridge Authority
Chippewa Feasibility Study Tech. Asst. $25,000
1995 Luce County Luce Sewer System Extension Public Works $780,100
1998 City of Mackinac Island Mackinac Water Treatment Plant Expansion Public Works $800,000
1999 Village of Newberry Luce Water & Sewer Improvement Project
Public Works $645,000
1999 EUPRP&DC EUP Community Income & Expenditures Model
Planning $60,000
2001 Luce County EDC Luce Brownfield Redevelopment Site Plan Tech. Asst. $45,500
2001 Moran Township Mackinac Water Extension Project Public Works $1,450,000
2007 Bay Mills Indian Community
Chippewa Great Lakes Composites Institute Building Construction
Public Works $906,000
2010 Luce County EDC Luce Industrial Park Expansion Public Works $1,645,000
2011 Sault Ste. Marie EDC Chippewa SmartZone Building Construction/Incubator Rehab
Public Works $1,325,000
TOTAL EDA INVESTMENT IN THE EASTERN UP REIGON $10,330,600 Source: EDA Chicago Regional Office

5
STRATEGY COMMITTEE
The Regional Economic Development Advisory Committee was formed in 2009 during the process of developing
the Revised CEDS 5 Year Plan. This ad-hoc advisory committee provides input and guidance on Strategy
development, which is reported back to the Regional Planning commission Board. The composition of the REDAC
is guided by EDA legislation, CFR §303.6(a), which requires that the committee have representation from the
following: private sector, public officials, community leaders, workforce development boards, higher education,
minority and labor groups, private individuals, and tribal governments. The REDAC played a critical role in the
development of the 2010 Revised CEDS Five Year Plan, this is a group in relative infancy, and as such, we are
continuing to refine the committee structure and look to establish a more formalized structure, including By-Laws
in the near future.
1. Private Sector Representatives (At least 51%)
Any senior management office or executive holding a key decision-making position with respect to any
for-profit enterprise or private individuals.
Name Company Position
Mary Jo Barck War Memorial Hospital Development Fund Director
Eric Becks SSMart, Inc. Director
Sharon Brown Old Bank Collection of Shops Owner
Karen Cheeseman Mackinac Straits Hospital Director – Community Relations
Richard Conboy Lake Superior State University Center for Social Research
David Goodreau Northern Wings Repair Owner/CEO
Wayne Hellerstedt Helen Newberry Joy Hospital Director – Development
Leisa Mansfield Sault Area Chamber of Commerce Executive Director
Tony McLain Lake Superior State University President
Amy Polk Les Cheneaux Chamber of Commerce Director
William Schultz Great Lakes Framing Owner
Mike Soder Fish & Hunt Shop Owner
Greg Zimmerman Citizen – Chippewa County N/A
2. Representatives of other economic interests (No more than 49%)
Persons who provide additional representation of the main economic interests of the region. These may
include, but are not limited to: public officials, community leaders, representatives of workforce
development boards, institutions of higher education, minority and labor groups.
Name Area of Interest Position
Maryellen Becks LSSU SBTDC Business Consultant
Phil Becker International Bridge Authority
Executive Director
Lee Brown City of Sault Ste. Marie DDA Executive Director
Kristen Claus City of Sault Ste. Marie EDC Executive Director
Debra Evashevski St. Ignace DDA Director
Steve Gordon Sault Area Schools Director of HR & Operations
Jeff Holt Sault Tribe of Chippewa Indians
Planning and Economic Development
Donald McLean Chippewa County Board County Commissioner
Kathy Noel Chippewa County EDC Executive Director

6
Carmen Pittenger Luce County EDC Executive Director
Michelle Walk MSU Extension East District Community Development
Gwen Worley EUP Michigan Works! Executive Director
Other Members:
Amy Berglund Senator Levin’s Office Regional Representative
Jeremy Hosking Senator Stabenow’s Office Regional Representative
Lori Latham Representative Benishek’s Office Regional Representative
Randy Tallon Sault Ste. Marie Ontario EDC Director of International Relations & Global Logistics
CALCULATIONS Number Percent
Private Sector Representatives (at least 51%) 13 52.0%
Representatives of other economic interests (no more than 49%) 12 48.0%
Total Committee Membership 25 100%
APPLICABLE REGULATIONS:
13 CRF Part 303.6 (a):
The Planning Organization must appoint a Strategy Committee. The Strategy Committee must represent the main
economic interests of the Region and must include Private Sector Representatives [as defined above] as a majority
of its membership. In addition, the Planning Organization should ensure that the Strategy Committee includes
public officials, community leaders, representatives of workforce development boards, institutes of higher
education, minority and labor groups, and private individuals.
Public Participation
The Commission recognizes the importance of public participation in creating all plans. As a general operating
procedure, the Commission staff ensured that public participation opportunities were made available through the
process of developing the 2011 CEDS Annual Update, which includes continued maintenance of the EDD website, a
Call for Projects Survey, and a 30-day public comment period, culminating in a public comment item on the April
27, 2011 Commission Agenda. In addition, the REDAC meetings held during the development of this Annual
Update were publicized in accordance with the Open Meetings Act, where public comment and participation was
invited.

7
County Name 2000 Census 2010 Census
Pct.
Change
Chippewa 38,543 38,520 0.06
Luce 7,024 6,631 -5.6
Mackinac 11,943 11,113 -6.9
EUP Region 57,510 56,264 -2.2
Upper Peninsula 317,616 311,361 -1.9
State 9,938,444 9,883,640 -0.6
Nation 281,421,906 308,745,538 9.7
Source: U.S. Census Bureau, 2000, 22010 Census, State Data Center, Michigan
CHAPTER 2: POPULATION AND ECONOMIC TRENDS
POPULATION AND HOUSING TRENDS
According to 2010 Census data published by the U.S.
Census Bureau, the population of the Eastern Upper
Peninsula of Michigan has decreased by 2.2 percent
since the 2000 Census. From 2000-2010 the entire
Upper Peninsula population has declined by 1.9
percent, as compared to the State of Michigan
which saw a population decline of 0.6 percent
during this same time period.
Within the period of 2000 through 2010 the following jurisdictions experienced population growth: Bay Mills Twp.
(21.7%), Bruce Twp. (9.7%), Drummond Twp. (6.7%), Rudyard Twp. (4.2%), Soo Twp. (18.4%), Bois Blanc Twp.
(33.8%) and Newton Twp. (19.9%). These modest increases in population were not enough to offset those areas
experiencing a decline in population, such as: City of Sault St. Marie (-1.3%), DeTour Twp. (-9.7%), DeTour Village (-
22.8%), Village of Newberry (-13.2%), Clark Twp. (-6.5%), Portage Twp. (-7.0%), City of St. Ignace (-8.4%), and St.
Ignace Twp. (-8.3%).
Within Luce and Mackinac County’s, respectively, there were no communities that saw population gains during the
past decennial Census period of 2000 to 2010. While the Region experienced a population decline of 2.5 percent
during this time period, the data reflects a slightly higher population loss across the remaining 15 counties that
comprise the Upper Peninsula of Michigan, at 1.9 percent.
During the past decade, due to population decreases, each of the three counties within the Eastern UP
experienced some decline in their population density, from -0.08 percent in Chippewa County to -7.0 percent in
Mackinac. The regional overall saw its’ population density fall by 2.1 percent to 16.14 persons per mile, which still
identifies as a sparsely populated rural region, as compared to the state of Michigan at 102.2 persons per square
mile and the United States, at 87.28 persons per square mile.
Table 2: Population Density, 2000-2010
Location
2010
CENSUS
2000
Population
2008
Estimate
Square
Miles Acres
Square
Kilometers
Population Per
Square Mile
% of Population
Density Change
2000-2010*
Chippewa County 38,520 38,543 38,971 1561.1 999,103 4,043 24.67 -0.08%
Luce County 6,631 7,024 6,614 903.1 577,983 2,339 7.34 -5.9%
Mackinac County 11,113 11,943 10,872 1022.0 654,079 2,646 10.87 -7.0%
EUP Region 56,264 57,510 56,457 3486.0 2,231,165 9,029 16.14 -2.1%
Michigan 9,883,640 9,938,444 10,003,422 96704.7 61,891,007 250,464 102.20 -5.5%
United States 308,745,538 281,421,906 304,059,724 3537551.0 2,263,962,240 9,161,922 87.28 9.7%
Table 1: EUP Population Trends, 2000-2010

8
HOUSING DATA
According to recently released Census 2010 Redistricting Data (PL 94-171), released on March 22, 2011, the total
number of housing units in the Eastern U.P. Region was 21,253, an increase of 9.4 percent from the 2000 Census.
Mackinac and Chippewa Counties recorded the largest increases in housing units between 2000 through 2010 with
increases of 17.0 and 9.4 percent respectively.
Table 3: EUP Housing Unit Trends, 2000-2009
The table below displays historical information related to building permits within the Eastern U.P., from 2005
through 2009, this provides further evidence of the far reaching effects of the economic downturn that was
experienced during 2008, with a drastic decline in both building permits and the value of construction costs.
Region-wide, building permits were down 70.2% percent in 2009 as compared to the 2005 level of activity,
however, one encouraging sign is the slight increase in building permits from 2008 to 2009, where permits
increased by 15.3%, perhaps a positive sign that the economic downturn has leveled off and we could anticipate
some growth in the near future.
Table 4: County Building Permit Data: 2005-2009
YEAR Buildings %
Change Construction
Cost %
Change
2005 329 -15.2% $33,391,543 -4.7%
CHIP 89 -32.6% $9,032,039 -30.2%
LUCE 56 -5.1% $2,217,290 -5.1%
MACK 184 -6.6% $22,142,214 12.0%
2006 273 -17.0% $25,876,471 -22.5%
CHIP 92 3.4% $11,038,592 22.2%
LUCE 50 -10.7% $1,979,723 -10.7%
MACK 131 -28.8% $12,858,156 -41.9%
2007 229 -16.1% $20,515,084 -20.7%
CHIP 74 -19.6% $7,729,899 -30.0%
LUCE 38 -24.0% $1,504,590 -24.0%
MACK 117 -10.7% $11,280,595 -12.3%
2008 85 -62.9% $12,053,518 -41.2%
CHIP 45 -39.2% $4,688,971 -39.3%
LUCE 2 -94.7% $180,000 -88.0%
MACK 38 -67.5% $7,184,547 -36.3%
2009 98 15.3% $9,850,000 -18.3%
CHIP 73 62.2% $5,790,000 23.5%
LUCE 1 -50.0% $90,000 -50.0%
MACK 24 -36.8% $3,970,000 -44.7% Source: U.S. Census Bureau
Housing Units
2000
Census
2010
Census
Pct.
Change
Chippewa 19,430 21,253 9.4%
Luce 4,008 4,343 8.4%
Mackinac 9,413 11,010 17.0%
Region 32,851 36,606 11.4%
State 4,234,279 4,532,233 7.0%
Nation 115,904,641 131,704,730 13.6%
Source: U.S. Census Bureau, Census 2000, 2010 Redistricting Data

9
According to the recently released 2010 Census Demographic Profiles for County’s in Michigan, the Eastern U.P. Region has 21,765 households, which contain nearly 89 percent of the Region’s population. Family households compose 63.7 percent of this total, husband-wife households account for 48.7 percent of this total, male led households account for 4.9 percent and female led households 10.1 percent. Non-Family households make of 36.3 percent of the total households in the region. One-person households make up 30 percent of all the non-family households in the Region, a strong indicator of the aging population found in the Eastern U.P. The Region has an average household size of seven (7) persons and an average family size of eight (8) persons.
Table 5: Household Population - 2010
During the 2010 Census there were 36,606 total housing units in the Region, 59.5 percent of these units were occupied, 34 percent were seasonal housing units and the remainder were for rent, sale, rented or sold. There were 1,120 vacant units in the Region, or rather 3.1 percent of the total housing stock. The non-rental vacancy rate in the Region was 11 and the rental vacancy rate was 30 percent. The average household size of owner-occupied units was 7 persons and the average size of renter-occupied units was 6 persons.
Table 6: Housing Unit Characteristics – 2010
EUP
TOT %
Total Households 21,765 100.0%
Family All Types Total 13,867 63.7%
Households With Own Children <18 5,407 24.8%
Husband-Wife Total 10,601 48.7%
Families With Own Children <18 3,425 15.7%
Male Heads w/ Total 1,070 4.9%
no Spouse Present With Own Children <18 645 3.0%
Female Heads w/ Total 2,196 10.1%
no Spouse Present With Own Children <18 1,337 6.1%
Non-Family All Types 7,898 36.3%
Households One-Person Total 6,540 30.0%
Households Male (all ages) 3,209 14.7%
Male (age 65+) 932 4.3%
Female (all ages) 3,331 15.3%
Female (age 65+) 1,734 8.0%
Multi-Person With Members <Age 18 5,906 27.1%
Households With Members Age 65+ 6,555 30.1%
EUP
TOT %
Total Housing Units 36,606 100.0%
Occupied Units 21,765 59.5%
Vacant Units Total 14,841 40.5%
For Rent 623 1.7%
Rented 45 0.1%
For Sale 518 1.4%
Sold 102 0.3%
For Seasonal, Recreational, or Occasional Use 12,433 34.0%
Other Vacant Units 1,120 3.1%
-
Non-Rental Vacancy Rate 11
Rental Vacancy Rate 30
-
Total Occupied Housing Units 21,765 100.0%
Owner-Occupied Number of Units 16,005 73.5%
Number of Residents 37,678 67.0%
Average Household Size 7 0.0%
Renter-Occupied Number of Units 5,760 26.5%
Number of Residents 12,350 22.0%
Average Household Size 6

10
LABOR FORCE & UNEMPLOYMENT According to the Michigan Department of Labor and Economic Growth (DELEG), Local Area Unemployment
Statistics (LAUS), the labor force of the region was 25,982 during 2009. Chippewa County accounted for 66% of the
labor force, followed by Mackinac County at 23.5% and Luce County at 10.5%. During the period from 2000
through 2009, the Region’s labor force decreased by 4.1 percent. The Eastern U.P. Region employed 22,566
people during 2009, compared to 25,297 during 2000, a decrease of 10.8 percent.
Table 7 below displays data on the levels of employment in the EUP Region, dating back to 1990, during the twenty year period from 1990 through 2010, employment in the region grew by 8.4 percent, tempered somewhat by a decrease in employment of 9.2 percent between 2005 and 2009, coinciding with the national economic recession. Within the region, only Mackinac County experienced a decline in overall employment at -4.9 percent, while Chippewa and Luce County’s had increases in employment, at 13.7 and 9.0 percent respectively.
Table 7: Historic Total Employment
1990 1995 2000 2005 2008 2009 2010 % CH
1990-2010 % CH
2005-10
Chippewa 12,990 15,759 16,347 16,036 15,811 14,971 14,772 13.7% -7.9%
Luce 2,200 2,321 2,587 2,617 2,476 2,355 2,399 9.0% -8.3%
Mackinac 5,343 6,411 6,363 5,854 5,591 5,240 5,081 -4.9% -13.2%
EUP Region 20,533 24,491 25,297 24,507 23,878 22,566 22,252 8.4% -9.2%
Source: Employment Statistics, LAUS, www.milmi.org
Table 8: Monthly Labor Force – Eastern U.P., 2010
Monthly Labor Force
Chippewa JAN FEB MAR APRIL MAY JUNE JULY AUG SEP OCT NOV DEC
Labor Force 16,845 16,897 17,024 16,914 16,869 17,243 17,575 17,256 17,176 16,928 16,795 16,600
Unemployment 2,594 2,630 2,630 2,309 2,153 2,184 2,224 1,974 1,911 1,779 1,973 2,150
Unempl. Rate 15.4 15.6 15.4 13.7 12.8 12.7 12.7 11.4 11.1 10.5 11.7 13
Luce JAN FEB MAR APRIL MAY JUNE JULY AUG SEP OCT NOV DEC
Labor Force 2,653 2,671 2,671 2,658 2,687 2,717 2,742 2,718 2,652 2,583 2,614 2,575
Unemployment 417 401 405 378 337 337 348 349 357 319 358 375
Unempl. Rate 15.7 15 15.2 14.2 12.5 12.4 12.7 12.8 13.5 12.3 13.7 14.2
Mackinac JAN FEB MAR APRIL MAY JUNE JULY AUG SEP OCT NOV DEC
Labor Force 5,208 5,199 5,166 5,285 6,464 7,269 7,560 7,475 6,866 6,115 5,328 4,975
Unemployment 1,488 1,506 1,458 1,015 475 426 408 371 350 387 850 1,100
Unempl. Rate 28.6 29 28.2 19.2 7.3 5.9 5.4 5 5.1 6.3 16 21.9
Upper Peninsula JAN FEB MAR APRIL MAY JUNE JULY AUG SEP OCT NOV DEC
Labor Force 153,086 152,938 153,801 152,717 153,618 156,293 157,600 156,016 154,281 152,363 151,560 151,337
Unemployment 21,500 21,547 22,234 19,517 17,865 17,757 18,351 16,274 15,576 14,663 16,017 17,019
Unempl. Rate 14 14.1 14.5 12.8 11.6 11.4 11.6 10.4 10.1 9.6 10.6 11.2
Michigan JAN FEB MAR APRIL MAY JUNE JULY AUG SEP OCT NOV DEC
Labor Force 4,081,000 4,105,000 4,117,000 415,700 4,205,000 4,234,000 4,226,000 4,244,000 4,233,000 4,248,000 4,241,000 4,222,000
Unemployment 686,000 677,000 683,000 613,000 596,000 613,000 640,000 577,000 545,000 520,000 511,000 501,000
Unempl. Rate 14.4 14.2 14.2 12.9 12.4 12.6 13.2 12 11.4 10.9 10.8 10.6

11
Table 9, below, outlines the varying changes in labor force characteristics over the year. The District has remained
fairly constant in that it composes almost 17 percent of the entire Upper Peninsula Workforce. Between 2009 and
2010 the Eastern U.P. labor force shrunk by 0.8%, the same rate as the Upper Peninsula. While employment in the
district decreased by 0.3 percent, slightly less than the U.P. (at -0.7%), unemployment in the District increased by
6.2 percent during this time period, while the Upper Peninsula recorded a decrease in unemployment of 1.1
percent. During the decade covering 2000 through 2010, the District saw its labor force decrease by 4.8 percent, a
clip greater than that of the entire U.P., which saw a decrease of 1.4 percent, employment decreased precipitously
by 11.5% in the District, and similarly in the U.P. at -8.2 percent, and unemployment rose by 103%, a clip
significantly less than the 122 percent increase across the Upper Peninsula.
Table 9: Annual Labor Force Characteristics, Eastern U.P., 2000-2010
2000 2002 2004 2006 2008 2009 2010
# change
2009-10
% ch 2009-
10
# Ch. 2000-
10
% Ch.
2000-10
Chippewa
Labor Force 17,453 17,012 17,390 17,660 17,466 17,152 17,139 -13 -0.1% -314 -1.8%
Employment 16,347 15,660 14,845 16,179 15,786 14,850 14,807 -43 -0.3% -1,540 -9.4%
Unemployment 1,106 1,352 1,545 1,481 1,680 2,181 2,367 186 8.5% 1,261 114.0%
Unempl. Rate 6.3 7.9 8.9 8.5 9.6 12.7 13.8 1.1 8.7% 7.5 119.0%
Share of District Workforce 64.4 64.1 65.0 65.2 65.6 66.0 66.5 -- 0.7% -- 3.2%
Luce
Labor Force 2,753 2,894 2,857 2,862 2,776 2,715 2,689 -26 -1.0% -64 -2.3%
Employment 2,587 2,682 2,643 2,649 2,519 2,337 2,300 -37 -1.6% -287 -11.1%
Unemployment 166 212 214 213 257 360 389 29 8.1% 223 134.3%
Unempl. Rate 6.0 7.3 7.5 7.4 9.3 13.3 14.5 1.2 9.0% 8.5 141.7%
Share of District Workforce 10.2 10.9 10.7 10.6 10.4 10.4 10.4 -- 0.0% -- 2.6%
Mackinac
Labor Force 6,879 6,620 6,504 6,551 6,383 6,115 5,954 -161 -2.6% -925 -13.4%
Employment 6,363 6,007 5,862 5,932 5,642 5,260 5,269 9 0.2% -1,094 -17.2%
Unemployment 516 613 642 619 741 875 873 -2 -0.2% 357 69.2%
Unempl. Rate 7.5 9.3 9.9 9.4 11.6 14.3 14.7 0 2.8% 7.2 96.0%
Share of District Workforce 25.4 25.0 24.3 24.2 24.0 23.5 23.1 -- -1.9% - -9.1%
EUP Region
Labor Force 27,085 26,526 26,751 27,073 26,625 25,982 25,782 -200 -0.8% -1,303 -4.8%
Employment 25,297 24,349 23,350 24,760 23,947 22,447 22,376 -71 -0.3% -2,921 -11.5%
Unemployment 1,788 2,177 2,401 2,313 2,678 3,416 3,629 213 6.2% 1,841 103.0%
Unempl. Rate 6.6 8.2 9.0 8.5 10.1 13.1 14.1 1.0 7.1% 7.5 113.2%
Share of UP Workforce 17.4 17.2 17.0 16.9 16.8 16.8 16.8 -- 0.0% -- -3.5%
Upper Peninsula
Labor Force 155,933 154,139 157,114 160,431 158,949 155,012 153,801 -1,211 -0.8% -2,132 -1.4%
Employment 147,732 142,965 145,502 149,081 145,872 136,609 135,608 -1,001 -0.7% -12,124 -8.2%
Unemployment 8,201 11,174 11,612 11,350 13,077 18,403 18,193 -210 -1.1% 9,992 121.8%
Unempl. Rate 5.3 7.2 7.4 7.1 8.2 11.9 11.8 -0.1 -0.8% 6.5 122.6%
Share of State Workforce 3.0 3.1 3.1 3.2 3.2 3.2 3.2 -- 0 -- 6.7
Source: Michigan Department of Labor & Economic Growth, Unemployment Statistics (LAUS), www.milmi.org
*Not seasonally adjusted

12
EMPLOYMENT FORECAST
Employment forecasts for the Eastern U.P. Region project that Service, Health Care and Professional occupations
will lead the way in job creation through 2016. Service occupations are expected to grow by 7.2 percent (or 2,115
jobs), Health Care by 14 percent (1,765 jobs) and Professional by 7 percent (1,500 jobs).
Table 10: Employment Forecast by Major Occupation Category - 2006 - 2016 - UP MWA
Occupational Category
2006 2016 Employment Growth
Number Percent
Total, All Occupations 142,715 149,185 6,470 4.5
Management 7,760 7,855 95 1.2
Professional 21,445 22,945 1,500 7
Health Care 12,580 14,345 1,765 14
Service 29,490 31,605 2,115 7.2
Sales 14,350 14,795 445 3.1
Administrative Support 21,750 21,870 120 -3
Farming, Forestry and Fishing 1,765 1,710 -55 -3.1
Construction and Repair 14,790 15,260 470 3.2
Production 9,585 9,635 50 0.5
Transportation 9,195 9,175 -20 -0.2 Source: “Annual Planning Information Report—PY 2010, Eastern Upper Peninsula MWA”, Source: Michigan Department of Labor and Economic
Growth, Bureau of Labor Market Information and Strategic Initiatives
REGIONAL UNEMPLOYMENT
Figure one (below) depicts the unemployment rates of the Counties in the Eastern U.P., the State of Michigan and the United States from 2000 through 2010. All geographic areas experienced their lowest unemployment rates during 2000. During 2009 the State of Michigan posted its’ highest unemployment mark during this 10 year period, with a slight decrease following during 2010. This was not the case for the three counties in the Eastern U.P. which all saw unemployment rates edge higher during 2010, continuing an upward trend that began during 2008. The EUP continues to experience higher levels of unemployment than both the State and National average rates and significantly higher seasonal unemployment. Table 7 displays unemployment rates for the Region, State and Nation during a period spanning 2002 through 2010, while unemployment has increased significantly during this time period, the increases experienced at the Regional level are significantly lower than the increase of 111.3% at the State level. This can be attributed to a somewhat insulated economy in the Region that is not heavily dependent upon the automobile manufacturing sector for high concentrations of employment.
Table 11: Unemployment Rates (%) - 2002-2010 EUP MWA
2002 2004 2006 2008 2009 2010
Avg.
Annual
Unemp.
2002-2010
Percent
Change
8.2 9.0 8.8 9.0 13.7 14.1 9.7 71.95%
7.9 8.9 8.4 9.8 12.8 13.8 9.6 74.68%
7.3 7.5 7.5 9.7 13.6 14.5 9.1 98.63%
9.3 9.9 9.5 12.1 14.7 14.7 11.1 58.06%
6.2 7.1 6.8 7.2 14.0 13.1 8.3 111.29%
5.8 5.5 4.6 5.8 9.3 9.6 6.2 65.52%
Source: “Annual Planning Information Report—PY 2010, Eastern Upper Peninsula MWA”, Source: Michigan Department of Labor and Economic
Growth, Bureau of Labor Market Information and Strategic Initiatives
Michigan
United States
Area Name
Eastern Upper Pen. MWA
Chippewa County
Luce County
Mackinac County

13
Figure 1: Unemployment Trends, EUP 2000-2010
During 2010 the Region experienced a fairly typical trend of seasonal high unemployment rates that typically begin
in late fall (November) through early spring (May), however at a much higher than normal rate, attributing to
higher annual average unemployment rates, which continued a trend that began during the national economic
downturn in 2008, and subsequent recession
Figure 2: EUP Unemployment Rates, 2010

14
Figure 3: EUP Unemployment Percent Change, 2002-2010
WAGES AND INCOME Per Capita Personal Income Listed below in Table 8 are the Per Capita Income levels found in the Region between 1977 and 2008, during the 30-year period the average PCPI of the region increased by 43.1 percent in the Region, which compares favorably to 30-year data at the State and National PCPI. Unfortunately, income levels in the Region continue to lag far behind those at the State and National level, in 2008 the Region had a PCPI that was 26% less than the State and 66% of the National Income levels.
Table 12: EUP Per Capita Income 1977-2008
EasternUpper Pen.
MWA
ChippewaCounty
Luce County MackinacCounty
Michigan UnitedStates
71.95% 74.68%
98.63%
58.06%
111.29%
65.52%
Percent Change - EUP Unemployment 2002-2010
2002-2010 Percent Change
Area 2008 2007 1997 1987 1977
10-year
% change
20-year
% change
30-year
% change
Chippewa $24,586 $22,708 $21,542 $19,148 $17,248 5.4 18.6 42.5
% of US PCPI 61% 56% 60% 61% 63%
Luce $22,158 $20,121 $23,186 $24,567 $20,146 -13.2 -18.1 9.9
% of US PCPI 55% 50% 64% 78% 74%
Mackinac $32,957 $30,222 $28,970 $22,642 $18,339 4.3 33.5 79.7
% of US PCPI 82% 75% 80% 72% 67%
EUP Region $26,567 $24,351 $24,566 $22,119 $18,578 8.2 20.1 43.1
% of US PCPI 66% 61% 68% 71% 68%
MICHIGAN $34,953 $34,949 $35,536 $30,747 $29,059 -1.7 13.7 20.3
% of US PCPI 87% 87% 99% 98% 107%
NATIONAL $40,166 $40,217 $36,004 $31,374 $27,209 11.7 28.2 32.3

15
Figure 4: Per Capita Income Trends
Average Weekly Wages When analyzing the employment and income demographics for the Eastern U.P. Region, it is important to discuss the private sector employment when compared to public sector employment. Table 8 below displays the number of establishments of each type, average employment throughout the calendar year, the total and average weekly wages, how each of these categories compares in a percentage value. Private sector establishments account for over 87 percent of the establishments with employment in the region, however, public sector employment accounts for over 60% of the total wages, and jobs in the public sector typically earn over 127 percent more than the average weekly wage in the region for all jobs. Public sector or government employment is a huge opportunity that the region has availed itself to, with the closure of former military installations and conversion of those facilities into State Correctional Facilities. In addition, the location of the region’s only four year State University (Lake Superior St. Univ.) in Sault Ste. Marie also contributes to the higher level of Public employment and wages experienced in the Region.
Table 13: Census of Employment and Wages - 2009
YR Area Industry # of Est. Ave
Emp. Tot Wage
Avg. Wkly. Wage
% TOT EST
% TOT EMP
% TOT WAGE
% AVG WAGE
2009 EUP Private Total 1,403 10,364 $273,990,821 $485 87.3% 54.5% 39.4% 72.8%
2009 EUP Public Total 204 8,638 $421,650,055 $847 12.7% 45.5% 60.6% 127.2%
REGION
TOTAL 1,607 19,002 $695,640,876 $666 100.0% 100.0% 100.0% 100.0%
Source: QCEW, ES202 Data, www.milmi.org
0
10
20
30
40
50
60
70
80
90
Axi
s Ti
tle
Axis Title
Per Capita Income 30-Year Trend
10-year % change
20-year % change
30-year % change

16
EASTERN U.P. INDUSTRY GROUPS AND CLUSTERS
EUP Location Quotients
Location quotients are a relatively new tool that allows us to analyze the region’s economic base. This data
compares how specialized the region is in particular industries when compared to the State or Nation. A location
quotient above “1” indicates some level of specialization; the greater the value above one, the higher the level of
specialization. The 2009 Local Quotients were derived from the United States Department of Labor, Bureau of
Labor Statistics for the NAICS codes listed.
The table below on percentage of employment allows us to make broad assumptions of the employment
concentrations in the region versus what is found at the state level and closely corresponds to the local quotient
information. This information allows us to being the formation and implementation of strategies targeted towards
specific clusters (advanced manufacturing, tourism, etc.).
Industry concentrations are geographically proximate and interconnected businesses and institutions that
strengthen and enhance a region’s competitive advantage. Related industries are sources of research,
development and knowledge exchange; are consumers and supporters of a regional, trained workforce; and may
be mutual suppliers and consumers of goods and services. Related institutions support these industries’ growth by
providing workforce training, marketing, financing, research, and other forms of support through associations and
networks. By strengthening and enhancing a region’s competitive advantage, industry concentrations are
important drivers of economic growth and prosperity in the global Knowledge Economy.
Targeted public and private investment in industry concentrations and their related, supportive infrastructure may
yield new market opportunities that result in higher incomes and population and employment growth.
Table 14: Percentage of Employment By NAICS Code
Source: YourEconomy.org
Percentage of Employment Michigan
Chippewa
County
Luce
County
Mackinac
County
Unclassified 0.62% NC NC NC
NAICS 11 Ag/Forest/Fish/Hunt 0.83% 0.82% 6.24% ND
NAICS 21 Mining 0.17% 0.39% NC NC
NAICS 22 Utilities 0.62% 1.64% NC NC
NAICS 23 Construction 3.90% 5.30% 7.08% 6.62%
MAICS 31-33 Manufacturing 14.65% 7.80% 4.92% 3.51%
NAICS 42 Wholesale Trade 4.76% 2.52% 5.40% ND
NAICS 44-45 Retail Trade 14.12% 26.95% 26.41% 15.57%
NAICS 48-49 Transportation and Warehousing 2.80% 2.07% 2.52% 6.44%
NAICS 51 Information 1.73% 2.15% ND 0.70%
NAICS 61 Educational Services 1.95% 1.65% NC ND
NAICS 62 Health Care and Social Assistance 16.58% 12.19% 5.64% ND
NAICS 71 Arts, Enterntainment, and Recreation 1.81% 1.83% 0.84% 2.05%
NAICS 52 Finance and Insurance 4.25% 4.54% 9.24% 2.14%
NAICS 53 Real Estate and rental and leasing 1.53% 1.06% 2.28% 0.89%
NAICS 54 Professional and technical services 6.93% 2.60% 1.44% 1.25%
NAICS 55 Managemet of Companies and enterprises 1.61% ND ND NC
NAICS 56 Administrative and waste services 7.22% ND 0.48% 6.68%
NAICS 72 Accommodation and food services 10.08% 18.76% 20.29% 37.48%
NAICS 81 Other services, excp. Public admin. 3.84% 4.24% 5.52% 2.35%
NAICS 99 Unclassified 0.62% NC NC NC
17
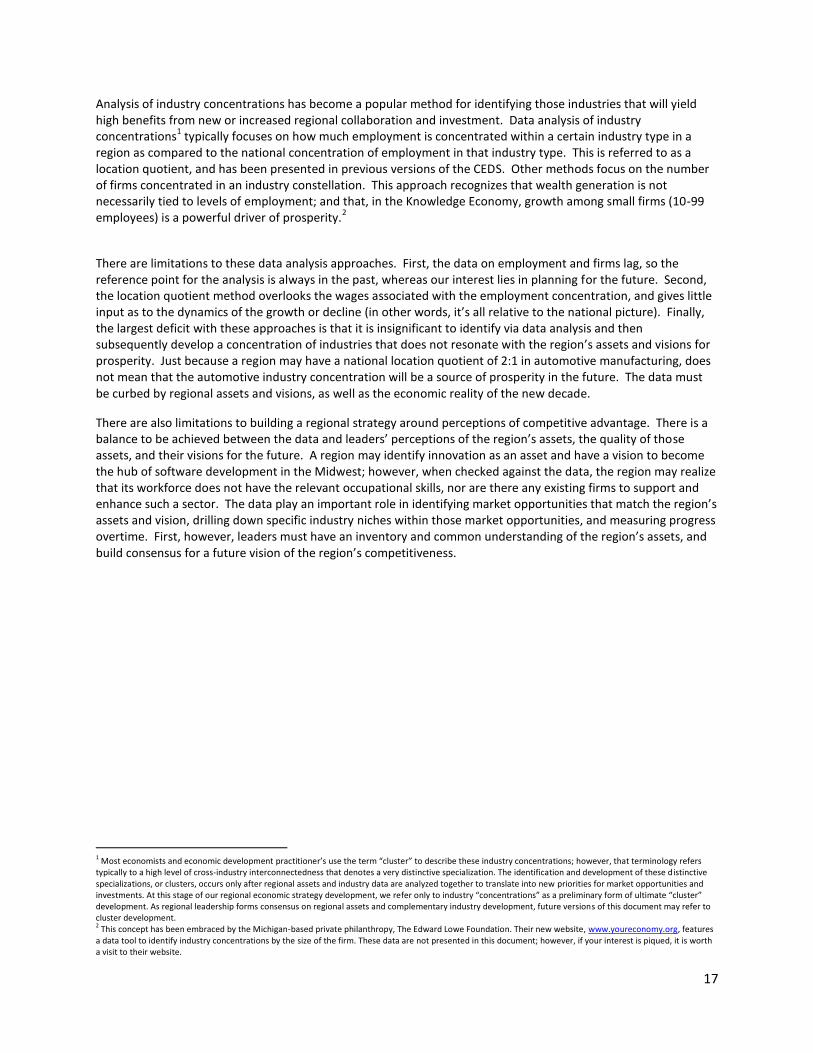
Analysis of industry concentrations has become a popular method for identifying those industries that will yield high benefits from new or increased regional collaboration and investment. Data analysis of industry concentrations
1 typically focuses on how much employment is concentrated within a certain industry type in a
region as compared to the national concentration of employment in that industry type. This is referred to as a location quotient, and has been presented in previous versions of the CEDS. Other methods focus on the number of firms concentrated in an industry constellation. This approach recognizes that wealth generation is not necessarily tied to levels of employment; and that, in the Knowledge Economy, growth among small firms (10-99 employees) is a powerful driver of prosperity.
2
There are limitations to these data analysis approaches. First, the data on employment and firms lag, so the reference point for the analysis is always in the past, whereas our interest lies in planning for the future. Second, the location quotient method overlooks the wages associated with the employment concentration, and gives little input as to the dynamics of the growth or decline (in other words, it’s all relative to the national picture). Finally, the largest deficit with these approaches is that it is insignificant to identify via data analysis and then subsequently develop a concentration of industries that does not resonate with the region’s assets and visions for prosperity. Just because a region may have a national location quotient of 2:1 in automotive manufacturing, does not mean that the automotive industry concentration will be a source of prosperity in the future. The data must be curbed by regional assets and visions, as well as the economic reality of the new decade.
There are also limitations to building a regional strategy around perceptions of competitive advantage. There is a balance to be achieved between the data and leaders’ perceptions of the region’s assets, the quality of those assets, and their visions for the future. A region may identify innovation as an asset and have a vision to become the hub of software development in the Midwest; however, when checked against the data, the region may realize that its workforce does not have the relevant occupational skills, nor are there any existing firms to support and enhance such a sector. The data play an important role in identifying market opportunities that match the region’s assets and vision, drilling down specific industry niches within those market opportunities, and measuring progress overtime. First, however, leaders must have an inventory and common understanding of the region’s assets, and build consensus for a future vision of the region’s competitiveness.
1 Most economists and economic development practitioner’s use the term “cluster” to describe these industry concentrations; however, that terminology refers
typically to a high level of cross-industry interconnectedness that denotes a very distinctive specialization. The identification and development of these distinctive specializations, or clusters, occurs only after regional assets and industry data are analyzed together to translate into new priorities for market opportunities and investments. At this stage of our regional economic strategy development, we refer only to industry “concentrations” as a preliminary form of ultimate “cluster” development. As regional leadership forms consensus on regional assets and complementary industry development, future versions of this document may refer to cluster development. 2 This concept has been embraced by the Michigan-based private philanthropy, The Edward Lowe Foundation. Their new website, www.youreconomy.org, features a data tool to identify industry concentrations by the size of the firm. These data are not presented in this document; however, if your interest is piqued, it is worth a visit to their website.
18
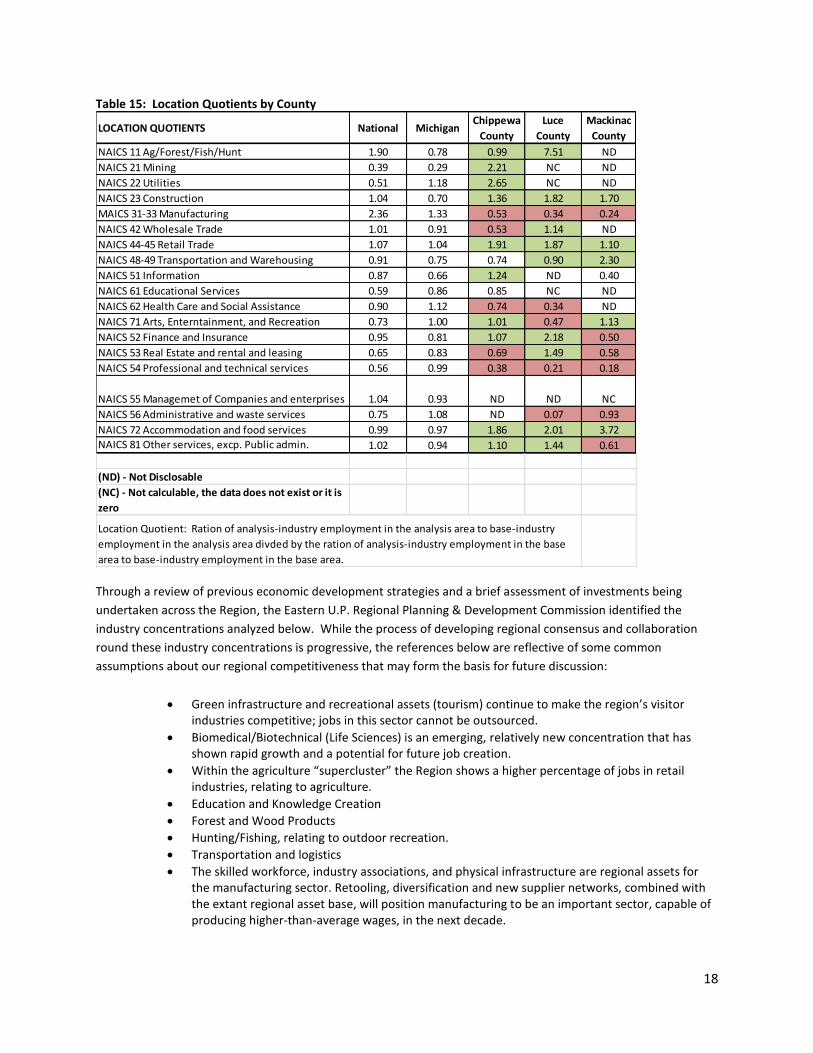
Table 15: Location Quotients by County
Through a review of previous economic development strategies and a brief assessment of investments being
undertaken across the Region, the Eastern U.P. Regional Planning & Development Commission identified the
industry concentrations analyzed below. While the process of developing regional consensus and collaboration
round these industry concentrations is progressive, the references below are reflective of some common
assumptions about our regional competitiveness that may form the basis for future discussion:
Green infrastructure and recreational assets (tourism) continue to make the region’s visitor industries competitive; jobs in this sector cannot be outsourced.
Biomedical/Biotechnical (Life Sciences) is an emerging, relatively new concentration that has shown rapid growth and a potential for future job creation.
Within the agriculture “supercluster” the Region shows a higher percentage of jobs in retail industries, relating to agriculture.
Education and Knowledge Creation
Forest and Wood Products
Hunting/Fishing, relating to outdoor recreation.
Transportation and logistics
The skilled workforce, industry associations, and physical infrastructure are regional assets for the manufacturing sector. Retooling, diversification and new supplier networks, combined with the extant regional asset base, will position manufacturing to be an important sector, capable of producing higher-than-average wages, in the next decade.
LOCATION QUOTIENTS National MichiganChippewa
County
Luce
County
Mackinac
County
NAICS 11 Ag/Forest/Fish/Hunt 1.90 0.78 0.99 7.51 ND
NAICS 21 Mining 0.39 0.29 2.21 NC ND
NAICS 22 Utilities 0.51 1.18 2.65 NC ND
NAICS 23 Construction 1.04 0.70 1.36 1.82 1.70
MAICS 31-33 Manufacturing 2.36 1.33 0.53 0.34 0.24
NAICS 42 Wholesale Trade 1.01 0.91 0.53 1.14 ND
NAICS 44-45 Retail Trade 1.07 1.04 1.91 1.87 1.10
NAICS 48-49 Transportation and Warehousing 0.91 0.75 0.74 0.90 2.30
NAICS 51 Information 0.87 0.66 1.24 ND 0.40
NAICS 61 Educational Services 0.59 0.86 0.85 NC ND
NAICS 62 Health Care and Social Assistance 0.90 1.12 0.74 0.34 ND
NAICS 71 Arts, Enterntainment, and Recreation 0.73 1.00 1.01 0.47 1.13
NAICS 52 Finance and Insurance 0.95 0.81 1.07 2.18 0.50
NAICS 53 Real Estate and rental and leasing 0.65 0.83 0.69 1.49 0.58
NAICS 54 Professional and technical services 0.56 0.99 0.38 0.21 0.18
NAICS 55 Managemet of Companies and enterprises 1.04 0.93 ND ND NC
NAICS 56 Administrative and waste services 0.75 1.08 ND 0.07 0.93
NAICS 72 Accommodation and food services 0.99 0.97 1.86 2.01 3.72
NAICS 81 Other services, excp. Public admin. 1.02 0.94 1.10 1.44 0.61
(ND) - Not Disclosable
(NC) - Not calculable, the data does not exist or it is
zero
Location Quotient: Ration of analysis-industry employment in the analysis area to base-industry
employment in the analysis area divded by the ration of analysis-industry employment in the base
area to base-industry employment in the base area.
19
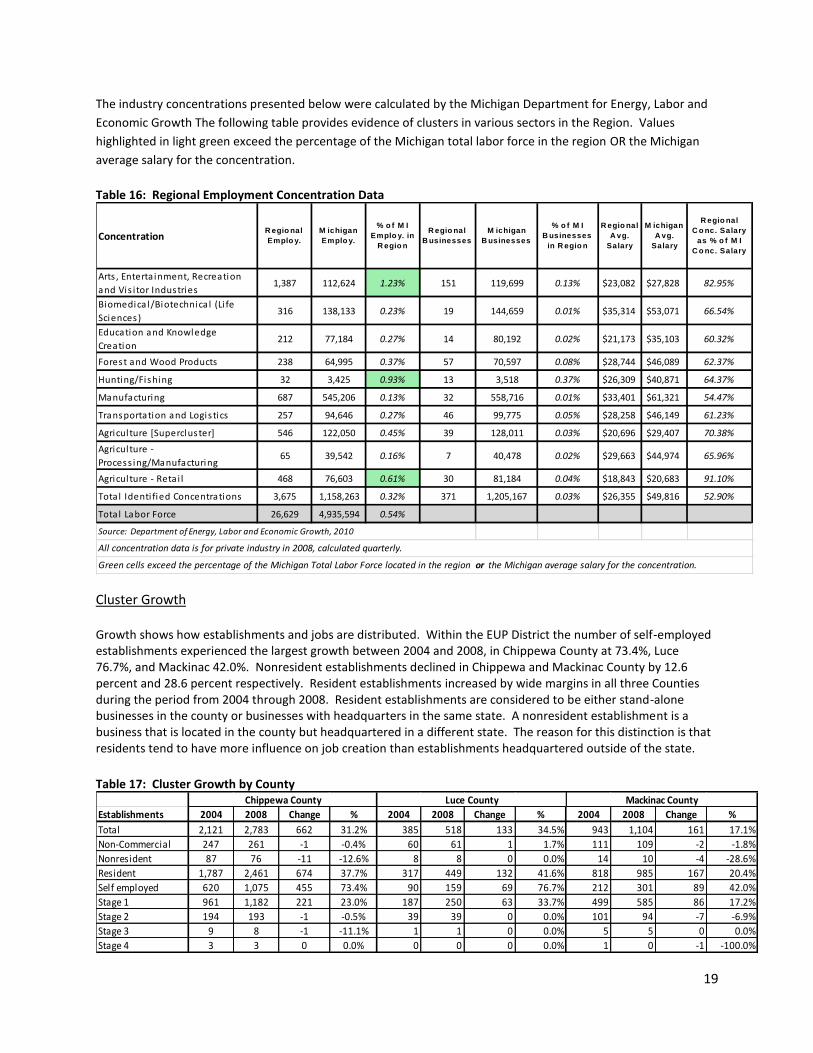
The industry concentrations presented below were calculated by the Michigan Department for Energy, Labor and
Economic Growth The following table provides evidence of clusters in various sectors in the Region. Values
highlighted in light green exceed the percentage of the Michigan total labor force in the region OR the Michigan
average salary for the concentration.
Table 16: Regional Employment Concentration Data
Cluster Growth Growth shows how establishments and jobs are distributed. Within the EUP District the number of self-employed establishments experienced the largest growth between 2004 and 2008, in Chippewa County at 73.4%, Luce 76.7%, and Mackinac 42.0%. Nonresident establishments declined in Chippewa and Mackinac County by 12.6 percent and 28.6 percent respectively. Resident establishments increased by wide margins in all three Counties during the period from 2004 through 2008. Resident establishments are considered to be either stand-alone businesses in the county or businesses with headquarters in the same state. A nonresident establishment is a business that is located in the county but headquartered in a different state. The reason for this distinction is that residents tend to have more influence on job creation than establishments headquartered outside of the state.
Table 17: Cluster Growth by County
Arts , Enterta inment, Recreation
and Vis i tor Industries1,387 112,624 1.23% 151 119,699 0.13% $23,082 $27,828 82.95%
Biomedica l/Biotechnica l (Li fe
Sciences)316 138,133 0.23% 19 144,659 0.01% $35,314 $53,071 66.54%
Education and Knowledge
Creation212 77,184 0.27% 14 80,192 0.02% $21,173 $35,103 60.32%
Forest and Wood Products 238 64,995 0.37% 57 70,597 0.08% $28,744 $46,089 62.37%
Hunting/Fishing 32 3,425 0.93% 13 3,518 0.37% $26,309 $40,871 64.37%
Manufacturing 687 545,206 0.13% 32 558,716 0.01% $33,401 $61,321 54.47%
Transportation and Logis tics 257 94,646 0.27% 46 99,775 0.05% $28,258 $46,149 61.23%
Agriculture [Supercluster] 546 122,050 0.45% 39 128,011 0.03% $20,696 $29,407 70.38%
Agriculture -
Process ing/Manufacturing65 39,542 0.16% 7 40,478 0.02% $29,663 $44,974 65.96%
Agriculture - Retai l 468 76,603 0.61% 30 81,184 0.04% $18,843 $20,683 91.10%
Total Identi fied Concentrations 3,675 1,158,263 0.32% 371 1,205,167 0.03% $26,355 $49,816 52.90%
Total Labor Force 26,629 4,935,594 0.54%
Source: Department of Energy, Labor and Economic Growth, 2010
All concentration data is for private industry in 2008, calculated quarterly.
Green cells exceed the percentage of the Michigan Total Labor Force located in the region or the Michigan average salary for the concentration.
% o f M I
Emplo y. in
R egio nConcentration
R egio nal
Emplo y.
M ichigan
Emplo y.
R egio nal
B usinesses
M ichigan
B usinesses
% o f M I
B usinesses
in R egio n
R egio nal
A vg.
Salary
M ichigan
A vg.
Salary
R egio nal
C o nc. Salary
as % o f M I
C o nc. Salary
Establishments 2004 2008 Change % 2004 2008 Change % 2004 2008 Change %
Total 2,121 2,783 662 31.2% 385 518 133 34.5% 943 1,104 161 17.1%
Non-Commercial 247 261 -1 -0.4% 60 61 1 1.7% 111 109 -2 -1.8%
Nonresident 87 76 -11 -12.6% 8 8 0 0.0% 14 10 -4 -28.6%
Resident 1,787 2,461 674 37.7% 317 449 132 41.6% 818 985 167 20.4%
Self employed 620 1,075 455 73.4% 90 159 69 76.7% 212 301 89 42.0%
Stage 1 961 1,182 221 23.0% 187 250 63 33.7% 499 585 86 17.2%
Stage 2 194 193 -1 -0.5% 39 39 0 0.0% 101 94 -7 -6.9%
Stage 3 9 8 -1 -11.1% 1 1 0 0.0% 5 5 0 0.0%
Stage 4 3 3 0 0.0% 0 0 0 0.0% 1 0 -1 -100.0%
Chippewa County Luce County Mackinac County

20
INFORMATION AND COMMUNICATIONS TECHNOLOGY JOBS
In the 2010 Revised CEDS 5 Year Plan we presented the number of Information and Communications Technology
(ICT) cluster jobs in the Region. This cluster is the circulatory system needed by knowledge economy business, in
order to breathe and function. Providing vital services like high-speed internet access, telecommunications
services, data networks, and computer software development and support is critical. This cluster includes jobs in
cable television, telecommunications (including Internet Services Providers), computer services and design, and
information services (NAICS codes 5152, 517, 518, 519 and 5415). Rates per 1,000 workers are based on total
employment in all NAICS sectors for the Region. Jobs in this cluster increased by 6.2 percent from 20008 to 2009,
while the state experienced a decrease of 5.4 percent in the same cluster during this time period.
Table 18: ICT Jobs in the Region, 2009
HEALTH CARE JOBS
Health care is grouped with social assistance at the broadest NAICS code level (62). However, Health Care is
defined more specifically here by using NAICS codes 621-623 (ambulatory health care services, hospitals, and
nursing and residential care facilities). Rates per 1,000 workers are based on the total employment in all NAICS
sectors in each region.
Table 19: Health Care Jobs in the Region, 2009
Jobs in the health care industry grew by 6.4 percent from 2008 to 2009, at a rate almost triple the percent change
found throughout the rest of the State of Michigan. It is also worthwhile to note that in 2009 the average weekly
wages in the health care industry were $58 per week higher than the State average weekly wage. The Health Care
industry continues to rank highly in terms of the total number of employees at the region’s three major hospitals:
War Memorial in Sault Ste. Marie, Helen Newberry Joy in Newberry and Straits Hospital in St. Ignace. Spin off
employment in related occupations is growing as these major medical centers continue to add services and expand
their facilities.
Year Category Eastern UP EUP %
CHMichigan MI %
CH
2008 ICT Jobs 81 -6.9% 75,152 -1.1%
2009 ICT Jobs 86 6.2% 71,094 -5.4%
2009 Per 1,000 workers 4.5 18.83
Source: Bureau of Labor Statistics, QCEW, Prelim 2009
Year Category Employment% CH
AVG
WAGE
JOBS/
1000Employment
% CH
AVG
WAGE
JOBS/
1,000
2008Health
Care311 -0.3% 822.67 16.39 178,887 1.7%
851.00 47.4
2009Health
Care331 6.4% 897.33 17.40 182,935 2.3% 839.00
48.5
Source: Bureau of Labor Statistics, QCEW, Prelim 2009
Eastern U.P. Michigan

21
TRANSPORTATION NETWORK The Eastern U.P. Region is home to two of the State’s four major bridge crossings, the Mackinac Bridge which
spans the Straits of Mackinac between the Upper and Lower Peninsulas, and the International Bridge which spans
between Michigan and Ontario, Canada. These unique crossing points permit vehicular traffic and movement of
freight and goods intra/inter-state and internationally.
Mackinac Bridge During 2010 the Mackinac Bridge has experienced increased traffic during nine months of the year, ending the year with an overall 1.8 percent increase compared to 2009. In large part due to a recent fare increase schedule, revenues have increased rapidly, the fare increase schedule was implemented to provide funding for continued maintenance and capital improvements to the bridge, which is in alignment with the long-term preservation strategy adopted by the Mackinac Bridge Authority. Since October of 2006, Bridge traffic has decreased 6.8 percent, while revenues have increased 31 percent primarily due to an incremental toll adjustment schedule, which was implemented in 2008; this incremental adjustment schedule runs through 2014, as follows: toll increase to $3.50 in 2010, $4.00 in 2012 and $4.50 in 2014. This schedule was adopted after a series of public hearings in December, 2007, as opposed to a one-time rate adjustment.
International Bridge The International Bridge’s marks a convenient location for commercial movement of goods from Northeastern and Eastern Ontario, due to its close proximity to the Trans-Canada Highway. The crossing is connected directly to the Region’s lone Interstate Highway 75, and to Michigan 28, a major east-west highway, which runs south of Lake Superior into Wisconsin and Minnesota. The International Bridge plays a vital role in the well-being of both Soo communities and serves as an essential transportation link to the steel, paper, and forest industries, tourism-reliant businesses and to the general public for work, recreation and shopping purposes. During 2010, over 1.8 million vehicles crossed the Bridge. The Table below outlines the number of vehicle crossings from 2005 through November, 2009. During this time period vehicle crossings have decreased by35 percent, some in large part due to the new Passport requirements for U.S. citizens traveling to Canada, which has resulted in additional screening of travelers entering in the U.S. and corresponding longer waits at the customs check points to gain entry. While there appears to be great fluctuations in the average monthly revenues, readers are forewarned that the continual change in the value of the Canadian dollar contributes heavily to this fluctuation and actual vehicular crossings are the best indicator of trends for the International Bridge.

22
Table 20: Bridge Traffic Statistics
MACKINAC BRIDGE TRAFFIC STATS
YEAR AVG TRAFFIC % CHANGE AVG REVENUE % CHANGE
2010 329,006 1.8 $1,601,320 25.0%
2009 323,115 1.3% $1,281,121 0.7%
2008 318,879 -5.7% $1,271,679 11.1%
2007 338,054 4.2% $1,145,031 -3.9%
2006 324,289 -8.1% $1,191,959 -2.7%
2005 353,041 na $1,225,226
Source: Mackinac Bridge Authority
INTERNATIONAL BRIDGE TRAFFIC STATS
YEAR AVG TRAFFIC % CHANGE AVG REVENUE % CHANGE
2010 152389 9.2 $569,167 32.6%
2009 139,482 -12.2% $429,167 1.4%
2008 158,895 -0.5% $423,433 1.5%
2007 159,626 0.2% $417,053 21.3%
2006 159,278 -0.8% $343,876 -5.3%
2005 160,555 -31.8% $363,174 -0.4%
1999 235,563 na $364,509 na
Source: International Bridge Authority
INTERNATIONAL BRIDGE COMMERCIAL TRAFFIC
YEAR
COMMERCIAL
TRAFFIC % CHANGE % OF TOTAL
2010 99551 3.3 5.4%
2009 102836 -10.9 6.1%
2008 115,435 3.7% 6.1%
2007 111,335 -9.3% 5.8%
2006 122,804 -7.1% 6.4%
2005 132,172 -7.0% 6.9%
2004 142,174 13.5% 7.7%
2003 125,302 -0.6% 6.6%
2002 126,037 -26.5% 6.0%
2001 171,377 17.3% 5.4%
2000 146,054 -0.6% 5.2%
1999 147,000 na 5.1%
Source: International Bridge Authority

23
Figure 5: Annual Bridge Traffic 2006-2010
Figure 6: Commercial Truck Flows, International Bridge
-15
-10
-5
0
5
10
15
2006 2007 2008 2009 2010
Pe
rce
nt
Ch
ange
Annual Bridge Traffic 2006-2010
Mackinac
International

24
CHAPTER 3: ACTION PLAN
EVALUATION OF CURRENT ACTIVITIES
Goal 1: Promote the creation of stable, diversified, year-round employment in the Eastern Upper Peninsula.
Ac tiv i ty T ime Per iod
1. Maintain Economic Development District status for the EUP Region. Development of Annual CEDS Updates and Revised CEDS Plans every five years (2015, 2020, etc.)
2. Provided support to Frontier Renewable Resources as they proceed with development of a Cellulosic Ethanol Refinery in Kinross Charter Twp.
3. Assisted in development of a Signature Buildings grant application for Clark Twp.
4. Provided support to the City of Sault Ste. Marie EDC in the pursuit of a $1.325 million EDA PW grant.
5. Responded to numerous small business requests for assistance. 6. Provided support to Portage Township on their successful CDBG ICE grant
application and award of $250,000. 7. Regional Broadband Development Effort
Ongoing
2010-2013
2010-2011
2009-2011
Ongoing 2010-2011
Ongoing
Goal 2: Encourage community development planning that is effective in leading to the development of
essential infrastructure; utilizing mechanisms which support desired growth in local communities.
Ac tiv i ty T ime Per iod 1. Completed work on the Pickford Township Master Plan update. 2. Providing support on updates to the Bay Mills, Dafter, Marquette and Portage
Township Master Plan updates. 3. Provided assistance on the Marquette Township Zoning Ordinance
Amendment to allow for commercial scale wind development in the Township.
4. Continued to serve on the Regional Workforce Development Board of Directors.
5. Submitted completed Revised CEDS 2010-2015 report. 6. Executive Director elected to the Michigan Association of Planning Board of
Directors. 7. Wrote a successful Coastal Zone Management Grant for $23,000 to inventory
recreation assets along Lake Huron and the St. Mary’s River. 8 . Completed a Regional Growth Strategy for the EUP. 9 . Applied for funding to update the Regional Hazard Mitigation Plans for
Chippewa, Luce and Mackinac County’s. 1 0 . Completed the Communication Assets Survey and Mapping Tool project for the
Region’s E911 Offices. 1 1 . Continue to maintain State Data Center affiliation. by providing demographic
data to member units of government in the Eastern UP.
2 0 1 0 - 2 0 1 1 2 0 1 0 - 2 0 1 2
2 0 1 0
2 0 1 0 - 2 0 1 1
2 0 1 0 2 0 1 0 - 2 0 1 3
2 0 1 1
2 0 1 0 2 0 1 0
2 0 1 0
O n g o i n g / A n n u a l

25
Goal 3: The District supports the development of an efficient system of roads and highways and other
modes of transportation.
Ac tiv i ty T ime Per iod 1 . M a i n t a i n t h e R e g i o n ’ s s t a t u s w i t h M D O T a s t h e R u r a l
T r a n s p o r t a t i o n P l a n n i n g O r g a n i z a t i o n f o r t h e E U P . 2. The RPC coordinated with MDOT to conduct Elected Officials, Five-Year Plan input
and various other public comment sessions across the Region on transportation plans for the upcoming five year period.
3. The Commission completed the M-134 Corridor Management Plan for the designation of this corridor as a State Recreational Heritage Route.
4. Continued to provide assistance to the M-123 Tahquamenon Scenic Heritage Route Committee.
5. Provides assistance to Safe Routes to School groups across the region. 6 . Continues to be involved in the Strategic Alliance for Health initiative with the Sault
Ste. Marie Tribe of Chippewa Indians. 7 . Continued administration of the Regional Asset Management program. 8 . The Commission provided leadership within the Region on the designation of a
regional route for US Bike Route 35.
2 0 1 0 - 2 0 1 1
2 0 1 0 - 2 0 1 1
2 0 1 0
2 0 1 0 - 2 0 1 1
2 0 1 0 - 2 0 1 1 2 0 1 0 - 2 0 1 1
O n g o i n g
2 0 1 0 - 2 0 1 1
Goal 4: Maximize the use of existing recreation and cultural resources and further develop their potential as
an important element of the area’s economy. The area’s recreational resources attract tourists, and play a key
role in industrial and commercial recruitment.
Ac tiv i ty T ime Per iod 1. Continues to administer the MCACA Mini re-granting program across the Region for
Arts and Cultural projects. 2. Assisted Portage Township with mapping products for their updated Recreation
Plan. 3 . Provided Drummond Island Township with a technical review of their updated
Township Recreation Plan. 4 . Provided a technical review of the Luce County Recreation Plan.
2010-211
2010-2011
2011
2011
Goal 5: Preserve and enhance the viability of Eastern Upper Peninsula communities’ downtown districts.
1. Administering the Portage Twp. ICE grant, of which a portion of the funds were used to make drainage improvements along Main Street in downtown Curtis.
2. Continued technical assistance to the Chippewa County Building a Healthy Community initiative and the development of a walking “lunch-loop” in downtown Sault Ste. Marie.
2 0 1 0 - 2 0 1 2
2 0 1 1
Goal 6: Rehabilitation and maintenance for existing facilities should be ensured.
Ac tiv i ty T ime Per iod 1. Provided support to the City of Sault Ste. Marie EDC in the pursuit of a $1.325
million EDA PW grant to rehabilitate the Industrial Incubator facility. 2. City of St. Ignace DDA Signature Buildings Grant
2 0 1 0 - 2 0 1 1
2 0 1 0

26
Goal 7: Promote natural resource protection and environmental quality
Ac tiv i ty T ime Per iod 1. Wrote a successful Coastal Zone Management Grant for $23,000 to inventory
recreation assets along Lake Huron and the St. Mary’s River. 2. Assisted Potage Twp. with the completion of their Recreation Master Plan. 3. Applied for funding through the NOAA Great Lakes Restoration Initiative to provide
design and engineering plans for the Little Rapids restoration effort on the St. Marys River.
4. Development of Community Wildfire Protection Plans for Whitefish Township and Luce County.
2 0 1 0 - 2 0 1 2
2 0 1 1
2 0 1 1
2 0 1 0 - 2 0 1 1
Goal 8: Promote regional collaboration amongst economic development organizations both within and
across District boundaries.
Ac tiv i ty T ime Per iod 1. Attended and collaborated on a half-day seminar related to exporting. 2. Provided assistance and support on an MSU CCED EDA application for grant funding
to further research the expansion of exporting in the EUP Region.
3. Assisted in coordinating a meeting between the UPEDA and Sault Ontario Economic Development Officials.
4. Participating in a Recreation Assets Collaborative with NWMICOG and NEMCOG. 5. Western U.P. Planning & Development Region (WUPPDR) – Energy Efficiency
Community Block Grant (U.P. Link)
2 0 1 0 2 0 1 0 - 2 0 1 1
2 0 0 9 - 2 0 1 2
2 0 1 1
2 0 1 0 - 2 0 1 1

27
CHAPTER 4: EDA PROGRAM CRITERIA & REGIONAL PROJECT INVENTORY INTRODUCTION CRITERIA FOR SELECTING PRIORITY PROJECTS
The questions listed below serve as the criteria to assist in the identification of priority projects and to
determine the relative importance of each one. Only projects with a completed “Project Questionnaire
Form” are considered for placement in the Priority Listing. These criteria are purposefully broad to
provide flexibility within the prioritization process, and to allow local input and permit subjective
contributions. Based on project prioritization (see Table below) implementation plans have been
established. Projects are given priority by the Regional Economic Development Advisory Committee
based upon the following:
1. How many permanent and part-time jobs are directly created and/or retained within the Region as a result of this project?
2. Are matching funds secured for the project?
3. Has the preliminary engineering been completed?
4. Is the project located in a community suffering from high levels of unemployment or other economic distress?
5. Is the project identified and/or prioritized by another Region-wide program being carried out by the EUPRPDC?
6. What is the estimated number of indirect jobs created or the possibility of related developments as a result of this project being implemented?
7. Is there a clearly demonstrated need for the project?
8. Will the project enhance the attractiveness of the Region for new growth or improve the "quality-of-life" in the EUP?
9. Is the project a wise and prudent environmental use of the Region's natural resources?
10. Is there a strong local commitment to the project? 11. What is the priority for this project?
12. Project Costs TOT: FED:
STATE: LOCAL: PRIVATE:
The following pages list the top priority community and economic development projects, for the Eastern Upper Peninsula Region. Based on the above criteria, the “Priority Projects” were selected and listed on the following page. Details on the various priority projects can be found on the proceeding pages.

28
EDA Funding Programs Public Works Program Supports the construction, expansion or upgrade of essential public infrastructure and facilities. (CFDA No. 11.300- PDF)
Economic Adjustment Assistance Provides a wide range of technical, planning, and public works and infrastructure assistance in regions experiencing adverse economic changes that may occur suddenly or over time (e.g., strategy development, infrastructure construction, revolving loan fund capitalization). (CFDA No. 11.307- PDF)
Planning Grants Assists local and regional organizations (District Organizations, Indian Tribes, and other eligible entities) with their short‐ and long‐term planning efforts. To read more about EDA's Planning Program and EDD Designation Requirements and District Modifications, Click Here.(CFDA No. 11.302- PDF)
Technical Assistance Program Focused assistance provided to public and nonprofit leaders to help in economic development decision making (e.g., project planning, impact analyses, feasibility studies); also includes the University Center (PDF) Economic Development Program, which makes the resources of universities available to the economic development community. (CFDA No. 11.303- PDF)
Research and Evaluation Supports research of cutting‐edge economic development practices, as well as information dissemination efforts to national audiences. (CFDA No. 11.312- PDF)
Trade Adjustment Assistance for Firms Supports a national network of eleven Trade Adjustment Assistance Centers that assists U.S. small and medium‐sized businesses impacted by increased imports with the development and implementation of business recovery and global competitiveness strategies to retain and create jobs. (CFDA No. 11.313- PDF) Complete and updated information on the program can be found at www.eda.gov/TAAF.
Community Trade Adjustment Assistance Provides planning and/or implementation project grants to communities that have experienced or are threatened by job loss resulting from international trade impacts. Complete and updated information on the program can be found at www.eda.gov/InvestmentsGrants/CommunityTAA.xml.
Global Climate Change Mitigation Incentive Fund From amounts otherwise made available for the economic development assistance programs authorized by PWEDA, promotes EDA policies and strategies which contribute to environmentally sustainable development. Click here for more information (PDF).

29
EDA Investment Guidelines
1. Collaborative Regional Innovation Initiatives that support the development and growth of innovation clusters based on existing regional competitive strengths. Initiatives must engage stakeholders; facilitate collaboration among urban, suburban and rural (including Tribal) areas; provide stability for economic development through long-term intergovernmental and public/private collaboration; and, support the growth of existing and emerging industries.
2. Public/Private Partnerships Investments that use both public and private sector resources and leverage complementary investments by other government/public entities and/or non-profits.
3. National Strategic Priorities Initiatives that encourage job growth and business expansion in clean energy; green technologies; sustainable manufacturing; information technology (e.g., broadband, smart grid) infrastructure; communities severely impacted by automotive industry restructuring; natural disaster mitigation and resiliency; access to capital for small and medium sized and ethnically diverse enterprises; and, innovations in science, health care and alternative fuel technologies.
4. Global Competitiveness Investments that support high-growth businesses and innovation-based entrepreneurs to expand and compete in global markets.
5. Environmentally-Sustainable Development Investments that encompass best practices in “environmentally sustainable development,” broadly defined, to include projects that enhance environmental quality and develop and implement green products, processes, and buildings as part of the green economy.
6. Economically Distressed and Underserved Communities Investments that strengthen diverse communities that have suffered disproportionate economic and job losses and/or are rebuilding to become more competitive in the global economy.
Eligibility The Chicago Regional EDA Office determines project eligibility for those proposals submitted for funding consideration in the Eastern U.P. EDD. However, it is generally based upon the average 24 month unemployment rate and per capita personal income (PCPI) or federally declared disasters. The grant rate is the maximum percent of funding for a project that is provided by the federal grant. During 2010 the EDA initiated a new process for submitting and evaluating proposals for funding. Projects are due to EDA at quarterly intervals during the program year, applicants who submit a complete application package prior to the quarterly deadline will be notified of EDA’s selection decision within 20 business days of that deadline. All projects will be assessed against EDA’s strategic priorities and evaluated by an investment review committee where EDA professionals will analyze and recommend proposals to the EDA Regional Director for that quarter’s available funding. OTHER FUNDING PROGRAMS EDA, while a major funding component of many economic development projects throughout the Region, has limited and very competitive number of funds available, furthermore, many entities within the Region cannot construct a competitive EDA application package, due to this, many other sources of funding are utilized in creating a competitive funding package for economic development projects in the Eastern U.P.

30
EASTERN UP REGION PROJECT INVENTORY RESULTS & ANALYSIS Project Scoring Criteria Project submitted for priority consideration through the Commission’s annual “Call for Projects” must complete an associated project information form that addresses the criteria below which was established during the development of the 2010 Revised CEDS. The Regional Economic Development Advisory Committee performed the ranking based on Regional Impacts of the priority projects submitted for consideration.
Key Projects – 2010
Several key projects were completed during the past year in the Eastern U.P., these projects are summarized
below:
Mackinac Straits Health Systems Hospital Construction – St. Ignace
This new 80,000 square foot hospital facility was opened during 2010
in St. Ignace, bringing improved health care and ambulatory care
services to Mackinac County. $27 million in project funding was
secured through USDA Rural Development. The hospital has 15,000
square feet earmarked for tribal services to Sault Ste. Marie Tribe of
Chippewa Indians members.
New Medical Facility Construction – Sault Ste. Marie
War Memorial hospital opened a new medical office building in
downtown Sault Ste. Marie in August 2010. A state-approved
brownfield redevelopment tax credit valued at more than $1 million
supported the development of the facility, which resulted in the
creation of 36 new jobs and generated $8.7 million in new private
investment. Moyle Real Estate and Development worked with the
city of Sault St. Marie and War Memorial Hospital to plan and
construct this new 40,000 square foot, four-story, LEED-certified
building.
Criteria 0 Points 1 Point 2 Points 3 Points 4 Points 5 Points 6 Points 8 Points 10 points
Job Creation Lacking 1-10 jobs 11-25 jobs 26-50 jobs 51-75 jobs 75+ jobs
Job Retention Lacking 1-10 jobs 11-25 jobs 26-50 jobs 51-75 jobs 75+ jobs
Matching Funds NOPartially
SecuredYES
In Plan/Related Document NO YES
Project Readiness NoneOver 2
years1-2 years Immediately
Regional Impact None Little Moderate Significant
Bonus Points (5pts. Max)
2011 Comprehensive Economic Development Strategy Project Ranking and Distress Factor Standards Worksheet

31
St. Ignace Signature Buildings Grant
The City of St. Ignace was awarded a $270,000 Signature Building
grant through the MEDC to rehabilitate a long-abandoned
building in their downtown district. This building was converted
into a downtown market and resulted in 14 new jobs for the
downtown area.
MDOT Bus Station Construction – St. Ignace
This $1.7 million terminal in St. Ignace provides for daily bus service
throughout Michigan. The facility handles the transfer of passengers on
state-supported intercity Upper Peninsula routes with like routes in the
Lower Peninsula. It is the northernmost terminal for daily bus service
throughout Michigan.
Portage Township Road Improvements
Through funding from the MEDC Infrastructure Capacity Enhancements
program, the Township was awarded $250,700 to improve three road
segments in Portage Township, in western Mackinac County. Drainage
improvements along Main Street in Curtis, along with gravel lift and surface
improvements to Ketola and McGahn Roads. The township committed
$245,700 through their local road millage towards local match on this
project.

Project Title Local Government Total CostJob
Creation
Job
Retention
Project
Readiness
Matching
FundsIn Plan
Regional
ImpactType
TOT
PTS
Newberry Green Industries Luce County EDC $209,500,000 10 10 3 3 5 5 NF 36
City of Mackinac Island Wastewater Upgrades Mackinac Island, City of $10,300,000 10 10 5 0 5 5 NF 35
Frontier Renewable Resources - Cellulosic Ethanol Refinery
InfrastructureChippewa County EDC $49,300,000 10 10 3 0 5 5 P, NF 33
Regional Broadband Improvements/Enhancements Region-Wide Unknown 10 10 3 0 5 5 NF 33
International Bridge Toll Plaza Improvements International Bridge Authority $6,100,00 8 10 3 0 5 5 NF 31
North Arrow Log Homes Business Expansion Chippewa County EDC $375,152 6 6 5 5 5 3 NF 30
JKL Bahweting School ExpansionSault Tribe of Chippewa
Indians$15,000,000 8 8 1 5 5 3 NF 30
South Borgstrom Road Project Hudson Twp. $730,000 2 10 3 5 5 3 NF 28
North Huron Scenic Pathway Construction St. Ignace/Drummond $57,000,000 4 10 3 3 5 3 NF 28
Wastewater Treatment Plant Upgrades Kinross Charter Twp. unknown 10 10 1 0 5 1 NF 27
Portage Twp. Sanitary Sewer System Development Portage Twp. $4,300,000 4 10 3 0 5 5 NF 27
North State Street Sewer Project St. Ignace, City of $1,500,000 6 10 1 0 5 5 NF 27
DeTour Village Industrial Park DeTour Village $1,624,700 6 2 5 5 5 3 NF 26
Newberry Water System Upgrade Newberry, Village of $10,000,000 2 10 5 3 5 1 P 26
Ashmun Streetscape Project Sault Ste. Marie, City of $2,000,000 6 6 3 3 5 3 NF 26
M-80 to I-75 Water Main Project Kinross Charter Twp. unknown 8 8 3 0 5 1 NF 25
Portage Street Water Project Moran Twp. $470,000 2 4 5 5 5 3 NF 24
Airport Industrial Park - SW Side Infrastructure Sault Ste. Marie, City of $1,500,000 10 0 3 3 5 3 NF 24
Electrical Upgrades - Township Wide Hudson Twp. unknown 6 6 3 0 5 3 NF 23
Cannelton Superfund Site Infrastructure Sault Ste. Marie, City of $850,000 10 0 5 0 5 3 NF 23
Bay Mills CC Child Development Center Bay Mills Comm. College $500-$600,000 4 4 3 5 5 1 NF 22
Bay Mills Community College Administrative Building Bay Mills Comm. College $3,000,000 2 6 3 5 5 1 P, NF 22
Superior Pellets Chippewa County EDC $5,820,429 6 6 3 0 5 1 P, NF 21
Winter Test Program Chippewa County EDC $2,251,830 4 4 3 0 5 5 P, NF 21
Airport Industrial Park - 14 Ave. Ext. Sault Ste. Marie, City of $680,000 4 0 3 5 5 3 NF 20
Railroad Spur Track Chippewa County EDC $400,000 4 2 3 0 5 5 P, NF 19
Camp Lucas Infrastructure Sault Ste. Marie, City of $2,000,000 10 0 3 0 5 1 NF 19
Pte. LaBarbe Water Line Extension Moran Twp. $2,275,000 2 2 5 0 5 3 NF 17
Tahquamenon Area Civic Center Newberry, Village of $2,500,000 2 0 3 3 5 3 NF 16
Ashmun Bay Park Improvements Phase III (Linear Trail) Sault Ste. Marie, City of $575,000 2 0 3 0 5 3 P 13
North Road Bypass Project Portage Twp. unknown 4 0 1 0 5 1 NF 11
EASTERN U.P. PRIORITY PROJECTS LIST - 2010-2011
P-PlannedNF - Need Funding
32

PRIORITY PROJECT DESCRIPTIONS – 2011
33
Bay Mills CC Child Development Center Submitting Agency: Bay Mills Community College Description: Application for ICDBG funds to construct a new child development center to replace the current inadequate facility. Project Cost: $500-$600,000 Job Creation: 11-25 Job Retention: 11-25 Project Readiness: 1-2 years Matching Funds: secured (ICDBG) In Plan: Yes (2010 CEDS) Regional Impact: Limited Type: Needs Funding Bay Mills Comm. College Administrative Building Submitting Agency: Bay Mills Community College Description: New construction of an Administrative building on the campus of the Bay Mills Community College. This facility will replace an outdated building on the campus of the Community College, which resides on the shores of Lake Superior west of Sault Ste. Marie. Project Cost: $3.0 million Job Creation: 1-10 Job Retention: 26-50 Project Readiness: 1-2 years Matching Funds: secured (ICDBG) In Plan: Yes (2010 CEDS) Regional Impact: Limited Type: Needs Funding Frontier Renewable Resources – Cellulosic Ethanol Refinery Infrastructure Submitting Agency: Chippewa County EDC Description: Development of the Mascoma/FRR cellulosic ethanol refinery at the “Centers for Alternative Energy Excellence” renaissance zone in Kinross Charter Township. Including but not limited to: refinery construction, road, water, and sewer upgrades. Project Cost: $49.3 million Job Creation: 50 Job Retention: 700 Project Readiness: 1-2 years Matching Funds: partially-secured In Plan: Yes (2008-09, 2010 CEDS) Regional Impact: Significant Type: Planned/Needs Funding North Arrow Log Homes Business Expansion Submitting Agency: Chippewa County EDC Description: Expand operations and diversify product line to include manufacture of wood pellets. Project Cost: $375,152 Job Creation: 26-50 Job Retention: 26-50 Project Readiness: Immediately Matching Funds: Secured
In Plan: Yes (2008-09, 2010 CEDS) Regional Impact: Moderate Type: Needs Funding Railroad Spur Track Development Submitting Agency: Chippewa County EDC Description: Development of a railroad spur to the Center for Alternative Energy Renaissance Zone. Project Cost: $400,000 Job Creation: 15.5 Job Retention: 6 Project Readiness: 1-2 years Matching Funds: Not secured In Plan: Yes (2011 CEDS Update) Regional Impact: Significant Type: Needs Funding Furlong Company - Superior Pellets Submitting Agency: Chippewa County EDC Description: Rehabilitation of building #234 for location by Furlong Company – Superior Pellets. This company would manufacture wood pellets utilizing the existing building. Project Cost: $5,820,429 Job Creation: 38 Job Retention: 0 Project Readiness: 1-2 Matching Funds: No In Plan: Yes (2008-09, 2010 CEDS) Regional Impact: Limited Type: Needs Funding Winter Test Program Submitting Agency: Chippewa County EDC Description: Expansion of winter automotive test program – construct additional variable friction surfaces, upgrade/renovate existing buildings and acquire additional support equipment to accommodate multiple program users. Project Cost: $2,251,830 Job Creation: 12 Job Retention: 0 Project Readiness: Immediately Matching Funds: No In Plan: Yes (2011 CEDS) Regional Impact: Significant Type: Needs Funding DeTour Village Business/Industrial Park Submitting Agency: DeTour Area EDC Description: Development of a business/industrial park on a 33 acre parcel of property owned by DeTour Village. The DeTour Area EDC proposes this development, including road, water, sewer, and utility construction, for nine (9) lots. The EDC is currently in the process of selling their first lot to a local business.

PRIORITY PROJECT DESCRIPTIONS – 2011
34
Project Cost: $1.6 million Job Creation: 26-50 Job Retention: 1-10 Project Readiness: Immediately Matching Funds: Secured (Local) In Plan: Yes (2008-09, 2010 CEDS) Regional Impact: Moderate Type: Needs Funding Hudson Township Electrical Upgrades Submitting Agency: Hudson Township Description: Upgrades to the townships electrical grid, to enhance the potential for wind energy systems and to provide alternative energy to other areas of the State. Project Cost: Unknown Job Creation: 26-50 Job Retention: 1-10 Project Readiness: Over two years Matching Funds: Unknown In Plan: Yes (2010 CEDS) Regional Impact: Moderate Type: Needs Funding South Borgstrom Road Improvements Submitting Agency: Hudson Township Description: Completion of the South Borgstrom Road project would produce connectivity between H-40 and US-2, and also produce an alternate route to M-28. This road is used extensively by loggers and the surface is in deplorable condition. The substrate is also incapable of handling the tonnage allowed by the State of Michigan. Project Cost: $730,000 Job Creation: 1-10 Job Retention: 75+ Project Readiness: Immediately Matching Funds: Secured In Plan: Yes (2008-09, 2010 CEDS) Regional Impact: Moderate Type: Planned/Needs Funding International Bridge Toll Plaza Improvements Submitting Agency: International Bridge Authority Description: Project Cost: $6.1 million Job Creation: 51-75 Job Retention: 75+ Project Readiness: 1-2 years Matching Funds: Not Secured In Plan: Yes (2011 CEDS) Regional Impact: Significant Type: Planned/Needs Funding
M-80 to I-75 Water Main Project Submitting Agency: Kinross Charter Township Description: Completion of a water line extension/main along M-80 to I-75 to increase the potential for business development along this heavily traveled corridor. Project Cost: Unknown Job Creation: 51-75 Job Retention: 51-75 Project Readiness: 1-2 years Matching Funds: Unknown In Plan: Yes (2010 CEDS) Regional Impact: Limited Type: Needs Funding Kinross Charter Twp. WWTP Upgrades Submitting Agency: Kinross Charter Township Description: Improvements and upgrades to the Kinross Charter Township Waste Water Treatment Plant will be required in order for the Mascoma/FRR Cellulosic Ethanol Refinery to come on-line. The current system does not have the capacity required for this development to come “on-line”. Project Cost: Unknown Job Creation: 75+ Job Retention: 75+ Project Readiness: Over 2 years Matching Funds: not secured In Plan: Yes (2010 CEDS) Regional Impact: Limited Type: Needs Funding Newberry Green Industries Submitting Agency: Luce County EDC Description: Construction of plant to manufacture chemicals utilizing biomass. Project Cost: $209.5 million Job Creation: 170 Job Retention: 300 Project Readiness: Immediately Matching Funds: Partially secured In Plan: Yes (2011 CEDS) Regional Impact: Significant Type: Needs Funding City of Mackinac Island WWTP Submitting Agency: City of Mackinac Island DPW Description: Most of the equipment in the Mackinac Island Wastewater Treatment Plant (WWTP) was installed in the 1970s. The equipment is still in working condition, but rather worn out after 20 to 30 years of operation. The proposed WWTP improvements will upgrade equipment to improve operational reliability and efficiency. A minor capacity increase of approximately 30,000 gallons per day (gpd) will occur with flow equalization improvements. Project Cost: $10.3 million

PRIORITY PROJECT DESCRIPTIONS – 2011
35
Job Creation: 75+ Job Retention: 75+ Project Readiness: Immediately Matching Funds: Partially secured (USDA Loan) In Plan: Yes (2008-09, 2010 CEDS) Regional Impact: Significant Type: Needs Funding Portage Street Water Line Extension Submitting Agency: Moran Township Description: Capacity enhancements and upgrades to the Township’s water distribution system. Project Cost: $470,000 Job Creation: 1-10 Job Retention: 11-25 Project Readiness: Immediately Matching Funds: secured (Local) In Plan: Yes (2008-09, 2010 CEDS) Regional Impact: Moderate Type: Needs Funding Pte. LeBarbe Road Water Line Extension Submitting Agency: Moran Township Description: Extension of a water line along Pte. LeBarbe Road, an area of problematic wells in the past. This extension could also serve future business needs along US-2. Project Cost: $2.275 million Job Creation: 1-10 Job Retention: 1-10 Project Readiness: 1-2 years Matching Funds: Not secured In Plan: Yes (2008-09, 2010 CEDS) Regional Impact: Moderate Type: Needs Funding Newberry Water System Upgrade Submitting Agency: Village of Newberry Description: Continued improvements and upgrades to the Village’s Water distribution system. Project Cost: $10.0 million Job Creation: 1-10 Job Retention: 75+ Project Readiness: Immediately Matching Funds: Secured (USDA Loan) In Plan: Yes (2008-09, 2010 CEDS) Regional Impact: Limited Type: Needs Funding Tahquamenon Area Civic Center Submitting Agency: Tahquamenon Area Rec. Authority Description: Construction of a Civic Center in McMillan Township, which will include a hockey rink, recreational facilities, conference/meeting space. Project Cost: $2.5 million Job Creation: 1-10
Job Retention: NA Project Readiness: Immediately Matching Funds: Partially-secured (Local) In Plan: Yes (2008-09, 2010 CEDS) Regional Impact: Moderate Type: Needs Funding Portage Township Sanitary Sewer Development Submitting Agency: Portage Township Description: Development of a sanitary sewer system within the downtown district of Curtis in Portage Township to alleviate historical pollution and capacity problems. Project Cost: $4.3 million Job Creation: 11-25 Job Retention: 75+ Project Readiness: 1-2 years Matching Funds: No In Plan: Yes (2010 CEDS) Regional Impact: Significant Type: Needs Funding Portage Township North Road Bypass Submitting Agency: Portage Township Description: Development of a north road bypass between the North and South Curtis Road in the township. Project Cost: Unknown Job Creation: Unknown Job Retention: 20 Project Readiness: Over 2 years Matching Funds: No In Plan: Yes (2007-08, 2010 CEDS) Regional Impact: Limited Type: Needs Funding Regional Broadband Upgrades Submitting Agency: Unknown Description: Development of a more robust and interconnected network of broadband across the Eastern Upper Peninsula. Project Cost: unknown Job Creation: 75+ Job Retention: 75+ Project Readiness: 2-3 years Matching Funds: Unknown In Plan: Yes (2010 CEDS) Regional Impact: Significant Type: Needs Funding Airport Industrial Park – 14
th Ave. Extension
Submitting Agency: Sault Ste. Marie EDC Description: Extension of 14
th Ave. into the Airport
Industrial Park, including road improvements, water, sewer and utilities. Project Cost: $680,000

PRIORITY PROJECT DESCRIPTIONS – 2011
36
Job Creation: 11-25 Job Retention: NA Project Readiness: 1-2 years Matching Funds: Unknown In Plan: Yes (2008-09, 2010 CEDS) Regional Impact: Type: Needs Funding Airport Industrial Park Infrastructure Submitting Agency: Sault Ste. Marie EDC Description: Placement of needed road, water, sewer and utilities to develop the southwest side of the Airport Industrial Park in Sault Ste. Marie. Project Cost: $1.5 million Job Creation: 75+ Job Retention: NA Project Readiness: 1-2 years Matching Funds: Unknown In Plan: Yes (2008-09, 2010 CEDS) Regional Impact: Moderate Type: Needs Funding Ashmun Bay Park Improvements Phase III (Linear Trail) Submitting Agency: Sault Ste. Marie EDC Description: Phase III of the Ashmun Bay park improvements plan, which includes the development of a linear trail to connect into the Soo/Strongs rail trail. Project Cost: $575,000 Job Creation: 1-10 Job Retention: NA Project Readiness: 1-2 years Matching Funds: Secured (MDNRENRTF) In Plan: Yes (2008-09, 2010 CEDS) Regional Impact: Moderate Type: Needs Funding Ashmun Streetscape Project Submitting Agency: Sault Ste. Marie EDC Description: Construction of a new Ashmun Streetscape including both underground and above ground improvements between Easterday Ave. and Sheridan Dr. Project Cost: $2.0 million Job Creation: 26-50 Job Retention: 75+ Project Readiness: Immediately Matching Funds: Secured (Local) In Plan: Yes (2008-09, 2010 CEDS) Regional Impact: Moderate Type: Needs Funding Camp Lucas Infrastructure Submitting Agency: Sault Ste. Marie EDC Description: Development of road, water, sewer and utilities to complete the infrastructure for the Camp Lucas site for future development in the City of Sault Ste. Marie.
Project Cost: $2.0 million Job Creation: 75+ Job Retention: NA Project Readiness: 1-2 years Matching Funds: Unknown In Plan: Yes (2008-09, 2010 CEDS) Regional Impact: Limited Type: Needs Funding Cannelton Superfund Site Infrastructure Submitting Agency: Sault Ste. Marie EDC Description: Placement of road, water, sewer and utilities to the Cannelton Superfund site (former Tannery). This would allow for this area to be redeveloped for public or private uses. Project Cost: $850,000 Job Creation: 75+ Job Retention: NA Project Readiness: Immediately Matching Funds: Unknown In Plan: Yes (2008-09, 2010 CEDS) Regional Impact: Moderate Type: Needs Funding JKL Bahweting School Expansion Submitting Agency: Sault Ste. Marie Tribe of Chippewa Indians Description: Expansion and improvements to the existing JKL Bahweting Tribal Charter School to al ocation on existing Tribal trust lands. Project Cost: $15,000,000 Job Creation: 50-75 Job Retention: 50-75 Project Readiness: 3+ years Matching Funds: Yes In Plan: Yes (2011 CEDS) Regional Impact: Moderate Type: Needs Funding North State Street Sewer Project Submitting Agency: City of St. Ignace Description: Replacement and enhancement of 3,300 foot of sanitary sewer line along North State Street from the City lift station at 1025 North State Street to the new Straits Hospital development at 1160 North State Street. The current line is along the Lake Huron shore and feeds six existing motels, three restaurants, the Sault Tribe’s youth detention facility, a mini-golf course, several small retail shops, and a five residential homes on this line. This line will also serve the new 82,000 square foot Straits Hospital facility scheduled to open this spring. Project Cost: $1,500,000 Job Creation: 26-50 Job Retention: 75+ Project Readiness: Immediately Matching Funds: Not secured

PRIORITY PROJECT DESCRIPTIONS – 2011
37
In Plan: Yes (2008-09, 2010 CEDS) Regional Impact: Type: Planned/Needs Funding North Huron Scenic Pathway Submitting Agency: City of St. Ignace DDA Description: Proposed non-motorized pathway from St. Ignace to Drummond Island. Recent studies have shown that individuals are now choosing “place” over “job” when looking at employment opportunities, one the amenities that makes a community marketable is its connectivity, in terms of multi-modal transportation. Project Cost: $57.0 million Job Creation: 11-25 Job Retention: 75+ Project Readiness: Over 2 years Matching Funds: Partially secured In Plan: Yes (2008-09, 2010 CEDS) Regional Impact: Moderate Type: Needs Funding

38
ECONOMIC DEVELOPMENT ACTIVITIES/COMPLETED PROJECTS - 2011/2012
Local Government Total Cost Funding Sources
Plantation Road Diversion Bay Mills Indian Community Unknown BIA, BMIC, Other
New Ambulance Facility Construction Bay Mills Indian Community Unknown BIA, BMIC, Other
Energy Efficiency Analysis on Rental Homes Bay Mills Indian Community Unknown EECBG, BIA, BMIC, Other
Bay Mills Community College Health & Fitness Education Center
Bay Mills Community College $923,000 EDA, BMIC, Local
M-80 Rail Crossing Replacement Chippewa Co. EDC $419,177 MDOT
Mackinac Trail rail crossing, approaches and signals replaced
Chippewa County EDC Unknown MDOT, Local
Community Action Agency Center - construction completed
CLMCAA Unknown MSHDA, USDA, CLMCAA, Local
Rail crossing upgrade/reconstruction Dafter Township Unknown MDOT
K&K Concrete location to business park DeTour Area EDC Unknown Local, Private
Welcome sign for Village and Business Park DeTour Area EDC Unknown Local, Private
Business façade improvements DeTour Area EDC Unknown Local, Private
DeTour Village Hall Kitchen Renovations DeTour Area EDC Unknown unknown
DeTour Area Information Kiosk DeTour Area EDC Unknown unknown
DeTour Business Park 3 Phase Electric DeTour Area EDC Unknown unknown
Information Kiosk for Tourist DeTour Area EDC $2,000 Local, Private
Art Gallery (redevelopment of laundry mat) DeTour Area EDC Unknown Local, Private
EUP Fine Arts Council building repair/updates DeTour Area EDC $270,000 Local, Private
Completed Clubhouse Dr. sewer repair Kinross Charter Twp. Unknown Local
Completed telephotography of sanitary sewer drains in special assessment area.
Kinross Charter Twp. Unknown Local
Completed paving of Mackinac Trial as funded Kinross Charter Twp. Unknown CCRC, Local
Pending purchase on former Sunrise Inn Motel on M-80
Kinross Charter Twp. Unknown Private
Retained insurance impound area business through sale.
Kinross Charter Twp. Unknown Local, Private
Completed Township Master Plan Kinross Charter Twp. $27,000 Local
New restaurant/drive up service Kinross Charter Twp. Unknown Private
Local gas station and convenience store rebuilt after fire
Kinross Charter Twp. Unknown Private
Smart Zone Designation - LSSU/City of SSM LSSU, City of Sault Ste. Marie Unknown MEDC, Local
Banks Hardwoods Reopened Luce County EDC Unknown Private
Brownfield Redevelopment Luce County EDC $1,650,000 MDNRE, County EDC
Newberry Wood Enterprises fire - total loss, planning to rebuilding on-site
Luce County EDC Unknown Private, Local
Luce County Industrial Park Expansion was started Luce County EDC $2,350,000 EDA, LCEDC, Private
Assisted Living Facility Construction Moran Township Unknown USDA, USDARD, Local, Private
Dryburg Road Paving Rudyard Twp. Unknown Local, CCRC

39
Center Line Road Improvements Rudyard Twp. Unknown Local, CCRC
Dryburg Road Paving Rudyard Twp. Unknown Local, CCRC
Township Park Walking Trail Rudyard Twp. Unknown Local
Township Park Play Area Rudyard Twp. Unknown Local
Ashmun St. resurfacing project Sault Ste. Marie, City of Unknown MDOT, Local
New Medical Office Building Construction Sault Ste. Marie, City of $5,000,000 USDARD, EDA, private, Local
Old Central Bank - Masonic Buildings Rehabilitation Sault Ste. Marie, City of $5,600,000 MSHDA (CDBG), Private
Minneapolis Woods clean up Sault Ste. Marie, City of $7,000 Local
Sherman Park Beach Phase I (Beach accessibility upgrades)
Sault Ste. Marie, City of $460,000 MNRTF, Local
ICE Investigation Complex Construction (10,000 sf complex housing ICE, ERO and Homeland Security)
Sault Ste. Marie, City of Unknown Dept. Homeland Security
Bus Station completion St. Ignace, City of Unknown MDOT, Local
Signature Buildings Grant Project - Downtown St. Ignace
St. Ignace, City of $270,000 CDBG, Local, Other
Chambers Street Repaving St. Ignace, City of Unknown USDA-RD, Local, Other
Sewer Extension and replacement St. Ignace, City of Unknown unknown
Lift station construction St. Ignace, City of Unknown unknown
Sewer Plant expansion St. Ignace, City of Unknown unknown
Bus Station Construction St. Ignace, City of $1,300,000 MDOT, Local
SRF Project Completed -along Portage Rd. St. Ignace, City of Unknown USDA, USDARD, Local, Private
New Sewer Lift Station Construction St. Ignace, City of Unknown USDA-RD, Local, Other
Mackinac County Hospital Construction St. Ignace/Private $36,800,000 USDA, USDARD, Local, Private
New Pavilion at Township Park Trout Lake Twp. Unknown USDA-RD, Local
Construction of new Emergency Services Building Whitefish Twp. Unknown USDARD, DHS, Local
K&K Concrete Business Location and Expansion DeTour Area EDC Unknown Local, Private, Other
Three Lakes Charter Academy - School Portage Township $160,000 MI Dept. of Education
ICE Grant for Road Improvements Portage Twp. $240,000 MEDC, Local
Fire, EMS and Curtis Learning Center Development Portage Twp. $101,000 USDA, Local
Completion of Parks and Recreation Master Plan Portage Twp. Unknown Local

40
ECONOMIC DEVELOPMENT PROJECTS THAT NEED FUNDING - 2011/2012
Project Name Local
Government
Estimated
Cost Funding Sources
New Community Justice Center Construction Bay Mills Indian Community
unknown CTAS, BMIC, Other
Superior Pellets Company Chippewa County EDC $1,270,182
EDA, MEDC, CCEDC, Private, Other
Winter Automotive Testing Program Expansion Chippewa County EDC $1,851,830 MEDC, CCEDC, Private, Other
Building #436 Rehabilitation Chippewa County EDC unknown EDA, CDBG, Local, Private, Other
Downtown District Revitalization Project Clark Twp. unknown EDA, MEDC, MDOT, Local
Infrastructure development to Business Park DeTour Area EDC $350,000 CDBG-ICE, CDBG, EDA, Local, Other
M-80 (Tone Road) Streetscape Project Kinross Charter Twp.
unknown MDOT, CCRC, Local
Energy Efficiency upgrades to township properties Kinross Charter Twp.
unknown USDA-RD, DOE, Local
Aquatic Research Laboratory & Educational Center Renovation
Lake Superior State Univ.
$9,000,000 ARRA, Private, Local
School of Business, Economics and Legal Study building renovations/replacement
Lake Superior State Univ.
$20,000,000 ARRA, Private, Local
Broadband - county wide Luce County EDC unknown USDA-RD, EDA, MEDC, Private, Local
Newberry Green Industries Luce County EDC $209,500,000 EDA, MEDC, LCEDC, Private, Other
Newberry Water System Improvement Project Phase 1D
Newberry, Village of
unknown USDARD, EDA, CDBG
Downtown Revitalization Project Newberry, Village of
$2,866,000 MSHDA, Local, Private
Sandtown Road Grade Improvements Portage Twp. $103,400 Local, MCRC
Gould City Road Reconstruction Portage Twp. $408,000 Local, MCRC
Sanitary Sewer System - Downtown Curtis Portage Twp. unknown UDSA, MEDC, EDA, Private, Local
High-Speed Internet Service Portage Twp. unknown USDA, Private, Local, Other
Cellular Phone Tower Portage Twp. unknown USDA, Private, Local, Other
Agri-Valley Broadband Project Region-Wide $30,000,000 RUS-BIP ARRA, Private, Local
Cannelton Superfund Development Infrastructure Sault Ste. Marie $850,000 EDA, USDARD, CDBG, Local
Industrial Incubator Rehabilitation Sault Ste. Marie $300,000 EDA, Local
Ashmun Street Streetscape and resurfacing (Power Canal to Easterday)
Sault Ste. Marie $2,000,000 MDOT, Special Assessment
Renovation of old Airport Hanger for Manufacturing Space
Sault Ste. Marie $150,000 MAC, TIFA III
Environmental Assessment and Wetland Mitigation Plan for Hangar Expansion
Sault Ste. Marie $250,000 MAC, TIFA III
Airport Industrial Park - 14th Ave. Extension Sault Ste. Marie $680,000 CDBG, TIFA III
Airport Industrial Park - SW Side Infrastructure Sault Ste. Marie $1,500,000 CDBG, TIFA III
North State Street Sanitary Sewer Improvements St. Ignace, City of $1,000,000 USDA, EDA, CDBG, Private, Local
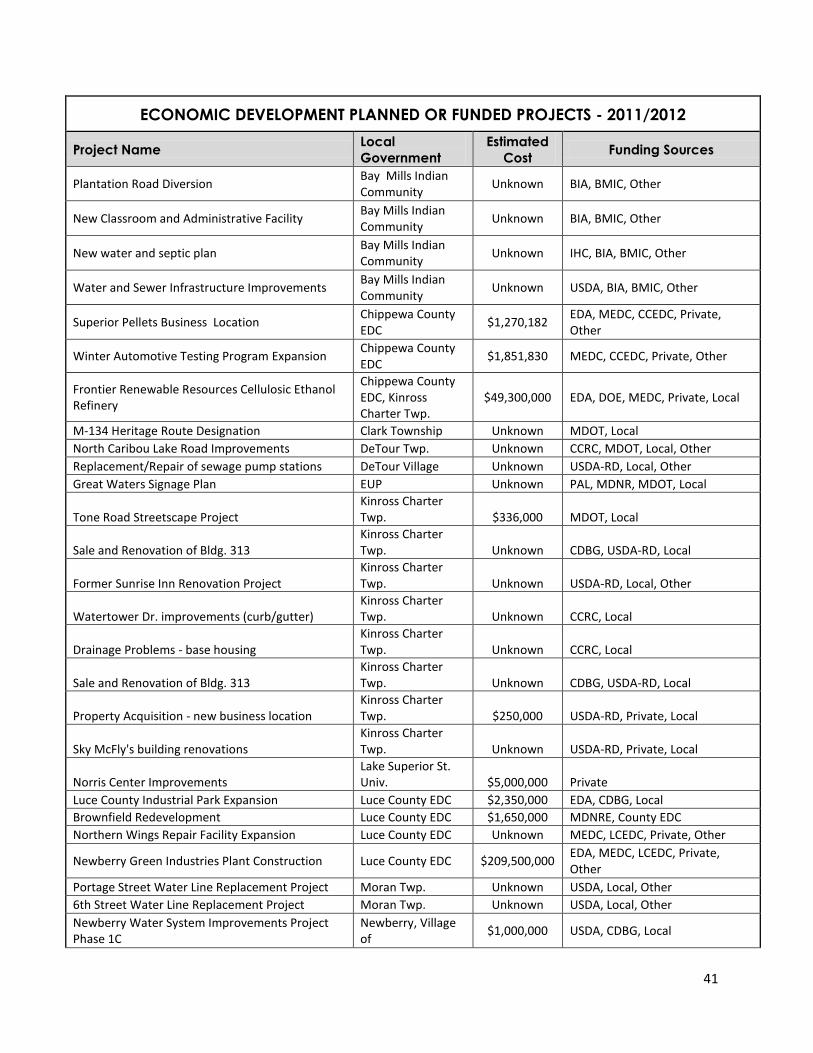
41
ECONOMIC DEVELOPMENT PLANNED OR FUNDED PROJECTS - 2011/2012
Project Name Local
Government
Estimated
Cost Funding Sources
Plantation Road Diversion Bay Mills Indian Community
Unknown BIA, BMIC, Other
New Classroom and Administrative Facility Bay Mills Indian Community
Unknown BIA, BMIC, Other
New water and septic plan Bay Mills Indian Community
Unknown IHC, BIA, BMIC, Other
Water and Sewer Infrastructure Improvements Bay Mills Indian Community
Unknown USDA, BIA, BMIC, Other
Superior Pellets Business Location Chippewa County EDC
$1,270,182 EDA, MEDC, CCEDC, Private, Other
Winter Automotive Testing Program Expansion Chippewa County EDC
$1,851,830 MEDC, CCEDC, Private, Other
Frontier Renewable Resources Cellulosic Ethanol Refinery
Chippewa County EDC, Kinross Charter Twp.
$49,300,000 EDA, DOE, MEDC, Private, Local
M-134 Heritage Route Designation Clark Township Unknown MDOT, Local
North Caribou Lake Road Improvements DeTour Twp. Unknown CCRC, MDOT, Local, Other
Replacement/Repair of sewage pump stations DeTour Village Unknown USDA-RD, Local, Other
Great Waters Signage Plan EUP Unknown PAL, MDNR, MDOT, Local
Tone Road Streetscape Project Kinross Charter Twp. $336,000 MDOT, Local
Sale and Renovation of Bldg. 313 Kinross Charter Twp. Unknown CDBG, USDA-RD, Local
Former Sunrise Inn Renovation Project Kinross Charter Twp. Unknown USDA-RD, Local, Other
Watertower Dr. improvements (curb/gutter) Kinross Charter Twp. Unknown CCRC, Local
Drainage Problems - base housing Kinross Charter Twp. Unknown CCRC, Local
Sale and Renovation of Bldg. 313 Kinross Charter Twp. Unknown CDBG, USDA-RD, Local
Property Acquisition - new business location Kinross Charter Twp. $250,000 USDA-RD, Private, Local
Sky McFly's building renovations Kinross Charter Twp. Unknown USDA-RD, Private, Local
Norris Center Improvements Lake Superior St. Univ. $5,000,000 Private
Luce County Industrial Park Expansion Luce County EDC $2,350,000 EDA, CDBG, Local
Brownfield Redevelopment Luce County EDC $1,650,000 MDNRE, County EDC
Northern Wings Repair Facility Expansion Luce County EDC Unknown MEDC, LCEDC, Private, Other
Newberry Green Industries Plant Construction Luce County EDC $209,500,000 EDA, MEDC, LCEDC, Private, Other
Portage Street Water Line Replacement Project Moran Twp. Unknown USDA, Local, Other
6th Street Water Line Replacement Project Moran Twp. Unknown USDA, Local, Other
Newberry Water System Improvements Project Phase 1C
Newberry, Village of
$1,000,000 USDA, CDBG, Local

42
McGahn Road Improvements Portage Twp. $51,400 MEDC, MDOT, Local
Ketola Road Improvements Portage Twp. $240,000 MEDC, MDOT, Local
Main Street Road Improvements Rudyard Twp. Unknown CCRC, Local
Wind Energy Farm Rudyard Twp. Unknown DOE, Private
SmartZone Breeder Construction/Incubator Rehab Sault Ste. Marie, City of $2,500,000 EDA, Local
Rehab New City Hall (Federal Bldg.) Sault Ste. Marie, City of
$4,500,000 Local
Wetlands Master Plan Development Sault Ste. Marie, City of Unknown Local
Old Central Bank - Masonic Buildings Rehabilitation
Sault Ste. Marie, City of
$5,600,000 MSHDA (CDBG), Private
Façade Improvement Initiative Sault Ste. Marie, City of
$330,000 MSHDA (CDBG), Private
SSM CSO Phase C-3 (West Island Area) Sault Ste. Marie, City of
$8,000,000 MDNRE, ARRA, Local
SSM CSO Phase C-1 and C-2(East Island Area) Sault Ste. Marie, City of
$12,489,773 MDNRE, ARRA, Local
St. Ignace Welcome Center Construction St. Ignace, City of Unknown MDOT
Chambers Street Repaving St. Ignace, City of Unknown USDA-RD, Local, Other
Portage St. Sewer Project St. Ignace, City of Unknown USDA-RD, Local, Other
Main Lift Station and Wastewater Treatment Plant Improvements
St. Ignace, City of $2,780,000 USDA-RD, Local
Upgrade of Huckleberry Road Trout Lake Twp. Unknown MDOT, CCRC, Local
War Memorial Hospital ER Expansion War Memorial Hospital $21,900,000 USDA, Local
Renovation of the Community Center Whitefish Twp. Unknown USDARD, Local

43
EASTERN UP TRANSPORTATION PROJECTS - 2008-2015
Project Description Municipality
Estimated Cost
Funding Sources
Status
M-28 - East of M-123 to near Strongs Rd. Chippewa Twp. $1,397,000 ARRA - MDOT 2008 Completed
M-28 - M-221 to Mackinac Trail Superior/Dafter Twp's. $2,128,000 ARRA - MDOT 2008 Completed
I-75 Easterday Ave. Enhanced Freeway Lighting Sault Ste. Marie $520,000 MDOT 2009 Completed
Mackinac Trail - M-134 St. Ignace Twp. $625,000 MDOT 2009 Completed
I-75 BL from I-75 to High Street St. Ignace $593,000 MDOT 2009 Completed
US-2 East of Brevort Lk. Rd. to Martin Lk.Rd. Moran Twp. $2,541,341 MDOT 2009 Completed
Riverside Dr. - 4 Mile Rd. to 9 Mile Rd. Soo Twp. $573,808 ARRA - RTF 2010 Completed
Water Tower Dr. - M-80 to Kincheloe Rd. Kinross Charter Twp. $135,000 ARRA - Small Urban
2010 Completed
M-129 - S. of M-80 to N. of 10 Mile Rd. Bruce/Dafter Twp's $4,099,773 ARRA - MDOT 2010 Completed
M-129 over S. branch of Charlotte River - bridge replacement
Bruce/Dafter Twp's $1,541,000 MDOT 2010 Completed
W. 16th Ave. - W. 4th to W. 20th Ave. Resurfacing
Sault Ste. Marie $368,000 ARRA - Small Urban
2010 Completed
M-134 from I-75 to Hessel St. Ignace/Clark Twp's. $2,479,771 ARRA 2010 Completed
2011 PITWS (IT Sign) M-28 West of Dafter Dafter Twp. $0-$250,000 ARRA 2010 Completed
2011 PITWS (IT Sign) I-75 north of 3 Mile Rd. Sault Ste. Marie $0-$250,000 ARRA 2010 Completed
M-28 from Borgstrom Rd. to County Line Luce County $1,062,349 ARRA-MDOT 2010 Completed
County Road 405 North from 402 to Dollarville Pentland Twp. $279,120 ARRA-MDOT 2010 Completed
Borgstrom Road - US2 to H40 Hudson Twp. $400,284 ARRA - RTF 2010 Funded/Planned
M-28 - Waiska River Bridge Rehab Superior Twp. $250-
$500,000 MDOT 2011 Funded/Planned
M-123 RR Replacement north of Newberry McMillan Twp. unknown MDOT 2011 Funded/Planned
Tahquamenon Scenic Heritage Route Interpretation
TSHR $94,425 FHWA - SB 2011 Funded/Planned
Tahquamenon Scenic Heritage Route Marketing/Promotion
TSHR $232,000 FHWA - SB 2011 Funded/Planned
M-123 over Murphy Creek - bridge replacement
McMillan Twp. $920,000 MDOT 2011 Funded/Planned
I-75 SB over Carp River at Mackinac Trail St. Ignace Twp. $675,000 MDOT 2011 Funded/Planned
I-75 Business Spur Reconstruction Project, 10th Ave. to Easterday Ave.
Sault Ste. Marie $1,974,000 ARRA - MDOT 2011 Funded/Planned
I-75 Business Spur Reconstruction, Easterday Ave. to Power Canal
Sault Ste. Marie $700,000 MDOT 2011 Funded/Planned
US-2 Reconstruction, M-117 to Naubinway Garfield Twp. $5,565,000 ARRA - MDOT 2011 Funded/Planned
Easterday Ave. Bridge over I-75 - restore/rehab Sault Ste. Marie $1,132,000 MDOT 2011 Funded/Planned
I-75 BS (3 Mile Road) over I-75 Sault Ste. Marie unknown 2011 Funded/Planned
Portage Ave., I-75BS - CSO Work Sault Ste. Marie $701,000 MDOT 2011 Funded/Planned
I-75 BS, Carpool lot - lighting Sault Ste. Marie $14,000 MDOT 2011 Funded/Planned
I-75 over Hoban Creek - bridge replacement Marquette Twp. $1,916,000 MDOT 2011 Funded/Planned
US-2 from Black River to west of Engadine Mackinac Co. $5-$10 million MDOT 2011 Funded/Planned
N-129 from 3 Mile to 10 Mile Road - CPM Soo, Bruce, Dafter Twp. unknown MDOT 2011 Funded/Planned

44
Project
M-48 from Mack Trail north to I-75 Interchange - CPM
Rudyard Twp. unknown MDOT 2011 Funded/Planned
Drummond, Sugar & Neebish Island Dock Upgrades EUPTA $1,175,000 ARRA-MDOT 2011 Funded/Planned
International Bridge - Partial Widening Sault Ste. Marie $10,500,000 ARRA-MDOT 2011 Funded/Planned
Carpool Lot Construction - west of CR399 Pentland Twp. $0-250,000 MDOT 2011 Funded/Planned
Charles Moran Rd. east of M-123 St. Ignace Twp. $0-250,000 MDOT 2011 Funded/Planned
CR381 Reconstruct from M-28 to Toonerville Pentland Twp. $250-
$500,000 MDOT 2011 Funded/Planned
Mackinac Trail - M-28 to 12 Mile Road (Reconstruct) Dafter Twp.
$500-$750,000 MDOT 2011 Funded/Planned
CR135 Reconstruction Lakefield Twp. $1-$2.5 million MDOT 2011 Funded/Planned
M-129 over Fletcher Creek Pickford Twp. unknown MDOT 2011 Planned
Riverside Drive - Mission Creek Bridge Replacement Soo Twp.
$750-$1 million MDOT 2012 Funded/Planned
I-75 Overpass Rehab - Charles Moran and Bay Road Mackinac Co.
$750-$1 million MDOT 2012 Funded/Planned
M-48 - From M-129 to M-134 - Guardrail replacement
Pickford, Raber, DeTour Twp's.
$159,722 ARRA - MDOT 2012 Planned
M-28 - Borgstrom Rd. to Luce County Line McMillan Twp. $2,101,000 MDOT 2012 Planned
M-28 - Luce County Line to M-123 Hulbert, Chippewa Twp.
$1,429,962 ARRA - 63 2013 Planned
US-2 - Borgstrom Rd. to Hiawatha Trail Hudson, Garfield, Newton Twp.
$4,579,000 MDOT 2013 Planned
I-75 Bridge Replacement/Rehab Chippewa Co. unknown MDOT 2013 Planned
I-75 Bridge Replacement/Rehab Chippewa Co. unknown MDOT 2014 Planned
M-28 - Raco Superior Twp. $162,000 MDOT 2014 Planned
I-75 Bridge Replacement/Rehab Chippewa Co. unknown MDOT 2015 Planned

45
REGIONAL OPPORTUNITES
Regional Growth Strategy
The Strategies listed below were derived from “Michigan Prosperity Initiative”, a planning process undertaken by
the Land Policy Institute and spearheaded in each of the 14 State Planning & Development Regions in Michigan
during 2010. A small subset of stakeholders that attended a series of training programs on the New Economy,
that were the launch point for the Michigan Prosperity Initiative, crafted the region’s growth strategy and maintain
that the EUP strategy, which matches the regional assets, is positioned to prosper in the New Economy. Ultimately
there were 14 strategy categories identified at the State level, which are: Creating and Entrepreneurial Culture,
Advancing Innovation and Technology, Educating our Future Workforce, Retooling our Workforce, Attracting and
Retaining Talent, Marketing the Region, Strengthening our Quality of Place, Seizing Green Opportunities,
Optimizing Infrastructure Investment, Enhancing Transportation Connections, Designing a Fair and Competitive Tax
Structure, Shaping Responsive Government, Diversifying and Globally Connecting Business and Increasing Capital
Funding. The entire Regional Growth Strategy for the EUP can be found in Appendix D.
EUP REGIONAL GROWTH STRATEGIES:
Strategy 1: Diversifying and Globally Connecting Business • Strengthen economic ties to Canada (specifically Sault Ontario)/Wisconsin/Minnesota/Chicago/Lower Peninsula of Michigan. Strategy 2: Increasing Capital Funding • Creation of a regional Capital Investment group to foster entrepreneurial activities (if such a group exists better promote or market this entity). Strategy 3: Creating an Entrepreneurial Culture • Develop economic gardening and entrepreneurial support programs including support for web-based businesses and telecommuting opportunities Strategy 4: Advancing Innovation & Technology • Develop a 21st century vision for broadband/cellular service, highways, rail service and air service that focuses first on large towns in the region. • Provide broadband access in the un/underserved areas of the EUP. Strategy 5: Educating our Future Workforce • Build on the higher education cluster in the region; expand enrollment, research and entrepreneurial activity; raise educational attainment of the region’s workforce to help attract more knowledge workers to the region. Strategy 6: Retooling our Existing Workforce • Identify business needs for workforce development across the region. Strategy 7: Attracting & Retaining Talent • Engage regional business and government leaders in developing strategies to retain the highly educated, skilled, creative and talented already living in the region Strategy 8: Marketing the Eastern UP Region • Promote regional collaboration amongst economic development organizations and local governments both within and across District boundaries. • Define a positive identity for the region based on existing assets, and refine it as necessary over time and market the identity based on a region-wide advertising campaign.

46
Strategy 9: Strengthening Quality of Place in the Eastern U.P. • Identify the regional elements of, and pursue the further development of a recreation/tourism cluster (integrated geographic marketing—day trips, etc. and integrate with arts and culture, coordinate with placemaking strategies). • Investments in placemaking regarding the St. Mary’s River, as a place for people to interact with the natural, cultural and historical features that make our area special. Strategy 10: Seizing Green Opportunities • Engage business owners, university researchers, workforce development agencies and colleges, industry and entrepreneurs on how to leverage regional assets to create green businesses and jobs Strategy 11: Optimizing Infrastructure Investment • Identify existing infrastructure maintenance and repair needs and develop a regional capital improvements plan (CIP) to implement that maintenance. Strategy 12: Enhancing Transportation Connections • Develop long-term air service strategy for the region. Strategy 13: Shaping Responsive Government • Coordinate and collaborate in the provision of planning and public services

47
GOALS AND OBJECTIVES
In order to utilize the region’s potential to address its’ economic development problems, the Eastern Upper Peninsula Regional Planning and Development Commission in concert with the Regional Economic Development Advisory Committee (REDAC), adopted the following list of goals and objectives in March of 2010 for the Revised CEDS Five-Year Plan.
Goal: Promote the creation of stable, diversified, year-round employment in the Eastern Upper
Peninsula.
Objective: Provide technical assistance on infrastructure improvements and expansions in communities with growth potential; primarily water and sewer systems, broadband and roads.
Objective: Continued assistance from the Eastern Upper Peninsula Regional Planning and
Development Commission (EUPRPDC) to local units of government in developing plans and proposals for infrastructure improvements and development efforts that lead to sustainable year-round employment opportunities.
Objective: Identify cooperative efforts with the County Economic Development Organizations
(EDO), State, the MSU Extension service, LSSU, BMCC and other development organizations.
Objective: Provide data, research, planning, and grant proposal preparation assistance. Objective: Continue to be an advocate for the concerns and needs of Eastern U.P. communities
and businesses to state and federal leaders.
Goal: Encourage community development planning that is effective in leading to the development of essential infrastructure; utilizing mechanisms which support desired growth in local communities.
Objective: Assist local communities in cooperative efforts with federal and state agencies to
collaborate on the planning and financing of water and sewer treatment system expansions and new developments.
Objective: Encourage the development and enhancement of water and sewer systems which
provide efficient access to public infrastructure, such as existing roads, water and sewer connections.
Objective: Encourage planned development to efficiently access public infrastructure, such as
adequate roads, water and sewer.
Objective: Land use planning and zoning that is necessary for the efficient and orderly expansion and renewal of existing population centers should be enacted and enforced.
Objective: Promote efforts in obtaining financial resources that improve technology, efficiency and
global competitiveness in the region’s businesses.
Objective: Assistance to local government units that desire to initiate, develop and expand
business and industrial development activities.

48
Objective: Continue to provide technical assistance for community development projects with viable economic impacts.
Objective: Provide GIS support to local units of government in the District and encourage the use
of GIS at the local level.
Goal: The District supports the development of an efficient system of roads and highways and other modes of transportation.
Objective: Improve local county roads, state highways and federal highways to safe and acceptable
standards, through continued cooperation with the Michigan Department of Transportation by planning road maintenance and construction in the Eastern Upper Peninsula.
Objective: Support road and bridge projects, which will improve public access, highway safety and
emergency vehicle, access on the local level.
Objective: Continue to support and encourage plans for the I-75 corridor through the MDOT and local communities.
Objective: Support alternative transportation methods, such as bus transportation and cooperative
mechanisms to facilitate transportation.
Objective: Continue to provide technical assistance and administrative support to the Heritage Routes within the Region and transportation planning efforts which include Complete the Streets priorities for road improvements.
Objective: Continue to support projects that will lead to increased usage of existing railways and
rail systems.
Objective: Encourage improvements and investments to airport services and facilities within the Eastern U.P. that lead to upgraded availability and quality of air transportation, both passenger and commercial, from the region's airports.
Goal: Maximize the use of existing recreation and cultural resources and further develop their
potential as an important element of the area's economy. The area's recreational resources attract tourists, and play a key role in industrial and commercial recruitment.
Objective: Encourage cooperation amongst private sector, governmental agencies, and public and
private organizations in implementing and promoting recreation and cultural programs and facilities. Further develop tourism's role in the economic base of the region.
Objective: Proper maintenance should be ensured for existing and proposed recreational and
cultural facilities. Encourage and promote the development of recreational facilities, in relationship to the size of the community, in accordance with their Recreational Plan.
Objective: Promote the economic benefits of natural resources, parks and recreation.

49
Objective: Improve access and promote recreational activities along the Region’s major water corridors.
Objective: Cultural and artistic opportunities should be supported, funded and promoted in an
effort to enhance and broaden our community's experience Objective: Promote cooperation and communication among Regional Planning Commissions, the
Upper Peninsula Travel and Recreation Association, the Michigan Economic Development Corporation and other economic development organizations in the Upper Peninsula for complete integration of promotional efforts and joint projects.
Objective: Encourage and assist the development of high quality tourism and convention centers
and cooperative efforts to create tourist destination areas. Objective: Support the use and development of public parks, access areas, historic attractions,
recreational trails, enhancement of recreation areas, wildlife and scenic areas.
Objective: Support those efforts that will expand tourism to a year-round industry.
Goal: Preserve and enhance the viability of Eastern Upper Peninsula communities’ downtown
districts.
Objective: Assist local communities in developing plans, researching funding options, and initiating activities to preserve and enhance the viability of their downtown areas.
Objective: Promote and encourage the development and enhancement of community centers,
preferably in concentrated population areas, for the poor, elderly and underprivileged.
Goal: Rehabilitation and maintenance for existing facilities should be ensured.
Objective: Encourage the utilization of programs that focus on rehabilitation of existing housing (both owner and rental) and observing the need for housing within the Eastern Upper Peninsula Region.
Objective: Attention toward longer-term housing needs for persons and families associated with
the Department of Corrections. Initiation of programs to target the corrections employees’ population for moderate-income households.
Objective: Attempt to address the issue of housing shortages in communities currently suffering
from a housing shortfall. Continue to address affordability issues associated with home ownership/acquisition within the region.
Goal: Promote natural resource protection and environmental quality
Objective: Continued involvement in the Great Lakes Water Quality Agreement, between the U.S.
and Canada, which calls for a program to clean up the Great Lakes System to acceptable levels for all desired uses within the next decade.
Objective: Promote education opportunities that will increase awareness to the preservation of the
region’s natural areas and resources, such as water, farmland, forests and natural habitats.

50
Objective: Care must be given to special scenic, historic, and wilderness areas as identified by concerned individuals and organizations. Such sites should be treated in a way that preserves or adds to their uniqueness.
Goal: Promote regional collaboration amongst economic development organizations both within and
across District boundaries.
Objective: Enhance relationships public and private economic development initiatives across
district and regional boundaries and create opportunities to work collaboratively on relevant projects.
Objective: Strengthen and expand initiatives, projects and programs that foster regional
collaboration. Objective: Continue to enhance relationships and collaboration across international boundaries,
specifically with regard to the Sault Ste. Marie Ontario Economic Development organizations.


(percent) (count)5.88% 1
52.94% 935.29% 6
5.88% 1Totals 100% 17
(percent) (count)75% 12
12.50% 212.50% 2
Totals 100% 16
(percent) (count)6.25% 1
31.25% 550% 8
12.50% 2Totals 100% 16
(percent) (count)6.67% 1
33.33% 540% 620% 3
Totals 100% 15
(percent) (count)80% 12
13.33% 20% 0
6.67% 1Totals 100% 15
(percent) (count)14.29% 242.86% 635.71% 5
7.14% 1Totals 100% 14
LimitedNone
LimitedNone
6.) North Arrow Log Homes Business Expansion (multiple choice)Responses
SignificantModerate
LimitedNone
5.) Frontier Renewable Resources Infrastructure (multiple choice)Responses
SignificantModerate
LimitedNone
4.) Bay Mills Community College Admin Building (multiple choice)Responses
SignificantModerate
LuceMackinac
3.) Bay Mills Community College Child Development Center (multiple choice)Responses
SignificantModerate
SummerFallWinter
2.) Which county are you from? (multiple choice)Responses
Chippewa
Turning Results by Question
Session Name: REDAC 5-25-2011 10-10 AMCreated: 5/25/2011 2:09 PM
1.) What is your favorite season (multiple choice)Responses
Spring
Appendix B B-1

(percent) (count)43.75% 737.50% 612.50% 2
6.25% 1Totals 100% 16
(percent) (count)17.65% 323.53% 452.94% 9
5.88% 1Totals 100% 17
(percent) (count)56.25% 931.25% 5
6.25% 16.25% 1
Totals 100% 16
(percent) (count)13.33% 253.33% 826.67% 4
6.67% 1Totals 100% 15
(percent) (count)0% 0
70.59% 1229.41% 5
0% 0Totals 100% 17
(percent) (count)37.50% 656.25% 9
6.25% 10% 0
Totals 100% 16
LimitedNone
LimitedNone
12.) South Borgstrom Road Improvements (multiple choice)Responses
SignificantModerate
LimitedNone
11.) Hudson Township Electrical Upgrades (multiple choice)Responses
SignificantModerate
LimitedNone
10.) DeTour Village Business/Industrial Park (multiple choice)Responses
SignificantModerate
LimitedNone
9.) Winter Test Program (multiple choice)Responses
SignificantModerate
LimitedNone
8.) Furlong Company Superior Pellets (multiple choice)Responses
SignificantModerate
7.) Rail Spur Track Development (multiple choice)Responses
SignificantModerate
Appendix B B-2

(percent) (count)12.50% 2
6.25% 150% 8
31.25% 5Totals 100% 16
(percent) (count)5.88% 1
29.41% 558.82% 10
5.88% 1Totals 100% 17
(percent) (count)12.50% 231.25% 543.75% 712.50% 2
Totals 100% 16
(percent) (count)93.75% 15
6.25% 10% 00% 0
Totals 100% 16
(percent) (count)58.82% 1011.76% 223.53% 4
5.88% 1Totals 100% 17
(percent) (count)12.50% 256.25% 9
25% 46.25% 1
Totals 100% 16
LimitedNone
19.) Pte. LeBarbe Road Water Line Extension (multiple choice)
LimitedNone
18.) Portage Street Water Line Extension (multiple choice)Responses
SignificantModerate
LimitedNone
17.) City of Mackinac Island Waste Water Treatment Plant (multiple choice)Responses
SignificantModerate
LimitedNone
16.) Newberry Green Industries (multiple choice)Responses
SignificantModerate
LimitedNone
15.) Kinross Charter Twp Waste Water Treatment Plant Upgrades (multiple choice)Responses
SignificantModerate
LimitedNone
14.) M-80 to I-75 Water Main Project (multiple choice)Responses
SignificantModerate
13.) Former Sunrise Inn Renovation Project (multiple choice)Responses
SignificantModerate
Appendix B B-3

(percent) (count)6.67% 1
53.33% 826.67% 413.33% 2
Totals 100% 15
(percent) (count)12.50% 231.25% 5
50% 86.25% 1
Totals 100% 16
(percent) (count)6.25% 1
43.75% 737.50% 612.50% 2
Totals 100% 16
(percent) (count)40% 6
33.33% 526.67% 4
0% 0Totals 100% 15
(percent) (count)0% 0
21.43% 350% 7
28.57% 4Totals 100% 14
(percent) (count)100% 15
0% 00% 00% 0
Totals 100% 15
LimitedNone
LimitedNone
24.) Regional Broadband Upgrades (multiple choice)Responses
SignificantModerate
LimitedNone
23.) Portage Township North Road Bypass (multiple choice)Responses
SignificantModerate
LimitedNone
22.) Portage Township Sanitary Sewer Development (multiple choice)Responses
SignificantModerate
LimitedNone
21.) Tahquamenon Area Civic Center (multiple choice)Responses
SignificantModerate
LimitedNone
20.) Newberry Water System Upgrade (multiple choice)Responses
SignificantModerate
Responses
SignificantModerate
Appendix B B-4

(percent) (count)18.75% 3
50% 831.25% 5
0% 0Totals 100% 16
(percent) (count)40% 640% 6
13.33% 26.67% 1
Totals 100% 15
(percent) (count)6.25% 1
43.75% 737.50% 612.50% 2
Totals 100% 16
(percent) (count)37.50% 6
50% 86.25% 16.25% 1
Totals 100% 16
(percent) (count)6.25% 1
12.50% 262.50% 1018.75% 3
Totals 100% 16
(percent) (count)25% 4
37.50% 625% 4
12.50% 2Totals 100% 16
LimitedNone
LimitedNone
30.) Cannelton Superfund Site Infrastructure (multiple choice)Responses
SignificantModerate
LimitedNone
29.) Camp Lucas Infrastructure (multiple choice)Responses
SignificantModerate
LimitedNone
28.) Ashmun Streetscape Project (multiple choice)Responses
SignificantModerate
LimitedNone
27.) Ashmun Bay Park Improvements Phase III (Linear Trail) (multiple choice)Responses
SignificantModerate
LimitedNone
26.) Airport Industrial Park Infrastructure (multiple choice)Responses
SignificantModerate
25.) Airport Industrial Park 14th Ave. Extension (multiple choice)Responses
SignificantModerate
Appendix B B-5

(percent) (count)6.25% 1
18.75% 356.25% 918.75% 3
Totals 100% 16
(percent) (count)81.25% 1318.75% 3
0% 00% 0
Totals 100% 16
(percent) (count)23.53% 441.18% 729.41% 5
5.88% 1Totals 100% 17
(percent) (count)87.50% 1412.50% 2
0% 00% 0
Totals 100% 16
LimitedNone
LimitedNone
34.) International Bridge Toll Plaza Improvements (multiple choice)Responses
SignificantModerate
LimitedNone
33.) North Huron Scenic Pathway Submitting Agency: St. Ignace DDA (multiple choice)Responses
SignificantModerate
LimitedNone
32.) North State Street Sewer Project (multiple choice)Responses
SignificantModerate
31.) Little Bear East Facility Expansion (multiple choice)Responses
SignificantModerate
Appendix B B-6

1 October 3, 2010
MICHIGAN PROSPERITY INITIATIVE: Region 11 -- Major Assets and Strategies
Top Draft Priority Strategies,
Eastern Upper Peninsula Planning & Development Commission
• Identify the regional elements of, and pursue the further development of a recreation/tourism cluster (integrated geographic marketing—day trips, etc. and integrate with arts and culture, coordinate with placemaking strategies).
• Strengthen economic ties to Canada (specifically Sault Ontario)/Wisconsin/Minnesota/Chicago/Lower Peninsula of Michigan.
• Develop economic gardening and entrepreneurial support programs including support for web-based businesses and telecommuting opportunities
• Creation of a regional Capital Investment group to foster entrepreneurial activities (if such a group exists better promote or market this entity).
• Build on the higher education cluster in the region; expand enrollment, research and entrepreneurial activity; raise educational attainment of the region’s workforce to help attract more knowledge workers to the region.
• Develop a 21st century vision for broadband/cellular service, highways, rail service and air service that focuses first on large towns in the region.
• Provide broadband access in the un/underserved areas of the EUP. • Promote regional collaboration amongst economic development organizations
and local governments both within and across District boundaries. • Define a positive identity for the region based on existing assets, and refine it as
necessary over time and market the identity based on a region-wide advertising campaign.
• Investments in placemaking regarding the St. Mary’s River, as a place for people to interact with the natural, cultural and historical features that make our area special.
Major Natural & Infrastructure Assets Natural Assets
• Forests • Minerals • Great Lakes • Inland lakes and rivers • Scenic beauty • Wide-open spaces • Fishing and hunting • Public access lands
Appendix C - RGS

2 October 3, 2010
• Underutilized natural resources including, forest‐related industries and activities, agriculture, fishing and recreation/tourist development
• Abundance of water for industrial, recreational and residential use • Pleasant environment, which is clean, safe and healthy • Agriculture/value-added agricultural activities • Distinct four seasons and pleasant, drier climate than urban areas • Low incidence of flooding, tornadoes, earthquakes, natural disasters
Infrastructure Assets
• Lake Superior State University • Deepwater ports • Rail connection to Wisconsin and Canada • Locks • Prime location for port facilities/rehab of currently underutilized ports • Excellent north‐south highway access via Interstate‐75 and bridge to Canada • State highways • Regional airport w/daily service to Detroit and connecting flights, Municipal
Airport w/ability to handle Jets as well as refueling and small planes, and four other general aviation airports.
• Cities with sewer and water • Small industrial parks • Mackinac Straits Hospital and Health Center in St. Ignace, War Memorial
Hospital Sault Ste. Marie, Helen Newberry Joy Hospital, and health care/assisted living/end of life care.
Other Assets
• Proximity to Canada/Wisconsin • Populated areas with a unique sense of place (Sault Saint Marie, St. Ignace,
Newberry, Mackinac Island) and which anchor sub-regions • Top tourist destinations (Soo Locks, Mackinac Island and Tahquamenon Falls) • More relaxed, laid-back, simple lifestyle • Distinct 4-seasons • Resilient population • Sense of community/sense of place • Brand recognition (Soo, Mackinac) • Native American Tribes and reservations • Casinos • Low crime rates • Security forces housed here, i.e: Border Patrol, land and marine, Immigration and
Customs Enforcement, Coast Guard
Appendix C - RGS

3 October 3, 2010
Draft Strategies by Category
Diversifying and Globally Connecting Business
• Business assistance o Provide an improved and expanded suite of business assistance services
through a variety of county and local entities, including but not limited to: responding to inquiries from people about business opportunities in
the region; connecting existing businesses to a range of business services by
many nonprofit providers; and helping resolve red tape problems. Coordinating all business assistance entities in the region (e.g.
chambers of commerce, DDAs, county economic development entities, etc.).
Linking businesses to resources for training and market diversification.
Develop a core program targeted towards local economic development organizations efforts to strengthen their business retention programs in the Region.
Deliver business assistance in conjunction with the Small Business and Technology Development Centers and MSU Product Center in the Region.
• Business acceleration
o Identify the regional elements of, and pursue the further development of a recreation/tourism cluster (integrated geographic marketing—day trips, etc. and integrate with arts and culture, coordinate with placemaking strategies).
o Encourage a region-wide advertising campaign. o Strengthen ties to Canada (specifically Sault Ontario)/
Wisconsin/Minnesota/Chicago/Lower Peninsula of Michigan. o Work with U.P. nearby or regional universities to create new opportunities. o Work to grow existing businesses and the number of new businesses;
establish a region-wide culture of collaboration and innovation to attract entrepreneurs and existing business investment (would include investor’s club).
Appendix C - RGS

4 October 3, 2010
o Promote efforts in obtaining financial resources that improve technology, efficiency and global competitiveness in the region’s businesses.
o Support the efforts of the Sault Ste. Marie/Lake Superior State University SmartZone as a vital component of entrepreneurship and business acceleration region-wide.
• Business attraction
o Promote the development of 4-season large resorts. o Develop a detailed inventory of existing industrial sites in the region, and
make it available on a web-based marketing tool. o Complete an analysis of how existing regional clusters can expand using
available sites (target industries that can be competitive). o Maximize the use of existing recreation and cultural resources and further
develop their potential as an important element of the area's economy. The area's recreational resources attract tourists, and can play a key role in industrial and commercial recruitment.
o Compile an inventory of international firms doing business in the Region and foster and educate business on the potentials for exporting products.
o Work with businesses in existing clusters to identify strategies for enhancing those clusters. Existing clusters to focus on:
Forestry and Wood Products Advanced Transportation Manufacturing Value Added Agriculture products/Food Innovation Mining Tourism Health Care Advanced and Flexible Manufacturing Robotics Energy Cluster including ag/forestry biomass for pellets and fuels
and other spin-off high tech ag/forestry products for pharma and nutraceuticals, polymers, organic compounds, etc.
Increasing Capital Funding
o Seek avenues to pursue and facilitate local capital development and attraction for both new and existing businesses as above.
o Creation of a regional Capital Investment group to foster entrepreneurial activities (if such a group exists better promote or market this entity).
Creating an Entrepreneurial Culture
Appendix C - RGS

5 October 3, 2010
• Entrepreneurship, Innovation and Capital Attraction
o Develop economic gardening and entrepreneurial support programs -include support for web-based businesses and telecommuting opportunities
o Engage in region-wide dialogue among business and government leaders to promote the entrepreneurial spirit.
o Development of the Sault Ste. Marie/Lake Superior State University SmartZone initiative to enhance entrepreneurial activity in the region.
o Support the Creating Entrepreneurial Communities effort between St. Ignace and Les Cheneaux, and supporting lessons learned as these communities go through this process.
Advancing Innovation & Technology
o Establish a network of UP business incubators and business/industrial parks
Actively promote and market the regions’ incubators and business/industrial parks.
Take full advantage of the services offered by the Michigan Business Incubator Association.
Establish business plan education and training sessions for all start-up companies and entrepreneurs, as well as training and education for specialty trade certification programs.
o Provide support for business innovation o Engage in region-wide dialogue among business and government leaders
to solicit ideas for, and to support economic innovation.
Educating our Future Workforce
o Build on the higher education cluster in the region; expand enrollment, research and entrepreneurial activity; raise educational attainment of the region’s workforce to help attract more knowledge workers to the region.
Retooling our Existing Workforce
• Workforce Development and Higher Education
o Identify business needs for workforce development across the region..
Appendix C - RGS

6 October 3, 2010
o Increase the post secondary skills and education of the workforce to further increase the competitiveness of the region in the global, knowledge economy.
o Work with community colleges, and private and public colleges and universities to match business needs for workforce development with programs to meet those needs
o Partner with local higher-ed institutions to provide continuing education to local entrepreneurs.
o Higher level of engagement with training/trade schools across the region to infill opportunities for skilled trades when the boomer population retires.
o Build on existing regional workforce training programs that can provide training or retraining for workers in manufacturing, health care, and specific industry clusters such as paper and forest products, digital communications, entrepreneurship and ship building.
o Build on existing health care worker training programs such as the regional skills alliance and community college health training programs to meet the anticipated need for health care and home care workers across the region.
o Others: Regional government and business leaders support early childhood
education programs and their enhancement to include not just lower income populations (ability to pay – programs for)
Regional government and business leaders support parent education programs and their enhancement region-wide
Regional government and business leaders support affordable, quality child care – especially for shift jobs.
Attracting & Retaining Talent
• Population and Talent Retention and Attraction o Engage regional business and government leaders in developing
strategies to retain people already living in the region o Engage regional business and government leaders in developing
strategies to attract people to the region Create a more welcoming atmosphere. Creation of more year round, higher quality, higher wage job
opportunities o Engage regional business and government leaders in developing
strategies to retain the highly educated, skilled, creative and talented already living in the region
Appendix C - RGS

7 October 3, 2010
o Engage regional business and government leaders in developing strategies to attract highly educated, skilled, creative and talented people
o Develop strong internship programs for students at Lake Superior State so they decide to stay in the area.
o Develop a talent attraction program o Develop a capital improvements program (CIP) for the amenities that
attract well-educated retirees. o Develop a capital improvements program (CIP) for the development of
amenities that attract young professionals o Establish incentive programs to attract healthcare professionals. o Gather data and explore programs to capture and utilize the talent of
seasonal and retired residents in the Region Marketing Each Region
• Regional Identity and Image o Define a positive identity for the region based on existing assets, and
refine it as necessary over time and market the identity based on a region-wide advertising campaign.
o Where the region’s identify may need improvement, work with regional leaders to identify strategies for improvement, and then promote those attributes as they develop Strengthen the region as a major tourism destination and as a 2nd place of residence.
o Work with regional business and government leaders to develop a friendly welcoming attitude (start with training of front line workers and wait staff, store clerks, etc.)
o Improve entryway aesthetics and wayfinding o Encourage local communities and the populated areas listed above to
improve the visual quality their entrances and the clarity of directional signs.
o Promoting and marketing the work ethic found in the Region. Strengthening Quality of Place
• Placemaking Improvements o Target catalytic investments in key urban, suburban and rural places
(including Sault Ste. Marie, St. Ignace and Newberry) o Improve wayfinding and accessibility to culturally significant places
(historic and tribal) through the deployment of clear, consistent and distinctive signs.
o Integrate indigenous arts and culture with cities and small towns.
Appendix C - RGS

8 October 3, 2010
o Ensure indigenous building integrity especially of historic structures. o Preserve and enhance the viability of Eastern Upper Peninsula
communities’ downtown districts. o Maintain close access to green spaces in key urban places o Encourage mixed-use development that creates districts with vibrant
economic activity. o Regional units of government adopt mixed use planning elements and
zoning ordinances (such as form-based zoning). o Regional units of government develop planning elements and zoning
ordinance elements to preserve working waterfronts and encourage their presence alongside complimentary uses.
o Create pedestrian and bike friendly infrastructure in key urban places and between regional attractions.
o Development of a region-wide recreational trail network. o Regional units of government and business leaders develop and promote
design guidelines that serve to link urban to rural areas visually, functionally and culturally
o Identify regional assets that serve to maximize 4 seasons as a tool to attract and maintain both a year around population and tourists
o Investments in placemaking regarding the St. Mary’s River, as a place for people to interact with the natural, cultural and historical features that make our area special.
• Cultural and Creative Assets o Local units of government, business leaders and arts and cultural
organizations initiate joint and cross-advertising of activities between arts and cultural organizations
o Inventory the location or clustering of key cultural facilities and activities and develop joint business opportunities and market those facilities and activities
o Provide space for culturally relevant spaces. o Identify space lofts and/or shared apartments for artists throughout the
region. o Create day trip advertising of tourist, cultural and shopping activities o Collaborative and coordinated tourism activities Region-wide to hold
visitors for longer stays. o Convene a tourism summit. o Consider region-wide marketing studies in Door County, Wisconsin as a
pattern for what can be done. o Consider a region-wide market research study on tourism.
Appendix C - RGS

9 October 3, 2010
o Cross-promote natural, historical and cultural features as part of placemaking strategies.
o Utilize the vast resources available within the two tribal nations in the Eastern U.P. to promote and enhance our cultural assets.
Seizing Green Opportunities
• Green Economy and Sustainability
o Engage business owners, university researchers, workforce development agencies and colleges, industry and entrepreneurs on how to leverage regional assets to create green businesses and jobs
Forestry products—cellulosic-based fuel, additional wood products. Forest management (sustainable). Alternative energy
o Encourage the development of alternative energy facilities. o Plan for the effective and sound location of wind turbine generator facilities
in the Region. • Energy efficiency
o Expand residential and commercial energy efficiency programs. o Coordinated effort to market energy efficiency and conservation. Use
‘Transition Town’ or other national recognized model for the Soo becoming an energy efficient, sustainable community as something for us to be known for.
• Others o Continue to promote use of the region's natural resources in an
environmentally sound, safe, and sustainable manner and focus on proactive strategies that promote value-added economic activity within the region.
o Promote natural resources protection and environmental quality. o Convenient healthcare of the highest quality that is affordable. o Promotion and development of the agricultural lands and activities region-
wide, could potentially include value-added operations such as food processing, etc.
o Promote education opportunities that will increase awareness to the preservation of the region’s natural areas and resources, such as water, farmland, forests and natural habitats.
o Care must be given to special scenic, historic, and wilderness areas as identified by concerned individuals and organizations. Such sites should be treated in a way that preserves or adds to their uniqueness.
Appendix C - RGS

10 October 3, 2010
Optimizing Infrastructure Investment
• Infrastructure Improvements o Maintain and improve regional infrastructure o Identify existing infrastructure maintenance and repair needs and develop
a regional capital improvements plan (CIP) to implement that maintenance.
o Develop a regional capital improvements plan (CIP) to implement improvements and expansion of infrastructure (e.g. sewer, water, electric and gas utilities, broadband, digital) where appropriate throughout the entire Region.
o Significantly expand IT-related infrastructure Develop a 21st century vision for broadband/cellular service,
highways, rail service and air service that focuses first on large towns in the region.
Provide broadband access in the un/underserved areas of the EUP. Enhancing Transportation Connections
o Develop long-term air service strategy for the region. o Rehabilitate and promote the available deep water port o Long term: convert M-28-US-2 to 4 lane separated (US 127-like route (not
freeway)). o Promote the development of cruise ships at UP and Canadian ports and
the presence of a wide variety of day-excursions. o Regional units of government with the support of business leaders create
and maintain public transit and dial-a-ride services where economically feasible
Shaping Responsive Government
• Regional Planning & Collaboration o Coordinate and collaborate in the provision of planning and public services o Prepare, adopt and annually update a regional strategic growth plan with
the Involvement of local economic development groups and other local stakeholders and coordinate implementation of the Plan through local economic development groups; state, regional and local governments; and local non profit organizations
Appendix C - RGS

11 October 3, 2010
o Promote regional collaboration amongst economic development organizations and local governments both within and across District boundaries.
o Engage in capacity building activities to improve leadership and service quality across the region.
o Insure complete region-wide data gathering and sharing. o Utilize social networking or some other means to create a more
heightened awareness of the services available throughout the Region, as well as more awareness of what services are needed in the Region.
Appendix C - RGS

Project Name Local GovernmentEstimated
CostFunding Sources
Ambulance/EMS Education Center Bay Mills Indian Community $200-300,000 ICDBG, BIA, SHPO, Private, Tribe
Child Development Center Bay Mills Indian Community $500-600,000 ICDBG, BIA, DOE, USDARD, Tribe
Tribal Administration Building Bay Mills Indian Community unknown ICDBG, BIA, Private, Tribe
BMC Administration/Classroom Facility Bay Mills Indian Community $2.0-3.0 mill ICDBG, BIA, Private, Tribe
Brevort Twp. Community Center construction Brevort Twp. $680,000 USDARD, ARRA, LocalBrevort Twp. Sewer upgrades Brevort Twp. $640,000 USDARD, ARRA, LocalTownship Playground Construction Bruce Twp. $110,850 MNRTF, LocalDunbar Park Playground Upgrades Bruce Twp. $70,000 MNRTF, LocalBoat Launch Construction Bruce Twp. $500,000 MDNR, LocalLes Cheneaux Performing Arts Center Cedarville $3,100,000 MCA, USDA, Private, LocalLighthouse.NET Broadband Project EUP-Wide $64,000,000 RUS-BIP ARRA, Private, Local
North Huron Scenic PathwayChippewa/Mackinac
Counties$57,000,000
MDOT, FHWA, Byways, MEDC, EDA,
Private, LocalFire Hall Construction Clark Twp. unknown USDA, DHS, LocalHessel Marina Expansion Clark Twp. unknown MDNR, MDEQ, USDA, LocalYouth Center Construction Clark Twp. unknown USDA, Private, LocalRecycling opportunities Clark Twp. unknown MDEQ, USDA, Private, LocalGovernment Island Stewardship Clark Twp. unknown MDNR, Private, LocalClark Township Park Clark Twp. Unknown USDA, MDNR, Private, LocalCedarville-Hessel Bike Path Clark Twp. Unknown MDOT, NPS, LocalLes Cheneaux Library - Phase II Clark Twp. Unknown USDA, Private, LocalWatershed Management Plan Clark Twp. Unknown CMI, MDNR, MDEQ, LocalMaritime Museum Restoration Clark Twp. Unknown MSHPO, Private, LocalWelcome Center Construction Clark Twp. Unknown MDOT, FWHA, LocalClark Township Street Sign Upgrade Clark Twp. Unknown MDOT, DHS, LocalWater Pump for Fire Truck Clark Twp. Unknown USDA, DHS, LocalCemetary upgrades Clark Twp. Unknown USDA-RD, LocalCommunity Center Finishing Project Clark Twp. unknown USDA-RD, LocalDafter Twp. Fire Safety Dafter Twp. $250,000 USDA-RD, DHS, LocalPavilion Construction Dafter Twp. unknown USDA-RD, MDNR, Private, LocalPlayground Equipment upgrades Dafter Twp. unknown USDA-RD, MDNR, Private, LocalBall Diamond Improvements Dafter Twp. unknown USDA-RD, MDNR, Private, Local
Water and sewer improvements at Township Pavilion DeTour Area EDC unknown USDA-RD, DNR, Other
Improvements to Village Hall kitchen equipment DeTour Area EDC unknown USDA-RD, Local, OtherCarr Waterfront property development DeTour Area EDC unknown DNR, USDA-RD, Local, OtherImprovements and upgrades to Kinross Twp. Park Kinross Charter Twp. unknown USDA-RD, Local, OtherRe-establish streetscape project along M-80 or another
area of KincheloeKinross Charter Twp. unknown MDOT, CCRC, Local, Other
Kincheloe Araea streetlight upgrades/expansion Kinross Charter Twp. unknown USDA-RD, DOE, Local, PrivateDog Park Project Kinross Charter Twp. unknown USDA-RD, Local, Private, OtherEnergy Efficiency upgrades to township properties Kinross Charter Twp. unknown USDA-RD, DOE, LocalAquatic Research Laboratory & Educational Center
RenoavtionLake Superior State Univ. $9,000,000 ARRA, Private, Local
School of Business, Economics and Legal Study building
renovations/replacementLake Superior State Univ. $20,000,000 ARRA, Private, Local
Pte. LaBarbe Water Extension Moran Twp. $2,275,000 EDA, USDA, Local, Other
Tourism Industry Expansion CooperativeMoran Twp. / Sault Tribe of
Chipp. Ind.unknown ICDBG, Local, Private, Tribe
Newberry Sidewalk Replacement Newberry, Village of unknown MDOT-TE, FHWA, LCRC, LocalAtlas Park Improvements Newberry, Village of unknown MNRTF, Local
COMMUNITY DEVELOPMENT - PROJECTS THAT NEED FUNDING 2011/2012
Appendix D D-1

Project Name Local GovernmentEstimated
CostFunding Sources
New Street Lighting Rudyard Twp. unknown MDOT, CCRC, LocalPaving of Township Park Walking Trail Rudyard Twp. unknown Local, DNRENRTFHistorical Society Museum Construction Rudyard Twp. $96,000 HAL, Private, LocalNew DPW Building Construction Sault Ste. Marie, City of $6,300,000 USDARD, LocalNew Fire Station Construction Sault Ste. Marie, City of $2,000,000 USDARD, TIFA III, LocalCannelton Superfund Development Infrastructure Sault Ste. Marie, City of $850,000 EDA, USDARD, CDBG, LocalAshmun Bay Park Phase III (Linear trail) Sault Ste. Marie, City of $575,000 MNRTF, TEA LU, LocalWest Portage Bike Path Sault Ste. Marie, City of $400,000 TEA LU, Local
Meridian Street Reconstruction (Easterday to 8th Ave. W) Sault Ste. Marie, City of $1,300,000 TEDF, Local
Fort Street Bridge Re-Assembly Sault Ste. Marie, City of $1,270,000 TEA LU, FHWA, MSHPO, LocalNew Police Station construction Sault Ste. Marie, City of $1,400,000 LocalPermanent Music Stage-Shelter Sault Ste. Marie, City of $100,000 TIFA IICamp Lucas Infrastructure Sault Ste. Marie, City of $2,000,000 CDBG, TEDFSherman Park Phase II (campground) Sault Ste. Marie, City of $450,000 MNRTF, LocalAshmun Creek Bio-Reserve Sault Ste. Marie, City of unknown MNRTF, Local, PrivateAshmun Street Streetscape and resurfacing (Power Canal
to Easterday)Sault Ste. Marie, City of $2,000,000 MDOT, Special Assessment
Baraga House Roof Replacement Sault Ste. Marie, City of $20,130 Local
Multi-purpose trail segment (I-75 tunnel to Business Spur) Sault Ste. Marie, City of $300,000 MNRTF, TEA LU, Local
Multi-purpose trail segment (Power Canal Segment) Sault Ste. Marie, City of $300,000 MNRTF, TEA LU, LocalRennovation of old Airport Hanger for Manufacturing
SpaceSault Ste. Marie, City of $150,000 MAC, TIFA III
Airprot Parallel Taxiway Extension Sault Ste. Marie, City of $290,000 MAC, TIFA IIIEnvironmental Asssessment and Wetland Mitigation Plan
for Hangar ExpansionSault Ste. Marie, City of $250,000 MAC, TIFA III
Historic Homes completion Sault Ste. Marie, City of $1,500,000 UnknownSeymour Street (Marquette to 5th Ave. West) Sault Ste. Marie, City of $900,000 TEDF, LocalLower Rivers Islands Phase I Sault Ste. Marie, City of $1,300,000 MNRTF, CZM, TEA LU, LocalLower Rivers Islands Phase II Sault Ste. Marie, City of $700,000 MNRTF, CZM, TEA LU, LocalMeridian Street Upgrades Sault Ste. Marie, City of $1,200,000 MNRTF, CZM, TEA LU, LocalWaterfront Walkway Section 3 Corps Park Sault Ste. Marie, City of $100,000 MNRTF, CZM, LocalWaterfront Walkway Section 4 Brady Park Sault Ste. Marie, City of $370,000 MNRTF, LocalWaterfront Walkway Section 5 Maritime Area Sault Ste. Marie, City of $420,000 MNRTF, LocalWaterfront Walkway Section 6 Alford Park Sault Ste. Marie, City of $520,000 MNRTF, CZM, LocalLittle Bear East Facility Expansion St. Ignace, City of $10,000 SSMTCI, LocalNew Fire Hall Construction St. Ignace, City of $300,000 USDA RD, LocalNew Fire Hall construction St. Ignace, City of $1,500,000 USDARD, Local, PrivateNew Fire/Rescue truck St. Ignace, City of $280,000 USDARD, Local, PrivateWawatam Park Development St. Ignace, City of $210,000 MNRTF, Private, LocalSt. Ignace History of Transportation Museum St. Ignace, City of $250,000 ISTEA, MDOT, FHWA, Local
North Huron Scenic Pathway Development - St. Ignace St. Ignace, City of $5,715,775MDOT, MNRTF, FHWA, Local,
PrivateFire Hall Construction St. Ignace, City of unknown USDARD, Private, LocalStreet rehabilitation St. Ignace, City of unknown MDOT, MCRC, LocalStreetscape expansion (lighthpoles, etc.) St. Ignace, City of unknown MDOT-TE, MCRC, FHWA, LocalBridge across the Carp River Trout Lake Twp. unknown USDARD, Private, LocalNew Snowmobile Trail (off Huckleberry Rd.) Trout Lake Twp. unknown MDOT, FHWA, CCRC, LocalNew ORV Trail System Trout Lake Twp. unknown MDOT, CCRC, FHWA, Local
Trees for Township Park Trout Lake Twp. unknownMNRTF, FHWA, MDOT, Private,
LocalUpdated Road Signage Trout Lake Twp. unknown MNRTF, Private, LocalNational Scenic Byways Grant - land acquisition for
Welcome Center/signageTrout Lake Twp. unknown MDOT, FHWA, Local
Visual Enhancement of business district Whitefish Twp. unknown MDOT, FHWA, CCRC, Local
Appendix D D-2

Date Applicant Project
Funding
Source Total Cost Fed $ Applicant$ State$ Local$ Other$
Program
Income
1/14/2010 Luce County
Advance Life Support Unit and
Vehicle Medical Equipment USDARD $68,000 $27,200 $40,00 $0 $0 $0 $0
2/3/2010 DeTour Area EDC Business Park Infrastructure USDARD $250,000 $227,000 $13,000 $0 $0 $0 $0
2/19/2010 Village of DeTour Business Park Infrastructure MEDC-ICE $390,000 $0 $56,600 $333,400 $0 $0 $0
2/22/2010 EUP ISD
Elementary and Secondary
School Counseling Program Dept. of ED $399,360 $399,360 $0 $0 $0 $0 $0
3/15/2010 Brevort Township Community Center/Library USDARD $300,000 $50,000 $250,000 $0 $0 $0 $0
3/25/2010
Tahquamenon Area School
District
Library Equipment and
Technology Improvement USDARD $11,500 $5,750 $5,750 $0 $0 $0 $0
3/30/2010 Mackinac Island State Park Spring Trail Upgrade MDNRE $118,500 $0 $0 $50,000 $0 $68,500 $0
4/15/2010 Luce County Power-Pro cots for Ambulances USDARD $46,260 $18,504 $27,756 $0 $0 $0 $0
5/19/2010 Village of Newberry
Emergency Response/Brush Fire
4x4 Pickup and Related Equip. USDARD $50,600 $27,830 $22,770 $0 $0 $0 $0
5/18/2010 Pickford Township
Construction of new Fire Hall
and Ambulance Hall USDARD $1,157,000 $1,107,000 $0 $0 $0 $0 $50,000
5/21/2010 CLMCAA
Early Head Start/Head Start
Program Dept. of ED $3,800,905 $3,040,724 $0 $0 $0 $760,181 $0
5/25/2010 Copper Country ISD Teaching American History 2010 Dept. of ED $1,694,305 $1,694,305 $0 $0 $0 $0 $0
5/25/2010 Village of Newberry
Brush Chipper/Sidewalk
Replacement USDARD $40,000 $20,000 $20,000 $0 $0 $0 $0
6/28/2010 Village of Newberry LED Light Fixtures - M-123 USDARD $110,000 $55,000 $55,000 $0 $0 $0 $0
8/10/2010 Village of Newberry
Water main and water system
improvements USDARD $8,500,000 $8,500,000 $0 $0 $0 $0 $0
7/26/2010 MDNRE Big Trout Lake Acquisiton MDNRE $2,500,000 $0 $0 $2,500,000 $0 $0 $0
8/25/2010
Renewable Resource
Solutions
Linking Fuels Reduction and
Wood Energy USDA FSA $1,000,000 $500,000 $500,000 $0 $0 $0 $0
11/6/2010 Northern MI Foundation
Small Business Loans and
Technical Assistance USDARD $142,225 $95,000 $47,225 $0 $0 $0 $0
$15,767,673 $998,101 $2,883,400 $0 $828,681 $50,000
SPOC 12372 REGIONAL CLEARINGHOUSE REVIEW PROJECTS
Special
Conditions/Terms
Appendix D D-3