2009 wÄrtsilÄ technical journal
TRANSCRIPT


‡
is to help our customers successfully carry out their business. And, as our strategy explains, we want to do it by offering technical solutions that have both a particular focus on the environment, and a full lifecycle approach.
these targets, we listen and communicate with our customers. We actively participate in technical seminars and conferences. We create networks having the best skills in the industry, and we innovate, run research projects, and we design products and solutions.
we have seen that the business environment in which our customers operate is one of continuous change. Environmental issues have been very high on the agenda for many years, and they continue to be so. During recent times, there has been additional attention given to their operating economy. This has naturally always been a focus area for our customers, but it has gained even more importance lately.
of the seriousness with which we view these important areas, is the recent establishment of a new organisation within Wärtsilä, called Delivery Centre Ecotech. This new unit has the overall responsibility of developing technologies and products, using after-treatment technologies, with the aim of reducing engine emissions. The unit’s responsibility also covers energy conversion technologies for the recovery of waste heat and energy, so that they can be re-used as more valuable forms of energy. Wärtsilä has signifi cant know-how within these areas, and has developed and delivered many such technologies. We have, therefore, a good platform for the development of the next generation of products that meet the future needs of our customers.
of In Detail, important areas of business technologies are presented, together with innovative proposals for new concepts, focusing especially on the environment and operating economy. I wish you enjoyable and informative reading.


The Wärtsilä multifuel concept, as introduced with the Wärtsilä 50DF engine a few years back, is now available in a smaller package. While the Wärtsilä 50DF engine provided Wärtsilä with valuable multifuel experience, it was found that for some applications, the 17 MW power capacity of the Wärtsilä 50 DF engine is too much. Therefore, the Wärtsilä 34DF engine with a power range of 2.7 to 9 MW, has been developed based on the same technology.
In terms of technology, it is almost a copy of the Wärtsilä 50DF but on a smaller scale. It uses the same multifuel technology, allowing it to switch fuels during operation without stopping the engine and changing valves. With the ability to switch between gas, light fuel oil (LFO) and heavy fuel oil (HFO), the engine is ideal for situations where there is an interruptible gas supply, or where gas is unavailable for periods of the year.
The 50 Hz version of the Wärtsilä 34DF has a power output of 450 kW per cylinder. The engine is available in 6L (in-line), 9L (in-line), 12V, 16V and 20V cylinder configurations. In combination with a generator, the electric power output ranges from 2590 kW to 8730 kW. This makes it suitable for applications where the Wärtsilä 50DF is too large, and as such, it is a very good complement to the Wärtsilä 34SG spark-ignited gas engine and essentially replaces the Wärtsilä 32DF low-NOX engine. The multifuel capability has the following advantages:1. Good economy: choice of cheapest fuel on the market.2. High reliability: back up fuel available in case of fuel supply problems.
Since the needed power range is wide, different cylinder configurations are available. The 6L, 9L, and 12V and 16V cylinder versions, are aimed at marine applications, and will be particularly suited to any vessels that need to switch to clean natural gas (LNG). The 9L, 16V and 20V versions, are suitable for use in the power industry. Being smaller in size than the Wärtsilä 50 DF, means that they are suitable for flexible power plants based on a number of generating units in parallel (the cascade concept), in the range up to 100 MW. The engines are ideally suited for industrial applications where continuous supply is crucial.
The Wärtsilä 34DF operates on the lean burn principle, whereby the mixture of air and gas in the cylinder has more air than is needed for complete combustion. Lean combustion reduces peak temperatures and, therefore, NOX emissions. It also reduces heat flow to the walls of the combustion
chamber, as well as the tendency for knocking. Because of the reduced heat loss and likelihood of knocking, efficiency is increased and higher output is attained.
Combustion of the lean air-fuel mixture is initiated by injecting a small amount of LFO (pilot fuel) into the cylinder. The pilot fuel is ignited in a conventional diesel process, providing a high-energy ignition source for the main fuel charge, which is a mixture of natural gas and air. To obtain the best efficiency and lowest emissions, the main fuel flow to each cylinder is individually controlled to ensure operation at the correct air-fuel ratio, and with the correct amount and timing of pilot fuel injection.
The engine functions are controlled by an advanced automation system that allows optimum running conditions to be set, independent of the ambient conditions or fuel used. The electronic control system is designed to cope with the demanding task of controlling the combustion in each cylinder, and to ensure optimal

‡
gas mode, the pilot fuel, which is always present, amounts to less than 1% of full-load fuel consumption. The amount of pilot fuel is controlled by the engine control system. When running the engine in backup fuel mode, the pilot is also in use to ensure nozzle cooling and to avoid clogging of the injector tip.
The engine can also be started without using the backup fuel system, in which case, the engine is started on pilot fuel with gas admission activated. The synchronization and loading is achieved on gas. The pilot fuel consumption here is the same, namely less than 1% of full load fuel consumption.
Gas supply: The natural gas is supplied to the engine through a gas regulation unit. The gas is first filtered to ensure a clean supply. The gas pressure, which depends on engine load, is controlled by a valve located in the valve station. At full load, the gauge pressure before the engine is 3.9 bar for a lower heating value LHV of 36 MJ/m3. For lower LHV, the pressure has to be increased. The system includes the necessary shut-off and venting valves to ensure a safe and reliable gas supply.
On the engine, the gas is supplied through large common-rail pipes running along the engine. Each cylinder then has an individual feed pipe to the gas admission valve on the cylinder head. Gas pipes on the engine can have a double-wall design if required for marine applications.
performance in terms of efficiency and emissions, under all conditions, by keeping each cylinder within the operating window. Stable and well-controlled combustion also contributes to less mechanical and thermal load on the engine components. All fuel ignition parameters are controlled automatically during operation.
Incorporated into the system is a cylinder pressure based control. As this control utilizes the measurement of cylinder pressure for combustion optimization, cylinder pressure sensors have been added as standard in each cylinder. Continuous cylinder pressure measurement also contributes to more efficient engine diagnostics and improved safety.
The key technology behind the Wärtsilä 34DF is the fueling and ignition system. The fuel system has been divided into three: one for gas, one for backup fuel, and one for the pilot fuel system, which acts as an igniter. The separate connection for the pilot fuel means that pilot fuel is always present, regardless of whether the engine is running on gas, LFO, HFO, or on liquid biofuel.
The Wärtsilä 34DF can be started in diesel mode, using both main diesel and pilot fuel, or in gas mode. If the engine is started in diesel mode, gas admission is activated when combustion is stable in all cylinders. When running the engine in
Diesel oil supply: The fuel oil supply on the engine is divided into two separate systems: one for the pilot fuel, and the other for backup fuel.
The pilot fuel is elevated to the required pressure by a pump unit. This includes duplex filters, a pressure regulator, and an engine-driven radial piston-type pump. The high-pressure pilot fuel is then distributed through a common-rail pipe to the injection valve at each cylinder. The pilot fuel is injected at a pressure of approximately 900 bar, and the timing and duration are electronically controlled. The backup fuel is separated from the pilot fuel system and is fed to a normal camshaft-driven injection pump. From the injection pump, the high-pressure fuel goes to a spring-loaded injection valve of standard design for a diesel engine.
Injection valve: The Wärtsilä 34DF has a twin-needle injection valve with two separate nozzles. The larger needle and nozzle are used in diesel mode for LFO or HFO operation, and the smaller one for pilot fuel oil - when the engine is running in gas mode - and in backup fuel operation to ensure nozzle cooling. The pilot injection is electronically controlled, and the main diesel injection is hydraulically controlled. The individually controlled solenoid valve allows optimum timing and duration of the pilot fuel injection into every cylinder when the engine is running in gas mode. Since NOX formation depends greatly on the pilot fuel amount, this design ensures very low NOX formation, while still employing a stable and reliable ignition source for the lean air-gas mixture in the combustion chamber.
Gas admission valve: Gas is admitted to the cylinders just before the air inlet valves. The gas admission valves are electronically actuated and controlled by the engine control system to give the precise amount of gas needed to each cylinder. In this way, the combustion in each cylinder can be fully and individually controlled.
Independent gas admission ensures the correct air-fuel ratio and optimal operating point with respect to efficiency and emissions. The gas admission valves have a short stroke and are made of specially selected materials, thus providing low wear and long maintenance intervals.

over from LFO to gas operation, the load could be increased rapidly and deposits were burned out quickly.
In addition to the multifuel system, there are a few other notable technical features.
Lube oil system: Normally gas engines are run using lube oils with lower TBN numbers. Higher TBN numbers are required in HFO operation, where the fuel contains relatively high amounts of acidifying components. There was a question as to whether the lube oil composition would have to be changed
Injection pump: The engine utilizes the well-proven mono-block injection pump, developed by Wärtsilä. This pump withstands the high pressures involved in fuel injection and has a constant-pressure relief valve to avoid cavitation. The fuel pump is ready for operation at all times so that the engine can instantaneously switch over from gas to fuel oil if necessary. The plunger is equipped with a wear-resistant coating.
Pilot pump: The pilot fuel pump is engine-driven. It receives the signal for correct outgoing fuel pressure from the engine control unit and independently sets and maintains the pressure at the required level. It transmits the prevailing fuel pressure to the engine control system.
High-pressure fuel is delivered to each injection valve through a common-rail pipe, which acts as a pressure accumulator and damper against pressure pulses in the system. The fuel system has a double-wall design with an alarm to warn of leakage.
In the event of, for example, a gas supply interruption, the engine switches from gas to fuel oil operation at any load instantaneously and automatically. Furthermore, the separate backup fuel system makes it possible to switch from LFO to HFO without load reduction. The pilot fuel is in operation during HFO operation to ensure nozzle cooling, and has a fuel consumption of less than 1% of full load fuel consumption. Switching over to LFO from HFO operation can also be done without load reduction. From LFO to gas operation, the switch can be made as described above. This operational flexibility is the real advantage of the multifuel system.
The engine can be switched automatically from fuel oil back to gas operation at loads below 80% of the full load. The changeover takes place automatically after the operator’s command, without load changes. During the switchover, which lasts about one minute, the fuel oil is gradually substituted by gas.
Air-fuel ratio control: Having the correct air-fuel ratio under any operating conditions is essential to optimum performance and emissions. For this function, the Wärtsilä 34DF is equipped with an exhaust gas waste-gate valve.
Part of the exhaust gases bypasses the turbocharger through this waste-gate valve. The valve adjusts the air-fuel ratio to the correct value, depending on the varying site conditions, under high engine loads.
As regards the engine’s operation, some extensive validation tests with the Wärtsilä 50DF on HFO were made some years ago. In particular, one interesting problem for the DF engine to overcome was the issue of deposits that build up in the engine after running for a long time on HFO. This raised concerns as to whether this build up would cause problems during gas operation. However, it was found that quite soon after switching

when switching from gas to HFO. However, the engine can run on the same high TBN lube oil when operating on gas.
Like the Wärtsilä 50DF, the Wärtsilä 34DF has an engine-driven oil pump and can be provided with either a wet or dry sump oil system, whereby the oil is mainly treated outside the engine. Marine engines have a dry sump and power plant engines a wet
sump. On the way to the engine, the oil passes through a full-flow automatic back-flushing filter unit with a safety filter for final protection. A separate centrifugal filter cleans the back-flushing oil and also acts as an indicator of excessive dirt in the lubricating oil. A separate pre-lubricating system is used before the engine is started to avoid engine part wear.
Engine cooling: The Wärtsilä 34DF has efficient coolers, with a flexible cooling system design that is optimized for different applications of the heat, depending on the coolant temperature. The cooling system has two separate circuits – high-temperature (HT) and low-temperature (LT). The HT circuit cools the cylinder liner and the cylinder head, while the LT circuit serves the lubricating oil cooler. The circuits are also connected to the respective parts of the two-stage charge air cooler.
The V-type engines are also available with an open interface system, whereby the cooling circuits can be connected separately. This makes optimized heat recovery and an optimized cooling system possible. The LT pump is always in serial connection with the second stage of the charge air CA cooler. The HT pump is always in serial connection with the jacket cooling circuit. Both HT and LT water pumps are engine-driven as standard, meaning that no electricity from the generator is needed to drive these pumps.
Turbocharger: The Wärtsilä 34DF is equipped with the modular-built Spex (single pipe exhaust) turbo charging system, which combines the advantages of both pulse and constant pressure charging. The interface between engine and turbocharger is streamlined with a minimum of flow resistance on both the exhaust and air sides. High-efficiency turbochargers with in-board plain bearings are used, and the engine lubricating oil system is used for the turbocharger. The waste-gate is actuated electro- pneumatically.
The first application for the Wärtsilä 34DF engine will be for the Platform Supply Vessel (PSV) being built at the Aker Yards STX facility in Söviknes, Norway. Wärtsilä will supply three 6-cylinder engines that are able to run on marine diesel oil, heavy fuel oil or natural gas. While the Wärtsilä 34DF engine is well suited to this kind of application, it is just one of many possible uses. It is expected that the first orders for power generation will follow before very long.

Because the combustion chamber cannot be completely sealed, a small amount of gas escapes as “blow-by”, via the piston/cylinder liner gap and the piston rings, into the crankcase. In turbo-charged engines, there is also blow-by gas entering through the shaft sealing in the turbocharger into the crankcase. Since the crankcase is not designed for high pressures, it requires a ventilation pipe to prevent pressure from building up inside.
Because the gas pressure is very high during piston blow-by, it violently tears the lube oil from the walls, breaking it into very small oil droplets to form a fine oil mist. These small oil droplets escape the crankcase via the ventilation pipe. This, in turn, leads
to oil pollution in the close vicinity of the crankcase ventilation outlet and to increased lube oil consumption.
For Wärtsilä, environmental solutions are always the priority. The main source of emissions from a diesel or gas engine is still the exhaust gas. However, as engines become cleaner and more efficient, and equipped with emission abatement systems, the relative impact of the crankcase emissions increases.
Increasingly, new legislation such as clean air acts and environmental regulations, aim to limit or entirely prohibit crankcase emissions from reciprocating engines. This is already happening in certain segments of industry, and it will also affect stationary power generation and the shipping industry in the near future.
Dealing with crankcase emissions might, at first, seem like an easy task. The first thing that usually comes to mind is to install some kind of filter to prevent the oil mist from escaping. As straightforward as this sounds, there are a couple of facts that make filtering difficult.
Maximum allowed crankcase pressureThe crankcase has a large volume and a lot of seals. Therefore, the maximum allowed gauge pressure (over pressure) in the crankcase is 3 mbar. Most conventional types of filter are not able to function properly with such a low pressure drop, especially for longer periods of time.
Oil droplets sizeThe oil droplets are extremely small, most of them being in the range of 0.2-2 μm. Their small size, in combination with the low crankcase gauge pressure, creates a challenge to filtering.
Long service intervalFor any crankcase emission abatement
device, Wärtsilä’s service interval requirement would be a minimum of 8000 hours and preferably 16,000 hours. During this time there should be no need to change any filter insert, or for any maintenance.
EfficiencyA droplet removal efficiency of more than 95% is required.
Little or no consumablesWärtsilä’s environmental policy is to minimize all kinds of waste filter inserts.
DesignThe device should not interfere with the operation of the engine, nor should it have any negative effect on its performance.
Based on the listed requirements, Wärtsilä has tested and evaluated many different filter products. Most of them have failed to live up to their promises. However, one solution based on centrifugal separation, provided by Alfa Laval® showed very promising results, though it had to be adapted for the bigger Wärtsilä engines.
It was therefore decided to start a development project, and to scale-up this solution in co-operation with Alfa Laval. As a result of this development project, the PureVent™ oil mist separator was born.
The basic function of the oil mist separator is very simple (see Figure 2). Oily gas enters at the bottom of the separator. Because of the centrifugal forces, the air is driven to the periphery of the disc stack separating the heavier oil droplets from the lighter gases by centrifugal separation. The cleaned gas, which is very clean since the process abates odour and smoke emissions as well, exits the separator from the upper pipe connection.
The separated oil is collected using a specially designed and tested draining

system. This system prevents the separatedoil from re-entering the clean gas outlet.The drained oil is taken back to the engineoil sump, thereby further minimizing lube oil consumption.
The main benefi ts with the oil mistseparator are:
Very high and stable effi ciency: A stable separating effi ciency of above 98% has been repeatedly measured on the Wärtsilä 20V34SG engine. Proven features, such as the separating disc design and the high rotational speed, originate from Alfa Laval’s mineral oil separator technology. The disc stack speed is boosted by a frequency converter to 7200 rpm for maximum centrifugal force and optimal effi ciency.No infl uence on the crankcase pressure:There is no pressure drop over the separator. In fact, it slightly decreases the crankcase pressure, which is thenneutralized by a restriction valve anda balancing pipe. This gives a stablecrankcase pressure and reliable operation of the engine.Long service intervals: The electric motor and discs are specially designed for the high rotational speed, and have a service interval of 16,000 hours.Low power consumption:The electrical consumption of the oilmist separator is 0.3 to 1.5 kW,depending on engine size. For an enginewith an output of 9000 kW, theelectrical consumption is around 0.5 kW.Robust, non-interference, design:The system is of the add-on type and is, as such, suitable for most engine types. It is designed for a stable crankcase pressure and even in the rare event of a failed separator, the engine can be run normally, thanks to the balancing pipe used as an automatic by-pass line.Lower lube oil consumption:The captured oil is re-circulated backto the engine oil sump.
■
■
■
■
■
■
The fl exible mounted separator, the throttlevalves, and a safety switch are mounted on a steel frame module. Since the processed gas may be explosive, all components insidethe separator are made of spark-proof material.
The oil mist separator module can beboth manually or automatically operated. In auto mode the separator is started/stoppedautomatically when the engine starts/stops.There are also running status indicators onthe module and output signals that can beconnected to the plant or ship automationsystem.
Wärtsilä has plug-and-run oil mist separator modules in various sizes for all Wärtsilä marine and power plant engines (see Figure 3). The modules fi t both new and retrofi t installations. There is also a UL-listed version for the US market.
Gas enginesFor gas engines, the system can also beconfi gured as a closed crankcase ventilationsystem. This will reduce all crankcaseemissions to zero because they arere-circulated into the air inlet of theturbocharger.
InstallationInstallation is a straightforward procedure for all engine types. For engines up to 12 MW,one separator per engine is suffi cient. For bigger engines, two separators in parallel mounted in a common module are used.
Today all new engineering, procurement and construction (EPC) power plants include the oil mist separator as standard. Also, most equipment deliveries include oil mist separators. They have also been installed on a number of sea-going vessels, both as new and as retrofi t installations. In the beginning of 2009 there were approx. 400 oil mist separators installed or on order worldwide.

The resulting frequency deviation ( f ) depends on the power difference ( Pg) by the formula:
f = Pg/Kn (1 – e –t/T)
Where,t = time (s)T = time constant which is
typically 5-10 seconds andKn = the natural control gain of
the network.
Without frequency control, the frequency change would be 1/Kn times the difference in power. Typically, a 10% drop in power input would reduce the frequency by 3-5 Hz. The frequency would then be too low for most of the electrical equipment in the power system, and thus frequency control systems are needed to keep the frequency deviation within +/- 0.2 Hz.
Frequency control is performed in three
sequential phases (Figure 2). The primary control is handled by the frequency governors in the power plants within the power system area. The governors change the power plants’ output in direct proportion to changes in frequency:
Pg/Pgn = - 1/sG x f/fn = - K x f/fn
Where,Pg = change of generator
output (MW)Pgn = generator output (MW)sG = droop of the governor (%)
f = change in frequency (Hz) andfn = nominal frequency (Hz)K = 1/sG.
The primary control is proportional to the difference in frequency, thus some deviation in frequency remains after its action. The proportional control is marked as “P” (proportional) in control systems. It can, therefore, be called a P-controller.
The deviation is corrected by secondary frequency control systems. Without frequency control the frequency would drop according to line 1 in Figure 3. The final frequency will drop to a level whereby the load drop corresponds to the output of the lost power plant. The primary frequency controller limits this reduction to fdyn. The secondary frequency control system corrects the drop to an acceptable level ( fs).
An ideal secondary controller corrects the frequency deviation by using an integral term in the controller:
The daily operation of a power system involves matching generating output to load variations (Figure 1). A utility makes a day-ahead forecast for a planned load and allocates the appropriate amount of power to be delivered from its power plants. However, in reality there are deviations between the planned load and the actual load to be delivered. Additionally, power plants may have forced outages at any time, which can cause disturbances. These deviations and disturbances should be managed by short-term reserves, which are known as frequency control reserves (or frequency response in the US) and operating reserves.
The power system dynamics can be described by the power balance differential equation:
dWk/dt= Pg – Pc
Where,Wk = the kinetic energy of all
rotating machines = ½ J 2
Pg = power generationPc = power consumptionJ = the torque of the machines
= angular speed (rad/s).
This equation explains how the imbalance between generation and consumption (Pg – Pc) will change the rotating energy (Wk) within the system.

Pi = - Ki x ACEi – 1/Tri ACEi dt
Where,Pi = power output after the
secondary controller in control area i
Ki = proportional factor (gain) of the secondary controller in area i
ACEi = area control error (ACE) in control area i
Tri = integration time constant in control area i.
The secondary controller is then classified as a PI-type (proportional integral). In practice the integral term is realized by using ramp loading of the power plants that are in operation.
The area control error (ACE) is defined as:
ACE = P + K x f
Where,P = power control error or
deviation in power balancef = deviation of frequency from
the set pointK x f = frequency control errorK = dependency between deviation
of power and system frequency.
The secondary reserves should be activated within 30 seconds and should be providing full output within 15 minutes (Figure 4). This activation is automatic and the secondary reserves are known also as Automatic Generation Control (AGC) reserves. The secondary control reserves should release the primary reserves for the next disturbance in the system. ‡

In the USA, regulators monitor the frequency control performance by evaluating the power balances of transmission system operators. The compliance factor (CF) of the frequency control is calculated by using the average values of ACE, and frequency deviations within each minute:
CF = ACE/(-10B) x f n
Where,ACE = area control errorB = frequency bias setting of
the control area (MW/0.1 Hz)f n = deviation of frequency
from 60 Hz.
The number of violations will be counted for a period of 10 minutes. Performance of the control system is correct if 90% of these ten-minute period violations during the month are less than the compliance factor.
Each market participant in a system should balance his energy output within 5, 15, 30 or 60 minute intervals, depending on the system. This is done by adding together their purchased and generated energy, and then subtracting from that total the actual amount of energy consumed. If the energy balance of a participant is negative, he has to purchase the balancing energy from the system operator or from the other participants.
The overall balance of the entire power system is managed by the balancing operator, which normally is the transmission system operator. The customers should then buy the difference of their balances from the transmission system operator at the relevant balance energy price.
Imbalance settlements within the UCTE area are evaluated at 15 minute intervals in Austria, Belgium, Germany, Italy, Luxemburg, and the Netherlands. France has 30 minute balancing, and Greece, Poland, Slovenia, and Spain have 60 minute balancing.
Frequency control can be carried out using gas turbines and reciprocating engines. They can be used for primary, secondary, and tertiary frequency control. Primary control is arranged by using a governor
speed droop control system that measures the frequency and controls the engine output in proportion to the frequency deviation.
The primary control of a diesel engine power plant can be activated in two phases. In the first phase, the power plant can change its output by about 30% within 10 seconds, and in the second phase, by another 30% in 30 seconds. This corresponds with the UCTE system’s requirement for primary frequency control.
Thus, a diesel power plant can typically change its output from 40% to 100% (or about 60%) within 30 seconds. A gas engine plant can change its output from 70% to 100% or 40% (or +/- 30%) within 30 seconds. This depends on the type of gas engine used.
Secondary control can be made either manually, or by receiving the Automatic Generation Control (AGC) signals from the dispatch center. The power plant can increase or decrease its output from the midpoint of 70% by +/- 30% within five or ten minutes, depending on the requirements of the transmission system operator.
A gas engine power plant can also be operated in high efficiency mode when only the minimum number of units are connected to the network at each load. If the plant has ten 8 MW units, the plant can provide power at close to maximum efficiency from 4 MW output to 80 MW output. The efficiency will then be close to 44% throughout the full range from 4 MW to 80 MW (Figure 5).
Operating reserves are needed to restore the power system following major outages of the power plants or importing power lines. The amount of operating reserves needed is the same as the largest contingency, which is the largest single unit connected to the system.
Some of the operating reserves may be activated automatically, but typically they are activated manually. They are called spinning or rotating reserves if they are already synchronized to the grid. The non-synchronized reserves are called standing, fast-starting, or non-spinning reserves. Some operating reserves can be arranged by activating load shedding of large consumers.
In the USA, system operators should have enough 10 minute operating reserves to compensate for the loss of the largest contingency, which is typically the largest coal or nuclear unit within the control area. In California, the requirement is 7% of the capacity of the thermal plants and 5% of the hydro plants. Half of the reserves should be spinning reserves that have already been synchronized into the system.
The Pennsylvania, Jersey, Maryland system operator (PJM) defines 10-minute reserves as primary or contingency reserves. These can be synchronized or unsynchronized reserves. Since they should be capable of delivering the full output within 10 minutes, the unsynchronized reserves are known as quick start reserves.

The applicability of power plants as operating reserves depends on the start-up time and ramp rate. Typical values have been given in Table 1. A fast-starting, or flexible power plant, can deliver relatively more operating reserves. In the first 15 minutes, a 160 MW diesel engine plant can deliver 36 MWh of electricity, a 160 MW gas engine plant 29 MWh, and a 160 MW aero-derivative gas turbine plant 20 MWh. Thus, to generate the same amount of electricity within 15 minutes, a gas turbine plant should have an 80% higher power capacity than the diesel plant.
The plans for the German power system are to have about 80,000 MW peak load and 40,000 MW wind power capacity by 2015. According to a German study on different scenarios for wind power (Dena), the estimated additional needed regulation reserves are, on average, +3200 MW and -2800 MW, or a maximum of +7000 MW and -5500 MW. This corresponds to +8.5% and -7% (average) and +17.5% and -14% of the maximum wind power capacity.
However, the experience in Germany shows that flexible plants should cover
20-30% of the wind power capacity to fill the needs of regulation reserves. Thus a 1000 MW wind power system should have 200-300 MW fast starting capacity for back up and regulation purposes. In Colorado, USA, the Xcel Energy utility has built its 220 MW Plains End gas engine plant for balancing the 1000 MW wind power capacity within their system.
The easiest balancing is offered by hydro plants. Regulation down reserves can be achieved simply by closing the water flow into the hydro turbine. In springtime control can be achieved by allowing the water to run over the dam if the reservoir is full. In that way the potential energy will be lost. Excessive wind energy can also be avoided by controlling the pitch of the wind turbines, but then the energy is also lost.
It would be more economical to regulate by lowering the output of any fossil fuel fired plant, and so save fuel at the same time. For a large coal plant, the problem is that if the output is lowered, the efficiency will decrease and there are difficulties in rapidly increasing the output again. Therefore, more flexible power plants, such as diesel and gas engines, gas turbines and combined cycle power plants are needed for balancing. The regulation up power can be created by activating the fast starting plants one by one, which is useful, as the operators should be prepared to fill 50% of wind capacity within two hours (Figure 6).
Power balancing needs will increase rapidly in the future because of the addition of wind power plants. In 2008, wind power added 27,000 MW to the world markets. In the future wind energy will be the biggest contributor of renewable energy, and can contribute 25% of the electricity needs of many countries. With its flexible power plants, Wärtsilä is ready to help these countries to reach their renewable energy targets.

Environmental regulations and guidelines in Europe, the USA, and by the IFC (International Finance Corporation, the private sector arm of the World Bank (WB) Group), ask for the adoption of Best Available Control and Process Techniques (BAT/BACT) that are feasible and cost-effective. From a global perspective, the chosen pollution control and process technology should be practical, cost-effective, and suitable for the specific project according to local conditions (taking into consideration the available technical and financial resources, existing environmental conditions and other infrastructure aspects). The World Bank/IFC Environmental Health and Safety (EHS) Guidelines are today, in practice, the minimum environmental standard for global power plant projects.
Technology development since 1998 can clearly be seen, for example, when comparing WB/IFC ”Thermal Power – EHS Guidelines for New Plants” from 1998 with the current “Thermal Power Plants 2008/General 2007 EHS Guidelines”. The prime mover technique dependent emission limits have become stricter. This supports sustainable development towards a globally cleaner future.
On December 19, 2008, the final version of the Thermal Power Plants EHS (Environmental Health and Safety) Guidelines was published on the World
Bank/IFC’s web pages. This publication concluded the review and update work of the World Bank Group´s EHS Guidelines, consisting in total of 62 Industry Sector EHS Guidelines and the General EHS Guidelines. These new guidelines are now in force, replacing the old guidelines published in the World Bank Pollution Prevention and Abatement Handbook (PPAH) in 1998, and others published between 1991 to 2003 on the IFC’s website.*
The update work on the performance standards for social and environmental sustainability was done earlier.
The EHS Guidelines are technical reference documents with general and industry-specific examples of Good International Industry Practices (GIIP). “The EHS Guidelines contain the performance levels and measures that are generally considered achievable in new facilities at reasonable cost using existing technology. Application of the guidelines within existing power plants may involve the establishment of site-specific targets with an appropriate timetable for achieving them”. The EHS Guidelines are to be used as a technical source of information during the project appraisal activities. When host country regulations differ from the levels and measures presented in the EHS Guidelines, the project is expected to achieve whichever is the more stringent.
Under specific project circumstances, such as a poor existing infrastructure and a sufficient assimilative capacity of the surrounding air-shed, less stringent levels might be appropriate. Examples of infrastructural circumstances are lack of commercially available low sulphur fuels and constrained water supplies. In such cases, a full and detailed justification for any proposed alternative has to be
carried out as part of the environmental assessment (EA). This should justify that the alternative performance level is protective enough of human health and the surrounding environment. In practice, this kind of deviation (“justification”) is, however, only possible with certain IFC financed projects.
The engine manufacturing industry, as represented by Euromot (The European Association of Internal Combustion Engine Manufacturers), has been active in this updating process of the EHS Guidelines by maintaining an open dialogue with WB/IFC.
The Thermal Power Plants Environmental, Health and Safety Guidelines /1/ are intended for thermal plants with a total rated heat input capacity above 50 MW. In comparison to the old guidelines from 1998, the plant threshold is now based on the fuel input capacity and not on electrical output capacity, and thus the “large plant” category has been extended down from an electric output of 50 MW (about 120 MW fuel input based on the higher heating value) plants to include those of about 20/22 MW electric output (50 MWth). As a consequence, emission limits have become much stricter for this new, “big” plant category (50-120 MWth) compared to the previous guidelines.
The Thermal Power Plants document is, besides the General EHS Guidelines, a “joint guideline” and thus intended to be used together with relevant industry sector guidelines in respect to emission limits. For example, the (flue gas) emission limits of the prime movers used in land based oil industry projects regulated by the “Onshore Oil and Gas Development Guidelines” are, for a big combustion plant (> 50 MWth), found in the “Thermal Power Plants Guidelines”, while for smaller plants,

for different engine types and fuels used. It should be noted that in the Thermal Power Plants Guidelines, the liquid-fuel- fired engine type category has been extended compared to the General EHS Guidelines with the dual-fuel (DF) engine type. This is a logical approach, as the DF engine type (optimized for low pressure gaseous fuel operation), being of a different design, has different NOX-emissions in liquid mode than a modern diesel engine. Table 2 presents the emission limits in the new Thermal Power Plants EHS Guidelines and gives brief information on how to comply with these.
the emission limits of the General EHS Guidelines apply. In the Thermal Power Plants Guidelines, prime mover combustion technologies are divided into boilers, reciprocating engines, and combustion turbines. The guidelines contain, amongst other things, the following limits: stack emissions (technique specific ones), control room noise levels, and liquid effluent quality. The guidelines also depict how the ambient air quality should be managed in new power plant projects, and how emission measurements (components to be measured, frequency, etc.) are to be conducted.
It should be noted that the IFC/WB EHS Guidelines’ MW thresholds are based on the higher heat value (HHV), and not the lower heat value (LHV) commonly used in Europe. As a consequence, the IFC/WB threshold for a “big plant” is set lower than in Europe. In other words, a natural gas fired plant with a fuel heat input capacity of 51 MW on HHV basis, is equal to about 46 MWth (depending on the composition of the natural gas) based on LHV. It is thus not currently classified as a large power plant in the European Union (not a part of the Large
Combustion Plant “BREF” (Best Available Techniques Reference) document). Table 1 shows the typical ratios between HHV and LHV for some widely used fuel types.
In the previous “Thermal Power - Guidelines for New Plants” from 1998, the same emission values applied for stationary engine plants, regardless of the stationary engine type or the fuel (liquid/gas) in use. This is changed in the new Thermal Power Plants version, as it was also in the General EHS Guidelines (issued in April 2007). The emission limits are now differentiated ‡
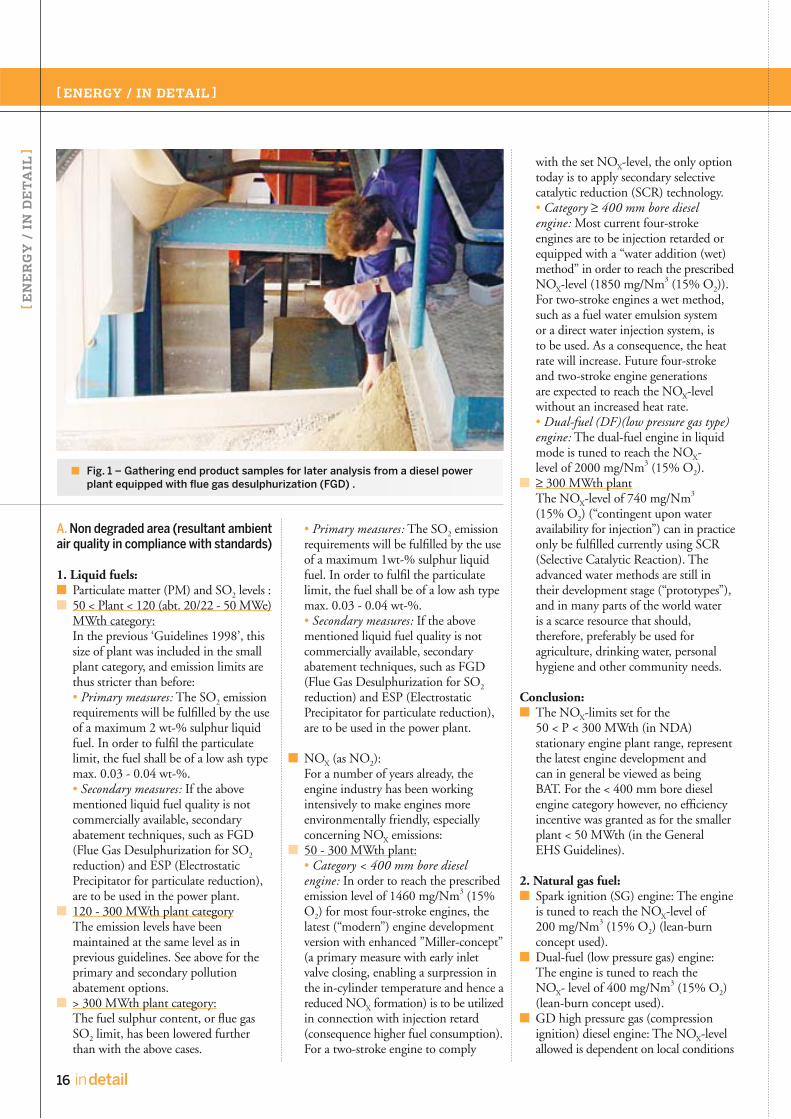
1. Liquid fuels:
Particulate matter (PM) and SO2 levels :50 < Plant < 120 (abt. 20/22 - 50 MWe) MWth category: In the previous ‘Guidelines 1998’, this size of plant was included in the small plant category, and emission limits are thus stricter than before: • Primary measures: The SO2 emission requirements will be fulfilled by the use of a maximum 2 wt-% sulphur liquid fuel. In order to fulfil the particulate limit, the fuel shall be of a low ash type max. 0.03 - 0.04 wt-%. • Secondary measures: If the above mentioned liquid fuel quality is not commercially available, secondary abatement techniques, such as FGD (Flue Gas Desulphurization for SO2 reduction) and ESP (Electrostatic Precipitator for particulate reduction), are to be used in the power plant. 120 - 300 MWth plant category The emission levels have been maintained at the same level as in previous guidelines. See above for the primary and secondary pollution abatement options.> 300 MWth plant category: The fuel sulphur content, or flue gas SO2 limit, has been lowered further than with the above cases.
■■
■
■
• Primary measures: The SO2 emission requirements will be fulfilled by the use of a maximum 1wt-% sulphur liquid fuel. In order to fulfil the particulate limit, the fuel shall be of a low ash type max. 0.03 - 0.04 wt-%. • Secondary measures: If the above mentioned liquid fuel quality is not commercially available, secondary abatement techniques, such as FGD (Flue Gas Desulphurization for SO2 reduction) and ESP (Electrostatic Precipitator for particulate reduction), are to be used in the power plant.
NOX (as NO2): For a number of years already, the engine industry has been working intensively to make engines more environmentally friendly, especially concerning NOX emissions:50 - 300 MWth plant: • Category < 400 mm bore diesel engine: In order to reach the prescribed emission level of 1460 mg/Nm3 (15% O2) for most four-stroke engines, the latest (“modern”) engine development version with enhanced ”Miller-concept” (a primary measure with early inlet valve closing, enabling a surpression in the in-cylinder temperature and hence a reduced NOX formation) is to be utilized in connection with injection retard (consequence higher fuel consumption). For a two-stroke engine to comply
■
■
with the set NOX-level, the only option today is to apply secondary selective catalytic reduction (SCR) technology. • Category 400 mm bore diesel engine: Most current four-stroke engines are to be injection retarded or equipped with a “water addition (wet) method” in order to reach the prescribed NOX-level (1850 mg/Nm3 (15% O2)). For two-stroke engines a wet method, such as a fuel water emulsion system or a direct water injection system, is to be used. As a consequence, the heat rate will increase. Future four-stroke and two-stroke engine generations are expected to reach the NOX-level without an increased heat rate. • Dual-fuel (DF)(low pressure gas type) engine: The dual-fuel engine in liquid mode is tuned to reach the NOX-level of 2000 mg/Nm3 (15% O2).
300 MWth plant The NOX-level of 740 mg/Nm3 (15% O2) (“contingent upon water availability for injection”) can in practice only be fulfilled currently using SCR (Selective Catalytic Reaction). The advanced water methods are still in their development stage (“prototypes”), and in many parts of the world water is a scarce resource that should, therefore, preferably be used for agriculture, drinking water, personal hygiene and other community needs.
Conclusion:The NOX-limits set for the 50 < P < 300 MWth (in NDA) stationary engine plant range, represent the latest engine development and can in general be viewed as being BAT. For the < 400 mm bore diesel engine category however, no efficiency incentive was granted as for the smaller plant < 50 MWth (in the General EHS Guidelines).
2. Natural gas fuel: Spark ignition (SG) engine: The engine is tuned to reach the NOX-level of 200 mg/Nm3 (15% O2) (lean-burn concept used). Dual-fuel (low pressure gas) engine: The engine is tuned to reach the NOX- level of 400 mg/Nm3 (15% O2) (lean-burn concept used). GD high pressure gas (compression ignition) diesel engine: The NOX-level allowed is dependent on local conditions
■
■
■
■
■

(resultant ambient air quality), and will be decided based on the case-specific EA.
3. Bio fuel and gaseous fuels other than natural gas:
The Kyoto impact (sustainability) can be seen here. An incentive for using these fuels is granted by setting a 30% higher NOX-limit, compared to the fossil fuel NOX-limits. Particulate matter limit is set to 50 mg/Nm3 (15% O2) which can be fulfilled by using a low sulphur/ash fuel.
NOX (as NO2) limit: 400 mg/Nm3 (15% O2) for liquid fuels: • Secondary flue gas abatement methods, such as SCR, are needed for liquid fired diesel/dual-fuel/GD engine types. Natural gas fuel: • Dual-fuel engine limit 400 mg/Nm3 (15% O2). • Spark ignition engine limit 200 mg/Nm3 (15% O2). • For SG and DF engines, the engine measures are enough. • For compression ignition (GD) engine (limit 400 mg/Nm3 (15% O2)) in gas mode, SCR is to be applied.Bio fuels/gaseous fuels other than natural gas: • For SG-engine limit 200 mg/Nm3 (15% O2) (case natural gas fuel), for other fuel/engine types 400 mg/Nm3 (15% O2). See above for abatement measures to use.
Particulate matter and SO2 levels (liquid fuels) :SO2: • 50 - 300 MWth plant: 0.5% sulphur liquid fuel or equivalent SO2-limit to be achieved by use of FGD. • 300 MWth plant: 0.2% sulphur liquid fuel or equivalent SO2-limit to be achieved by use of FGD. • For bio fuels no SO2 limit is given.Particulate matter (PM): • Limit 30 mg/Nm3 (15% O2). A low sulphur/ash fuel is to be used (in practice light fuel oil or similar), or depending on the electrical properties of the PM, an ESP (for fossil fuels)/bag filter (bio fuels).
■
■
■■
■
■
■
■
■
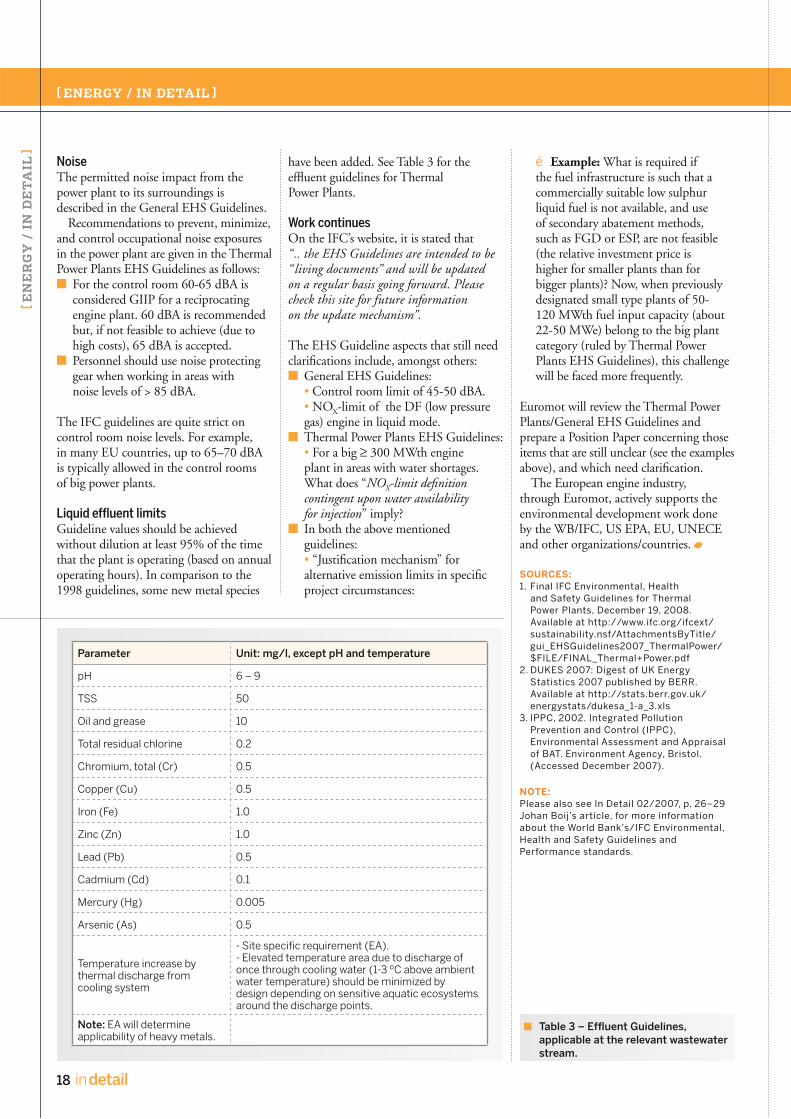
Note: EA (Environmental Assessment) should demonstrate that emissions do not contribute a significant portion to the attainment of relevant ambient air quality guidelines or standards, and more stringent limits may be required.
In the Thermal Power Plants EHS Guidelines, reference is made to the General EHS Guidelines in respect of the ambient pollutant concentrations. It states: “.. emission should not result in pollutant concentrations that reach or exceed relevant ambient quality guidelines and standards by applying national legislated standards or in their absence …other internationally recognized sources. Also emissions from a single project should not contribute more than 25% of the applicable ambient air quality standards to allow additional future sustainable development in the same airshed.”
If the incremental impacts of a project predicted by the Environmental Assessment (EA) are > 25% of relevant short-term AAQ standards following emissions (depending on AAQ standard), PM10/PM2.5/SO2/NOX should be continuously measured in the ambient air. If the ground level impact of a single plant is < 25% of the short term AAQ standards and plant total heat input capacity is 100 P < 1200 MWth, passive sampling or seasonal manual sampling of the ambient air is sufficient.
The IFC approach to the AAQ Guidelines is very strict, and might imply more stringent measures than the relevant national AAQ standard is asking for. Below, some typical approaches within the EU are described as examples.
The EU does not have any specific regulations or guidance as to how the air quality standards should be taken into account in environmental permitting. The individual countries may have different approaches for permitting, and for applying the standards, as long as the limit values are not exceeded and other EU regulations concerning emission sources have been followed. In the EU, the permitting authority is to ensure that the allowed ambient air quality is maintained (below the “ceiling value”).
Approach examples: UK has developed an approach with a simplified calculation method for screening out emissions which are
■
emitted in such quantities that are unlikely to cause a significant impact on the surrounding environment /3/. Detailed modelling (and more work) is required if the long-term impact is greater than 70% of the Air Quality Standards, and the short term impacts are greater than 20% of the AAQ standard.In Finland, permits are based on a case-by-case study, and there are no official guidelines as to how air quality standards should be applied. Before the year 1996, the guideline for any single new emission source was to allow the new facility to contribute 40% of hourly values at maximum in urban areas, and 60% in rural areas.
In the EU (according to Directive 1999/ 30/EC), upper/lower “thresholds” are used when determining AAQ measurement follow-up. The “lower threshold”, depending on the emission component, is typically 40-50%, and the “upper threshold” is 60-70% of the short term limit values.
In case the upper assessment threshold in a zone is exceeded, continuous measurements must be carried out in order to assess the ambient air quality.In case the levels of concentrations are between the lower and upper assessment thresholds, a combination of measurements and modelling techniques may be used to assess the ambient air quality.Where concentrations are below the lower assessment threshold, modelling or objective estimation techniques alone may be used to assess the ambient air quality.
Conclusion: As shown above, in the EU there is no general increment limit for a single plant stipulated and the approach varies from country to country. The IFC/WB Guidelines approach might lead to a stricter implementation than the original rule asked for.In the EU, AAQ CEMS is required if the AAQ upper threshold is exceeded (typically 60-70% of the short term limit, depending on the component). According to the IFC, CEMS (Continuous Emission Monitoring Systems) is required if a single project increment exceeds 25% of the short term limit.
■
■
■
■
■
■
‡
The permitted noise impact from the power plant to its surroundings is described in the General EHS Guidelines.
Recommendations to prevent, minimize, and control occupational noise exposures in the power plant are given in the Thermal Power Plants EHS Guidelines as follows:
For the control room 60-65 dBA is considered GIIP for a reciprocating engine plant. 60 dBA is recommended but, if not feasible to achieve (due to high costs), 65 dBA is accepted.Personnel should use noise protecting gear when working in areas with noise levels of > 85 dBA.
The IFC guidelines are quite strict on control room noise levels. For example, in many EU countries, up to 65–70 dBA is typically allowed in the control rooms of big power plants.
Guideline values should be achieved without dilution at least 95% of the time that the plant is operating (based on annual operating hours). In comparison to the 1998 guidelines, some new metal species
■
■
have been added. See Table 3 for the effluent guidelines for Thermal Power Plants.
On the IFC’s website, it is stated that “.. the EHS Guidelines are intended to be “ living documents” and will be updated on a regular basis going forward. Please check this site for future information on the update mechanism”.
The EHS Guideline aspects that still need clarifications include, amongst others:
General EHS Guidelines: • Control room limit of 45-50 dBA. • NOX-limit of the DF (low pressure gas) engine in liquid mode.Thermal Power Plants EHS Guidelines: • For a big 300 MWth engine plant in areas with water shortages. What does “NOX-limit definition contingent upon water availability for injection” imply? In both the above mentioned guidelines: • “Justification mechanism” for alternative emission limits in specific project circumstances:
■
■
■
é Example: What is required if the fuel infrastructure is such that a commercially suitable low sulphur liquid fuel is not available, and use of secondary abatement methods, such as FGD or ESP, are not feasible (the relative investment price is higher for smaller plants than for bigger plants)? Now, when previously designated small type plants of 50-120 MWth fuel input capacity (about 22-50 MWe) belong to the big plant category (ruled by Thermal Power Plants EHS Guidelines), this challenge will be faced more frequently.
Euromot will review the Thermal Power Plants/General EHS Guidelines and prepare a Position Paper concerning those items that are still unclear (see the examples above), and which need clarification.
The European engine industry, through Euromot, actively supports the environmental development work done by the WB/IFC, US EPA, EU, UNECE and other organizations/countries.
With a fuel energy content utilization of more than 90%, a lean burn gas engine power and heat cogeneration plant is both efficient and environmentally sound. Moreover, by utilizing the fuel energy content to its maximum, the relative CO2 emissions are low.
The ecological footprint of energy consumption can be further reduced when the heat is utilized even more efficiently. This can be achieved by minimizing any pipeline heat losses, and requires that the power plant be located close to its consumers. Being close to a residential area also necessitates that the power plant does not emit harmful substances.
Gas engines produce small amounts of nitrogen oxides (NOX) and particulates. As a result, they do not need secondary emission cleaning of these substances, even when located in densely populated areas within the EU. The same applies in countries with similar emissions legislation to the EU.
On the other hand, the carbon monoxide and hydrocarbon emissions of the gas engine are somewhat higher than the limits within EU. A state-of-the-art gas engine power plant can, however, effectively control its emissions of carbon monoxide and hydrocarbons with the help of an oxidation catalyst. This catalyst is good news for both the environment and the economy, since it requires no consumables and causes no fuel penalty. Moreover, it produces neither waste effluents nor by-products.
In line with customer demand, Wärtsilä Power Plants is a leader in efficient and environmentally friendly energy production technology. For this purpose Wärtsilä has developed a highly standardized oxidation catalyst, the integrated oxi, which can be delivered as a standard component for power plants based on the Wärtsilä 34SG gas engine.
As its name suggests, the integrated oxi is a compact integral part of the power plant design.
This article will describe this new product, and show the features of the integrated oxi as part of today’s state-of-the-art gas engine power plant technology.
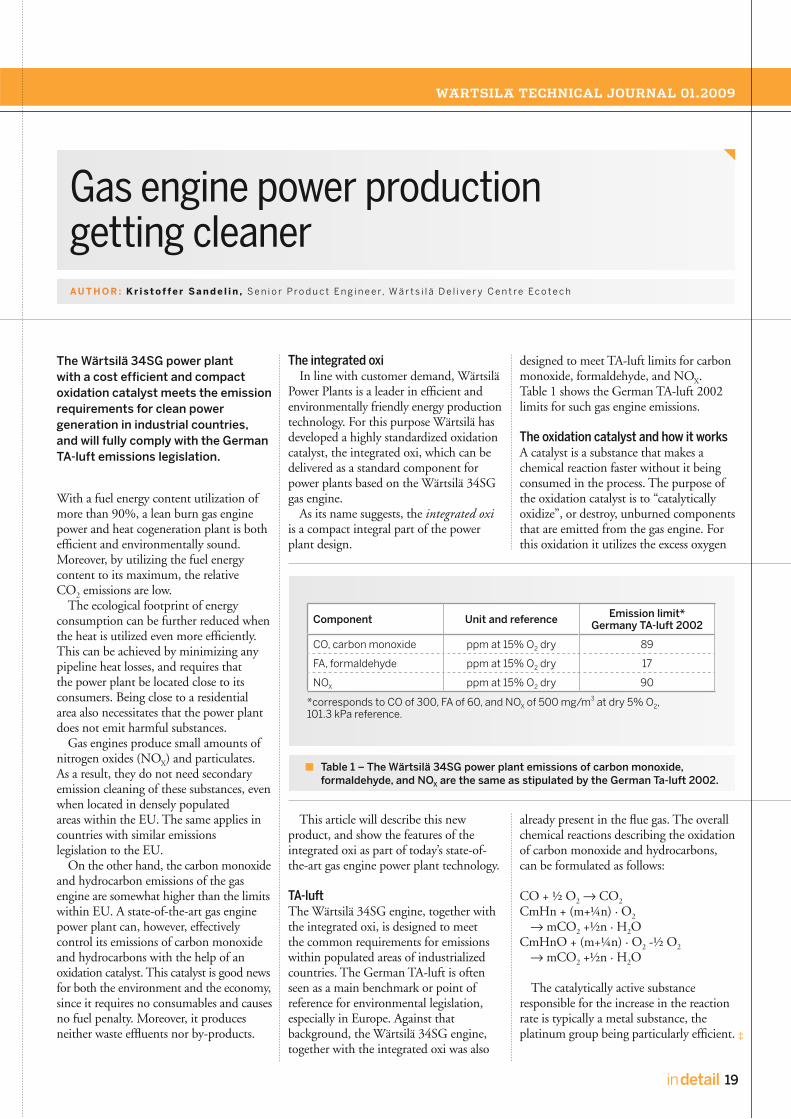
The Wärtsilä 34SG engine, together with the integrated oxi, is designed to meet the common requirements for emissions within populated areas of industrialized countries. The German TA-luft is often seen as a main benchmark or point of reference for environmental legislation, especially in Europe. Against that background, the Wärtsilä 34SG engine, together with the integrated oxi was also
designed to meet TA-luft limits for carbon monoxide, formaldehyde, and NOX. Table 1 shows the German TA-luft 2002 limits for such gas engine emissions.
A catalyst is a substance that makes a chemical reaction faster without it being consumed in the process. The purpose of the oxidation catalyst is to “catalytically oxidize”, or destroy, unburned components that are emitted from the gas engine. For this oxidation it utilizes the excess oxygen
already present in the flue gas. The overall chemical reactions describing the oxidation of carbon monoxide and hydrocarbons, can be formulated as follows:
CO + ½ O2 CO2
CmHn + (m+¼n) · O2 mCO2 +½n · H2O CmHnO + (m+¼n) · O2 -½ O2 mCO2 +½n · H2O
The catalytically active substance responsible for the increase in the reaction rate is typically a metal substance, the platinum group being particularly efficient. ‡

The catalytically active material that is responsible for the removal of the emission components is supported on a catalyst substrate. The substrate element consists of either ceramic material or corrugated materials, such as a metal foil arranged in a “honeycomb” structure. Typically the substrate is then coated with a layer that increases its surface area, which is referred to as the wash coat. Finally, the catalytically active substance is added onto the wash coat. In some cases, the wash coat and the catalytically active substance can be added to the substrate in one step. Figure 1 shows a typical metallic substrate.
The integrated oxi involves a round catalyst element that is fitted in the flue gas duct, with the substrate being of a metal honeycomb type.
In contrast to the conventional gas engine oxidation catalyst with its separate housing, the integrated oxi makes use of already existing equipment, such as existing flanges,
support structures, and most importantly, the bellow.
The catalyst element is mounted close to the engine. More specifically, Wärtsilä recommends that it is installed before the exhaust silencer, since the wool material of the silencers can leave deposits on the substrate, which can potentially create clogging. The integrated oxi cannot be installed downstream of any heat recovery system, and it must be isolated from vibrations and any thermal expansion of the ducts.
The integrated oxi catalyst element is inserted inside the duct next to a bellow. In this way there is no need of a separate catalyst housing, extra flanges, or extra support structures. In most cases, this also enables the service and replacement of the element frame from the existing platforms. As with former Wärtsilä standard designs, the integrated solution also allows for upgrading with an extra element layer. Figure 2 shows the integrated oxi installed in a power plant. A schematic of the integrated oxi is shown in Figure 3.
The integrated oxi has a number of benefits over standard catalytic converters or reactors. Some of its benefits:
no additional flangesno additional support structures or modifications of support structuresno space requirementsno modifications of drawings, savings in design workexisting platforms can be utilizedeasy retrofit productcheaper than a conventional catalyst converter.
Wärtsilä has many years of experience in supplying oxidation catalysts for power plant engines. In gas-fired installations alone, the delivery of oxidation catalysts today exceeds 340 engines and 1.8 GW of power. The integrated oxi was introduced in 2005, and to date Wärtsilä has delivered a total number of 58 catalysts with a total of 470 MW installed power, making the integrated
■■
■■
■■■
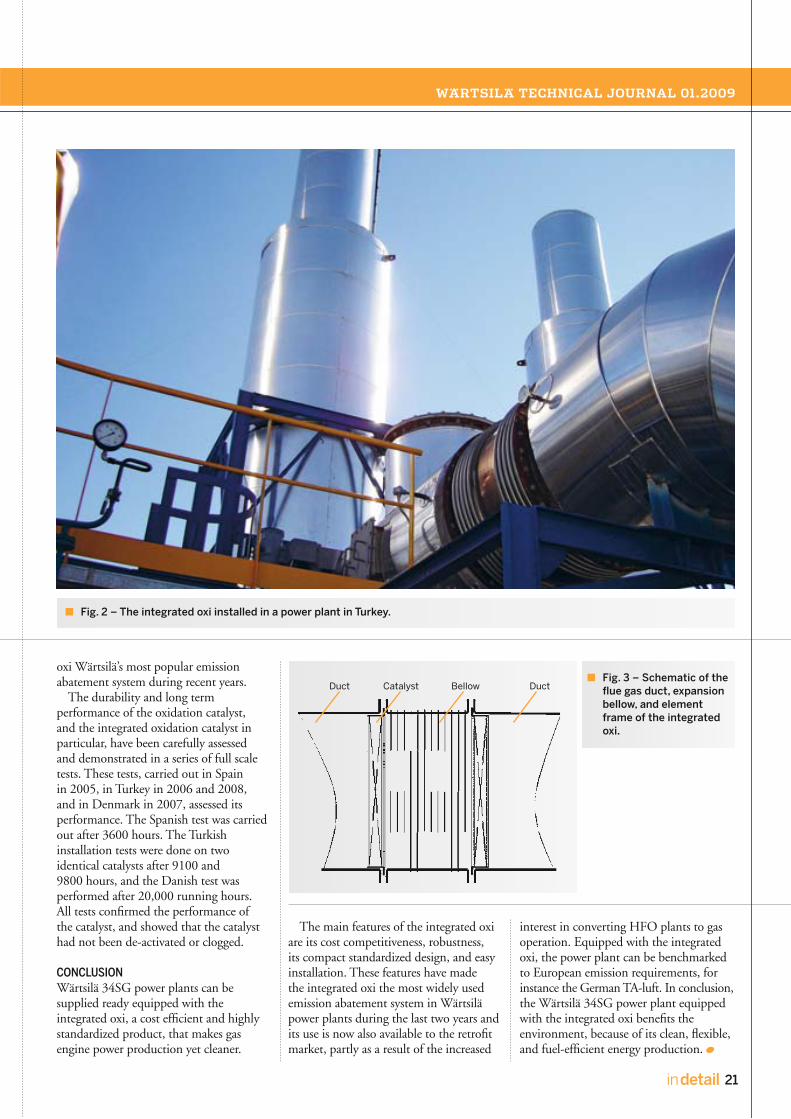
oxi Wärtsilä’s most popular emission abatement system during recent years.
The durability and long term performance of the oxidation catalyst, and the integrated oxidation catalyst in particular, have been carefully assessed and demonstrated in a series of full scale tests. These tests, carried out in Spain in 2005, in Turkey in 2006 and 2008, and in Denmark in 2007, assessed its performance. The Spanish test was carried out after 3600 hours. The Turkish installation tests were done on two identical catalysts after 9100 and 9800 hours, and the Danish test was performed after 20,000 running hours. All tests confirmed the performance of the catalyst, and showed that the catalyst had not been de-activated or clogged.
Wärtsilä 34SG power plants can be supplied ready equipped with the integrated oxi, a cost efficient and highly standardized product, that makes gas engine power production yet cleaner.
The main features of the integrated oxi are its cost competitiveness, robustness, its compact standardized design, and easy installation. These features have made the integrated oxi the most widely used emission abatement system in Wärtsilä power plants during the last two years and its use is now also available to the retrofit market, partly as a result of the increased
interest in converting HFO plants to gas operation. Equipped with the integrated oxi, the power plant can be benchmarked to European emission requirements, for instance the German TA-luft. In conclusion, the Wärtsilä 34SG power plant equipped with the integrated oxi benefits the environment, because of its clean, flexible, and fuel-efficient energy production.
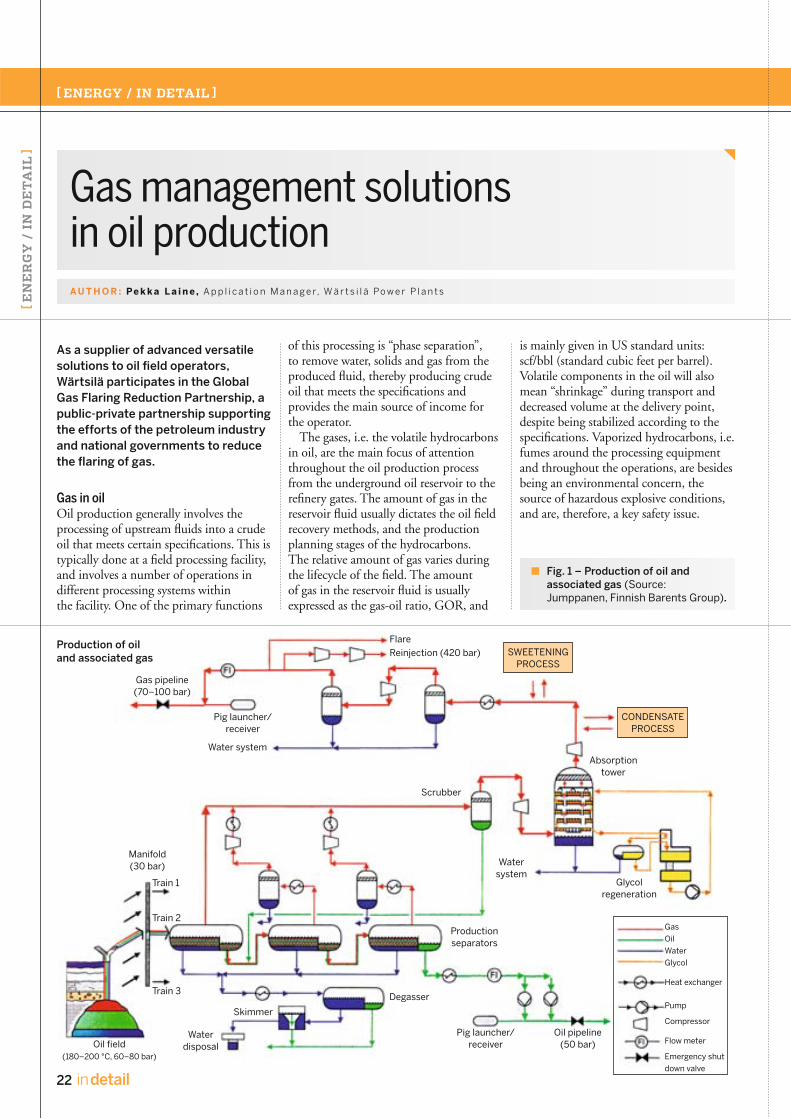
Oil production generally involves the processing of upstream fluids into a crude oil that meets certain specifications. This is typically done at a field processing facility, and involves a number of operations in different processing systems within the facility. One of the primary functions
of this processing is “phase separation”, to remove water, solids and gas from the produced fluid, thereby producing crude oil that meets the specifications and provides the main source of income for the operator.
The gases, i.e. the volatile hydrocarbons in oil, are the main focus of attention throughout the oil production process from the underground oil reservoir to the refinery gates. The amount of gas in the reservoir fluid usually dictates the oil field recovery methods, and the production planning stages of the hydrocarbons. The relative amount of gas varies during the lifecycle of the field. The amount of gas in the reservoir fluid is usually expressed as the gas-oil ratio, GOR, and
is mainly given in US standard units: scf/bbl (standard cubic feet per barrel). Volatile components in the oil will also mean “shrinkage” during transport and decreased volume at the delivery point, despite being stabilized according to the specifications. Vaporized hydrocarbons, i.e. fumes around the processing equipment and throughout the operations, are besides being an environmental concern, the source of hazardous explosive conditions, and are, therefore, a key safety issue.

The major concern in oil production has been the removal of the separated gas from the process in the field processing facility. Traditionally the gas has been considered as a waste and utilized only occasionally. Usually, this gas has simply been flared as an unwanted by-product of oil, due to various reasons that constrained its utilization.
During the last decade, global institutions and organizations, as well as the world´s energy industry, have awakened to the realization that huge amounts of energy are being wasted in flaring. At the same time, flaring also poses a severe threat to the environment.
“The World Bank-led Global Gas Flaring Reduction partnership (GGFR) estimates that globally, around 150 billion cubic meters (bcm) of gas are flared or burned every year, causing some 400 million tons of carbon dioxide in annual emissions. That is equivalent to 30 per cent of the European Union’s gas consumption.
Gas flaring not only harms the environment but also deprives developing countries of an energy source that is often cleaner and cheaper than others available. During the drilling for crude oil, gas usually comes to the surface as well and is often vented or flared instead of used, particularly in countries that lack effective regulations, gas markets, and the necessary infrastructure to utilize the gas.
The U.S. EPA estimates that over 100 bcm of methane is vented or lost through fugitive emissions in the oil and gas sector each year. As methane is a more potent greenhouse gas than CO2, this adds the equivalent of over 1 billion tons of carbon dioxide annually. Altogether, annual emissions from flaring and venting are equivalent to more than twice the potential yearly emission reductions from projects currently submitted under the Kyoto mechanisms.
The major flaring region in the world is Russia and the Caspian (about 60 bcm); followed by the Middle East and North Africa (about 45 bcm). Sub-Saharan Africa (about 35 bcm) is the third-biggest flaring region, followed by Latin America with some 12 bcm of gas flared annually.”
The magnitude and volumes of flared and vented gases are globally monitored, including by satellites, but the exact figures are a matter of discussion. The
general understanding, however, is that the GGFR figures are conservative.
Natural gas used by consumers is composed almost entirely of methane, and termed “pipeline gas” or “utility gas”. It is produced in gas fields, and usually processed to fulfil pipeline quality standards.
The gas in the wellhead fluid, although still composed primarily of methane, is by no means as pure. Natural gas that comes from oil wells is typically termed “associated gas”. This gas can be separate from the oil in the formation (free gas), or dissolved in the crude oil (dissolved gas). Typically, the biggest part of the associated
gases is methane, but nevertheless, in most cases the methane share is below 50%, as shown in Figure 3. The associated gas (AG) also contains heavier (volatile) hydrocarbons; mainly ethane, propane, butane, and pentanes. These heavier hydrocarbons can be condensed and have a higher heat-value, thus AG is in many cases called “wet” or “hot” gas.
In addition, AG may contain water vapour, hydrogen sulphide (H2S), carbon dioxide, helium, nitrogen, and other compounds. Such impurities cannot be handled and transported easily and, moreover, they would make the gas unfit for commercial consumption.
GGFR is challenging the industry ‡

to develop and find methods and technologies to enhance the reduction of flaring, but GGFR is not setting standards or priorities for solutions. GGFR is undertaking a “partnership” role in supporting the efforts and proceedings of the participating countries and the industry, with the focus being on:
Improving the legal and regulatory framework for investments in flaring reductionsImproving international market access for gasProviding technical assistance to develop domestic markets for flared gasDisseminating information, including on international ”best practices”Promoting local small-scale use of gas.
The target is to make de-flaring into an environmentally sound, energy-efficient and profitable concept.
Several oil-producing countries have already included de-flaring sanctions into their production sharing agreements with operators. Also, oil companies such as Shell and Chevron, have committed to de-flaring requirements in their new oil production projects.
Technically, there are several options for the handling and utilization of associated gas, see also Figure 1:1. To provide power and heat for the field facility2. To provide power and heat for the adjacent premises, and for the power and heat grids3. To re-inject gas to maintain the reservoir pressure, or for the enhanced oil recovery (EOR) process4. To re-inject gas for later gas production5. To process the gas for pipeline gas or LNG (liquefied natural gas) production6. To process the gas/NGL (natural gas liquids) for LPG (liquefied petroleum gas) and the petrochemical industry feedstock.
Detailed and comprehensive lifecycle plans for hydrocarbon production will be made for each oil field in order to specify the facility equipment and resources for each production stage, defining mainly:
Upstream flow development in the production stages, e.g. production wells hooking-up programmeWater cut development in
■
■
■
■
■
■
■
the production stagesOil production in the production stages, starting from “early oil” through one or more “oil production plateaus” (the continuous constant production of each stage) into field depletionGOR (gas-oil ratio) through the production stagesTotal cumulative oil recovery target from the reservoirPower demand in the production stages will be an outcome of these plans. The basic concept is electrical power generation for the field facility processes from the upstream to downstream oil shipping pumps. The power generation can be combined with heat recovery (combined heat and power - CHP), if needed.
The oil production plateaus will be the core of the field economy, usually as “BOPD”, barrels of oil-per-day. The revenue to the operator is based on these BOPD, and the production costs are also commonly calculated based on these BOPD. Naturally, there will be fixed costs, and the major reductions will come from the host country in taxes, royalties etc. The utilization of AG will be further evaluated to determine its affect on the cost-per-barrel.
Each oil field is individual and different, notably in terms of the production cost structure in general, and the energy consumption in particular. Energy may constitute a significant cost factor, if procured from the electricity grid. Some of the produced crude oil can be used as fuel for the field facility power plant, in which case the cost can be valued as “lost revenue”. The most economical means is to use waste, i.e. the associated gas if available, as power plant fuel.
Gas-oil ratio (GOR) describes the amount of gas in oil as scf/bbl (also as Nm³/ton). The oil reservoirs are in many cases classified based on GOR, and the term is also used to describe the hydrocarbon liquids in general, see Figure 2.
GOR varies throughout the field’s lifecycle, but in most cases there is enough associated gas to provide field power production. The GOR value is often a matter of discussion within the industry and in particular projects, for example initial GOR vs. produced GOR. The GOR-value up to 2000 indicates light
■
■
■
■
crude oils, and represents the highest normal values of “low-shrinkage” crude oils. However, for example in Russia, GOR on average is about 600 scf/bbl, and in heavy crude oil fields the initial GOR may range from 100 to 200 scf/bbl, as in South America. It is possible that the GOR is even nil, in which case the crude oil is called “dead oil”. At the other extreme, a GOR value of over 4000 means condensate products and further on, ending up as gas with no liquids.
In general, oil production is a very energy intensive operation. Electricity demand for oil production has been (eg. in Russia) on average about 15 kWh/bbl. That figure, however, varies within the range from 5 to 50 kWh/bbl, depending on the “watercut”, the water content in the upstream fluid in particular, and also on the gas re-injection.
The heating value of AG is higher than the lower heating value (LHV) of the pipeline gas, varying in the range of 40 to 50 MJ/Nm³. The average energy need of 15 kWh/bbl could thus be covered with an AG fuelled Wärtsilä power plant, when the GOR-range is about 90–120 scf/bbl.
The excess power, as well as heat, can be distributed to communities adjacent to the field, or to the power grid, if there is feasible access. This provides a possible secondary revenue to the operator, or an opportunity to support the communities of the host country. In some cases this utility service is an obligation to the operator, and the power plant shall therefore be specified accordingly.
The other approach is to specify the field power plant according to the power requirements of the oil production process, and to proceed, with the excess gas utilization separately, as in Figure 1. The first step is to gather the excess AG and store it for future use. In the early stages, oil production begins with the basic gas-oil separation process, “GOSP”, thus the AG production stream will start from the very beginning.
Excess AG can be re-injected immediately into the reservoir, depending on the reservoir structure, to maintain the well pressure. For future use TUGS (temporary underground gas storages) can be drilled. The further processing of that stored AG can be done later, providing naturally that the necessary processing additions have

been installed. The future AG processing will then depend on the development of the infrastructure in the adjacent areas, access to the pipeline gas grid, the LPG market and distribution, and deliveries to (future) petrochemical plants, and so on.
In the economic evaluation of the development of a particular oil field, the reduction of CO2 must also be considered, as the cost, or savings in carbon credits, may create a significant element in the field’s profitability.
The specific solution for power production in oil fields is based on Wärtsilä gas-diesel (GD) technology, for AG-fuelled applications in particular.
The GD technology was introduced in 1987 with the Wärtsilä 32GD, the first gas engine in the Wärtsilä portfolio.
GD technology makes it possible to run the engine on either gas or oil liquids; associated gases of almost any quality and liquid oils from diesel oil to heavy fuel oils, including even crude oils.
GD engines use the diesel combustion cycle in both gas and liquid fuel operation, which gives them the characteristics and rating of a diesel engine at all site conditions. In the gas mode, 4% of the fuel is needed as liquid pilot fuel to initiate combustion. GD technology also provides the excellent efficiency and minimal derating of a modern diesel engine.
An enhanced innovation in the use of GD technology, called fuel sharing, was introduced in 2002 for plant operation where the gas supply is not constant, or where the quality of the gas varies.
The fuel sharing system allows the engine to run on gas and liquid fuel in
different proportions, in order to optimize plant operation according to the availability of the fuels. If, for example, only 30% of the rated output can be achieved with the available gas, the engine makes up the balance of 70% of the output with fuel oil. The operator can freely change the set point of the fuel share, and the control system will ensure that the actual operating point is within the specified operating windows.
An 11 MW power plant at a field facility in Ecuador has been in operation since 2003 using two Wärtsilä 16V32GD units. The plant has been fuelled by the associated gas and crude oil from the processing facility, and it utilizes the fuel sharing system. The fuel sharing is becoming very important now that the AG production is decreasing, and the gas flow has been very limited and highly variable. ‡

Thus, the plant can continue full output operation with a higher share of the liquid fuel, the crude oil. The generating sets had each amassed over 35,000 hours by October 2008, and the power plant has produced more than 300 GWh of electricity. The main components of the AG have been varying as indicated in Figure 5.
GD-engines can be also utilized to drive gas compressors for the re-injection of the excess AG into the well structure to maintain the pressure, to enhance oil recovery, or even to be stored for later gas production, as discussed above.
The economics of the development and lifecycle of a particular oil field are complex and difficult to model with a conventional feasibility study. There are many parameters that influence the model of the various options, and these parameters may change dramatically during the life of the field. For example, the levels of investments needed for the various options are different. The ultimate consideration for the operator is the cost of producing a barrel of oil, but clearly what works for one site may not work for another.
A study of the gas management of oil production was conducted for a 12-year
operation cycle, with the oil production plateau being 50,000 bpd. The associated gas utilization consists of fuelling the field facility power plant, and the re-injection compressing of the excess gas. The re-injection compressors were also powered with the AG fuelled GD engines. The total installed power of the GD engines was 36 MW, but the utilization varied according to the gas production, which is shown in Figure 6.
The total gas production during that 12-year cycle is 6400 mln.nm³ and the peaking GOR is about 1400 scf/bbl. The total fuel gas for the power plant and the re-injection compressors is 700 mln.nm³, corresponding to about 11% of the produced gas during the 12-year cycle. In addition to the stored gas, savings in carbon credits will be about 17 million tons, as opposed to flaring that stored gas throughout the 12-year cycle.
As a supplier of advanced versatile solutions to oil field operators, Wärtsilä is participating in the Global Gas Flaring Reduction partnership to promote the reduction in flaring.
Wärtsilä can be the one-stop supplier for each of these field facility power applications, for both power generation and gas compression. For each of these associated gas utilization applications, the first choice for the driver would be the Wärtsilä GD-engine, not forgetting Wärtsilä’s wide range of other diesel and gas engines, depending on the available fuels. The scope of supply will be tailored from machinery delivery to turnkey plants, and combined with lifecycle maintenance support worldwide.

When the first commercial power systems were brought on line in the late 19th century, grounding was not a major concern. At that time there was still a struggle between competing systems for the generation and distribution of electricity; direct current (DC), and alternating current (AC), and their principal inventors Thomas Edison and Nicolai Tesla.
The principle of using AC won out, mainly due to its advantage of being able to be transmitted at high voltage with relatively low losses. This was demonstrated at the 1891 international Electro-Technical exhibition in Frankfurt, Germany where energy was transmitted at 25 kV over a distance of 175 km from Lauffen am Neckar where it was generated.
Apparently the early power systems were operated ungrounded, mainly because only three wires were needed for the distribution of electric power, this in order to save on material, (the Frankfurt - Lauffen connection used 60 tons of copper wire).
A simple earth fault detection could be employed by connecting Incandescent lamps between phase and ground, whereby a fault could be indicated by one lamp going dark and the other ones glowing more brightly as shown in Figure 1.
One can argue that this system was the first, ”real” grounding system employed, the intention was not, however, to ground but to detect faults.
In time, there was an increased awareness that electrical equipment, especially motors, on these ungrounded systems were prone to insulation failures. This led to the
discovery that ungrounded systems are not ungrounded, but that a connection to ground exists by the system capacitance to ground as illustrated in Figure 5, which under certain circumstances contributed to the failures. The reaction to this was a tendency to simply connect the neutral of, for example power transformers, directly to ground, thereby creating a solidly grounded system.
Solidly grounded systems offered excellent control of over voltages, but with the drawback of very high fault currents. This meant potentially extensive equipment damage and downtime, and concerns were also raised with respect to voltage gradients.
The ”natural” reaction to this was the introduction of current limiting impedance in the grounding circuit. This reactance or resistance, to limit the fault currents, also limited the damage to equipment. This was particularly important in industrial systems where service continuity is a very important factor.
During the period from the 1880’s into the 20th century, the development and employment of electrical systems grew at a tremendous pace throughout the industrial world. Different grounding practices were applied in response to the evolving needs of industry, distribution systems, and regulations.
From the foregoing history we can deduce some of the objectives of system grounding, control of over voltages and fault currents. Generally, the objectives of system neutral grounding are: 1. To limit temporary and transient over voltage1 (TOV) through system design.2. To minimize damage from internal ground faults by limiting the magnitude of earth fault current.1The term transient usually refers to a phenomena lasting from a few micro-seconds to millisecond level. The term temporary usually refers to a phe-nomena lasting from one second to a few minutes.
‡

3. To limit stress on grounded equipment due to external ground faults by limitations of the earth fault current. 4. To provide means for selective ground fault detection.
Methods of system neutral grounding to achieve the above objectives can broadly be categorized as follows: 1. Solidly grounded2. Low resistance grounded 3. Low reactance grounded 4. High resistance grounded5. Ungrounded.
One can also add a sixth system, namely resonant (high inductance) grounding. However, this system is uncommon in industrial applications and will not, therefore, be discussed further in this article.
What is the factor that determines the system grounding method?
There may be no simple or right answer to this question. While any one solution might offer at least one superior feature, it can be at the expense of some other, equally desirable, feature.
To give an example; the more effective the grounding, i.e the higher the current, the better the control of over voltage. However, the higher the current, the more extensive is the equipment damage.
Utilities Utilities generally prefer solidly grounded systems for voltage levels from 69 kV upwards, for their transmission and sub-transmission systems. This is primarily due to the control of TOVs permitting the use of lower rated insulation and surge protection.
At 11-30 kV, practices differ, even
between utilities in the same country. Consideration has to be given to a variety of factors; economics, loads (three-phase or one phase), service continuity, control of over voltage, and even environmental considerations such as isokeraunic levels or soil conditions.
Examples of different practices worldwide can be seen in Table 1.
Industrial systems are often resistance grounded - high or low resistance, or ungrounded for very critical processes. The primary goal here is service continuity and equipment damage control.
A power plant’s medium voltage (MV) distribution system exemplified in Figure 2 is a typical example of an industrial power system:
It is a separately derived power system serving a limited area by a cable network. It is often separated from the rest of the system by Y-D connected step-up
■
■
or step down transformers. It has a high requirement on service continuity and it represents a high capital investment.Extensive down time is costly, even critical.
A system is grounded if intentionally one point is connected to ground, typically a neutral of a generator or transformer, either directly or through an impedance, and a system is ungrounded where there is no intentional connection to ground. A system is furthermore solidly grounded if no intentional impedance is inserted between the neutral and ground.Equipment grounding and system grounding. At this point we need to make a distinction between equipment grounding and system
■
■

grounding as this article discusses the issue of system neutral grounding. 1. Equipment grounding means how the frame or enclosure of electrical equipment is connected to earth.2. System grounding means how the electric neutral is connected to earth.
Ungrounded systemsAs mentioned earlier, a system is ungrounded when there is no intentional connection to ground. Nevertheless, the term ungrounded is a little misleading as there is a connection to ground through the distributed capacitances of the equipment connected cables, transformers, generators, and so on as shown in Figure 5.
In a balanced three-phase system, the vector sum of the capacitive phase currents will be equal to zero, and the vector sum of the phase voltages will also be zero, and thus the neutral will be held at approximately ground potential.
If one phase of the system (phase c) becomes connected to ground due to a fault (see the arrow in Figure 6), then that phase and the ground will have the same potential (ground potential). The voltages in the two healthy phases will then rise to the system phase to phase voltage.
Assuming a solid fault, then the
current in the fault is restricted by the system capacitance to ground and is equal to the sum of the vectors Ia + Ib.
This current can, for a small system, be a fraction of an ampere, while for extensive systems, it can be up to tens of ampere. This low fault current, and the fact that it is varying with the system capacitance connected at any time, makes the proper selection and setting of over current protection a challenge.
Often a protection scheme based on voltage sensing is the only reasonable solution. The connection of high
impedance measuring devices does not change the system characteristics; the system is still ungrounded.
In reality a fault is seldom solid, but often intermittent in nature (arcing or re-striking) and there is a danger of transient over voltage. The transient voltage can reach very high levels of approximately six times the normal phase-to-phase voltages, which can give cause to insulation failure of one of the healthy phases. This results in short circuiting.
There is also a danger of a resonance condition if the fault path includes an ‡

inductive reactance equal, or approximately equal, to the capacitive reactance to ground.
Advantages: Low fault current limited by the system’s capacitance to ground.The system can be operated, at least for a limited period of time, with one ground fault present if correctly designed, providing high service continuity.
Disadvantages:In case of fault, voltages on the healthy phases are equal to line-to-line voltages, thereby affecting the rating of the surge protective devices. Danger of very high over voltages with an intermittent fault.Danger of a resonance condition.Difficult to achieve selective ground fault protection.
Solidly grounded systemsA solidly grounded system is a system where the neutral of a power source is connected directly to ground without any intentional impedance.
A solidly grounded system can further be effectively grounded. One definition of an effectively grounded system, is a system grounded to such a low impedance that the coefficient of grounding (COG)2 does not exceed 80%. This provides good control of over voltages - both temporary and transient. This control of over voltage is the major advantage of a solidly grounded system, and is thus often the determining factor for transmission system grounding.
A non-effectively grounded system is consequently a system where the COG is higher than 80%.
Solid grounding of medium voltage (>1000 V) generator systems are generally not recommended due to the fact that for generators, the zero sequence reactance (Xo) is much less than the positive sequence sub-transient reactance (X”d). Xo is typically half of the X”d value, which means that the ground fault current exceeds the value of a three-phase short circuit current by two. The three-phase short circuit current value being typically the determining factor for the fault current withstand values of electrical equipment.
As the fault current is high, ranging from hundreds of ampere up to tens of kilo ampere, the application of protective devices and the detection of fault currents
■
■
■
■
■■
are relatively straightforward, and ordinary over current sensing devices (fuses, relays) can be applied.
Another problem that may be encountered with low impedance grounded systems, whether they be either solidly grounded or grounded through resistance or inductance, is the circulation of 3rd harmonic current.
The voltage of generators has a low content of 3rd harmonic voltage due to the uneven physical distribution of stator-windings in the generator, which do not produce a fully sinusoidal voltage.
If a generator is then grounded solidly, or by low impedance, and should more than one such grounding point exist in the system, the system will provide a low impedance circulation path for the 3rd harmonic current driven by the 3rd harmonic voltage.
The value of the circulating current depends on the harmonic voltage generated and the impedance of the path in which it circulates, and may result in overheating in the grounding circuit. Therefore, the possible effects should be investigated during the design stage for low impedance grounded systems.
The above is another reason why very low impedance, or solidly grounded, systems are not usual for the grounding of medium voltage generators.
However, if it cannot be avoided by system design, by use of interfacing Y-D connected transformers for isolating the generator grounding from the system grounding, or by the use of separate grounding transformers, the generators should be designed for minimized 3rd harmonic voltage content by utilizing a 2/3 winding pitch. On the other hand, this usually means over sizing of the generator and potentially reduced efficiency.
Advantages: Good control of over voltage, both transient and temporary.
■
Allows the application of lower rated surge protective equipment (surge arrestors or capacitors).Easy and selective fault detection possible.
Disadvantages:Very high and potentially destructive fault currents for internal faults.May cause voltage gradient problems.Causes high stress on the equipment for external faults.May cause 3rd harmonic voltage circulation problems.
Low resistance grounded systems. Low resistance grounding is carried out by inserting a low resistance between the equipment neutral and ground.
Although the resistance value can have various values, it is often chosen to restrict the ground fault current to a value of 50-1000 A. The advantage of low resistance grounding versus solidly grounded systems is the limitation of ground fault current, from several kA to values lower than one kA, while providing good control of temporary and transient over voltage.
The application of protective devices, such as over current relays, is relatively straightforward as the current level is high and allows easy detection.
The current value has historically been dictated by the sensitivity reached by the ground fault relaying. Typically, ground fault detection in a distribution system has been accomplished by residually connected over current relays as shown in Figure 7.
The ratio of the phase current transformers (CTs) used thereby effectively determined the sensitivity. For example, a relay connected to 2000/5 A phase CTs, with a relay pick up at 0.5 A (10% on a 5 A relay input), would require a current value of 200 A to pick up.
Today, with the use of separate window type CTs3 (Figure 8) to measure ground fault current, this is no longer an issue and much lower current values can be safely sensed.
Despite the restriction on fault currents, a fault current of 50-1000 A is a very
■
■
■
■■
■
2COG = Coefficient of grounding, is a term describing the effectiveness of the grounding connection, and is defined as the ratio between phase to ground voltage/phase to phase voltage. It is expressed as a percentage of the phase to ground voltage on a healthy phase during a ground fault, to the phase-to-phase voltage of a healthy system. A related expression is EFF or earth fault factor, which is COG * 3.
3Window type CT or "ring type" is a current transformer enclosing all three phases of a three-phase system, the ground fault current is measured as the vector sum of the phase currents, Ia + Ib + Ic.

high level of current in case of a ground fault, and it might cause considerable damage. The damage associated with a fault is proportional to the energy released at the fault point, which again is a function of current (i) and time (t):
Where (k ) is dependent on the fault
type, typically ranging from 1.5-2,where 2 would be purely resistive heating,assuming a bolted fault.
Thus, a reduction in fault current, that is higher resistance, will give more reductionin fault energy than a corresponding reduction in time, and will thus give lessdamage.
Advantages:Lower ground fault current compared to solidly grounded systems.Good control of temporary and transient over voltages.Easy and selective fault detection.
Disadvantages:Ground fault current levels, while limited, are still at a comparably high level with potentially destructive fault currents. Care should be exercised in the selection of surge protective equipment.Low impedance systems may experience the circulation of a 3rd
harmonic current. Relatively expensive neutral point equipment.
Low reactance grounded systemsLow reactance grounded systems are made by intentionally inserting an inductance
■
■
■
■
■
■
■
between the neutral and ground. In powergeneration, such systems, are almost exclusively used when there is a need to provide generation directly to medium voltage distribution, and where the loadsare single phase and grounded.
There are many concerns related to the application of generation grounding for low reactance grounded systems.
The choice of having the transformers solidly grounded in the distribution system,also limits the choice of methods for the generation system grounding. The generators must be grounded with asystem that provides similar characteristics as the distribution system. Typically, medium voltage generators are not connected solidly to ground because of thereasons already discussed. Therefore,grounding using low-inductance would be
selected.This inductance L has a higher
impedance X for the 3rd harmonic (150 or 180 Hz) than for the fundamentalfrequency (50 or 60 Hz), because ofthe relationship :
Xl = 2 x x f x L
Nevertheless, it is recommended that the generators have a 2/3 winding pitch to prevent the generation of a 3rd harmoniccurrent.
The level of imbalance between thephases must also be assessed, and takeninto account, when selecting the continuousload carrying ratings of the neutral point equipment, and the imbalance withstand-ability of the generator.
The fault current levels in low inductance grounded systems are relatively high. Usually, from three-phase short circuitlevels they are down to about 60% of thosethat permit the use of straightforwarddetection techniques, such as currentrelays and fuses.
Grounding systems at different voltage levels may also be interconnected due to the selected transformer types. A ground fault in one system will be detected as a ground fault in other parts of the system, which might complicate relaying since the available ground fault current will be varying with the system connection. Also, detection of low-level faults might ‡

be difficult, as the relays have to be set to a value above the level of imbalance in the system to be protected.
Because of direct feeding to the distribution network, the generators are exposed to the capacitance of the system, and thus there is a risk of voltage resonance.
Advantages:Limits transient and temporary over voltage to values close to those of a solidly grounded system. Allows the use of lower rated surge protective equipment. Lower ground fault current compared to solidly grounded systems.
Disadvantages:Ground fault current levels, while limited, are still high, with potentially destructive fault currents. Low reactance systems may experience circulation of a 3rd harmonic current. Care should be exercised in rating neutral point equipment with respect to 3rd harmonic current and potential imbalance between phases. Generators might need a special winding pitch and tolerance to imbalance. Relatively expensive neutral point equipment. Resonance conditions might occur.Setting of protective relays might be complicated.
High resistance groundingHigh resistance grounding is carried out by inserting a high resistance between the equipment neutral and ground. Alternatively, if no neutral point is accessible - as in a delta fed system - in the neutral of a grounding transformer.
The absolute resistance value can differ from case to case but is often chosen to restrict the ground fault current to a value of 5-10 A. The main advantage of high resistance grounding, versus low impedance and solidly grounded systems, is the limitation of ground fault current while still providing good control of temporary and transient over voltage.
In order to dampen the temporary and transient over voltage to acceptable levels, the resistance value of the neutral grounding resistor has to be chosen carefully. A value of the resistive current equal to, or slightly higher than, the
■
■
■
■
■
■
■
■
■■
system capacitive current to ground should be chosen. This condition is met when the ohmic value of the resistance (Rn) is equal to, or slightly lower than, the three-phase capacitance to ground (Xcg).
To illustrate the selection of appropriate resistance value as discussed above, please
consider the MV-system in Figure 2.While the total earth-fault current in a
high resistance grounded system is low, the energy in the fault point is not trivial. It is, therefore, good practice to set protection to trip on earth faults with a low intentional time delay, even though the system is
Equipment Qty Phase capacitance to ground Co4 Generators, 15kV, 50Hz 3 0.16 FCables 0.85 km 0.4 μF/kmPower transformer 2 0.005 μFAuxiliary transformer 1 0.002 μF
The system connected capacitance to ground can be calculated as :Co = (0.16 3 + 0.85 0.4 + 2 0.005 + 0.002) FCo= 0,83 FCapacitive reactance to ground seen at the neutral Xcg is the paralleled capacitive reactance of all three phases.
In order to have sufficient damping of the transient over voltage, the ohmic value of the resistance (Rn) is equal to, or slightly lower than, the three-phase capacitance to ground (Xcg).
Rn 1275
Each generator in this example is grounded through a 5 A (1732 ) resistor, thus the resulting resistance is the paralleled value.
Rntotal = , Rntotal = 423 Thus the requirement of Rn Xcg is fulfilled for the system.
423 1275
4The capitance values in this table, while being representative, are given purely for illustrative purposes and may not be used in any actual design.
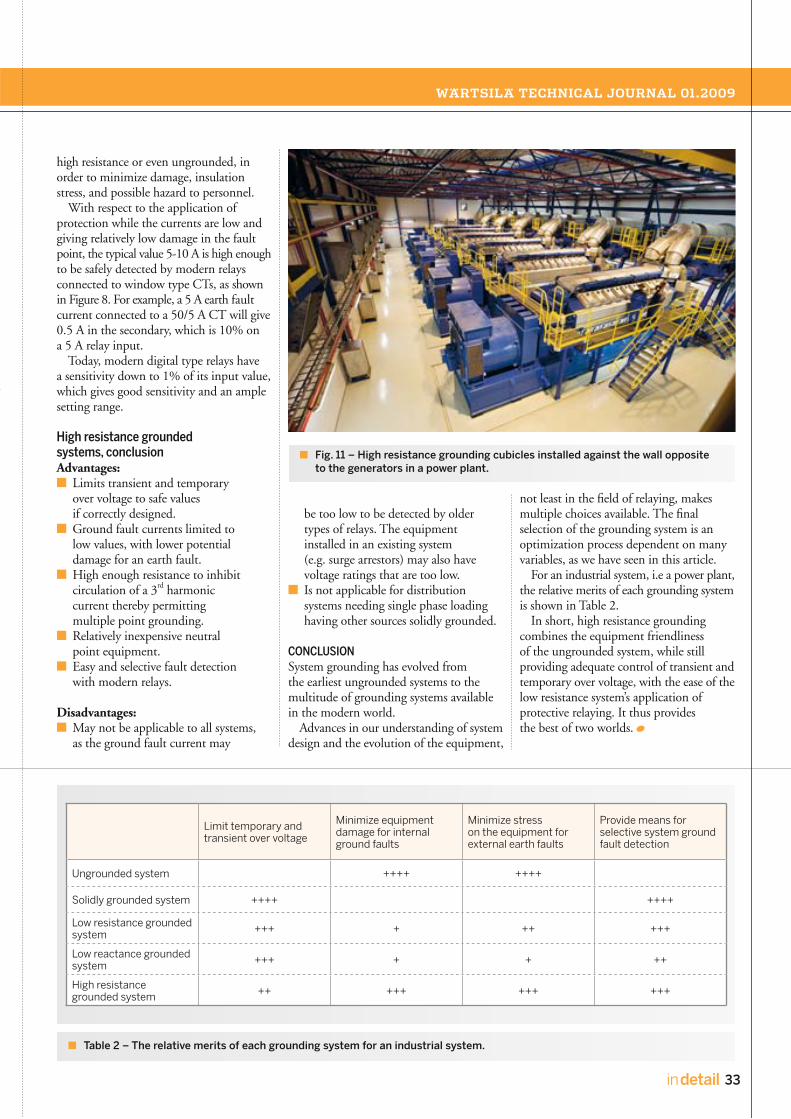
high resistance or even ungrounded, in order to minimize damage, insulation stress, and possible hazard to personnel.
With respect to the application of protection while the currents are low and giving relatively low damage in the fault point, the typical value 5-10 A is high enough to be safely detected by modern relays connected to window type CTs, as shown in Figure 8. For example, a 5 A earth fault current connected to a 50/5 A CT will give 0.5 A in the secondary, which is 10% on a 5 A relay input.
Today, modern digital type relays have a sensitivity down to 1% of its input value, which gives good sensitivity and an ample setting range.
Advantages:Limits transient and temporary over voltage to safe values if correctly designed.Ground fault currents limited to low values, with lower potential damage for an earth fault.High enough resistance to inhibit circulation of a 3rd harmonic current thereby permitting multiple point grounding. Relatively inexpensive neutral point equipment.Easy and selective fault detection with modern relays.
Disadvantages:May not be applicable to all systems, as the ground fault current may
■
■
■
■
■
■
be too low to be detected by older types of relays. The equipment installed in an existing system (e.g. surge arrestors) may also have voltage ratings that are too low.Is not applicable for distribution systems needing single phase loading having other sources solidly grounded.
System grounding has evolved from the earliest ungrounded systems to the multitude of grounding systems available in the modern world.
Advances in our understanding of system design and the evolution of the equipment,
■
not least in the field of relaying, makes multiple choices available. The final selection of the grounding system is an optimization process dependent on many variables, as we have seen in this article.
For an industrial system, i.e a power plant, the relative merits of each grounding system is shown in Table 2.
In short, high resistance grounding combines the equipment friendliness of the ungrounded system, while still providing adequate control of transient and temporary over voltage, with the ease of the low resistance system’s application of protective relaying. It thus provides the best of two worlds.

The high bunker prices reached last year have put engine fuel consumption high on the agenda of shipowners and operators. During 2007 and 2008, bunker prices climbed to the range of USD 700–800 per tonne and then, within a few months, collapsed to the USD 200–300 per tonne range (Figure 1). Such wide variations make it impossible to extrapolate on future pricing, and leave shipowners, operators, and charterers wondering how they could budget for future bunker prices.
In such a bunker price environment, especially when combined with the current state of the world economy and the depressed shipping markets, fuel cost savings are always welcome. To this end, Wärtsilä has given considerable attention to cutting fuel consumption in both new and existing low-speed engines. Fuel saving also has the added benefit of reducing exhaust gas emissions.
Several approaches are currently available for reducing fuel bills with Wärtsilä low-speed engines. Some are long established, but not necessarily well known by ship designers, while there are also new developments, such as Low-Load Tuning. For newbuildings, fuel savings can be achieved through:
Adopting RT-flex electronically-controlled common-rail engines, as they have lower fuel consumption than mechanically-controlled engines.Installing derated engines, to take advantage of the reduced specific fuel consumption across the layout field. [1]
■
■
Adopting Delta Tuning in new RT-flex engines. This focuses on reducing fuel consumption in the operating range below 90% engine load. [2,3]Adopting Low-Load Tuning in new RT-flex engines. This further reduces fuel consumption in the operating range below 75% engine load.High-Efficiency Waste Heat Recovery can be incorporated to various degrees. This offers fuel savings of up to 12% with electrical power generated for ship services and, with high-output engines, also for propulsion assistance.
The complete flexibility in engine setting that is an integral feature of the RT-flex common-rail system, enables fuel injection pressures and timing to be freely set at all loads. It is employed in special tuning regimes to optimize brake specific fuel consumption (BSFC) at individual engine loads.
■
■
■
This concept was first applied in 2004 in Delta Tuning, which reduced BSFC for Wärtsilä RT-flex engines in the operating range below 90% engine load. The concept has now been extended to Low-Load Tuning, which provides the lowest possible BSFC in the operating range of 40 to 70% engine load. With Low-Load Tuning, RT-flex engines can be operated continuously and reliably at any load in the range of 30 to 100%.
Low-Load Tuning is thus well suited to large container ships, which often have to “slow steam”, either to save fuel costs or to suit the ships’ sailing schedules, while still retaining the possibility to sail at full sea speed whenever the need arises. Consider, for example, a post-panamax container ship with a service speed of 25 knots when running the main engine at 90% load (Figure 2). A speed of 22.5 knots requires about 60% engine load, while about 40% engine load is sufficient to give a speed of 20 knots.

Such a ship might be powered by a 12-cylinder Wärtsilä RT-flex96C engine with a contracted maximum continuous rating (CMCR) of 68,640 kW at 102 rpm. At 25 knots, the daily fuel consumption is 268.6 tonnes/day with Standard Tuning, and the benefit of Low-Load Tuning at reduced sea speeds can be seen in Table 1 and Figure 3.
In the case quoted, reducing the ship’s speed from 25 to 20 knots can reduce the daily fuel consumption by 147.2 tonnes/day for an engine with Standard Tuning, or 150.9 tonnes/day with Low-Load Tuning. The extra fuel saving of some 3.7 tonnes/day may not, at first glance, appear significant. Nevertheless, it can amount to an additional annual cost saving of USD 300,000, when fuel costs amount to USD 300/tonne and the ship operates for 6500 hours/year.
The reduced part-load BSFC in Low-Load Tuning is achieved by optimizing the turbocharger match for part-load operation. This is done by increasing the combustion pressure at less than 75% load through an increased scavenge air pressure and a higher air flow (waste gate closed), and by blowing off part of the exhaust gas flow (waste gate open) at engine loads above 85%.
The higher scavenge air pressure at part load automatically results in lower thermal load and better combustion over the entire part-load range.
Low-Load Tuning requires the fitting of an exhaust gas waste gate (a pneumatically-operated valve) on the exhaust gas receiver before the turbocharger turbine. Exhaust gas blown off through the waste gate is bypassed to the main exhaust uptake. The waste gate is opened at engine loads above 85% to protect the turbocharger and the engine from overload.
A Wärtsilä RT-flex engine with Low-Load Tuning will comply with the IMO Tier II regulations for NOX emissions. The parameters for fuel injection and exhaust valve actuation are adjusted throughout the load range to keep the NOX emissions in the same range as without Low-Load Tuning.
Low-Load Tuning has been introduced for large-bore engines, namely the Wärtsilä RT-flex82C, RT-flex82T and RT-flex96C engines. It is planned, however, to extend Low-Load Tuning to the complete Wärtsilä RT-flex engine portfolio. It can be applied in these engine types when the CMCR is at or above 90% of MCR brake mean effective pressure (BMEP). ‡
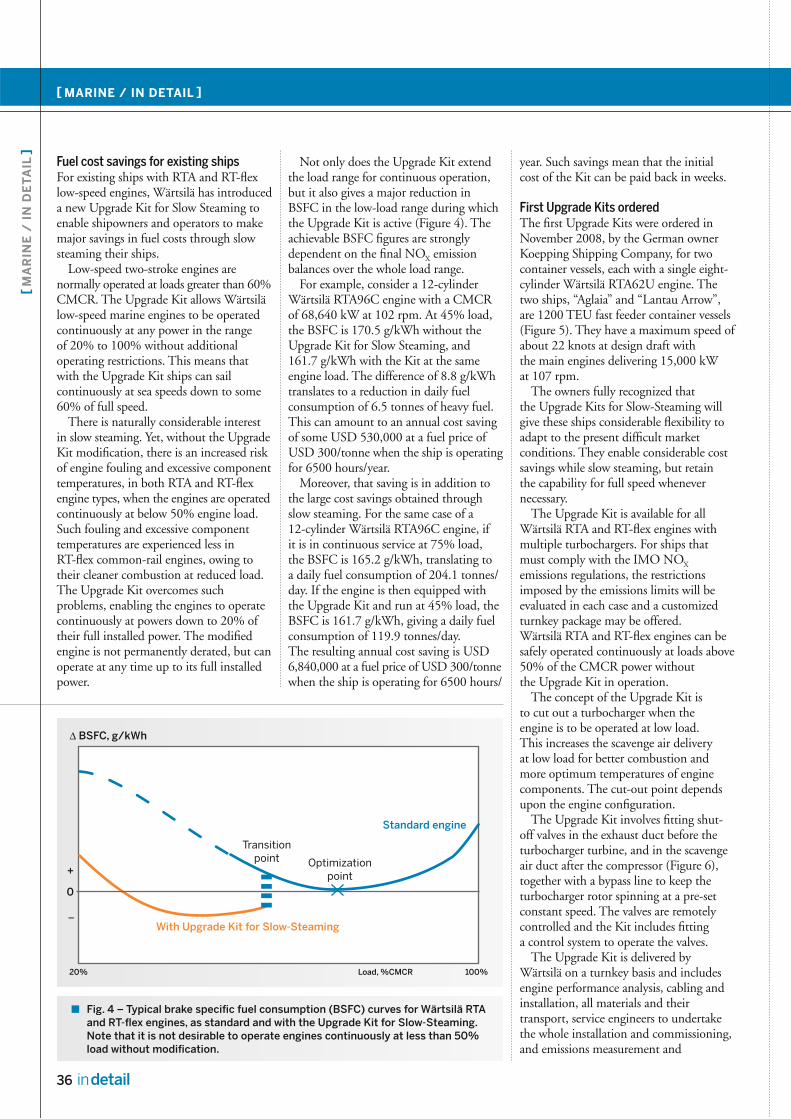
For existing ships with RTA and RT-flex low-speed engines, Wärtsilä has introduced a new Upgrade Kit for Slow Steaming to enable shipowners and operators to make major savings in fuel costs through slow steaming their ships.
Low-speed two-stroke engines are normally operated at loads greater than 60% CMCR. The Upgrade Kit allows Wärtsilä low-speed marine engines to be operated continuously at any power in the range of 20% to 100% without additional operating restrictions. This means that with the Upgrade Kit ships can sail continuously at sea speeds down to some 60% of full speed.
There is naturally considerable interest in slow steaming. Yet, without the Upgrade Kit modification, there is an increased risk of engine fouling and excessive component temperatures, in both RTA and RT-flex engine types, when the engines are operated continuously at below 50% engine load. Such fouling and excessive component temperatures are experienced less in RT-flex common-rail engines, owing to their cleaner combustion at reduced load. The Upgrade Kit overcomes such problems, enabling the engines to operate continuously at powers down to 20% of their full installed power. The modified engine is not permanently derated, but can operate at any time up to its full installed power.
Not only does the Upgrade Kit extend the load range for continuous operation, but it also gives a major reduction in BSFC in the low-load range during which the Upgrade Kit is active (Figure 4). The achievable BSFC figures are strongly dependent on the final NOX emission balances over the whole load range.
For example, consider a 12-cylinder Wärtsilä RTA96C engine with a CMCR of 68,640 kW at 102 rpm. At 45% load, the BSFC is 170.5 g/kWh without the Upgrade Kit for Slow Steaming, and 161.7 g/kWh with the Kit at the same engine load. The difference of 8.8 g/kWh translates to a reduction in daily fuel consumption of 6.5 tonnes of heavy fuel. This can amount to an annual cost saving of some USD 530,000 at a fuel price of USD 300/tonne when the ship is operating for 6500 hours/year.
Moreover, that saving is in addition to the large cost savings obtained through slow steaming. For the same case of a 12-cylinder Wärtsilä RTA96C engine, if it is in continuous service at 75% load, the BSFC is 165.2 g/kWh, translating to a daily fuel consumption of 204.1 tonnes/day. If the engine is then equipped with the Upgrade Kit and run at 45% load, the BSFC is 161.7 g/kWh, giving a daily fuel consumption of 119.9 tonnes/day. The resulting annual cost saving is USD 6,840,000 at a fuel price of USD 300/tonne when the ship is operating for 6500 hours/
year. Such savings mean that the initial cost of the Kit can be paid back in weeks.
The first Upgrade Kits were ordered in November 2008, by the German owner Koepping Shipping Company, for two container vessels, each with a single eight-cylinder Wärtsilä RTA62U engine. The two ships, “Aglaia” and “Lantau Arrow”, are 1200 TEU fast feeder container vessels (Figure 5). They have a maximum speed of about 22 knots at design draft with the main engines delivering 15,000 kW at 107 rpm.
The owners fully recognized that the Upgrade Kits for Slow-Steaming will give these ships considerable flexibility to adapt to the present difficult market conditions. They enable considerable cost savings while slow steaming, but retain the capability for full speed whenever necessary.
The Upgrade Kit is available for all Wärtsilä RTA and RT-flex engines with multiple turbochargers. For ships that must comply with the IMO NOX emissions regulations, the restrictions imposed by the emissions limits will be evaluated in each case and a customized turnkey package may be offered. Wärtsilä RTA and RT-flex engines can be safely operated continuously at loads above 50% of the CMCR power without the Upgrade Kit in operation.
The concept of the Upgrade Kit is to cut out a turbocharger when the engine is to be operated at low load. This increases the scavenge air delivery at low load for better combustion and more optimum temperatures of engine components. The cut-out point depends upon the engine configuration.
The Upgrade Kit involves fitting shut-off valves in the exhaust duct before the turbocharger turbine, and in the scavenge air duct after the compressor (Figure 6), together with a bypass line to keep the turbocharger rotor spinning at a pre-set constant speed. The valves are remotely controlled and the Kit includes fitting a control system to operate the valves.
The Upgrade Kit is delivered by Wärtsilä on a turnkey basis and includes engine performance analysis, cabling and installation, all materials and their transport, service engineers to undertake the whole installation and commissioning, and emissions measurement and

certification. The installation and commissioning of the Upgrade Kit can be completed during the normal commercial operation of the ship, or during normal port calls.
Techniques are thus readily available from Wärtsilä to reduce the fuel consumption of RTA and RT-flex low-speed engines, in both newbuildings and existing ships, to achieve major savings in operating costs. In both cases, shipowners are invited to contact their local Wärtsilä office to find out more about the available fuel cost-saving options. Wärtsilä engineers can advise how these measures might be best applied.

Wärtsilä has attempted to envision how cargo vessels for European trade will look in the near future, what type of technology will be used, and what the operation philosophy will be for such vessels. As a case study, an 1800 TEU container feeder was selected. However, many of the technical features of the developed concept can, of course also be applied to other ships, such as RoRo and general cargo vessels.
The target was to develop a concept offering the best total efficiency, while offering an outset capacity of 1800 twenty foot equivalent container units, and a speed of 21 knots, which is typical for today’s feeders. The requirement was
also to have a concept that will meet or exceed, the emissions legislation that we know will come into force by 2016. The main regulations to comply with are; the IMO Tier III level for NOX emissions for designated emission control areas (ECA) applying to ships built in 2016 or later, and the sulphur limits of the EU land MARPOL legislation. They will respectively set a 0.1% sulphur limit for fuel used in EU ports after 2010, and in sulphur ECA’s after 2015.
The priority was to make the ship as fuel efficient as possible. This started by looking at the ship itself and at the type of hull configuration used. In order to reduce the resistance, a long slender hull was preferred. This meant an overall length of 227 m, about 30 m longer than today’s typical container feeder. The beam was reduced by the width of one container row to 23 m. Since this narrower and more slender hull would not give sufficient stability for the planned container
capacity, a PROA hull configuration, with one outrigger on the port side, was therefore selected. The outrigger provides the stability needed. This type of hull resembles that of some outrigger canoes from the South Pacific, from where the PROA name originates. It not only offers low resistance, but also provides a good platform for container transport. The total breadth of 40 m gives a wide deck for efficient container storage.
A more traditional approach to a similar application would be a trimaran configuration. However, while a symmetric hull would be easier to design and could offer greater stability, there are certain drawbacks. Notably, two outrigger hulls give more resistance than one. So if one can manage with one, why have two? The other benefit of the PROA over the trimaran is that one side of the ship is like a normal ship. This makes for easier port operations, as the long straight side is lined up against the quay in port.
The idea with a PROA is to keep the outrigger as small as possible. Most of

the displacement should be in the main hull, and the outrigger should just be big enough to give sufficient stability. The designed configuration gives about 12% lower resistance than a conventional feeder at the design service speed of 21 knots. At a speed two knots higher, the benefit would be over 25% already.
The container storage arrangement in the PROA ship type, with a main hull and one outrigger, is different from a conventional hull. The main hull of the PROA is more slender and can therefore not accommodate the same amount of containers inside the hull. The ends of the hull are especially narrow, and there is very little space for containers down below in either end. On the other hand, the outrigger makes the open deck area much wider, so a greater number of containers can be stored here. Even though there are fewer containers in the hull of the PROA, there is no need to stack the containers as high as with a conventional hull, thanks to the extra container rows. This also makes it possible to use an open top configuration, as only 10 container tiers are needed. More containers than this cannot be stacked on top of each other. This allows for faster container handling in port, as there are no hatches for the holds to be lifted off and on. High cell guides are also used to further enhance the cargo operation and reduce the need for lashing work. The faster turn around time in port will result in energy savings at sea.
The streamlined deckhouse is located in the front of the vessel. Since there is no need to ensure visibility over the containers, this allows for a lower bridge location. The forward location of the deck house also provides protection for the cargo holds from green water, which is important for an open top concept.
At first sight, the propulsion concept opted for is quite conventional. A single propeller on the main hull skeg offers high propulsion efficiency in this case. The efficiency is further enhanced with an Energopac propeller-rudder combination, designed together as one unit. The twisted leading edge rudder and the faired bulb behind the propeller hub, offer lower drag and higher efficiency than conventional propellers and rudders. The power demand
is estimated to be about 4% less in this case.An alternative to the single screw
propeller would be to apply a contra rotating propeller couple. This could further enhance the propulsion efficiency.
The machinery solution is rather novel, with one main dual-fuel engine running on either LNG, HFO, or diesel. It drives the propeller via a reduction gear that features a PTI/PTO.
Electrical power is generated by a hybrid plant consisting of three dual-fuel generator sets, two small fuel cell modules, a shaft generator connected to the PTO of the gearbox, and a waste heat recovery system based on an Organic Rankine Cycle (ORC) turbine. These power sources can be further complemented by a set of batteries for an even more flexible plant.
The idea behind this concept is that both energy production and usage on the ship can be optimized in a flexible manner, depending on the current operational mode and specific demands. The two 250 kW fuel cells are run constantly as baseload. Unfortunately, fuel cell technology is still quite immature, and ideally the fuel cells should be bigger to be able to cover an even larger part of the electric demand. The waste heat recovery (WHR) system is used when the main engine is running to supply electric energy. A potential saving of 8% of the main engine power is estimated for the ORC turbine. The rest of the electric demand is taken from one or more of the dual-fuel gensets.
The gensets can further be used to supply boosting power to the combined generator/motor connected to the main shaft. This can give extra speed reserves when needed.
‡
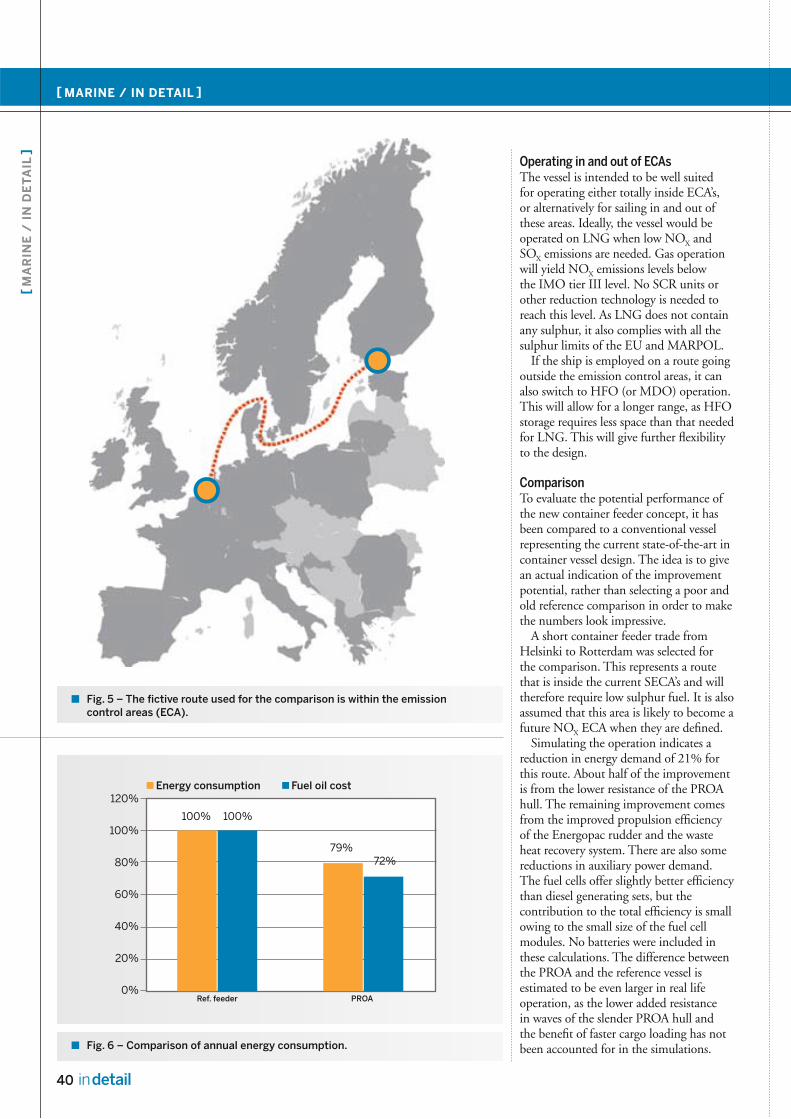
The vessel is intended to be well suited for operating either totally inside ECA’s, or alternatively for sailing in and out of these areas. Ideally, the vessel would be operated on LNG when low NOX and SOX emissions are needed. Gas operation will yield NOX emissions levels below the IMO tier III level. No SCR units or other reduction technology is needed to reach this level. As LNG does not contain any sulphur, it also complies with all the sulphur limits of the EU and MARPOL.
If the ship is employed on a route going outside the emission control areas, it can also switch to HFO (or MDO) operation. This will allow for a longer range, as HFO storage requires less space than that needed for LNG. This will give further flexibility to the design.
To evaluate the potential performance of the new container feeder concept, it has been compared to a conventional vessel representing the current state-of-the-art in container vessel design. The idea is to give an actual indication of the improvement potential, rather than selecting a poor and old reference comparison in order to make the numbers look impressive.
A short container feeder trade from Helsinki to Rotterdam was selected for the comparison. This represents a route that is inside the current SECA’s and will therefore require low sulphur fuel. It is also assumed that this area is likely to become a future NOX ECA when they are defined.
Simulating the operation indicates a reduction in energy demand of 21% for this route. About half of the improvement is from the lower resistance of the PROA hull. The remaining improvement comes from the improved propulsion efficiency of the Energopac rudder and the waste heat recovery system. There are also some reductions in auxiliary power demand. The fuel cells offer slightly better efficiency than diesel generating sets, but the contribution to the total efficiency is small owing to the small size of the fuel cell modules. No batteries were included in these calculations. The difference between the PROA and the reference vessel is estimated to be even larger in real life operation, as the lower added resistance in waves of the slender PROA hull and the benefit of faster cargo loading has not been accounted for in the simulations.
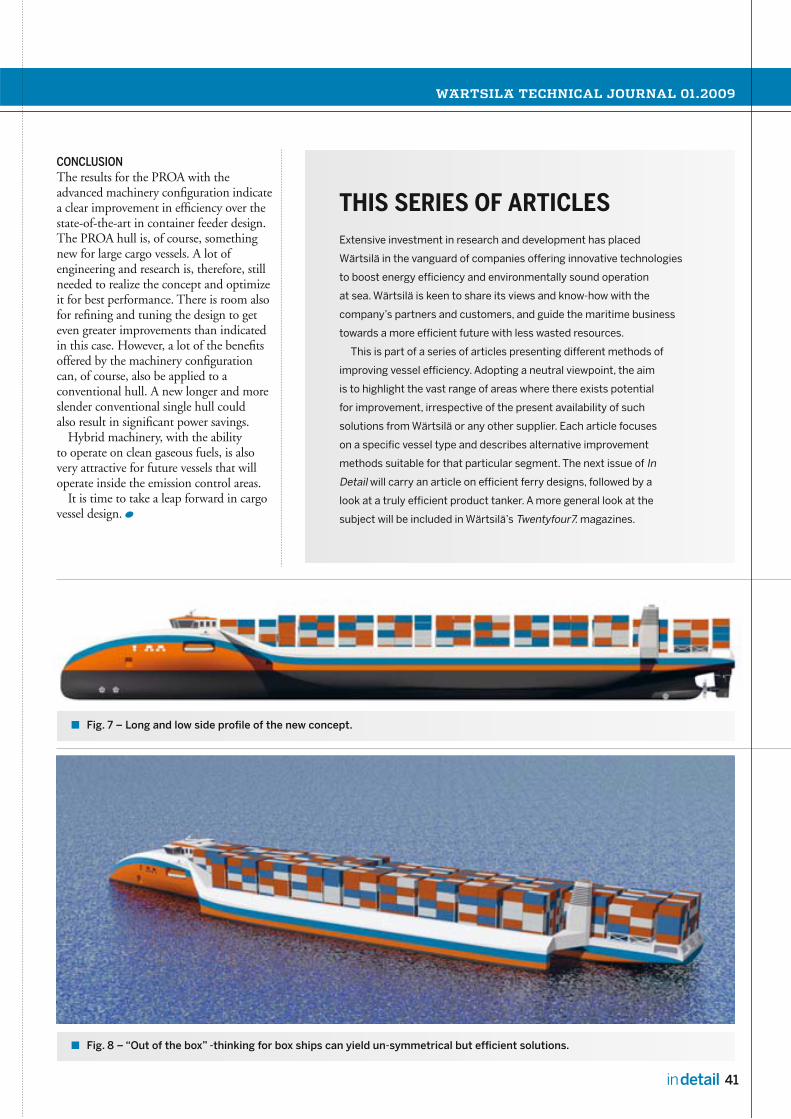
The results for the PROA with the advanced machinery configuration indicate a clear improvement in efficiency over the state-of-the-art in container feeder design. The PROA hull is, of course, something new for large cargo vessels. A lot of engineering and research is, therefore, still needed to realize the concept and optimize it for best performance. There is room also for refining and tuning the design to get even greater improvements than indicated in this case. However, a lot of the benefits offered by the machinery configuration can, of course, also be applied to a conventional hull. A new longer and more slender conventional single hull could also result in significant power savings.
Hybrid machinery, with the ability to operate on clean gaseous fuels, is also very attractive for future vessels that will operate inside the emission control areas.
It is time to take a leap forward in cargo vessel design.

Energy demands are increasing steadily throughout the world, and concern for the environment and the greenhouse effects of fossil fuel, is growing. This development has contributed to the growing attractiveness of more environmentally friendly alternatives to oil and coal. The spike in oil prices that was evident in recent years, and the forecast of long-term oil price development, has also made it economically feasible to use other energy resources. A good alternative, and a real
potential competitor to oil, is natural gas. The benefit of natural gas compared to
oil is its cleanliness during combustion. While oil consists of heavier hydrocarbons with more carbon atoms and other impurities, such as sulphur and nitrates, combustion of natural gas emits significantly lower levels of NOX, SOX, CO2 and THC when burned.
With growing demand for gas, resources located below ice-covered waters have also become the target for development. The traditional way to transport cargo from any such area is to have an ice strengthened ship that can break ice up to a certain thickness, depending on the vessel’s ice class and design. When the ice is too thick for the vessel to transit, an icebreaker assists the ship by breaking a channel in front of it.
Another concept for navigation in both ice and open water, is the Double
Acting Ship (DAS). The idea is that the bulbous bow of the ship is designed for optimal resistance and performance in open water, while the sloping stern is designed for icebreaking. By sailing astern in ice, the ship can break ice with the same, or even better, effectiveness as an icebreaker and does not need icebreaker assistance at all. In open water the vessel sails bow forward, in just the same way as a conventional ship operates.
Because the gas in LNG carriers is in a liquid state and cooled to a temperature of -163°C, it must be regasified close to ambient temperature before being pumped into the consumer network. The majority of LNG-reception terminals have tanks for the storage of LNG before regasification. In this way, the gas can be transferred rather quickly from the ship to the tanks

located onshore. Another alternative is to have the regasification plant integrated onboard the ship.
Building permits for regasification plants are issued in strict compliance with local laws and directives. Having the regasification plant onboard a ship can, therefore, be a better solution since no onshore based buildings are needed. The downside of having a ship-board regasification unit is the idle time for the ship itself during the regasification process, and the idle time for the unit when the ship is at sea. Normally, the regasification process takes 3-6 days, depending on the on-going consumption of the gas compared to the unloading time of the LNG, which takes 12-24 hours.
The Double Acting Pusher Puller Barge (DAPPB) concept is a combination of the existing modes of transportation in both open water and ice covered seas. The concept consists of a barge, where the transported cargo is stored in tanks, while two tugs either push the barge in open water, or pull the barge in ice.
Transporting LNG by barge would not differ much from current LNG ship solutions. The barge would have tanks identical to the design of the LNG tanks found on ships today. The bow- and middle body hull shape would be similar to existing ships. The main difference is in the aft, where there would be no
propulsion equipment or main engines, but instead there would be space for the connection between the barge and tug. For independent operation, auxiliary engines would be fitted on the barge. The barge would also be equipped with secondary ship equipment, such as cargo pumps, transfer pipes, the regasification unit, etc. The power plant located on the barge would be connected to the tugs, with excess electrical power being fed to the tugs for propulsion power and the auxiliary systems. Accommodation facilities for the crew operating the barge would be located above the barge’s engine room.
The connection between the barge and its tugs is an issue that certainly needs to be studied before the concept can be fulfilled. The dimensions and mass of the barge would be greater than for any barge built to date that is intended for operating in ice. The loads and vibrations, induced from the open water motion, but more especially from operating in ice where the inertia loads would likely be very large as the vessel slows down or stops, should be examined in order to get the dimensioning of the coupling right.
There are two main ways of connecting the barge with the tug. One option is an articulated connection, and the other is a fixed connection. The articulated connection has only two connection
points between the tug and barge. The connection point on the tug is located in the forward part of the tug on both sides, with two pins connecting to corresponding points on the barge. The connection enables motion between the tug and barge along the transverse horizontal axis. The connection is also built so that the barge can move horizontally in relation to the tug without disconnecting. The fixed connection between the barge and the tug means that there are connections at three points; two in the forward part of the ship on both sides, and one at the very bow. This connection method means that there is no movement between the tug and the barge, hence the term fixed connection.
The main engine alternatives are steam turbines, two-stroke diesel engines with a reliquefaction plant, or dual-fuel engines. The steam turbines’ overall efficiency, compared to the two-stroke and dual-fuel engine, is clearly low. The efficiency of the two-stroke engine is slightly better than that of the dual-fuel engine; however, the added energy consumption of the re-liquefaction plant makes the overall consumption higher than that for the dual-fuel engine.
The dual-fuel-electric installation provides excellent characteristics for navigating in ice, due to the availability of full propeller torque at zero speed, ‡

and also the good dynamic positioning characteristics. The steam turbine requires a special crew capable of operating high-pressure boilers and steam turbines, while the two-stroke and dual-fuel engines can be operated by regular diesel engine crews. Based on overall efficiency, the best operational performance in ice, and the most economical solution, all ice-going concepts in the case study will have dual-fuel-engine driven electric machinery, with the boil-off gas from the LNG tanks being used as fuel in the main engines. The open-water tug and barge combination, with a combined dual-fuel-electric and dual-fuel-mechanic machinery, will be slightly different from the pure dual-fuel-electric machinery.
When planning shipping operations in waters that will be ice covered during part of the year, or even during the entire year, it is of great importance to know the expected weather and ice conditions. Unlike open waters where the wave parameters are statistically predictable, ice behaviour is difficult to forecast. Statistical studies of parameters, such as ice thickness, ice coverage, ridge height and -density, etc. help in predicting the possible ice conditions.
The Arctic Ocean is a large sea area and a part of the global ecosystem, and annual changes are natural and difficult to predict. The sea and air temperature fluctuations from year to year affect the extent of the sea ice. The seasonal changes of the ice coverage in the northern arctic can roughly be divided into two. The winter season spans from the beginning of October to the end of June, and the summer season from the beginning of July to the end of September. The winter season starts when the temperature drops so low that the ice cover starts to re-form, and reaches its peak in March. The ice cover starts to melt in June and then melts rapidly until it reaches its minimum in September.
The ice and meteorological conditions change every year, and can be divided into three different categories; mild winter, normal winter and harsh winter. Normal winter is the most common winter type. A normal winter occurs when the freezing and melting time and effect corresponds
with the average over a long historical period. These changes from year to year are difficult to predict, but they must be taken into account when planning a transport system in arctic areas.
The different seasons mean that the fleet size required during winter will be different from that needed in summer. This presents a challenge when dimensioning the fleet size for the transportation operations. The transport system can be based on the ice conditions of a normal winter. However, the effects of mild- and harsh winters on the transport system must also be considered and taken into account. In case the transported cargo is tied to a timetable, the transport system should still have the capacity and ability to deliver the cargo – even when the ice conditions are more severe than normal. During a mild winter, the ice strengthened fleet might be over dimensioned so that it can transport more gas than on avarage, and idle time could become a problem.
Observations of the arctic ice coverage made during recent years suggest that the total area during the summer and winter periods is shrinking. In the summer of 2007, the ice coverage shrunk to 4.4 million square km, the smallest recorded area ever, and the Northern Sea Route was “open” during the month of September for the first time in recorded
history. Conditions were very similar in 2008. Although the ice coverage may be shrinking, it is still a long way from being ice-free, especially during the winter. The overall annual ice conditions may, however, become easier, thus enabling more economic shipping in the arctic regions. But operating the Northern Sea Route will continue to be defined by harsh ice conditions during winter.
A feasibility study compares the competitiveness of three different concepts, taking into account the entire transport chain and overall economic considerations throughout the year. The transportation objective is defined by a commitment to deliver 1.0 BCFD of natural gas from the ship based regasification plant. The three concepts compared are:
1. Double Acting Pusher Puller Barge concept for arctic LNG transport (DAPPB LNG)2. Double Acting Ship for arctic LNG transport (DAS LNG)3. Ice strengthened ship for arctic LNG transport aided by Icebreakers (ICE LNG).
For each concept the required freight rate is calculated in order to indicate the differences between the concepts. The total investment cost for the required fleet is also
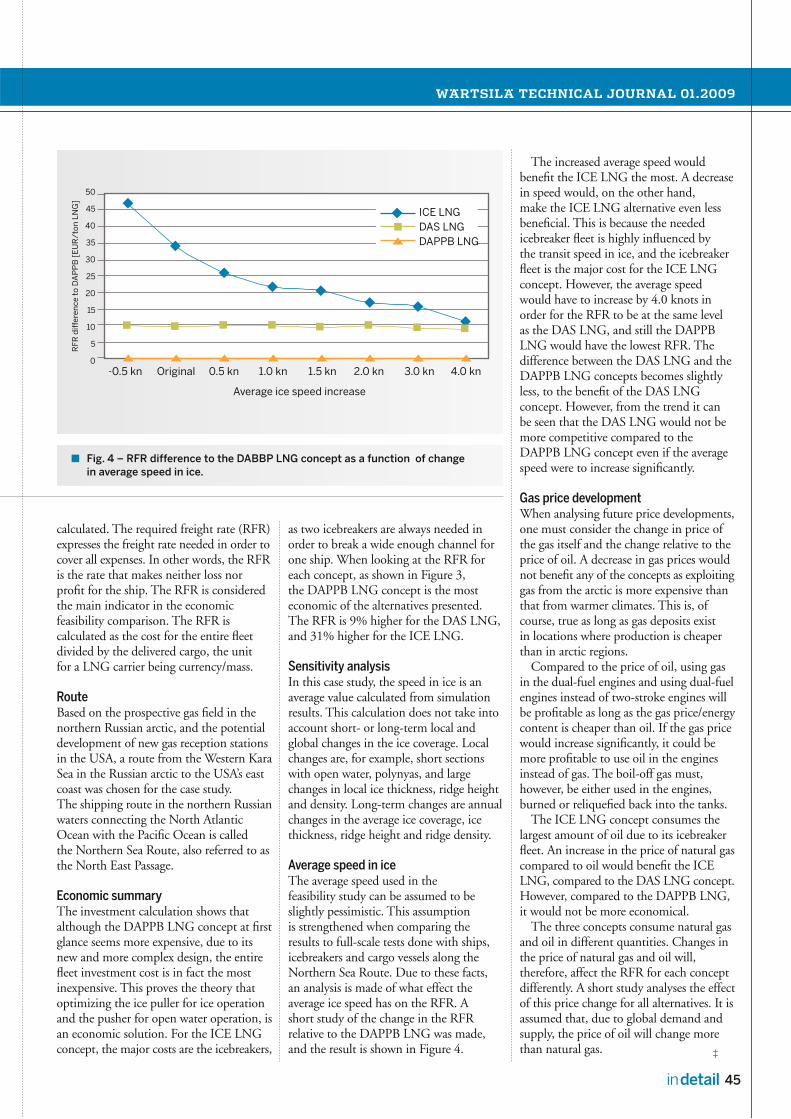
calculated. The required freight rate (RFR) expresses the freight rate needed in order to cover all expenses. In other words, the RFR is the rate that makes neither loss nor profit for the ship. The RFR is considered the main indicator in the economic feasibility comparison. The RFR is calculated as the cost for the entire fleet divided by the delivered cargo, the unit for a LNG carrier being currency/mass.
Based on the prospective gas field in the northern Russian arctic, and the potential development of new gas reception stations in the USA, a route from the Western Kara Sea in the Russian arctic to the USA’s east coast was chosen for the case study. The shipping route in the northern Russian waters connecting the North Atlantic Ocean with the Pacific Ocean is called the Northern Sea Route, also referred to as the North East Passage.
The investment calculation shows that although the DAPPB LNG concept at first glance seems more expensive, due to its new and more complex design, the entire fleet investment cost is in fact the most inexpensive. This proves the theory that optimizing the ice puller for ice operation and the pusher for open water operation, is an economic solution. For the ICE LNG concept, the major costs are the icebreakers,
as two icebreakers are always needed in order to break a wide enough channel for one ship. When looking at the RFR for each concept, as shown in Figure 3, the DAPPB LNG concept is the most economic of the alternatives presented. The RFR is 9% higher for the DAS LNG, and 31% higher for the ICE LNG.
In this case study, the speed in ice is an average value calculated from simulation results. This calculation does not take into account short- or long-term local and global changes in the ice coverage. Local changes are, for example, short sections with open water, polynyas, and large changes in local ice thickness, ridge height and density. Long-term changes are annual changes in the average ice coverage, ice thickness, ridge height and ridge density.
The average speed used in the feasibility study can be assumed to be slightly pessimistic. This assumption is strengthened when comparing the results to full-scale tests done with ships, icebreakers and cargo vessels along the Northern Sea Route. Due to these facts, an analysis is made of what effect the average ice speed has on the RFR. A short study of the change in the RFR relative to the DAPPB LNG was made, and the result is shown in Figure 4.
The increased average speed would benefit the ICE LNG the most. A decrease in speed would, on the other hand, make the ICE LNG alternative even less beneficial. This is because the needed icebreaker fleet is highly influenced by the transit speed in ice, and the icebreaker fleet is the major cost for the ICE LNG concept. However, the average speed would have to increase by 4.0 knots in order for the RFR to be at the same level as the DAS LNG, and still the DAPPB LNG would have the lowest RFR. The difference between the DAS LNG and the DAPPB LNG concepts becomes slightly less, to the benefit of the DAS LNG concept. However, from the trend it can be seen that the DAS LNG would not be more competitive compared to the DAPPB LNG concept even if the average speed were to increase significantly.
When analysing future price developments, one must consider the change in price of the gas itself and the change relative to the price of oil. A decrease in gas prices would not benefit any of the concepts as exploiting gas from the arctic is more expensive than that from warmer climates. This is, of course, true as long as gas deposits exist in locations where production is cheaper than in arctic regions.
Compared to the price of oil, using gas in the dual-fuel engines and using dual-fuel engines instead of two-stroke engines will be profitable as long as the gas price/energy content is cheaper than oil. If the gas price would increase significantly, it could be more profitable to use oil in the engines instead of gas. The boil-off gas must, however, be either used in the engines, burned or reliquefied back into the tanks.
The ICE LNG concept consumes the largest amount of oil due to its icebreaker fleet. An increase in the price of natural gas compared to oil would benefit the ICE LNG, compared to the DAS LNG concept. However, compared to the DAPPB LNG, it would not be more economical.
The three concepts consume natural gas and oil in different quantities. Changes in the price of natural gas and oil will, therefore, affect the RFR for each concept differently. A short study analyses the effect of this price change for all alternatives. It is assumed that, due to global demand and supply, the price of oil will change more than natural gas. ‡

The results in Figure 5 show that a decrease in natural gas and oil prices would benefit the ICE LNG and DAS LNG concepts, compared to the DAPPB LNG. However, even if a significant price drop were to occur, the DAPPB LNG would still be more competitive. If price levels would increase, the ICE LNG would suffer the most compared to the DAPPB LNG. The DAS LNG would also be less competitive compared to the DAPPB LNG. The reason for this result can be explained when looking at the total fuel consumption for the entire fleet. The DAPPB LNG has the lowest total fuel consumption, and is thus not as much affected by fuel price changes as the two other concepts.
The economic feasibility study shows that the DAPPB LNG concept is the most economical alternative of the three alternatives presented, when the entire transport chain and fleet is taken into account. The ICE LNG concept depends on icebreaker assistance during winter, and the cost for the icebreaking fleet is the major reason why this concept is less economical. The sensitivity analysis shows that the DAPPB LNG concept would
remain the most economic alternative, even if parameters affecting the total economy were to change considerably.
When considering LNG transportation from arctic regions, it is clear that new transport alternatives should be considered because of the magnitude of the business. An entirely new infrastructure must be
developed, and the opportunity to save money with an efficient shipping solution should be considered. The DAPPB LNG concept offers great potential as a redundant, and cost effective, transportation method for future LNG shipping from arctic areas.

Fast ferries and cruise ships typically have the propeller and shafts supported and connected to the hull by two struts. Since the number of applied struts influences the building and operational costs of the vessel, the question is raised as to the conditions under which one supporting strut might be sufficient. Having just one strut in such installations may reduce the drag of the vessel and improve the quality of the wakefield. Another major advantage is the significant reduction in building costs. In March 2004, the sophisticated high speed ROPAX cruise ferry, the ‘ Pont Aven’ was launched. It was built by the German yard Meyer Werft for Brittany Ferries.
The maximum operational speed of the vessel is 27 knots. At the yard’s request, Wärtsilä in the Netherlands performed a study on the application of one propeller-supporting strut only, with the main aim of improving the quality of the wakefield.
For this project, Wärtsilä has supplied a complete propulsion arrangement, including two bow and two stern thrusters, two controllable pitch propellers, shafting and fully integrated controls, and monitoring equipment. The ship is equipped with a controllable pitch propeller of 5.2 metres diameter, 4 engines with a total overall power of 43,200 kW, and two shaftlines of around 40 metres each.
During the pre-design stage, the yard and Wärtsilä evaluated and discussed the bearing arrangement and the alignment. The aim was to make a shafting design based on a two-bearing sterntube, instead of the more common three-bearing solution. A two-bearing solution requires only one
strut, thus giving hydrodynamic, weight, alignment, and cost advantages. Given the vessel’s high power and the stringent design targets, this was certainly a challenging task. In Figure 2, the general arrangement of the propulsion plant is shown.
‡

Unlike the more noticeable parts, such as the engine or propeller, one part of a ship’s propulsion plant is normally well hidden. It is the vital link between the engine and propeller, namely the main propulsion shaftline. The shafting handles the transmission of torque from the main engine to the propeller, with the shafts being supported by a number of bearings. The number, the design, and the position of these bearings are the focal points of this article.
In the ship types described, the propulsion plant typically consists of a twin-screw installation, whereby each shaftline has a controllable pitch propeller, a propeller shaft, intermediate shafts, a gearbox, and one or two engines.
As mentioned, the shaftline is supported by a number of bearings. Some are positioned in the sterntube, others - the intermediate shaft bearings - are situated well inside the hull. The shaftline has an aft sterntube bearing directly forward of the propeller. To support this bearing, at least one strut is needed. The feasibility of omitting the other strut depends on whether it is possible to have no shaft support between the aft sterntube bearing and the point where the shaftline enters the hull. Inherently, the required number of struts is linked to the position of the bearings, as each strut is intended to support a bearing. So, in order to assess whether it is necessary to have more than one strut, it is necessary to look at the number and the position of the bearings in the shaftline. The main question here is: which design parameters actually determine the number and the position of the shaft’s bearings?
The main task of the bearings is to counteract the forces generated by the weight of the propeller and the shafting. However, the working propeller also generates bearing forces. When the propeller generates thrust, the thrust is not equally distributed over all the propeller blades. This is because of the variations in the water speed flowing into the propeller, as represented in the wakefield. In Figure 3, an example of a twin-screw, high-speed ship’s wakefield is shown.
The nominal position of the thrust force is eccentric to the geometrical centre of the propeller and shafting. Normally, the centre of the thrust is above the centre
line of the shaft. The resulting moment acts on the propeller shaft and must be dealt with by the bearings.
A plain bearing, as is applied for shaftlines, has maximum and minimum allowable load limits. The acceptable load depends on various parameters, such as the diameter and length of the bearing, the bearing play, the shaft speed, and the viscosity of the applied lubricant. As the shaft speed and diameter are normally fixed, the propeller and shaft weight, together with the hydrodynamic forces generated by the propeller, determine the number of bearings. However, variations in the length of the bearings may allow some flexibility in the number of bearings. After the number of bearings is determined, the next task is to determine the adequate bearing locations.
As a general guideline, a designer may use the chart shown in Figure 4 for determining the distance between the two most aft sterntube bearings. This chart is based on specific shaftline design knowledge, as well as some assumptions.
One important assumption of the graph is that only the two aft most bearings are considered. Any shafts or bearings located forward of these two bearings are not taken into account. Theoretically this is a disputable statement, however in practice it makes sense, especially for twin-screw ships. This can be explained by the fact that twin-screw vessels with an outside sterntube, typically have a considerable distance between the shaft point of hull entry and the position of the gearbox or main engine. Both engine

and gearbox need sufficient clearance for foundations. Consequently, the forward sterntube bearing will be positioned at quite some distance from the next bearing. Thus, the influence of the shafting forward of the sterntube will be limited.
Another assumption concerns the weight of the propeller. The weight of the propeller is not directly related to the shaft diameter, but to take it into account a statistic analysis was made of the correlation between propeller weight and shaft diameter. When restricting the statistic analysis to installations without ice class notations, a general relationship between the shaft’s diameter and the propeller weight emerged.
Last but not least, the sterntube bearing lengths were assumed to be two times the shaft diameter for the aft bearing, and 0.8 times the shaft diameter for the forward bearing. These are the most commonly used basic dimensions.
Figure 4 provides some idea as to the general restrictions related to the distance between the two aft most bearings. On the horizontal axis, the ratio between bearing distance and shaft diameter is indicated. The vertical axis shows the shaft diameter itself. In the area identified as A, the shafting arrangement will be too stiff, as the shaft diameter is big in relation to the bearing distance. The bearings are too close to each other. As a result, a minor deviation in the radial position of the bearings leads to a serious change in the reaction force of this bearing and its neighbours. The effect is best explained by seeing it as an attempt to bend the shaft over a short distance. This offset might be caused by deviations that occurred during the installation of the bearings, or by deformations of the ship itself initiated
by either the sea or a change in loading conditions.
Inside area B the bearing load may be too high. This can be explained by looking at the weight of the shafting and the maximum allowable bearing pressure. If, at a constant length over the diameter ratio, the diameter would increase, the weight of the shafting increases more than the allowable bearing load. So the line determining area B is a line of constant and maximum bearing pressure. As a consequence there is a certain maximum shaft diameter limit, which can still be supported by plain bearings.
Area C indicates at which combination of bearing distance and shaft diameter problems with vibration may be expected. The vibrations referred to are whirling vibrations. Figure 5 gives a good idea of a main mode of vibration.
The bottom part of Figure 5 shows a modelled representation of the shaft including bearing supports. The top part shows the deflections of the shaft during the main mode of whirling vibration. The whirling behaviour of a shaftline is quite similar to its natural bending frequency. The difference lies in the gyroscopic behaviour of the propeller and the shaft.
Of course, the presence of a natural vibration frequency at the operational speed of the installation is unacceptable. If such whirling would occur, excited by the actual rpm of the shaft, the consequence would be severe damage to the bearings and shafts. The natural whirling frequency of a shaftline depends on parameters, such as the weight and geometry of the propeller, the dimensions of the shafts and, most importantly, the position of the bearings. The easiest way to avoid a natural frequency in the operational speed range
is by correctly positioning the bearings.
Returning to the Meyer Werft cruise ferry, the diameter of the shaft, given the power and the shaft speed, were initially determined - by the rules of the classification society - to be 560 mm between the aft and forward bearing. The distance between the aft strut and the hull entering point of the shaftline is 16.5 metres. The resulting length over diameter ratio is then 29. In the design chart, this design is in the danger region D marked “overload and whirling”. So the first indication is that a second bearing support (with strut) is necessary.
In seeking a solution to this critical situation, the consequence of increasing the diameter was investigated. A diameter increase to 630 mm would reduce the L/D ratio to 26. This voids the risk of whirling vibration. As a result of the changed shaft diameter, the bearing diameter itself is increased too, but the bearings are in the overload zone. The expectation was that the forward sterntube bearing would be overloaded. However, to increase the bearing loading capacity, it is possible to apply a longer bearing than the standard size used.
Based on the above consideration, we considered it possible to apply a bearing arrangement which needed only one strut. To check this, a more detailed calculation was made using a one dimensional Finite Element Model. The shaftline was modelled as a series of cylindrical parts, and the bearings as support points. For this calculation, the propeller data, such as its weight and the hydrodynamic forces, were also taken into account. The results of this detailed examination were in ‡

line with the first estimate, i.e. both the loading of the bearings and the critical whirling frequency were acceptable.
For the bearing closest to the propeller, additional design criteria play a role. Due to the non-uniform wakefield, the location of the thrust will not be in the centre of the shaft. The eccentricity of the thrust acting on the propeller will cause some bending of the propeller shaft. As a result, a certain angle between the shaft and the bearing will exist. The bearing clearance limits the maximum relative angle between bearing and shaft.
Generally, two extreme conditions are considered when assessing this maximum relative angle. The first is the free sailing condition with full power transmitted to the propeller. As described, the eccentricity of the generated propeller thrust results in a bending of the shafts. Since the thrust is normally situated above the geometrical centre of the propeller, the resulting moment lifts the propeller. Figure 7 gives an idea as to the deflections of the shaftline in this condition.
The other extreme condition occurs when the ship is manoeuvring, and the propeller generates no, or only a small, thrust. The hydrodynamic forces in the vertical plane acting on the propeller and
shaft are then negligible. As a result, the propeller and shaft weight are the only significant loads present. A good representation of the shaftline deflection in this condition is given in Figure 8.
The two Figures 7 and 8 display the actual situation for the cruise ferry in question. It is clear from the illustrations that the two conditions cause different bending of the propeller shaft. The clearance of a bearing also limits the difference between the two calculated shaft angles. The bearing should be able to accommodate both extreme angles of the shaft.
Acceptability of this criterium can be improved by inclining, or sloping, the bearing. The relative angle between the shaft and the bearing can thus be reduced. When doing so it is necessary to take both conditions into account, otherwise optimization of one condition may result in an unacceptable outcome for the other.
To find the real shaft angle in the aft bearing, it is standard procedure at Wärtsilä to make very detailed calculations to determine the actual support point in the aft bearing. The calculations are in fact a hydrodynamic analysis of the bearing. The idea of a support point is visualized in Figure 9.
The support point can be thought of as being a “centre point” of the pressure distribution of the oil in the bearing. The centre point is the position in which the total moment caused by the pressure distribution aft of this position, equals the moment forward of this spot.
The position of the “support point” depends on variables, including the load on the bearing, the shaft speed, the viscosity of the oil, but mostly the shaft inclination within the bearing.
An iteration of the hydrodynamic bearing analysis in combination with the alignment calculations gives the real position of the “centre” or support point. Finally, the desired result is determined and the slope of the shaft in the aft most bearing is known.
It was found that the angle between the shaft and the aft bearing, if positioned horizontally, in the full power condition was too big to be accommodated by the bearing. At first glance it looks like this could easily be resolved by increasing the bearing play, but this solution had some drawbacks. Increasing the bearing play generally leads to a decrease in the bearing support capacity, and consequently a decrease in the thickness of the oil film supporting the shaft. This can result in the

bearing being able to accommodate the shaft angle but no longer able to support it. A much more effective solution was found by applying a sloped bearing. Sloping the bearing in the same direction as the propeller shaft decreases the angle between bearing and shaft.
To compensate, in the case of the cruise ferry ‘Pont Aven’, a small slope in the vertical, as well as the horizontal plane of the bearing, was applied. These slopes ensured a small enough angle between the bearing and the shaft under all extreme conditions.
At this stage it was clear that the one strut solution was an acceptable option. All the required checks had been done, and all the criteria showed that an acceptable arrangement with just one strut was feasible. The decision was made to rely on just the one strut directly forward of the propeller. No other struts would be installed.
One of the main decisions to be made concerned the position of the oil grooves. In normal situations, the grooves are located in the horizontal plane, which gives the best possible damping characteristics.
Additionally, some more flexible shafting arrangements may be sensitive to the influence of oblique flow, generated by the rudder. A known effect is the extra bearing load resulting from such rudder angle action. The extra load in itself is not the problem; rather it is the change in direction of the load compared to normal sailing ahead. In principle, the direction of the bearing reaction force can change from mainly vertical to almost horizontal. Such a change in direction of a load impacts the position of the shaft in the bearing. It will move upwards from the bottom of the bearing to one of the sides approaching the oil grooves. This is illustrated in Figure 10.
Oil grooves enable the supply of oil in the bearing to build up the oil film. So, if the shaft moves to the side of the bearing, eventually the shaft will be near the grooves. The change of the bearing geometry at the entry of the slots results in a breakdown of the oil film. This breakdown results in metallic contact between the shaft and the bearing. The result is a destroyed bearing and the propulsion plant cannot continue to operate. ‡

After detailed investigations and consideration of the possible movement of the shaft, Wärtsilä decided to place the oil grooves in the horizontal plane.
Another aspect is the vessel’s deformation. Depending on the loading condition of the ship and the sea state, the deformations might alter the alignment of the bearings. The displacement of a bearing over a few millimetres might easily result in the same bearing becoming overloaded. For this reason, the magnitude of the deflections of a ship under different loading conditions, needs to be explored.
At this stage the shipyard presented us with the option to perform an extensive finite element analysis. Meyer Werft provided calculations for the ship under various conditions. One was the fully loaded condition, another represented the design draft condition, and the third represented the minimum draft state. The results provided detailed information on the deflections at the position of the bearings. A general impression of the effect of these different loading conditions is shown in Figures 11a –e.
The Figures 11a-e give a representation of how the deformation of the aft ship looks like. Figure 11e displays the ship’s deflections (in mm) in the three loading conditions. On the horizontal axis is the axial position in the vessel, where X=0 represents frame 0. As can be seen, the displacement for the aft bearing between the fully loaded and minimum draft condition is about 70 mm. The first conclusion concerning such deformations is that the actual situation onboard the vessel will have little to do with the “as build” (theoretical) situation.
Deflections of such magnitude cause some serious concern for the over- or underloading of the bearings. However, on closer inspection of the data showing the deflections of the aft ship, it became clear that the deflections are quite gradually distributed over the vessel. In other words, the ship is deforming as a beam. For the fully loaded situation the hull is in a sagging condition where in minimum draft it is hogging.
The choice of a one strut solution in this case results in a large distance between

the two aft-most bearings. A consequence is a reduction in stiffness of the shafting arrangement. And as such it is able to accommodate large hull deformations.
The gradual appearance of the deformation, in combination with the flexibility of the shaftline, puts the figure of a 70 mm deflection in another perspective. It means that the shaft is adjusting to the deflections of the ship. This conclusion is supported by calculations. Changes of the bearing loads are, however, to be expected, but a more elaborate analysis showed deviations in the bearing loads in the range of 5–10% only for the whole range of loading conditions.
The design chart presented earlier in Figure 4 offers some explanation for this. The left side of the Figure was marked as being too stiff. A too stiff arrangement of the bearings, meant that the bearings were placed closely together and would not be able to take care of the hulls deflections. In other words, the ship is deflecting but the shafts are not. The bearing support stiffness also plays a role in this. A stiff bearing arrangement can, however, be considered for stiff hulls, such as single-screw vessels.
For this vessel, the issue was whether or not it was feasible to design a shaftline arrangement with one strut instead of the conventional two-strut arrangement. The one strut application would mean
a large distance between the two sterntube bearings. As a result, the actual arrangement is situated well away from the “too stiff” region of the design chart, and the hull deflections are unlikely to give rise to problems.
For the ROPAX cruise ferry built by Meyer Werft, extra attention was given to the design of the propeller shafting. The goal was to optimize the overall performance of the ship. A detailed analysis indicated a possibility to omit one strut from the traditional two strut arrangement. This resulted in a clear reduction in both the building and operating costs, since the omitted strut causes no drag throughout the lifetime of the vessel.
Using the cruise ferry as a reference, some conclusions and recommendations can be presented.
A thorough shafting design method is beneficial for avoiding problems resulting from misalignment and whirling vibrations. Unexpected surprises concerning the correct functioning of the shaft bearings can also be avoided. The method presented in this article gives a guideline to those aspects that should be incorporated within the design method. Of course, practical limitations on the shape of the hull and the manufacturing process, also have to be considered.
Another conclusion follows from the ship deflection analyses. As indicated, the deformations of the vessel could not be overlooked. Depending on the sea state and loading conditions, the aft sterntube bearing would displace about 70 mm between one condition and another. Despite the magnitude of the deflections, this does not lead to a significant change in the loading of the bearings. The aim of a correctly designed shaftline arrangement is that it shall be able to accommodate the deflections of a ship’s hull. The design chart presented in the article is a useful tool to realize this.
Fast ships, such as twin-screw ferries, cruise ships, and naval craft can especially benefit from optimizing the bearing arrangement. In addition to building costs being significantly reduced, the propeller inflow will also be better and the ship’s resistance will be minimized. Thus the ship’s speed can be higher, or alternatively, the required engine power can be less. In this way the operational expenses of the ship can also be diminished.
A vital condition to the success of shaftline optimization is the early involvement of the propeller and shafting supplier in the yard’s ship design process. In this way, the supplier can support the expertise of the yard; a combination that enhances the optimization potential of the ship’s design.

Wärtsilä’s composite bearing materials are non-metallic, and have been specially designed to cope with extremes of operating conditions as affected by loads, speeds, temperature fluctuations, dirty conditions, etc. Depending on the application and grade, these thermosetting resin laminates can operate when dry, partially lubricated, or fully lubricated in oil or seawater.
Wärtsilä’s marine bearings offer significant advantages in terms of reduced vessel lifetime operating costs through reduced maintenance, improved reliability, and ‘kindness’ to shaft materials. They are applied as propeller shaft bearings, rudder bearings, and steering gear and deck machinery bushes for all vessel types, but particularly for special vessels, and in the offshore and navy sectors, where extreme environments are experienced.
Wärtsilä’s Ecosafe material was developed in the early 1980’s for water lubricated (and dry) bearing applications. It is used by more than 30 navies around the world for water lubricated bracket and sterntube bearings in surface vessels and submarines. Wärtsilä water lubricated bearings are also used on ferries and supply ships.
Wärtsilä was asked if a better material was available to replace the rubber and elastomeric being used for propeller shaft bearings working in dirty river conditions. The request originated from workboat operators on the Mississippi. They were having to change the river-water
lubricated bearings on their boats every 1 to 2 years, as the mud was dramatically shortening the expected bearing life, and the shafts were being damaged.
Similarly, fishing boat owners along the Pacific northwest coast of America were experiencing unexpected and dramatic wearing of the prop shaft bearings on their vessels, after having inspected them and found things in order at the end of the previous season. This meant a potentially business crippling need to undergo unscheduled repairs.
Why was this happening? Wärtsilä, who had traditionally focused on supplying ocean and coastal vessels somewhat larger than fishing and workboats, started to investigate.
In order to compare the materials currently being used, an arduous test programme was embarked upon. The aim was to analyze the performance of various bearing materials in highly abrasive conditions, against stainless steel counter face material.
‘Substitute’ seawater was used with silica particles added. The grit used was equivalent in particle size and shape to that found in the Portland area of the UK, at a concentration level accepted by the UK Ministry of Defence as being representative of aggressive British coastal water.
To try to simulate the worst of the water conditions, and to accelerate the comparative test, the concentration of silica was increased by a factor of 10. The grit was kept in suspension in the seawater by means of a stirrer agitating the solution in the supply tank. A pump was used to deliver the gritted seawater to the bearing, and to re-circulate it back to the tank. The flow rate for each of the test bearings was set at 7.5 litres (2 US gallons) per minute. Table 1 details other test criteria. Interestingly, the pump, which was not fitted with Wärtsilä bearings, did not survive the first set of tests. The load to the bearing under investigation was applied via a levered arm providing ‡
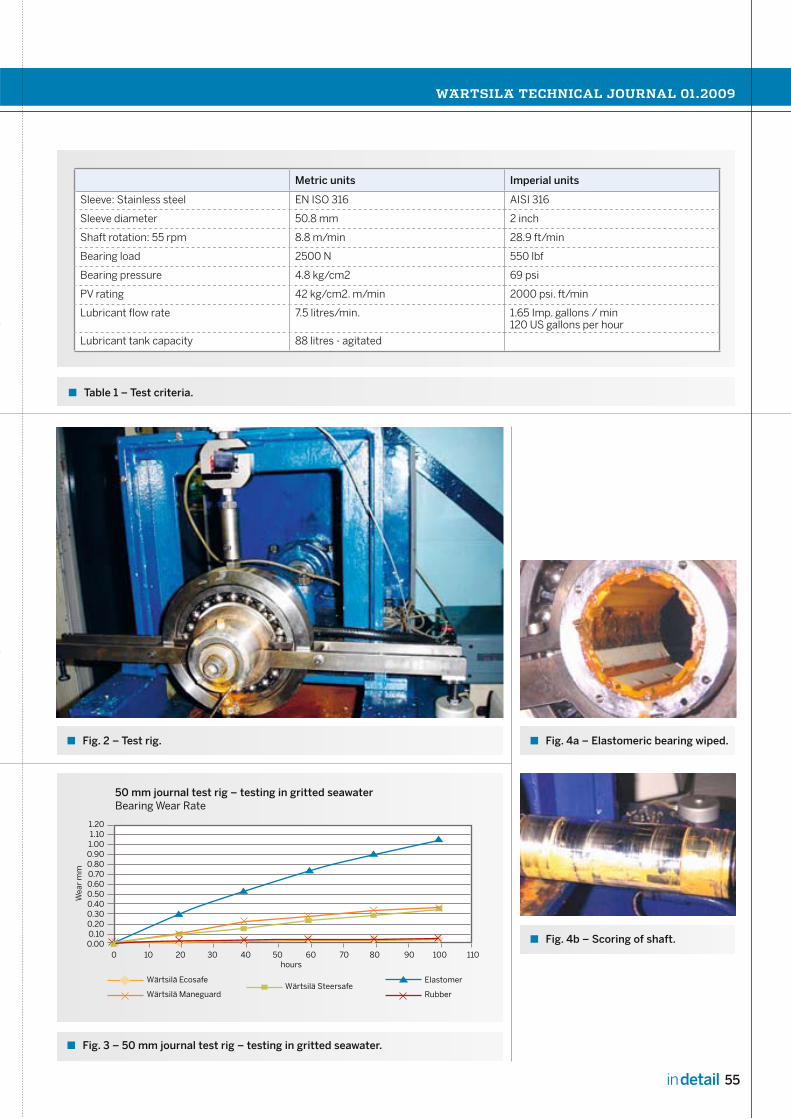

a bearing load of 2500 N (550 lbf). The initial testing comprised of running each material under the stated conditions for a period of 100 hours, measuring the bearing wear rate at 20-hour intervals.
As can be seen from the results in Figure 3, even though all the materials were tested under the same conditions, there was a spread in wear results. Most materials performed well over this timeperiod with the exception of the elastomericmaterial, where signifi cant bearing wear and smearing occurred, and scoring on the shaft liner was noted. For consistency, all bearings were tested with the multi-axial groove confi guration. This was to ensure that the performance of the bearing material was tested, and not the design.
The second phase tested the two best performing materials, Wärtsilä Ecosafe and rubber, over a period of 2000 hours. As can be seen from the results shown in Figure 5, initially the rubber material performed well in comparison to Wärtsilä Ecosafe. However, over time the wear rate increased rapidly. The rate of wear was such that the test on the rubber material was stopped at around 850 hours.
Figure 6 showing the rubber bearing and shaft sleeve after testing, reveals that there is signifi cant scoring on the shaft in comparison to the original shaft condition shown in Figure 7. This is caused by the silica particles becoming embedded into the rubber material, following which the particles then score
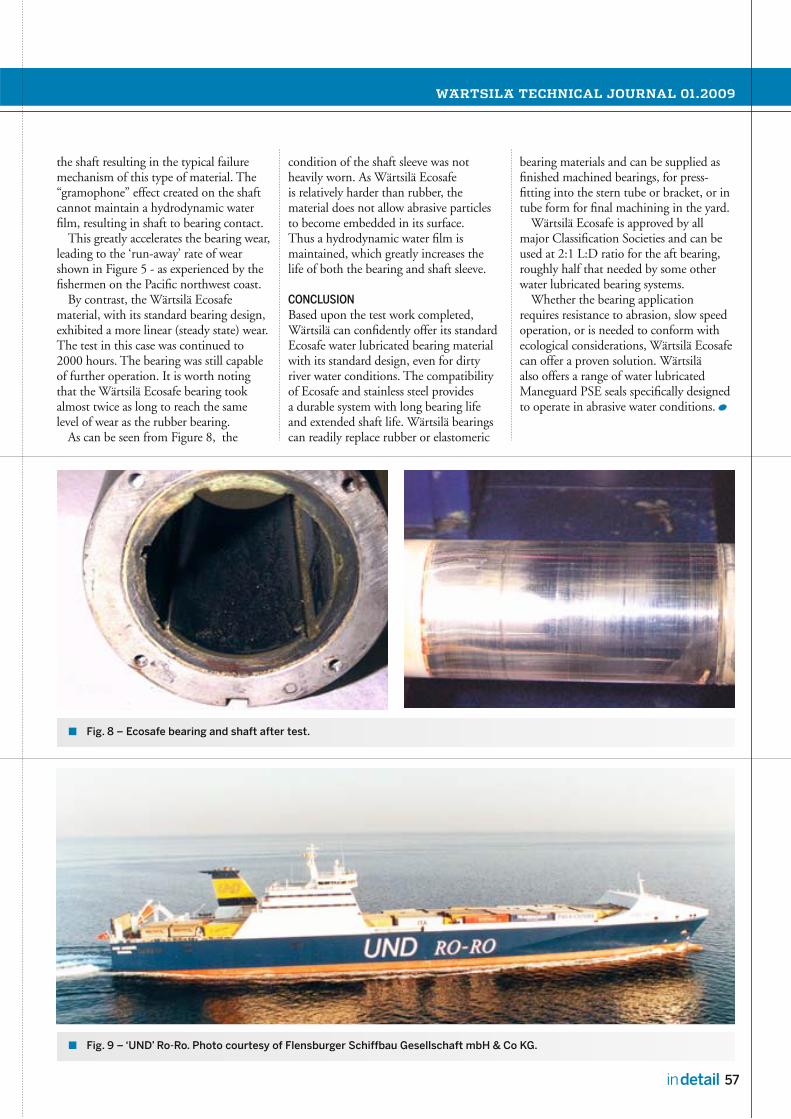
the shaft resulting in the typical failure mechanism of this type of material. The “gramophone” effect created on the shaft cannot maintain a hydrodynamic water film, resulting in shaft to bearing contact.
This greatly accelerates the bearing wear, leading to the ‘run-away’ rate of wear shown in Figure 5 - as experienced by the fishermen on the Pacific northwest coast.
By contrast, the Wärtsilä Ecosafe material, with its standard bearing design, exhibited a more linear (steady state) wear. The test in this case was continued to 2000 hours. The bearing was still capable of further operation. It is worth noting that the Wärtsilä Ecosafe bearing took almost twice as long to reach the same level of wear as the rubber bearing.
As can be seen from Figure 8, the
condition of the shaft sleeve was not heavily worn. As Wärtsilä Ecosafe is relatively harder than rubber, the material does not allow abrasive particles to become embedded in its surface. Thus a hydrodynamic water film is maintained, which greatly increases the life of both the bearing and shaft sleeve.
Based upon the test work completed, Wärtsilä can confidently offer its standard Ecosafe water lubricated bearing material with its standard design, even for dirty river water conditions. The compatibility of Ecosafe and stainless steel provides a durable system with long bearing life and extended shaft life. Wärtsilä bearings can readily replace rubber or elastomeric
bearing materials and can be supplied as finished machined bearings, for press-fitting into the stern tube or bracket, or in tube form for final machining in the yard.
Wärtsilä Ecosafe is approved by all major Classification Societies and can be used at 2:1 L:D ratio for the aft bearing, roughly half that needed by some other water lubricated bearing systems.
Whether the bearing application requires resistance to abrasion, slow speed operation, or is needed to conform with ecological considerations, Wärtsilä Ecosafe can offer a proven solution. Wärtsilä also offers a range of water lubricated Maneguard PSE seals specifically designed to operate in abrasive water conditions.

There are in fact three distinctly different types of noise:
Airborne noiseThis noise is created by pressure variations in the air (compressible fluid) and can simply be called “sound”. This principally concerns airborne noise levels that are lower than those set by marine regulations. The main technical solution for limiting airborne noise disturbance is to insulate the entire engine room, or the engine itself, by using an acoustic enclosure.
Structure-borne noiseThis noise is created by vibrations of onboard equipment, which is transmitted to the hull. This is a concern in almost all applications and at various severities, but there is a simple technical solution in the form of anti-vibration mounts. Sometimes, the requirement for limiting vibrations transmitted to the hull is such that it is necessary to consider two stages of resilient mounts (called “double resilient mounting”).
Underwater radiated noiseThis noise is created by pressure variations in water (uncompressible fluid). These fluctuations are due to the hull’s residual vibrations that excite water (due mainly to structure-borne noise, and to a limited extent, airborne noise), and by rotating elements and appendages in the water.
This is the noise that fish and sonar can detect, and is obviously a main issue for Oceanographic Research vessels (so as
not to disturb the fish under observation) and most naval vessels (so as not to be detected by sonar). As a rough guide, it can be estimated that for research vessels, ½ the underwater-radiated noise is from the propeller, ¼ is from the generator sets, and ¼ from the electric motors.
Noise abatement is an everyday concern in the naval environment. Wärtsilä has developed either dedicated solutions, or has adapted COTS (commerical off-the-shelf ) equipment to meet these design challenges. A good illustration of the know-how and capabilities of Wärtsilä in this domain is the propulsion solution adopted for the MEDUSA project, the new Oceanographic Research Vessel made by the Chilean Navy, presented at the end of this article.
Welcome to the world of silence.
All parts of a vessel contribute to underwater-radiated noise, including the active inner parts such as machinery, and the passive outer parts, meaning the hull and its appendages, due to turbulence in the flow on these surfaces. The propellers become one of the essential sources of noise as the vessel increases speed because of the occurrence, and the extension of the cavitation phenomenon, which dramatically increases the noise levels at all frequencies. Low signature vessels are those for which the radiated noise spectrum is as low as possible at all frequencies.
International Council for the Exploration of the Sea (ICES)For research ships, the Cooperative Research Project n°209 from the International Council for the Exploration of the Sea (ICES) [1] gives recommendations concerning underwater-radiated noise. The main objective of these recommendations is to define a spectrum of acceptable underwater-radiated noise
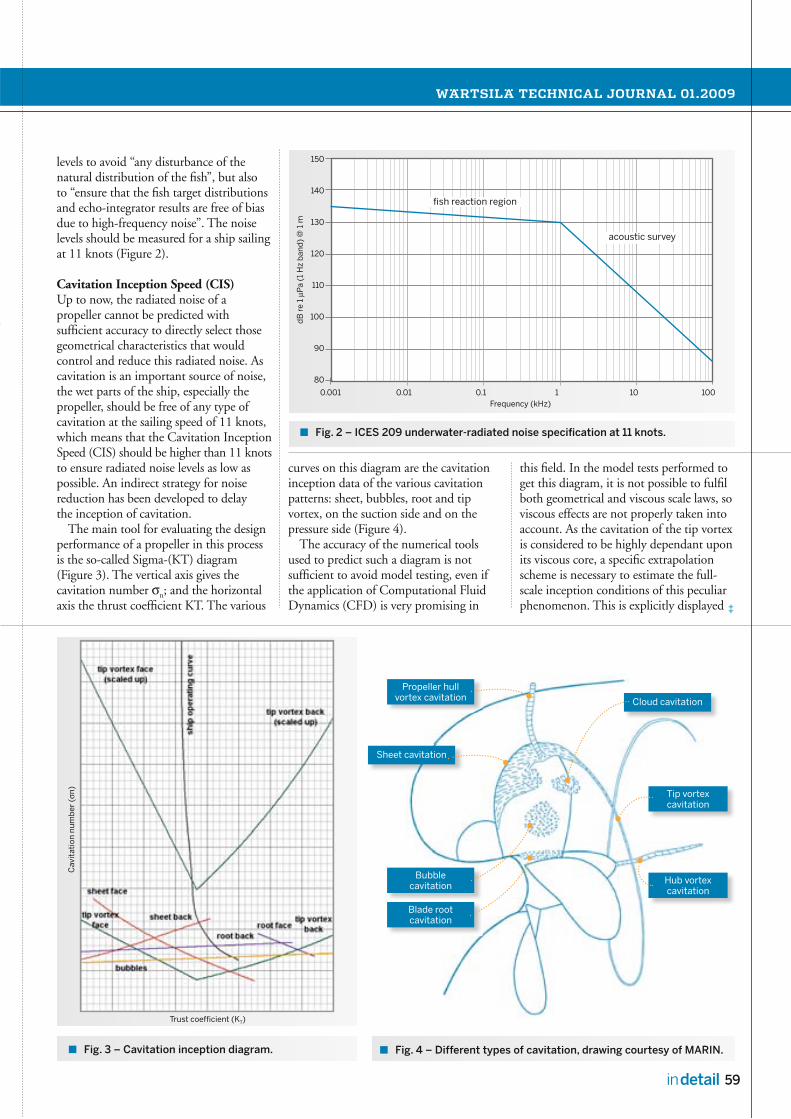
levels to avoid “any disturbance of the natural distribution of the fi sh”, but also to “ensure that the fi sh target distributions and echo-integrator results are free of biasdue to high-frequency noise”. The noiselevels should be measured for a ship sailingat 11 knots (Figure 2).
Cavitation Inception Speed (CIS)Up to now, the radiated noise of a propeller cannot be predicted with suffi cient accuracy to directly select those geometrical characteristics that would control and reduce this radiated noise. As cavitation is an important source of noise, the wet parts of the ship, especially the propeller, should be free of any type of cavitation at the sailing speed of 11 knots, which means that the Cavitation Inception Speed (CIS) should be higher than 11 knotsto ensure radiated noise levels as low aspossible. An indirect strategy for noisereduction has been developed to delaythe inception of cavitation.
The main tool for evaluating the designperformance of a propeller in this processis the so-called Sigma-(KT) diagram (Figure 3). The vertical axis gives thecavitation number n; and the horizontal axis the thrust coeffi cient KT. The various
curves on this diagram are the cavitationinception data of the various cavitationpatterns: sheet, bubbles, root and tipvortex, on the suction side and on thepressure side (Figure 4).
The accuracy of the numerical tools used to predict such a diagram is not suffi cient to avoid model testing, even if the application of Computational Fluid Dynamics (CFD) is very promising in
this fi eld. In the model tests performed to get this diagram, it is not possible to fulfi l both geometrical and viscous scale laws, so viscous effects are not properly taken into account. As the cavitation of the tip vortex is considered to be highly dependant upon its viscous core, a specifi c extrapolation scheme is necessary to estimate the full-scale inception conditions of this peculiar phenomenon. This is explicitly displayed ‡

on the diagram by the scaled up curves and fully described by Mc Cormick [2].
The intersection of the ship’s operating curve with the scaled up tip vortex bucket defines the CIS of the tested design. The design challenge is to achieve a wide and deep tip vortex cavitation bucket, the bottom of which is pierced by the ship operating curve, in a balanced manner between face (pressure side) and back (suction side) of the propeller blade.
Wärtsilä has developed its expertise with the co-operation of the major institutions and model basins in this field of research.
From radiated noise to inboard vibrationsFrom the underwater radiated noise criterion (sound pressure level) a ‘reverse‘ calculation procedure, based on a database of similar ships or a noise radiation model, is used in order to define the structure-borne noise. This is done at the ship’s hull plating, and continues with the noise and vibration levels/limits at the inboard machinery foundations. The typical frequency range of interest for machinery vibrations limits is 10 Hz to 10,000 Hz.
Excitation sourcesThe excitation forces from the engine (mass and gas excitations), from the generator (unbalance, electrical excitations), and from the DG (diesel generator) set auxiliaries; pumps, fans and piping, will be the determinants for the noise and vibration levels of the DG set. The reduction of these excitations has to
Design of the auxiliaries fitting and pipe clamping, which may have a significant influence on the resilient mounting efficiency.
For some projects, an acoustic enclosure might be needed when the noise level in the engine room has to be below the standard engine airborne noise, or when the vibrations have been reduced to a very low level whereupon the underwater-radiated noise may be influenced by the airborne noise of the DG set.
■
be investigated, as far as is possible, at the level of the excitation source. In practice, this is limited by the laws of physics, the practicality of solutions (balancing, bearing selection, the Eigen frequency analysis, fluids velocities etc.), and cost reasons (development and implementation).
DG set engineeringThe remaining and most efficient means of decreasing the force transmissibility from the excitation source to the machinery foundation, can be achieved through the mounting of the noise sources in accordance with the following main design features:
Installation of the engine, generator and auxiliaries on a common base frame. A static and dynamic analysis of the base frame design (stiffness of the seatings below the engine and generator fittings, natural frequencies and mode shapes) is generally done through a Finite Element Model. (Figures 5 and 7).Selection of the number of resilient mount stages; at least one stage of resilient mounts between the common base frame and the machinery foundation on the ship’s hull plating. If needed, in addition to the previous stage, a second resilient mounts stage is fitted between the engine and the base frame (and for some applications, between the generator and the base frame). (Figure 6). Selection of the type of resilient mounts (natural frequencies generally in the range of 3 to 10 Hz, displacement capability from 10 mm up to 70 mm for some Navy applications with shock requirements).
■
■
■
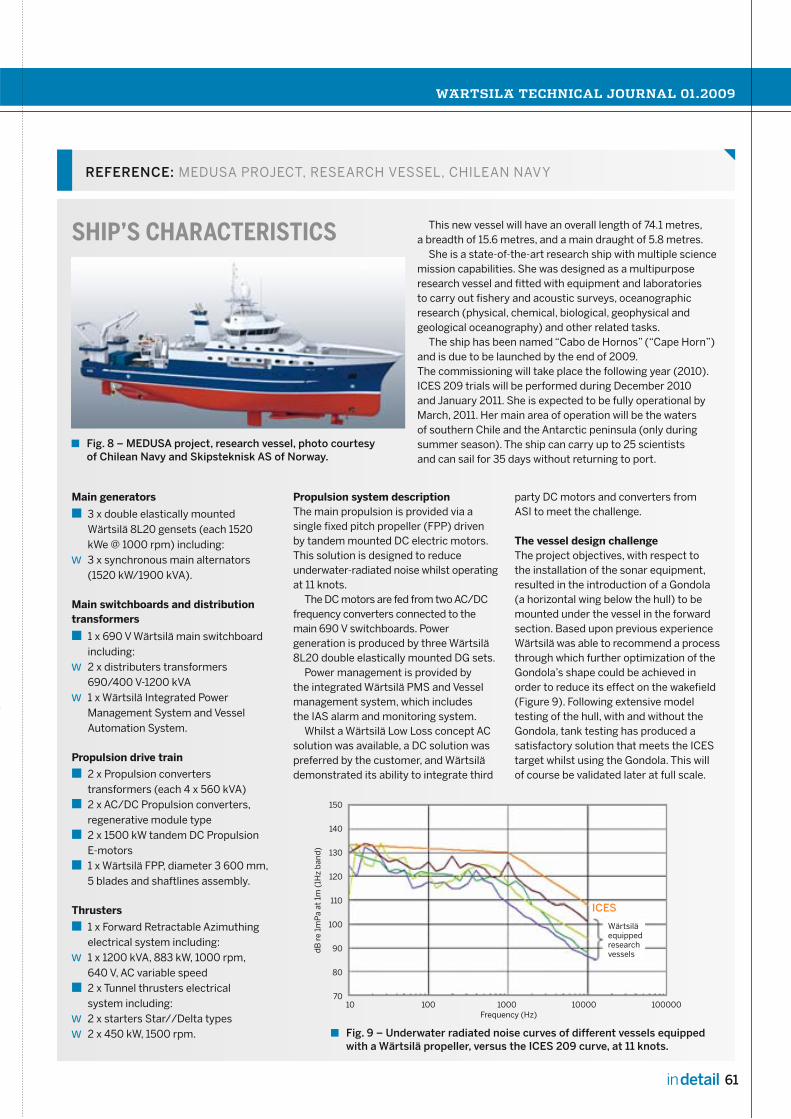
■
w
■
w
w
■
■
■
■
■
w
■
ww

Well Ops is a business unit of Helix Energy Solutions Group Inc., and provides a wide range of well operation and decommissioning services using specialist vessels, one of which is the Q4000.
The Q4000 is a unique multi-service vessel capable of operating in water depths down to 10,000 feet (3000 metres), for example in the Gulf of Mexico.
Wärtsilä has been working very closely with Helix ESG to improve the reliability of their Q4000 vessel. Electrical equipment that supplies power to the fixed speed controllable pitch (CPP) thrusters was not operating optimally. In addition, the client began to experience mechanical failures on the thruster gearing systems. These issues resulted in repair-related downtime that could potentially affect vessel availability.
In addition, Helix ESG upgraded the vessel to include a new modular drilling system, thus adding to the vessel’s generation network loads.
Last but not least, the vessel was operating at a very low power factor. This required running multiple generators at light loads, causing premature engine wear.
Wärtsilä was contacted to carry out an audit to review the equipment installed, offer solutions to the above-mentioned issues and improve reliability while reducing downtime.
In summary, the major driving factors behind the project were:
Addressing failures of drive system electrical components.Resolving drive system reliability issues.Minimizing services-related vessel downtime.
■
■■
Reducing fuel consumption and component wear caused by running of excess generators. Accommodating increased load on the electrical distribution system concurrent with the vessel’s upgraded slimbore drilling system.
In this article we will review the options that Wärtsilä considered, discuss the benefits and drawbacks of each, and also determine how and why the proposed solution was adopted.
■
■
The vessel’s thrusters were originally driven by a fixed speed squirrel cage induction motor, and variations in thrust output were obtained by varying the pitch angle on the thruster blades. This is a rather common arrangement in the marine industry.
The thruster drive motors were started by means of a reduced voltage start via an auto-transformer and medium voltage contactor switching, again a common arrangement.

The vessel had suffered repeated failures of the mentioned auto-transformers, and various parties had been engaged to review the system and the failures. Transformer manufacturers, the switchgear manufacturer, the original equipment installer and a European design organization carried out investigations; nevertheless, no clear reason for the failures could be given.
Because of mechanical failures to the thruster drive chain, and premature wear on the thruster/motor coupling arrangement, the main drive gearing had worn prematurely.
Option 1: Repair without changesThe first option available to the client was to repair the vessel’s thrusters, hire or purchase an additional generation plant to service the drilling loads, and continue to operate. This option was discarded as it was quickly realized that this would not address the downtime issues or the repeated failures.
Option 2: Adding a generating plant to supply the new drilling loadsAs the drilling system to be installed had been designed as a modular unit, which could be de-mobilized from the vessel, the addition of one or two new package generator sets was considered. These would be adequately sized to supply the entire drilling package.
This solution was given serious consideration but was not adopted, as it would have increased capital investment. Furthermore, it would have created a loss of usable deck space, additional running costs and emissions, additional maintenance costs, and noise issues.
Option 3: The use of static or rotary power factor correctionWhilst the installation of synchronous condensers, or static power factor correction equipment, would address the low power factor on the vessel’s network, it would not solve the equipment failure problems. It would not, therefore, completely address all of the problems. While significant savings in fuel and low engine running hours would be reached with this method of modification, thus providing a return on investment, this return would be achieved only over a protracted period of time, owing to
the increase in capital outlay and installation costs.
Another issue associated with applying power factor correction only, was that additional switchgear and cabling would be required to be connected to the network, either locally at the thruster motor starters, or to one of the vessel’s 11 kV switchboards. This would increase the overall cost and time impact of the project. It would also require that space dedicated to other equipment or services be re-assigned, and would involve steelwork modifications.
Another important fact considered was that if rotary compensation was employed (synchronous condensers), then the inclusion of these on the network would raise the system’s prospective short-circuit fault level. This would have a negative impact on the project. Furthermore, this component of the design would have to be engineered and, dependent upon the subsequent increase in fault level, could have large associated costs.
Option 4: Modification of the vessels thruster systems with variable frequency driven unitsThe most important load component of the vessel during dynamic positioning, is the one required to drive the position-keeping thrusters. In the existing configuration, the driving thruster motors are normally run on very light loads, thus causing the resultant system power factor to be quite low, as described above.
By replacing the original fixed speed motor and the reduced-voltage starting system by variable speed drives with forced-air cooled motors, the power factor of the thruster drive train can be kept to a very high level towards unity (i.e. closer to 1 and hence more efficient). This ensures that the resultant power factor of the vessel network will have a much better value.
By removing the reduced voltage starting system altogether, the overall reliability of the vessel’s systems would be increased. The improved power factor would remove the need for too many diesel generators to be run at light load, and thus make more power available for the new drilling loads.
In reducing the number of engines running at the same time, the vessel’s operating and maintenance costs are reduced. Also reduced is the environmental impact of the vessel’s operations.
As the thrusters would not be
running at nominal speed continuously, the reduced running speed and the smoother operation during load changes would lower the wear on the thruster systems, again having a positive impact on maintenance and repair costs.
Having considered all of the above options, it was clear that only option 4 addressed all of the listed issues. Furthermore, by selecting variable speed drives, there was the added benefit of reducing the wear on the vessel’s thruster drive chains.
Selection of the variable frequency drive The market for a 3 MW variable frequency drive, as required for this project, is quite buoyant. There are several different methods or approaches that could be employed to achieve a satisfactory solution.
For instance, the drive options available include different methods of commutation (i.e. 6, 12 or 24 pulses), air or water cooled, and closed or open loop speed control.
Bid packages were sent to a number of major drive manufacturers and integrators, the content of which included the following criteria:
Motor output rating (3 MW @ 900 rpm).Marine class requirements, including maximum harmonics distortion.Space for the equipment.Capital and operating costs.Robust and reliable equipment and means of control.
The amount of total harmonic distortion that would be imposed on the network after the modification to variable frequency drive was a large concern. The most efficient means of controlling this was to adopt a 24-pulse solution. However, the higher costs involved with this (+30%), together with the increased overall dimensions of the equipment (+50%), made this prohibitive.
The solution adopted was to provide the drives as 12-pulse units, but with a twist. The vessel’s electrical distribution system is configured as three 11 kV switchboards, each with two generators and two thrusters connected. (Before and after 11 kV network single lines).
The system can be operated with the switchboards in isolation, but typically they are utilized in a ring configuration. Each variable frequency drive unit is supplied via a three winding step-down power transformer. The solution adopted
■■
■■■
‡
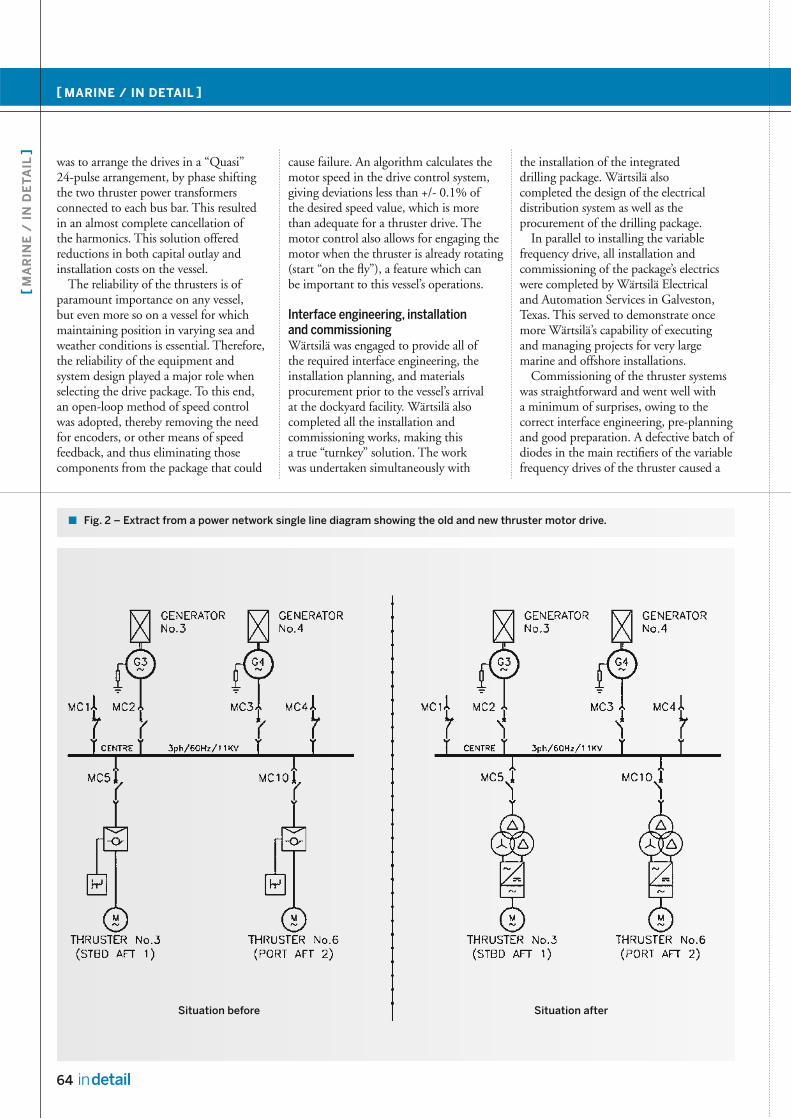
was to arrange the drives in a “Quasi” 24-pulse arrangement, by phase shifting the two thruster power transformers connected to each bus bar. This resulted in an almost complete cancellation of the harmonics. This solution offered reductions in both capital outlay and installation costs on the vessel.
The reliability of the thrusters is of paramount importance on any vessel, but even more so on a vessel for which maintaining position in varying sea and weather conditions is essential. Therefore, the reliability of the equipment and system design played a major role when selecting the drive package. To this end, an open-loop method of speed control was adopted, thereby removing the need for encoders, or other means of speed feedback, and thus eliminating those components from the package that could
cause failure. An algorithm calculates the motor speed in the drive control system, giving deviations less than +/- 0.1% of the desired speed value, which is more than adequate for a thruster drive. The motor control also allows for engaging the motor when the thruster is already rotating (start “on the fly”), a feature which can be important to this vessel’s operations.
Wärtsilä was engaged to provide all of the required interface engineering, the installation planning, and materials procurement prior to the vessel’s arrival at the dockyard facility. Wärtsilä also completed all the installation and commissioning works, making this a true “turnkey” solution. The work was undertaken simultaneously with
the installation of the integrated drilling package. Wärtsilä also completed the design of the electrical distribution system as well as the procurement of the drilling package.
In parallel to installing the variable frequency drive, all installation and commissioning of the package’s electrics were completed by Wärtsilä Electrical and Automation Services in Galveston, Texas. This served to demonstrate once more Wärtsilä’s capability of executing and managing projects for very large marine and offshore installations.
Commissioning of the thruster systems was straightforward and went well with a minimum of surprises, owing to the correct interface engineering, pre-planning and good preparation. A defective batch of diodes in the main rectifiers of the variable frequency drives of the thruster caused a

few problems, but this was identified and replacement components were dispatched to the vessel immediately from Europe.
Prior to the thruster modification, the vessel was consuming over 40 metric tonnes of marine diesel oil per day. After this variable speed modification, the measured fuel consumption has been approximately 20 metric tonnes of fuel per day, a significant 50% saving. Instead of running four generator sets to maintain position, the vessel normally runs two, adding to the savings via reduced running and maintenance costs. The reduction in the number of generator sets required for positioning has allowed the vessel’s generators to be used to provide power to the drilling package, or other deck consumers – representing further savings
in capital outlay and operational costs.The environmental impact of the vessel’s
operations has been reduced in the same proportion, since a 50% reduction in fuel consumption is a direct reduction of 50% in CO2 and NOX emissions.
The reduced number of revolutions of the vessel’s thrusters has reduced wear and operational costs over the past year.
The above illustrates that the project has been a success; for the vessel’s owners, for Wärtsilä’s partners, and, subsequently for Wärtsilä.
The commissioning of the thruster systems revealed that some control systems for power generation on the vessel are not allowing the generation/distribution/thruster systems to operate at their maximum
capability. Wärtsilä has been engaged by the client to engineer the replacement of these in the very near future.
This drive for continuous improvement, through the innovative application of technology, allows Wärtsilä to reach its goal of being the most valued business partner of its clients.
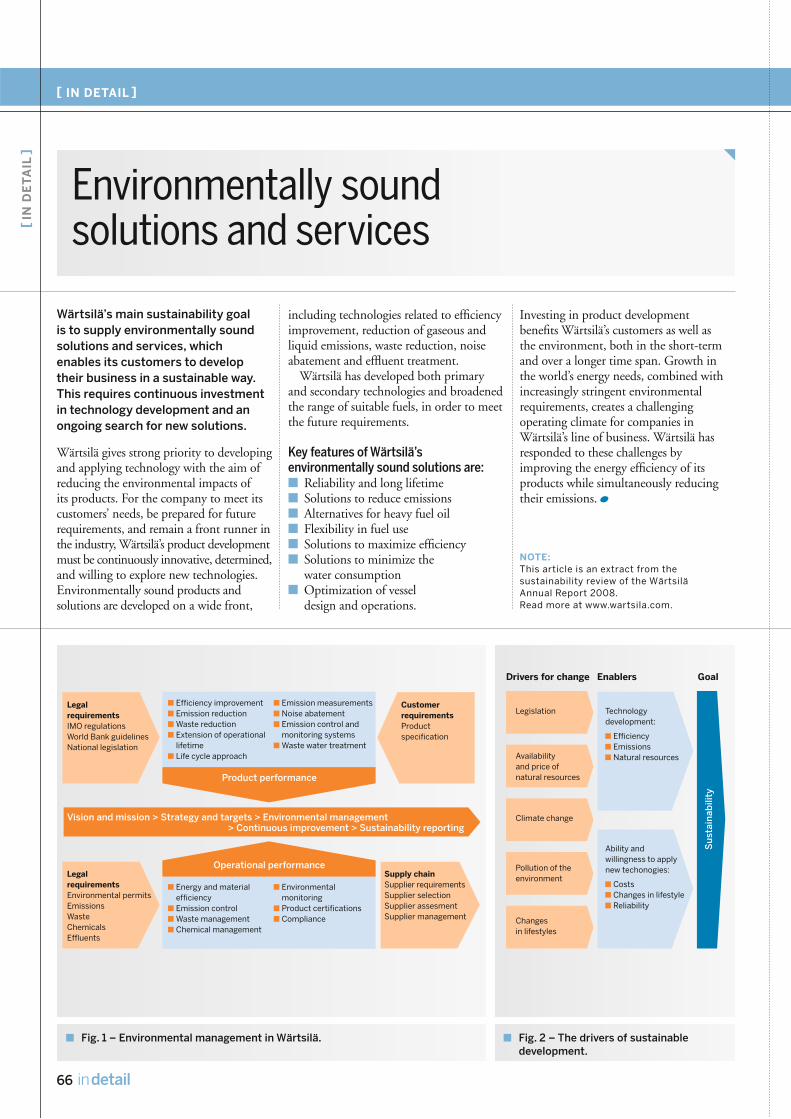
Investing in product development benefits Wärtsilä’s customers as well as the environment, both in the short-term and over a longer time span. Growth in the world’s energy needs, combined with increasingly stringent environmental requirements, creates a challenging operating climate for companies in Wärtsilä’s line of business. Wärtsilä has responded to these challenges by improving the energy efficiency of its products while simultaneously reducing their emissions.
Wärtsilä gives strong priority to developing and applying technology with the aim of reducing the environmental impacts of its products. For the company to meet its customers’ needs, be prepared for future requirements, and remain a front runner in the industry, Wärtsilä’s product development must be continuously innovative, determined, and willing to explore new technologies. Environmentally sound products and solutions are developed on a wide front,
including technologies related to efficiency improvement, reduction of gaseous and liquid emissions, waste reduction, noise abatement and effluent treatment.
Wärtsilä has developed both primary and secondary technologies and broadened the range of suitable fuels, in order to meet the future requirements.
Reliability and long lifetimeSolutions to reduce emissionsAlternatives for heavy fuel oilFlexibility in fuel useSolutions to maximize efficiencySolutions to minimize the water consumptionOptimization of vessel design and operations.
■■■■■■
■

WÄ
RTS
ILÄ
® is
a r
egis
tere
d t
rad
emar
k.
WIND POWER THAT WORKS, EVEN WITHOUT WIND.
We complement alternative energy sources so that you’ll
never be without power. This is just one example of how
Wärtsilä solutions are good for both business and nature on land
and at sea. Read more about what we can do for you and the
environment at wartsila.com.
