2009 grade 3-8 math additional slides
DESCRIPTION
2009 Grade 3-8 Math Additional Slides. 1. 2. Math 2006-2009 Percentage of Students Statewide Scoring at Levels 3 and 4 , Grades 3-8. The percentage of students in New York State reaching Levels 3 & 4 showed consistent improvement over the past four years. - PowerPoint PPT PresentationTRANSCRIPT

2009 Grade 3-8Math
Additional Slides
1
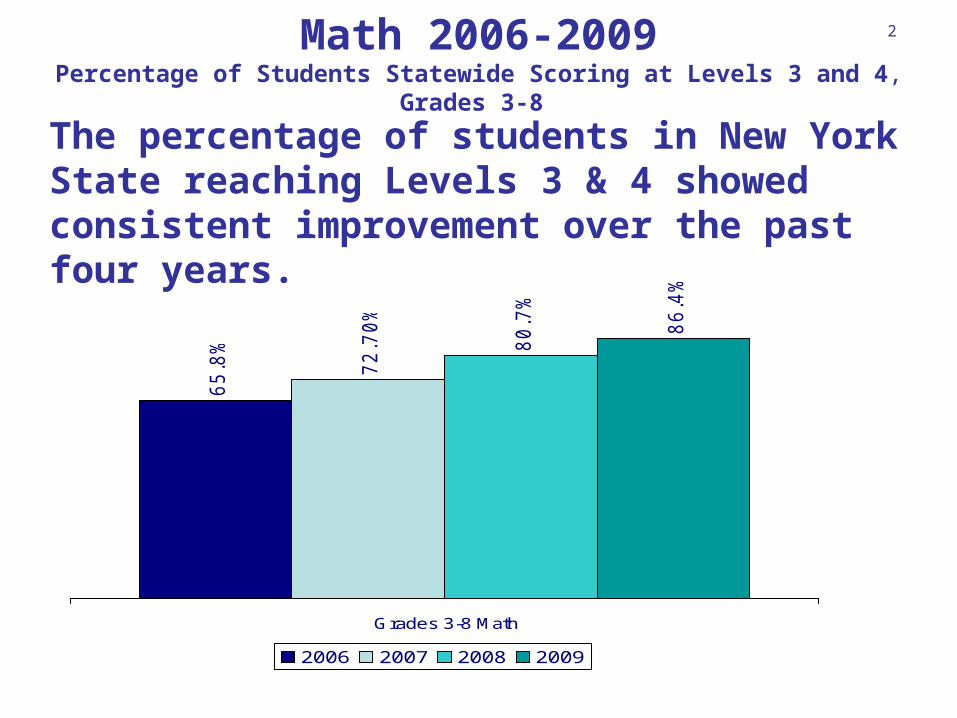
Math 2006-2009Percentage of Students Statewide Scoring at Levels 3 and 4, Grades 3-8
65
.8%
72
.70
%
80
.7%
86
.4%
Grades 3-8 Math
2006 2007 2008 2009
2
The percentage of students in New York State reaching Levels 3 & 4 showed consistent improvement over the past four years.

66
3
67
1
67
8
68
4
Grade 3-8
2006 2007 2008 2009
Math 2006-2009 Total Public 3-8 Mean Scale Scores
650
3
Mean Scale Scores showed measured progression over the past four years

2009 Math Total Public Grades 3, 4, and 5
4
Students are displaying proficiency at each grade level statewide, though there still needs to be improvement.
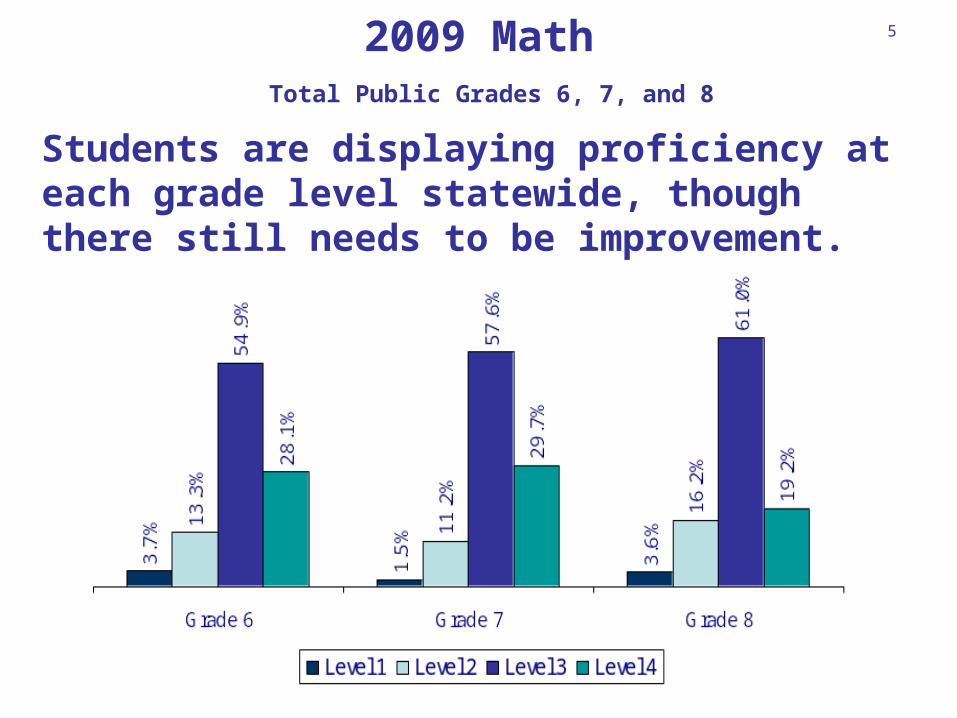
2009 Math Total Public Grades 6, 7, and 8
5
Students are displaying proficiency at each grade level statewide, though there still needs to be improvement.
6.4
%
7.5
%
10
.3%
13
.4%
13
.2%
15
.0%
11
.1%
4.1
%
6.1
%
5.9
%
8.8
%
7.6
% 12
.3%
7.5
%
2.3
%
4.8
%
3.8
%
5.6
%
3.9
%
7.5
%
4.7
%
1.0
%
3.8
%
2.2
%
3.7
0%
1.5
%
3.6
%
2.6
%
Grade 3 Grade 4 Grade 5 Grade 6 Grade 7 Grade 8 Grades 3-8
2006 2007 2008 2009
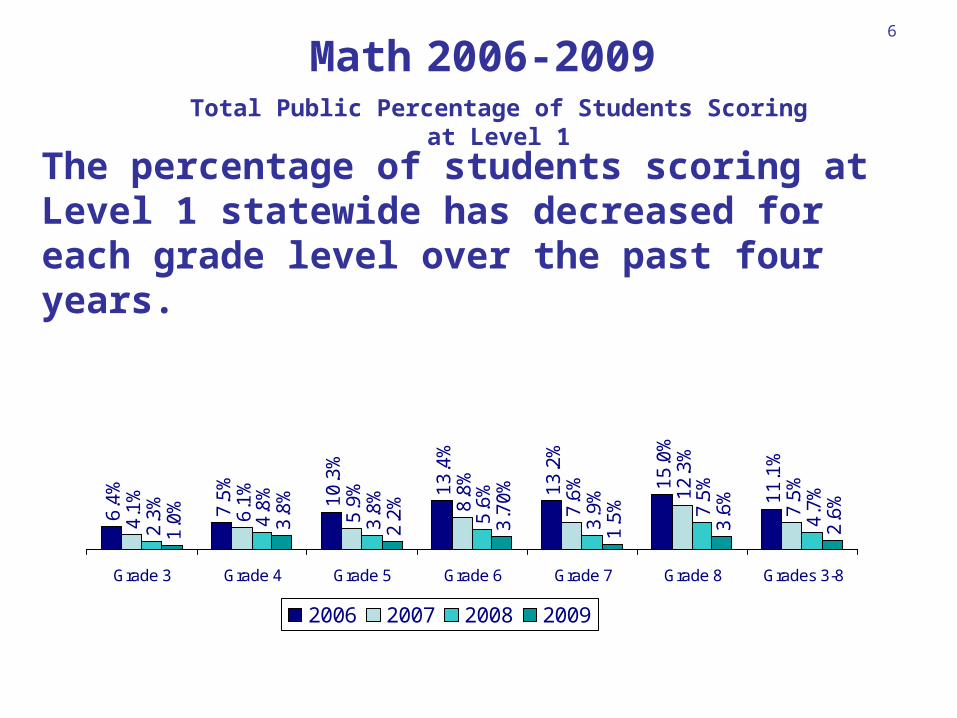
Total Public Percentage of Students Scoring at Level 1
Math 2006-20096
The percentage of students scoring at Level 1 statewide has decreased for each grade level over the past four years.

2009 MathPercentage of Students NYC Scoring at Levels 3 and 4, Grades 3-8 Math
57
.0%
65
.10
%
74
.3%
82
%
Grades 3-8 Math
2006 2007 2008 2009
7
The percentage of NYC students reaching Levels 3 & 4 increased steadily over the past four years.

65
6
66
5
67
2
68
0
Grade 3-8
2006 2007 2008 2009
Math 2006-2009 NYC 3-8 Mean Scale Scores
650
8
NYC Mean Scale Scores showed consistent improvement over the past four years

2009 Math NYC Grades 3, 4, and 5
9
NYC Students are displaying proficiency at each grade level, though there still needs to be improvement.
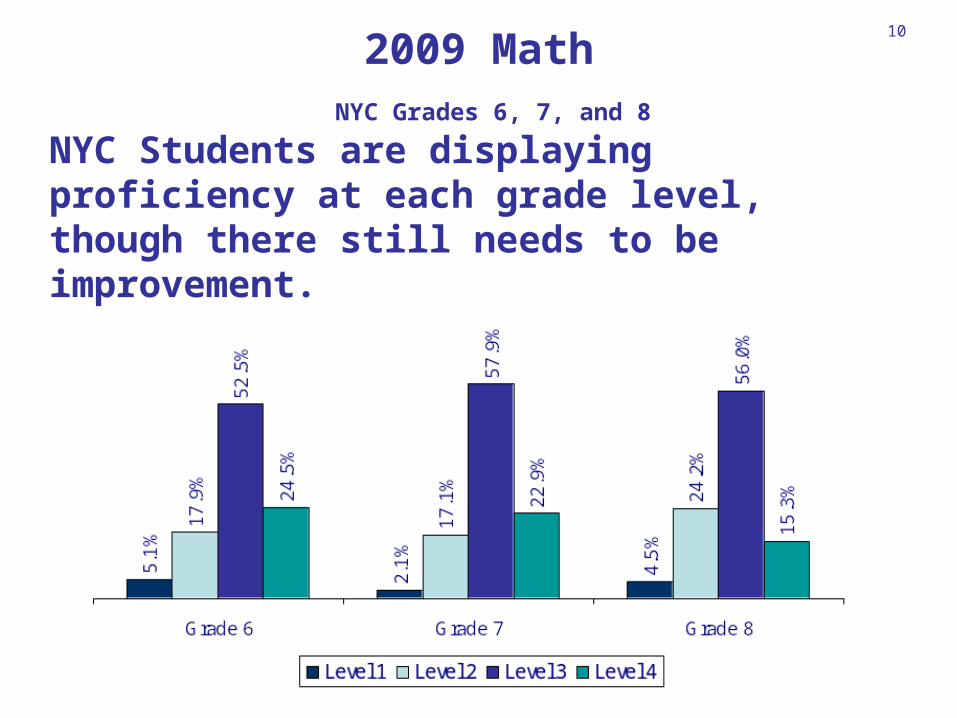
2009 Math NYC Grades 6, 7, and 8
10
NYC Students are displaying proficiency at each grade level, though there still needs to be improvement.
Math 2006-20099
.1%
10
.3%
13
.3%
18
.0%
18
.8%
24
.1%
15
.7%
5.4
%
8.1
%
7.6
% 12
.3%
11
.0% 18
.8%
10
.6%
3.1
%
6.3
%
5.0
%
7.7
%
5.7
% 10
.3%
6.3
%
1.3
%
4.6
%
2.8
%
5.1
%
2.1
%
4.5
%
3.4
%
Grade 3 Grade 4 Grade 5 Grade 6 Grade 7 Grade 8 Grades 3-8
2006 2007 2008 2009
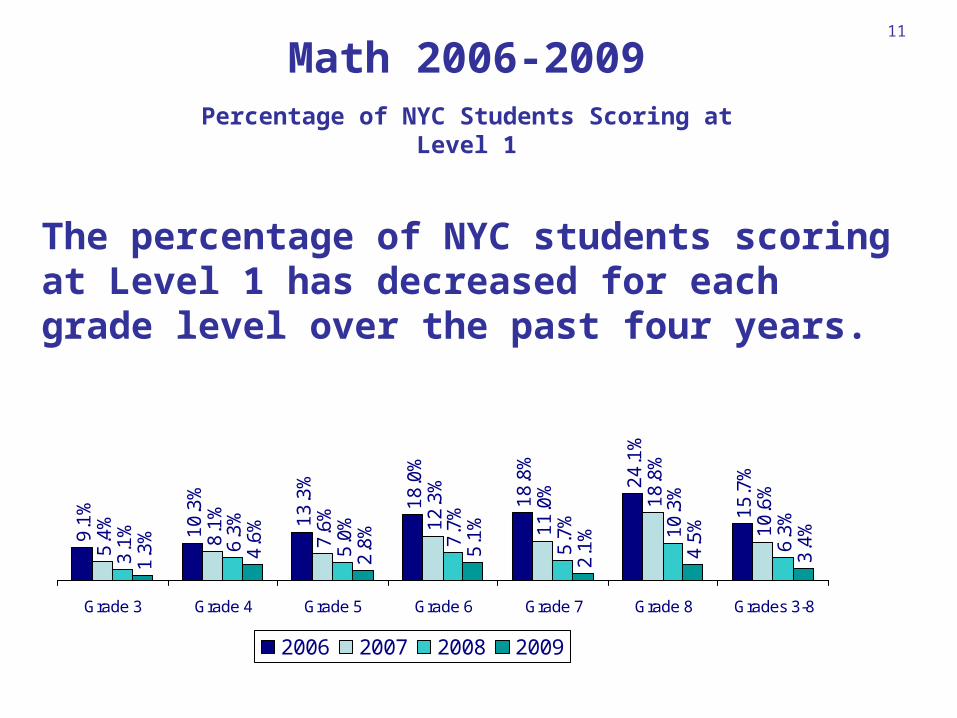
Percentage of NYC Students Scoring at Level 1
11
The percentage of NYC students scoring at Level 1 has decreased for each grade level over the past four years.

15
.7%
33
.6%
31
.1%
34
.3%
18
.3%
11
.1%
10
.6%
24
.6%
23
.7%
24
.0%
15
.9%
7.5
%
6.3
%
15
.8%
13
.5%
16
.0%
9.5
%
4.7
%
3.4
% 9.0
%
8.3
%
5.2
%
3.9
%
2.6
%
New York City Buffalo Rochester Syracuse Yonkers Total Public
2006 2007 2008 2009
12
Math 2006-2009Percentage of Grade 3-8 Students in the Big 5 Scoring at Level 1
Similarly, the percentage of students in the Big 5 scoring at Level 1 has declined over the past four years.

92
.5%
91
.7%
87
.6%
83
.4%
78
.6%
77
.1%
85
.2%
94
.6%
92
.6%
91
.5%
89
.0%
85
.4%
81
.4%
89
.0%
96
.5%
94
.7%
94
.2%
92
.7%
91
.3%
88
.3%
92
.9%
97
.3%
96
.0%
95
.8%
93
.8%
94
.5%
91
.9%
94
.9%
Grade 3 Grade 4 Grade 5 Grade 6 Grade 7 Grade 8 Grades 3-8
2006 2007 2008 2009
Math 2006-2009
Percentage of Asian Students Scoring at Levels 3 and 4
13
The percentage of Asian students scoring at Levels 3 & 4 display improvement over the past four years.
67
0 70
0
69
1
68
3
67
8
68
8
70
5
69
9
69
5
68
7
68
3
69
6
70
7
70
7
70
3
70
0
69
6
69
2
70
1
71
1
71
4
70
6
70
2
70
1
69
6
70
5
67
470
4
Grade 3 Grade 4 Grade 5 Grade 6 Grade 7 Grade 8 Grades 3-8
2006 2007 2008 2009
650
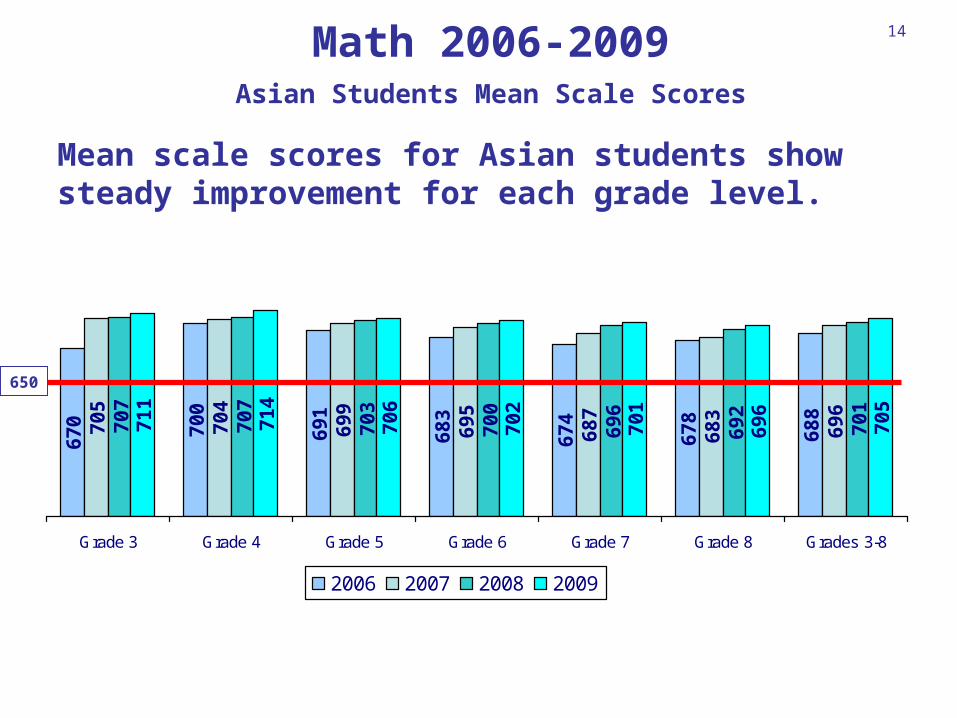
Math 2006-2009Asian Students Mean Scale Scores
14
Mean scale scores for Asian students show steady improvement for each grade level.

92
.5%
91
.7%
87
.6%
83
.4%
78
.6%
77
.1%
94
.6%
92
.6%
91
.5%
89
.0%
85
.4%
81
.4%9
6.5
%
94
.7%
94
.2%
92
.7%
91
.3%
88
.3%
97
.3%
96
.0%
95
.8%
93
.8%
94
.5%
91
.9%
Grade 3 in 2009 Grade 4 in 2009 Grade 5 in 2009 Grade 6 in 2009 Grade 7 in 2009 Grade 8 in 2009 Grade 9 in 2009 Grade 10 in 2009 Grade 11 in 2009
2006 2007 2008 2009
3 3 54 565 63 4 73
Class of 2018 Class of 2017 Class of 2016
4 6 75 8
Grade 3 in 2006
Class of 2015
Grade 4 in 2006
Class of 2014
4
Grade 5 in 2006
Class of 2013
6 7 88 7
Grade 6 in 2006
Class of 2012
Grade 7 in 2006
Class of 2011
Grade 8 in 2006
Class of 2010
8
Math: Asian Students 2006-2009Percentage of Asian Students at Levels 3 and 4
The percentage of Asian students scoring at Levels 3 & 4 show a majority of students at proficiency as they progressed through school.

67
0
70
0
69
1
68
3
67
4 67
8
70
5
70
4
69
9
69
5
68
7
68
3
70
7
70
7
70
3
70
0
69
6
69
2
71
1
71
4
70
6
70
2
70
1
69
6
Grade 3 in 2009 Grade 4 in 2009 Grade 5 in 2009 Grade 6 in 2009 Grade 7 in 2009 Grade 8 in 2009 Grade 9 in 2009 Grade 10 in 2009 Grade 11 in 2009
2006 2007 2008 2009
3 3 54 565 63 4 73
Class of 2018 Class of 2017 Class of 2016
4 6 75 8
Grade 3 in 2006
Class of 2015
Grade 4 in 2006
Class of 2014
4
Grade 5 in 2006
Class of 2013
6 7 88 7
Grade 6 in 2006
Class of 2012
Grade 7 in 2006
Class of 2011
Grade 8 in 2006
Class of 2010
8
650
Math 2006-2009Asian Student Mean Scale Scores
16
The average score of this year’s Asian 6th ,7th, and 8th graders has shown decline or plateau as they have moved from one grade to the next through school, even though more of those students are reaching Level 3 & 4. However, this year’s Asian students generally have higher average scores than Asian students in those grades did 4 years before.

66
.4%
62
.4%
49
.3%
40
.5%
31
.1%
28
.3% 4
5.7
%
74
.5%
64
.9%
60
.5%
53
.1%
42
.9%
34
.4%
54
.6%
81
.3%
71
.9%
70
.5%
63
.9%
60
.9%
48
.3%
65
.9%
87
.0%
77
.6%
78
.3%
69
.8%
74
.9%
62
.9% 75
.0%
Grade 3 Grade 4 Grade 5 Grade 6 Grade 7 Grade 8 Grades 3-8
2006 2007 2008 2009
Math 2006-2009 Percentage of Black Students Scoring at Levels 3 and 4
17
The percentage of Black students scoring at Levels 3 & 4 has increased over the past four years.

66
2
65
9
64
7
63
8
62
9 64
467
2
65
8
65
0
64
3
63
6 65
367
5
66
7
66
4
65
7
65
5
64
7 66
167
9
67
5
67
2
66
4
66
5
65
9
66
9
62
9
66
2
Grade 3 Grade 4 Grade 5 Grade 6 Grade 7 Grade 8 Grades 3-8
2006 2007 2008 2009
650
Math 2006-2009Black Students Mean Scale Scores
18
Black students made steady gains in scale scores for each grade.
71
.5%
66
.6%
56
.1%
45
.2%
37
.2%
33
.0% 5
1.5
%
78
.5%
70
.2%
65
.7%
58
.4%
50
.3%
40
.4%
60
.5%
85
.1%
76
.8%
75
.3%
67
.8%
66
.5%
55
.1% 7
1.1
%89
.9%
82
.0%
83
.1%
73
.7%
78
.6%
69
.3%
79
.5%
Grade 3 Grade 4 Grade 5 Grade 6 Grade 7 Grade 8 Grades 3-8
2006 2007 2008 2009
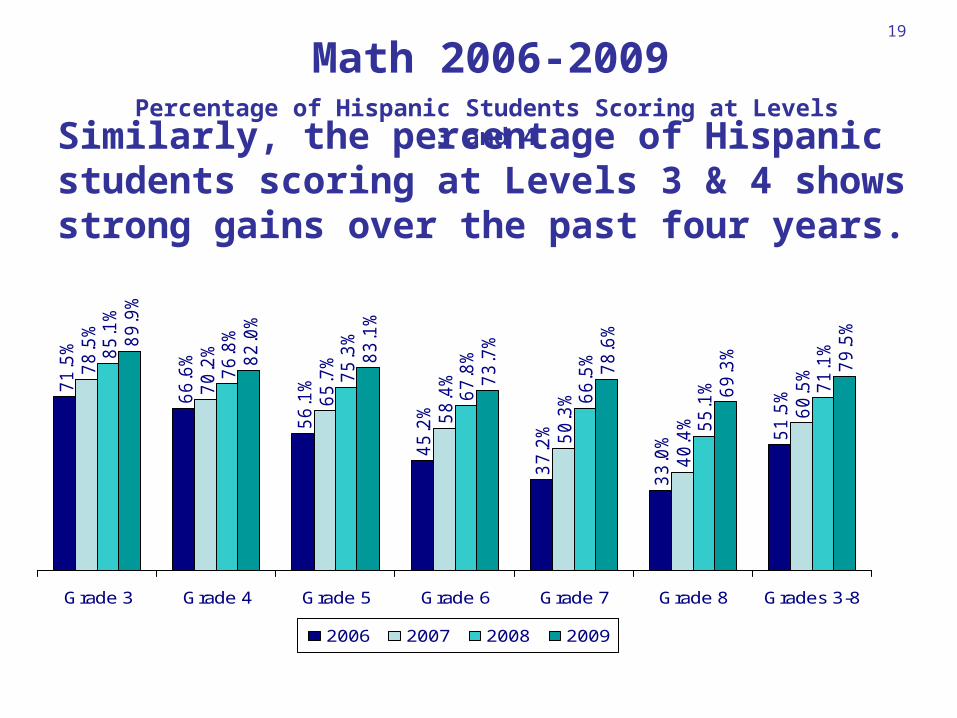
Math 2006-2009Percentage of Hispanic Students Scoring at Levels 3 and 4
19
Similarly, the percentage of Hispanic students scoring at Levels 3 & 4 shows strong gains over the past four years.

66
7
66
3
65
3
64
2
63
3 64
967
6
66
2
65
5
64
8
64
1 65
867
9
67
2
66
9
66
1
65
9
65
2 66
568
3
68
0
67
7
66
8
66
8
66
3
67
3
63
4
66
7
Grade 3 Grade 4 Grade 5 Grade 6 Grade 7 Grade 8 Grades 3-8
2006 2007 2008 2009
650
Math 2006-2009Hispanic Students Mean Scale Scores
20
Hispanic students made consistent gains in scale scores for each grade.
69
.9%
69
.1%
55
.7%
47
.2%
43
.5%
41
.5% 53
.9%
79
.2%
69
.6%
64
.7%
59
.3%
55
.3%
45
.7% 6
1.8
%
85
.2%
78
.1%
74
.6%
70
.7%
70
.4%
60
.2% 73
.0%8
9.8
%
82
.8%
85
.0%
75
.3%
82
.9%
73
.9%
81
.6%
Grade 3 Grade 4 Grade 5 Grade 6 Grade 7 Grade 8 Grades 3-8
2006 2007 2008 2009
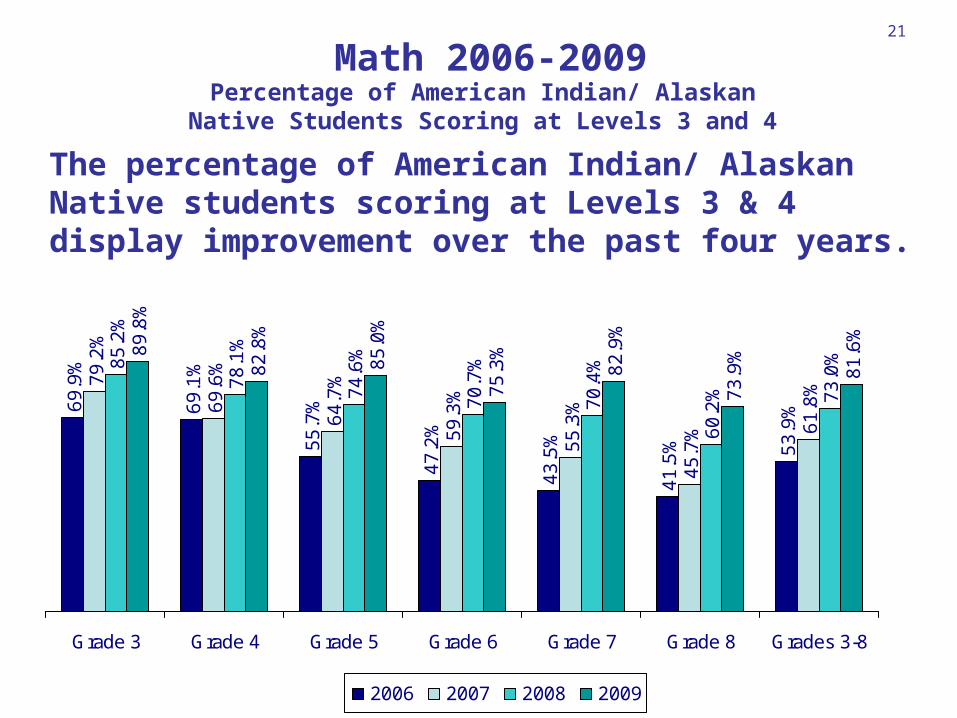
Math 2006-2009Percentage of American Indian/ Alaskan Native
Students Scoring at Levels 3 and 4
21
The percentage of American Indian/ Alaskan Native students scoring at Levels 3 & 4 display improvement over the past four years.

66
4
66
4
65
4
64
2
64
0 65
067
4
66
1
65
5
65
0
64
7 65
867
9
67
3
66
7
66
4
66
3
65
4 66
668
3
68
0
67
7
66
9
67
2
66
6
67
4
63
9
66
6
Grade 3 Grade 4 Grade 5 Grade 6 Grade 7 Grade 8 Grades 3-8
2006 2007 2008 2009
650
Math 2006-2009American Indian/ Alaskan Native Students Mean Scale Scores
22
American Indian/ Alaskan Native students showed scale score improvement for each grade.
69
.9%
69
.1%
55
.7%
47
.2%
43
.5%
41
.5%
79
.2%
69
.6%
64
.7%
59
.3%
55
.3%
45
.7%
85
.2%
78
.1%
74
.6%
70
.7%
70
.4%
60
.2%
89
.8%
82
.8%
85
.0%
75
.3%
82
.9%
73
.9%
Grade 3 in 2009 Grade 4 in 2009 Grade 5 in 2009 Grade 6 in 2009 Grade 7 in 2009 Grade 8 in 2009 Grade 9 in 2009 Grade 10 in 2009 Grade 11 in 2009
2006 2007 2008 2009
3 3 54 565 63 4 73
Class of 2018 Class of 2017 Class of 2016
4 6 75 8
Grade 3 in 2006
Class of 2015
Grade 4 in 2006
Class of 2014
4
Grade 5 in 2006
Class of 2013
6 7 88 7
Grade 6 in 2006
Class of 2012
Grade 7 in 2006
Class of 2011
Grade 8 in 2006
Class of 2010
8
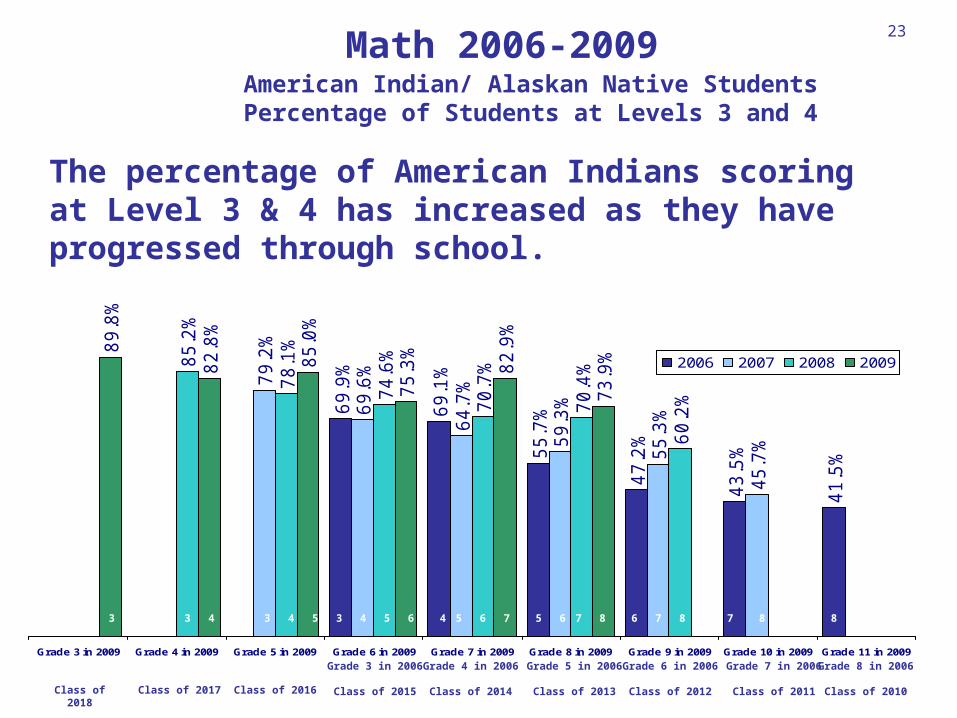
Math 2006-2009American Indian/ Alaskan Native Students Percentage
of Students at Levels 3 and 4
23
The percentage of American Indians scoring at Level 3 & 4 has increased as they have progressed through school.
66
4
66
4
65
4
64
2
63
9
64
0
67
4
66
6
66
1
65
5
65
0
64
7
67
9
67
3
66
7
66
4
66
3
65
4
68
3
68
0
67
7
66
9
67
2
66
6
Grade 3 in 2009 Grade 4 in 2009 Grade 5 in 2009 Grade 6 in 2009 Grade 7 in 2009 Grade 8 in 2009 Grade 9 in 2009 Grade 10 in 2009 Grade 11 in 2009
2006 2007 2008 2009
3 3 54 565 63 4 73
Class of 2018 Class of 2017 Class of 2016
4 6 75 8
Grade 3 in 2006
Class of 2015
Grade 4 in 2006
Class of 2014
4
Grade 5 in 2006
Class of 2013
6 7 88 7
Grade 6 in 2006
Class of 2012
Grade 7 in 2006
Class of 2011
Grade 8 in 2006
Class of 2010
8
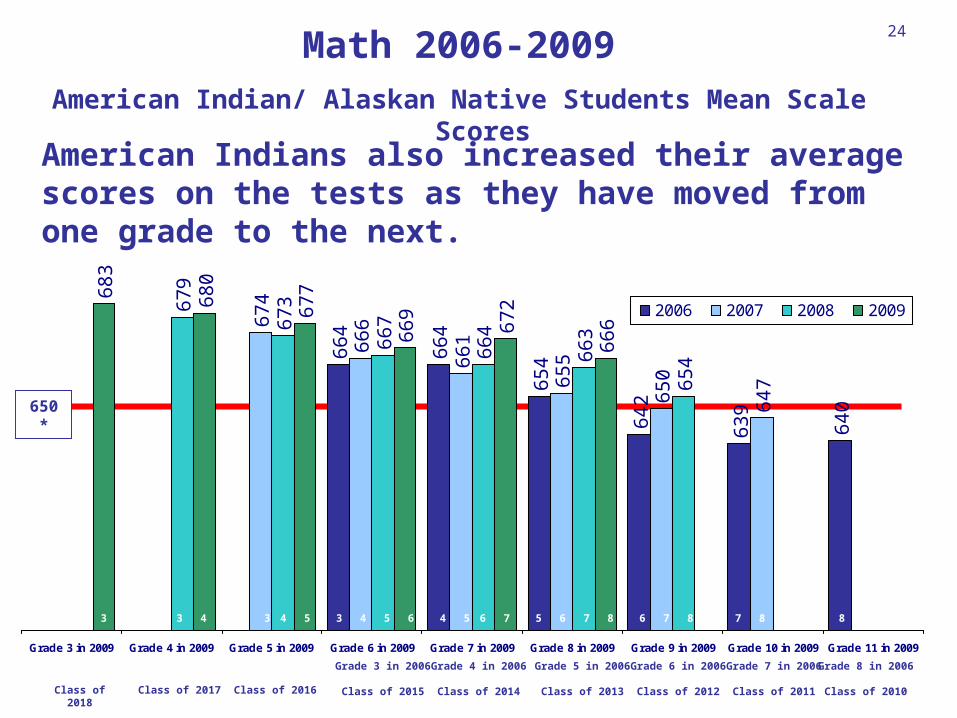
650*
Math 2006-2009American Indian/ Alaskan Native Students Mean Scale Scores
24
American Indians also increased their average scores on the tests as they have moved from one grade to the next.
88
.0%
86
.2%
77
.9%
70
.7%
69
.0%
68
.0%
76
.3%90
.9%
87
.7%
83
.9%
80
.4%
78
.8%
71
.9%
82
.0%
94
.1%
89
.7%
89
.6%
87
.7%
88
.7%
80
.8%
88
.3%
95
.8%
91
.7%
92
.7%
90
.1%
94
.1%
89
.2%
92
.2%
Grade 3 Grade 4 Grade 5 Grade 6 Grade 7 Grade 8 Grades 3-8
2006 2007 2008 2009
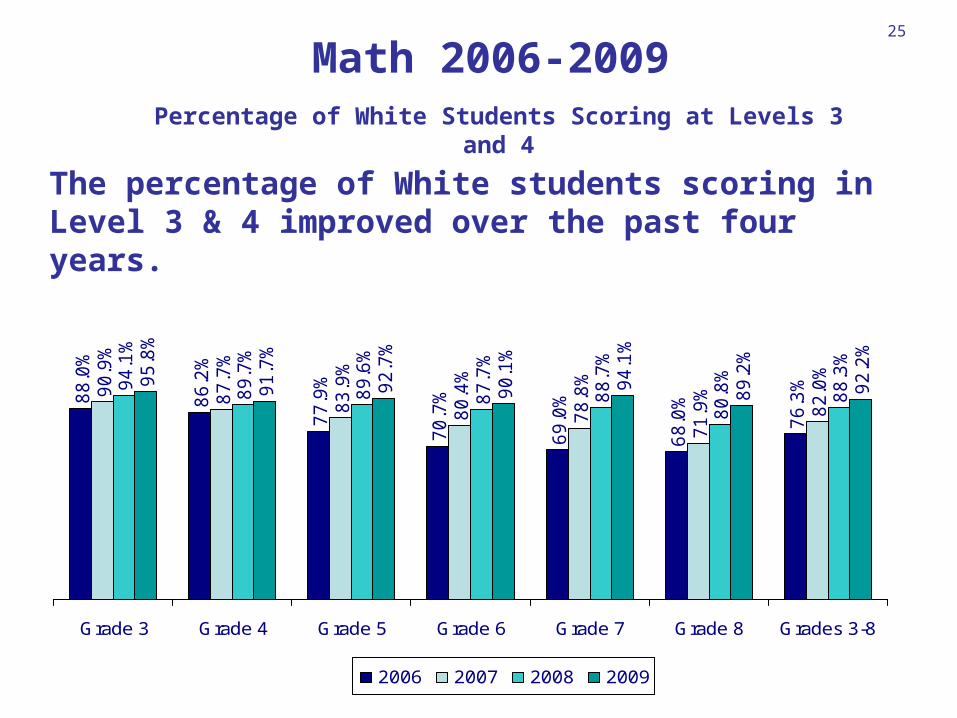
Math 2006-2009Percentage of White Students Scoring at Levels 3 and 4
25
The percentage of White students scoring in Level 3 & 4 improved over the past four years.

92
.8%
92
.0%
88
.3%
83
.4%
80
.0%
78
.4%
86
.0%
94
.7%
92
.3%
91
.8%
89
.8%
86
.4%
83
.3%
89
.8%
97
.2%
94
.7%
94
.4%
93
.3%
92
.8%
89
.5%
93
.6%
97
.7%
96
.5%
96
.1%
94
.8%
95
.3%
93
.3%
95
.6%
Grade 3 Grade 4 Grade 5 Grade 6 Grade 7 Grade 8 Grades 3-8
2006 2007 2008 2009
Math 2006-2009 Percentage of Female Asian Students Scoring at Levels 3 and 4
26
The percentage of Female Asian students scoring at Levels 3 & 4 increased steadily each from an already high proportion of proficiency.

70
0
69
9
69
2
68
2
68
0
68
8
70
6
69
9
69
6
68
8
68
6
69
7
70
8
70
6
70
3
70
0
69
8
69
5
70
2
71
2
71
5
70
6
70
3
70
1
69
9
70
6
67
670
3
Grade 3 Grade 4 Grade 5 Grade 6 Grade 7 Grade 8 Grades 3-8
2006 2007 2008 2009
650
Female Asian Students Mean Scale Scores
27Math 2006-2009
Female Asian students mean scale scores rose consistently for each grade level during the past four years.

92
.8%
92
.0%
88
.3%
83
.4%
80
.0%
78
.4%9
4.7
%
92
.3%
91
.8%
89
.8%
86
.4%
83
.3%97
.2%
94
.7%
94
.4%
93
.3%
92
.8%
89
.5%
97
.7%
96
.5%
96
.1%
94
.8%
95
.3%
93
.3%
Grade 3 in 2009 Grade 4 in 2009 Grade 5 in 2009 Grade 6 in 2009 Grade 7 in 2009 Grade 8 in 2009 Grade 9 in 2009 Grade 10 in 2009 Grade 11 in 2009
2006 2007 2008 2009
3 3 54 565 63 4 73
Class of 2018 Class of 2017 Class of 2016
4 6 75 8
Grade 3 in 2006
Class of 2015
Grade 4 in 2006
Class of 2014
4
Grade 5 in 2006
Class of 2013
6 7 88 7
Grade 6 in 2006
Class of 2012
Grade 7 in 2006
Class of 2011
Grade 8 in 2006
Class of 2010
8
Percentage of Female Asian Students at Levels 3 and 4
28Math 2006-2009
The percentage of Female Asian students scoring at Levels 3 & 4 shows a high proportion of students maintaining and achieving proficiency as they move through grades.

70
0
69
9
69
2
68
2
67
6 68
0
70
6
70
3
69
9
69
6
68
8
68
6
70
8
70
6
70
3
70
0
69
8
69
5
71
2 71
5
70
6
70
3
70
1
69
9
Grade 3 in 2009 Grade 4 in 2009 Grade 5 in 2009 Grade 6 in 2009 Grade 7 in 2009 Grade 8 in 2009 Grade 9 in 2009 Grade 10 in 2009 Grade 11 in 2009
2006 2007 2008 2009
3 3 54 565 63 4 73
Class of 2018 Class of 2017 Class of 2016
4 6 75 8
Grade 3 in 2006
Class of 2015
Grade 4 in 2006
Class of 2014
4
Grade 5 in 2006
Class of 2013
6 7 88 7
Grade 6 in 2006
Class of 2012
Grade 7 in 2006
Class of 2011
Grade 8 in 2006
Class of 2010
8
650
Math 2006-2009 Female Asian Students Mean Scale Scores
29
Female Asian students mean scale scores average significantly above the cut point. However, mean scale score level appears to plateau in the middle grades as they move through school.

92
.2%
91
.5%
86
.8%
83
.4%
77
.2%
75
.7%
84
.5%
94
.4%
92
.8%
91
.0%
88
.0%
84
.3%
79
.5%
88
.3%
95
.8%
94
.6%
94
.0%
92
.1%
90
.0%
87
.2%
92
.2%
97
.0%
95
.5%
95
.5%
92
.9%
93
.7%
90
.6%
94
.2%
Grade 3 Grade 4 Grade 5 Grade 6 Grade 7 Grade 8 Grades 3-8
2006 2007 2008 2009
Math 2006-2009Percentage of Male Asian Students Scoring at Levels 3 and 4
30
The percentage of Male Asian students scoring at Levels 3 & 4 increased steadily each from an already high proportion of proficiency.
69
9
70
1
69
1
68
3
67
6
68
7
70
4
69
9
69
4
68
5
68
1
69
5
70
6
70
8
70
3
69
9
69
4
69
0
70
0
70
9
71
3
70
6
70
1
70
0
69
3
70
4
67
370
6
Grade 3 Grade 4 Grade 5 Grade 6 Grade 7 Grade 8 Grades 3-8
2006 2007 2008 2009
650
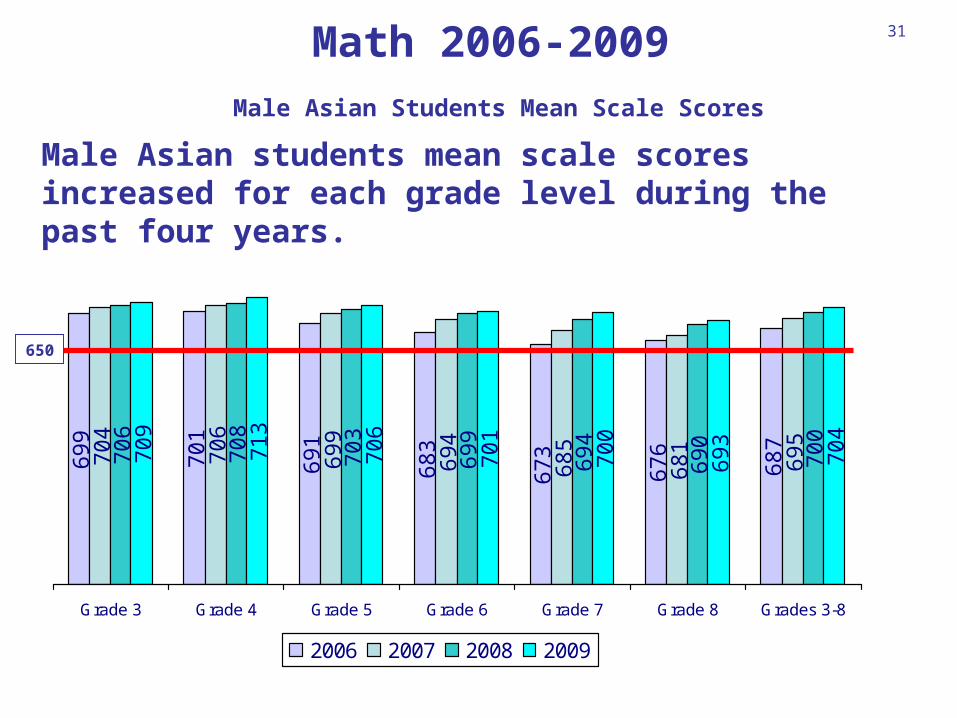
Male Asian Students Mean Scale Scores
31Math 2006-2009
Male Asian students mean scale scores increased for each grade level during the past four years.

92
.2%
91
.5%
86
.8%
83
.4%
77
.2%
75
.7%
94
.4%
92
.8%
91
.0%
88
.0%
84
.3%
79
.5%
95
.8%
94
.6%
94
.0%
92
.1%
90
.0%
87
.2%
97
.0%
95
.5%
95
.5%
92
.9%
93
.7%
90
.6%
Grade 3 in 2009 Grade 4 in 2009 Grade 5 in 2009 Grade 6 in 2009 Grade 7 in 2009 Grade 8 in 2009 Grade 9 in 2009 Grade 10 in 2009 Grade 11 in 2009
2006 2007 2008 2009
3 3 54 565 63 4 73
Class of 2018 Class of 2017 Class of 2016
4 6 75 8
Grade 3 in 2006
Class of 2015
Grade 4 in 2006
Class of 2014
4
Grade 5 in 2006
Class of 2013
6 7 88 7
Grade 6 in 2006
Class of 2012
Grade 7 in 2006
Class of 2011
Grade 8 in 2006
Class of 2010
8
Percentage of Male Asian Students at Levels 3 and 4
32Math 2006-2009
The percentage of Asian male students scoring in Level 3 & 4 as they move through school shows the gains are often smaller than for Black and Hispanic male students. But overall performance is still higher than for Blacks and Hispanics.

69
9
70
1
69
1
68
3
67
3
67
6
70
4
70
6
69
9
69
4
68
5
68
1
70
6
70
8
70
3
69
9
69
4
69
0
70
9 71
3
70
6
70
1
70
0
69
3
Grade 3 in 2009 Grade 4 in 2009 Grade 5 in 2009 Grade 6 in 2009 Grade 7 in 2009 Grade 8 in 2009 Grade 9 in 2009 Grade 10 in 2009 Grade 11 in 2009
2006 2007 2008 2009
3 3 54 565 63 4 73
Class of 2018 Class of 2017 Class of 2016
4 6 75 8
Grade 3 in 2006
Class of 2015
Grade 4 in 2006
Class of 2014
4
Grade 5 in 2006
Class of 2013
6 7 88 7
Grade 6 in 2006
Class of 2012
Grade 7 in 2006
Class of 2011
Grade 8 in 2006
Class of 2010
8
650
Male Asian Students Mean Scale Scores
Math 2006-2009 33
The average score of each class of Asian males has declined, except for this year’s 4th and 9th graders. But all students are achieving at higher levels than their counterparts 4 years ago.

67
.9%
62
.5%
50
.9%
42
.8%
34
.0%
31
.5% 4
7.7
%
75
.9%
65
.4%
62
.0%
56
.0%
47
.0%
37
.4%
56
.9%
82
.9%
73
.4%
71
.9%
67
.4%
64
.7%
52
.1% 6
8.5
%
88
.6%
79
.0%
80
.1%
73
.2%
77
.5%
66
.5% 77
.3%
Grade 3 Grade 4 Grade 5 Grade 6 Grade 7 Grade 8 Grades 3-8
2006 2007 2008 2009
Math 2006-2009Percentage of Female Black Students Scoring at Levels 3 and 4
34
The percentage of Female Black students scoring at Levels 3 & 4 showed positive growth for each grade level since 2006.

66
4
66
0
64
9
64
0
63
3
64
667
3
65
9
65
3
64
7
64
0 65
667
6
66
9
66
5
66
0
65
8
65
0
66
368
1
67
7
67
3
66
7
66
7
66
1
67
1
63
2
66
3
Grade 3 Grade 4 Grade 5 Grade 6 Grade 7 Grade 8 Grades 3-8
2006 2007 2008 2009
650
Female Black Mean Scale Scores
35
Math 2006-2009
Female Black students mean scale scores have shown consistent gains since 2006.

67
.9%
62
.5%
50
.9%
42
.8%
34
.0%
31
.5%
75
.9%
65
.4%
62
.0%
56
.0%
47
.0%
37
.4%
82
.9%
73
.4%
71
.9%
67
.4%
64
.7%
52
.1%
88
.6%
79
.0%
80
.1%
73
.2%
77
.5%
66
.5%
Grade 3 in 2009 Grade 4 in 2009 Grade 5 in 2009 Grade 6 in 2009 Grade 7 in 2009 Grade 8 in 2009 Grade 9 in 2009 Grade 10 in 2009 Grade 11 in 2009
2006 2007 2008 2009
3 3 54 565 63 4 73
Class of 2018 Class of 2017 Class of 2016
4 6 75 8
Grade 3 in 2006
Class of 2015
Grade 4 in 2006
Class of 2014
4
Grade 5 in 2006
Class of 2013
6 7 88 7
Grade 6 in 2006
Class of 2012
Grade 7 in 2006
Class of 2011
Grade 8 in 2006
Class of 2010
8
Percentage of Female Black Students at Levels 3 and 4
36Math 2006-2009
The percentage of Black female students scoring in Level 3 & 4 has increased as they moved through school over the 4 years. And all students are achieving at higher levels than Black females did in those same grades four years ago.

66
4
66
0
64
9
64
0
63
2
63
3
67
3
66
3
65
9
65
3
64
7
64
0
67
6
66
9
66
5
66
0
65
8
65
0
68
1
67
7
67
3
66
7
66
7
66
1
Grade 3 in 2009 Grade 4 in 2009 Grade 5 in 2009 Grade 6 in 2009 Grade 7 in 2009 Grade 8 in 2009 Grade 9 in 2009 Grade 10 in 2009 Grade 11 in 2009
2006 2007 2008 2009
3 3 54 565 63 4 73
Class of 2018 Class of 2017 Class of 2016
4 6 75 8
Grade 3 in 2006
Class of 2015
Grade 4 in 2006
Class of 2014
4
Grade 5 in 2006
Class of 2013
6 7 88 7
Grade 6 in 2006
Class of 2012
Grade 7 in 2006
Class of 2011
Grade 8 in 2006
Class of 2010
8
650
Female Black Students Mean Scale Scores
Math 2006-2009 37
The average scores of Black females also increased as they moved through school over the four years.

65
.1%
62
.3%
47
.8%
38
.3%
28
.4%
25
.2%
43
.9%
73
.1%
64
.4%
59
.0%
50
.3%
38
.9%
31
.4%
52
.4%
79
.7%
70
.4%
69
.2%
60
.5%
57
.2%
44
.6%
63
.4%
85
.5%
76
.4%
76
.4%
66
.4%
72
.5%
59
.2% 72
.6%
Grade 3 Grade 4 Grade 5 Grade 6 Grade 7 Grade 8 Grades 3-8
2006 2007 2008 2009
Math 2006-2009Percentage of Male Black Students Scoring at Levels 3 and 4
38
The percentage of Male Black students scoring at Levels 3 & 4 has increased significantly for each grade level since 2006.

66
0
65
8
64
5
63
5
62
6 64
167
0
65
7
64
7
63
9
63
4 65
167
3
66
6
66
3
65
5
65
1
64
3 65
867
8
67
4
67
0
66
2
66
3
65
5
66
7
62
6
66
2
Grade 3 Grade 4 Grade 5 Grade 6 Grade 7 Grade 8 Grades 3-8
2006 2007 2008 2009
650
Male Black Students Mean Scale Scores
39Math 2006-2009
Male Black students mean scale scores have shown gains since 2006.
65
.1%
62
.3%
47
.8%
38
.3%
28
.4%
25
.2%
73
.1%
64
.4%
59
.0%
50
.3%
38
.9%
31
.4%
79
.7%
70
.4%
69
.2%
60
.5%
57
.2%
44
.6%
85
.5%
76
.4%
76
.4%
66
.4%
72
.5%
59
.2%
Grade 3 in 2009 Grade 4 in 2009 Grade 5 in 2009 Grade 6 in 2009 Grade 7 in 2009 Grade 8 in 2009 Grade 9 in 2009 Grade 10 in 2009 Grade 11 in 2009
2006 2007 2008 2009
3 3 54 565 63 4 73
Class of 2018 Class of 2017 Class of 2016
4 6 75 8
Grade 3 in 2006
Class of 2015
Grade 4 in 2006
Class of 2014
4
Grade 5 in 2006
Class of 2013
6 7 88 7
Grade 6 in 2006
Class of 2012
Grade 7 in 2006
Class of 2011
Grade 8 in 2006
Class of 2010
8
Percentage of Male Black Students at Levels 3 and 4
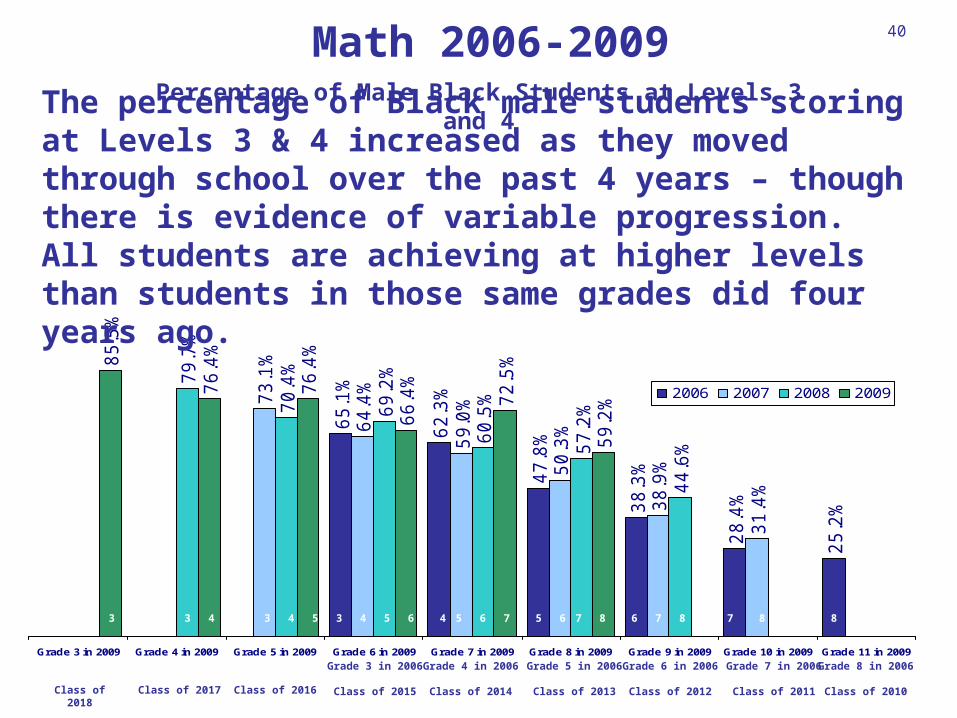
40Math 2006-2009
The percentage of Black male students scoring at Levels 3 & 4 increased as they moved through school over the past 4 years – though there is evidence of variable progression. All students are achieving at higher levels than students in those same grades did four years ago.

66
0
65
8
64
5
63
5
62
6
62
6
67
0
66
2
65
7
64
7
63
9
63
4
67
3
66
6
66
3
65
5
65
1
64
3
67
8
67
4
67
0
66
2
66
3
65
5
Grade 3 in 2009 Grade 4 in 2009 Grade 5 in 2009 Grade 6 in 2009 Grade 7 in 2009 Grade 8 in 2009 Grade 9 in 2009 Grade 10 in 2009 Grade 11 in 2009
2006 2007 2008 2009
3 3 54 565 63 4 73
Class of 2018 Class of 2017 Class of 2016
4 6 75 8
Grade 3 in 2006
Class of 2015
Grade 4 in 2006
Class of 2014
4
Grade 5 in 2006
Class of 2013
6 7 88 7
Grade 6 in 2006
Class of 2012
Grade 7 in 2006
Class of 2011
Grade 8 in 2006
Class of 2010
8
650
Male Black Students Mean Scale Scores
Math 2006-2009 41
The average scores of Black males also increased- with variation in grades 5, 6, & 7- as they moved from one grade to the next through the four years of school.

71
.7%
65
.5%
55
.6%
44
.8%
38
.1%
33
.8% 5
1.5
%
78
.9%
69
.5%
65
.9%
59
.3%
52
.0%
41
.7%
61
.2%
86
.0%
77
.0%
75
.7%
69
.3%
68
.6%
56
.6% 7
2.2
%90
.5%
82
.4%
83
.8%
75
.8%
79
.7%
70
.8%
80
.5%
Grade 3 Grade 4 Grade 5 Grade 6 Grade 7 Grade 8 Grades 3-8
2006 2007 2008 2009
Math 2006-2009Percentage of Female Hispanic Students Scoring at Levels 3 and 4
42
The percentage of Female Hispanic students scoring at Levels 3 & 4 has shown strong gains for each grade level since 2006.

66
7
66
2
65
3
64
2
63
5 64
967
6
66
3
65
6
65
0
64
3 65
967
9
67
2
66
9
66
2
66
1
65
4
66
668
4
68
0
67
7
67
0
66
9
66
4
67
4
63
6
66
7
Grade 3 Grade 4 Grade 5 Grade 6 Grade 7 Grade 8 Grades 3-8
2006 2007 2008 2009
650
Female Hispanic Students Mean Scale Scores
43Math 2006-2009
Female Hispanic students mean scale scores increased since 2006.

71
.7%
65
.5%
55
.6%
44
.8%
38
.1%
33
.8%
78
.9%
69
.5%
65
.9%
59
.3%
52
.0%
41
.7%
86
.0%
77
.0%
75
.7%
69
.3%
68
.6%
56
.6%
90
.5%
82
.4%
83
.8%
75
.8%
79
.7%
70
.8%
Grade 3 in 2009 Grade 4 in 2009 Grade 5 in 2009 Grade 6 in 2009 Grade 7 in 2009 Grade 8 in 2009 Grade 9 in 2009 Grade 10 in 2009 Grade 11 in 2009
2006 2007 2008 2009
3 3 54 565 63 4 73
Class of 2018 Class of 2017 Class of 2016
4 6 75 8
Grade 3 in 2006
Class of 2015
Grade 4 in 2006
Class of 2014
4
Grade 5 in 2006
Class of 2013
6 7 88 7
Grade 6 in 2006
Class of 2012
Grade 7 in 2006
Class of 2011
Grade 8 in 2006
Class of 2010
8
Percentage of Female Hispanic Students at Levels 3 and 4
44
Math 2006-2009
The percentage of Hispanic female students scoring at Levels 3 & 4 increased as they moved through school over the 4 years. And all students are achieving at higher levels than Hispanic female students did in those same grades 4 years ago.

66
7
66
2
65
3
64
2
63
6
63
5
67
6
66
7
66
3
65
6
65
4
64
3
67
9
67
2
66
9
66
2
66
1
65
0
68
4
68
0
67
7
67
0
66
9
66
4
Grade 3 in 2009 Grade 4 in 2009 Grade 5 in 2009 Grade 6 in 2009 Grade 7 in 2009 Grade 8 in 2009 Grade 9 in 2009 Grade 10 in 2009 Grade 11 in 2009
2006 2007 2008 2009
3 3 54 565 63 4 73
Class of 2018 Class of 2017 Class of 2016
4 6 75 8
Grade 3 in 2006
Class of 2015
Grade 4 in 2006
Class of 2014
4
Grade 5 in 2006
Class of 2013
6 7 88 7
Grade 6 in 2006
Class of 2012
Grade 7 in 2006
Class of 2011
Grade 8 in 2006
Class of 2010
8
650
Female Hispanic Students Mean Scale Scores
Math 2006-2009 45
The average scores of Hispanic females are increasing. All students are achieving at higher levels than Hispanic females did in those same grades four years ago.

71
.4%
67
.8%
56
.7%
45
.6%
36
.4%
32
.3%
51
.7%
78
.1%
70
.9%
65
.5%
57
.5%
48
.7%
39
.1%
59
.9%
84
.3%
76
.6%
74
.9%
66
.4%
64
.5%
53
.8% 7
0.0
%
89
.3%
81
.7%
82
.5%
71
.8%
77
.6%
67
.9%
78
.5%
Grade 3 Grade 4 Grade 5 Grade 6 Grade 7 Grade 8 Grades 3-8
2006 2007 2008 2009
Math 2006-2009Percentage of Male Hispanic Students Scoring at Levels 3 and 4
46
The percentage of Male Hispanic students scoring at Levels 3 & 4 has increased significantly for each grade level since 2006.

66
7
66
3
65
3
64
2
63
2 64
867
5
66
2
65
4
64
7
64
0 65
867
9
67
2
66
9
66
0
65
8
65
1 66
568
3
68
0
67
7
66
7
66
8
66
2
67
3
63
3
66
8
Grade 3 Grade 4 Grade 5 Grade 6 Grade 7 Grade 8 Grades 3-8
2006 2007 2008 2009
650
Male Hispanic Students Mean Scale Scores
47Math 2006-2009
Male Hispanic students mean scale scores increased consistently across grade levels since 2006.

71
.4%
67
.8%
56
.7%
45
.6%
36
.4%
32
.3%
78
.1%
70
.9%
65
.5%
57
.5%
48
.7%
39
.1%
84
.3%
76
.6%
74
.9%
66
.4%
64
.5%
53
.8%
89
.3%
81
.7%
82
.5%
71
.8%
77
.6%
67
.9%
Grade 3 in 2009 Grade 4 in 2009 Grade 5 in 2009 Grade 6 in 2009 Grade 7 in 2009 Grade 8 in 2009 Grade 9 in 2009 Grade 10 in 2009 Grade 11 in 2009
2006 2007 2008 2009
3 3 54 565 63 4 73
Class of 2018 Class of 2017 Class of 2016
4 6 75 8
Grade 3 in 2006
Class of 2015
Grade 4 in 2006
Class of 2014
4
Grade 5 in 2006
Class of 2013
6 7 88 7
Grade 6 in 2006
Class of 2012
Grade 7 in 2006
Class of 2011
Grade 8 in 2006
Class of 2010
8
Percentage of Male Hispanic Students at Levels 3 and 4
48Math 2006-2009
The percentage of Hispanic male students scoring at Levels 3 & 4 increased as they moved through school over the 4 years, except for this year’s 6th graders. All students are achieving at higher levels than Hispanic students did in those same grades four years ago.

66
7
66
3
65
3
64
2
63
3
63
2
67
5
66
8
66
2
65
4
64
7
64
0
67
9
67
2
66
9
66
0
65
8
65
1
68
3
68
0
67
7
66
7
66
8
66
2
Grade 3 in 2009 Grade 4 in 2009 Grade 5 in 2009 Grade 6 in 2009 Grade 7 in 2009 Grade 8 in 2009 Grade 9 in 2009 Grade 10 in 2009 Grade 11 in 2009
2006 2007 2008 2009
3 3 54 565 63 4 73
Class of 2018 Class of 2017 Class of 2016
4 6 75 8
Grade 3 in 2006
Class of 2015
Grade 4 in 2006
Class of 2014
4
Grade 5 in 2006
Class of 2013
6 7 88 7
Grade 6 in 2006
Class of 2012
Grade 7 in 2006
Class of 2011
Grade 8 in 2006
Class of 2010
8
650
Male Hispanic Students Mean Scale Scores
Math 2006-2009 49
The average scores of Hispanic males also increased as they moved through school over the 4 years – except for this year’s 6th graders.

70
.6%
69
.7%
53
.8%
50
.0%
44
.8%
44
.7% 54
.8%
76
.5%
70
.5%
69
.2%
60
.2%
59
.7%
49
.5% 6
3.8
%
84
.8%
77
.0%
72
.7%
75
.5%
73
.3%
65
.7%
74
.8%9
0.0
%
84
.2%
86
.5%
76
.4%
84
.2%
78
.2%
83
.3%
Grade 3 Grade 4 Grade 5 Grade 6 Grade 7 Grade 8 Grades 3-8
2006 2007 2008 2009
Math 2006-2009Percentage of Female American Indian/ Alaskan Native Students
Scoring at Levels 3 and 4
50
The percentage of Female American Indian/ Alaskan Native students scoring at Levels 3 & 4 has grown over the past four years.

66
4
66
5
65
2
64
4
64
2
65
167
3
66
3
65
6
65
3
65
1
66
068
0
67
2
66
7
66
7
66
5
65
8
66
868
3
68
1
67
8
67
1
67
3
66
8
67
6
64
266
5
Grade 3 Grade 4 Grade 5 Grade 6 Grade 7 Grade 8 Grades 3-8
2006 2007 2008 2009
650
Female American Indian/ Alaskan Native Mean Scale Scores
51
Math 2006-2009
Since 2006, Female American Indian/ Alaskan Native students mean scale scores increased across grade levels.

70
.6%
69
.7%
53
.8%
50
.0%
44
.8%
44
.7%
76
.5%
70
.5%
69
.2%
60
.2%
59
.7%
49
.5%
84
.8%
77
.0%
72
.7%
75
.5%
73
.3%
65
.7%
90
.0%
84
.2%
86
.5%
76
.4%
84
.2%
78
.2%
Grade 3 in 2009 Grade 4 in 2009 Grade 5 in 2009 Grade 6 in 2009 Grade 7 in 2009 Grade 8 in 2009 Grade 9 in 2009 Grade 10 in 2009 Grade 11 in 2009
2006 2007 2008 2009
3 3 54 565 63 4 73
Class of 2018 Class of 2017 Class of 2016
4 6 75 8
Grade 3 in 2006
Class of 2015
Grade 4 in 2006
Class of 2014
4
Grade 5 in 2006
Class of 2013
6 7 88 7
Grade 6 in 2006
Class of 2012
Grade 7 in 2006
Class of 2011
Grade 8 in 2006
Class of 2010
8
Percentage of Female American Indian/ Alaskan Native Students at Levels 3 and 4
52
Math 2006-2009
The percentage of Female American Indian/ Alaskan Native students scoring at Levels 3 & 4 increased as they moved through school over the four years.

66
4
66
5
65
2
64
4
64
2
64
2
67
3
66
5
66
3
65
6
65
3
65
1
68
0
67
2
66
7
66
7
66
5
65
8
68
3
68
1
67
8
67
1
67
3
66
8
Grade 3 in 2009 Grade 4 in 2009 Grade 5 in 2009 Grade 6 in 2009 Grade 7 in 2009 Grade 8 in 2009 Grade 9 in 2009 Grade 10 in 2009 Grade 11 in 2009
2006 2007 2008 2009
3 3 54 565 63 4 73
Class of 2018 Class of 2017 Class of 2016
4 6 75 8
Grade 3 in 2006
Class of 2015
Grade 4 in 2006
Class of 2014
4
Grade 5 in 2006
Class of 2013
6 7 88 7
Grade 6 in 2006
Class of 2012
Grade 7 in 2006
Class of 2011
Grade 8 in 2006
Class of 2010
8
650*
Female American Indian/ Alaskan Native Students Mean Scale Scores
Math 2006-2009 53
Female American Indian/ Alaskan Native students mean scale scores have shown progression as students move from grade to grade.
69
.1%
69
.2%
56
.8%
45
.1%
41
.8%
38
.2% 5
2.9
%
81
.7%
68
.7%
60
.6%
58
.3%
51
.3%
41
.4%
59
.9%
85
.6%
79
.1%
76
.6%
66
.5%
68
.1%
55
.5% 7
1.3
%89
.7%
81
.5%
83
.6%
74
.3%
81
.6%
70
.2%
79
.9%
Grade 3 Grade 4 Grade 5 Grade 6 Grade 7 Grade 8 Grades 3-8
2006 2007 2008 2009
Math 2006-2009Percentage of Male American Indian/ Alaskan Native
Students Scoring at Levels 3 and 4
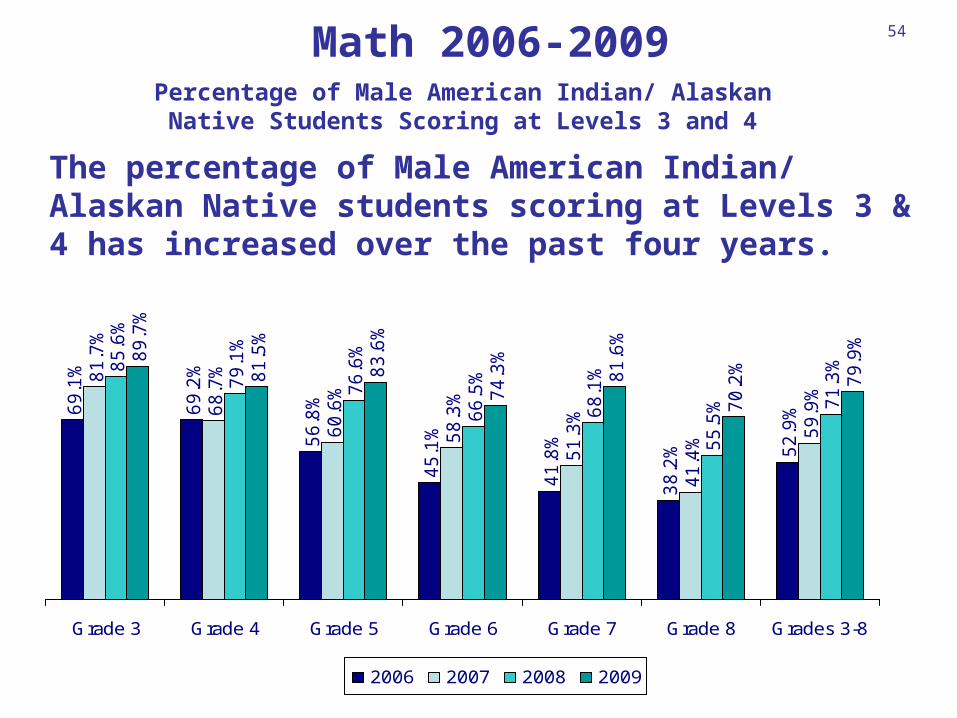
54
The percentage of Male American Indian/ Alaskan Native students scoring at Levels 3 & 4 has increased over the past four years.

66
3
66
3
65
5
64
0
63
8
64
967
4
66
0
65
6
64
7
64
4
65
767
7
67
4
66
7
66
1
66
2
65
1 66
568
4
67
8
67
7
66
7
67
1
66
3
67
3
63
6
66
7
Grade 3 Grade 4 Grade 5 Grade 6 Grade 7 Grade 8 Grades 3-8
2006 2007 2008 2009
650
Male American Indian/ Alaskan Native Students Mean Scale Scores
55
Math 2006-2009
Since 2006, Male American Indian/ Alaskan Native students mean scale scores rose across grade levels.
69
.1%
69
.2%
56
.8%
45
.1%
41
.8%
38
.2%
81
.7%
68
.7%
60
.6%
58
.3%
51
.3%
41
.4%
85
.6%
79
.1%
76
.6%
66
.5%
68
.1%
55
.5%
89
.7%
81
.5%
83
.6%
74
.3%
81
.6%
70
.2%
Grade 3 in 2009 Grade 4 in 2009 Grade 5 in 2009 Grade 6 in 2009 Grade 7 in 2009 Grade 8 in 2009 Grade 9 in 2009 Grade 10 in 2009 Grade 11 in 2009
2006 2007 2008 2009
3 3 54 565 63 4 73
Class of 2018 Class of 2017 Class of 2016
4 6 75 8
Grade 3 in 2006
Class of 2015
Grade 4 in 2006
Class of 2014
4
Grade 5 in 2006
Class of 2013
6 7 88 7
Grade 6 in 2006
Class of 2012
Grade 7 in 2006
Class of 2011
Grade 8 in 2006
Class of 2010
8
Percentage of Male American Indian/ Alaskan Native Students at Levels 3 and 4
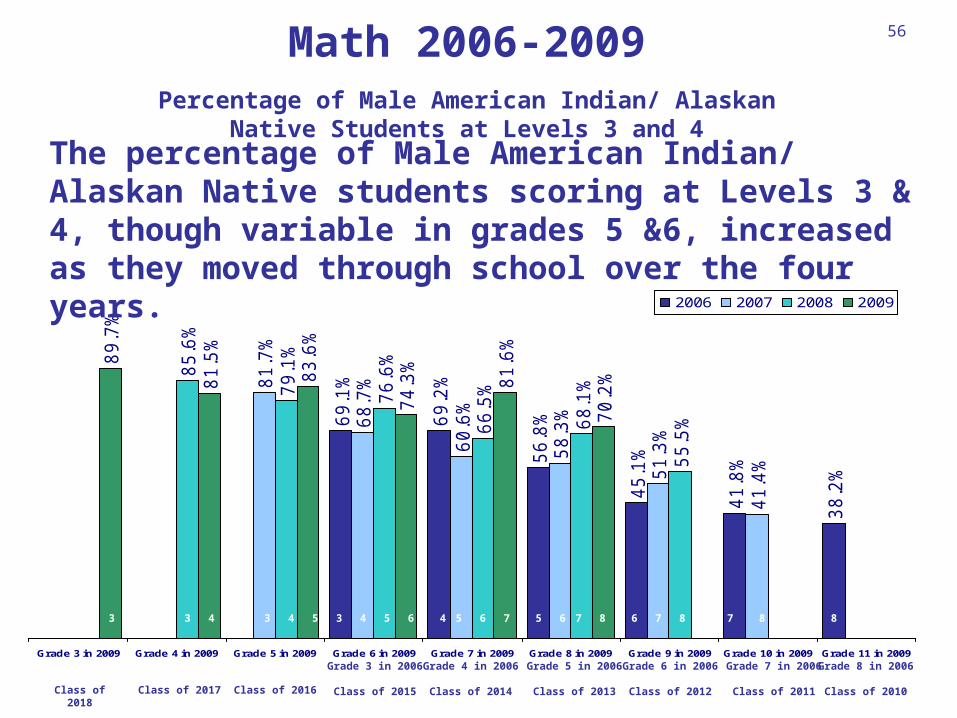
56Math 2006-2009
The percentage of Male American Indian/ Alaskan Native students scoring at Levels 3 & 4, though variable in grades 5 &6, increased as they moved through school over the four years.

66
3
66
3
65
5
64
0
63
6
63
8
67
4
66
7
66
0
65
6
64
7
64
4
67
7
67
4
66
7
66
1
66
2
65
1
68
4
67
8
67
7
66
7
67
1
66
3
Grade 3 in 2009 Grade 4 in 2009 Grade 5 in 2009 Grade 6 in 2009 Grade 7 in 2009 Grade 8 in 2009 Grade 9 in 2009 Grade 10 in 2009 Grade 11 in 2009
2006 2007 2008 2009
3 3 54 565 63 4 73
Class of 2018 Class of 2017 Class of 2016
4 6 75 8
Grade 3 in 2006
Class of 2015
Grade 4 in 2006
Class of 2014
4
Grade 5 in 2006
Class of 2013
6 7 88 7
Grade 6 in 2006
Class of 2012
Grade 7 in 2006
Class of 2011
Grade 8 in 2006
Class of 2010
8
650
Male American Indian/ Alaskan Native Students Mean Scale Scores
Math 2006-2009 57
Male American Indian/ Alaskan Native students mean scale scores have increased, except for plateaus in grades 5 &6, as students move from grade to grade.

88
.0%
85
.8%
77
.1%
70
.4%
69
.5%
69
.4%
76
.4%90
.9%
87
.2%
83
.8%
80
.3%
80
.4%
73
.3%
82
.5%94
.4%
89
.9%
89
.6%
88
.9%
90
.0%
82
.4%
89
.1%
96
.2%
91
.8%
93
.2%
91
.0%
94
.9%
90
.6%
92
.9%
Grade 3 Grade 4 Grade 5 Grade 6 Grade 7 Grade 8 Grades 3-8
2006 2007 2008 2009
Math 2006-2009Percentage of Female White Students Scoring at Levels 3 and 4
58
The percentage of Female White students scoring at Levels 3 & 4 has increased over the past four years.

68
5
68
4
67
3
66
4
66
4
67
269
1
68
0
67
6
67
4
66
9
67
969
5
69
0
68
6
68
3
68
6
67
7
68
6
69
8
69
5
69
3
68
8
68
9
68
5
69
1
66
368
7
Grade 3 Grade 4 Grade 5 Grade 6 Grade 7 Grade 8 Grades 3-8
2006 2007 2008 2009
650
Female White Students Mean Scale Scores
59Math 2006-2009
Female White students mean scale scores showed progression across grade levels over the past four years.
88
.0%
85
.8%
77
.1%
70
.4%
69
.5%
69
.4%
90
.9%
87
.2%
83
.8%
80
.3%
80
.4%
73
.3%
94
.4%
89
.9%
89
.6%
88
.9%
90
.0%
82
.4%96
.2%
91
.8%
93
.2%
91
.0%
94
.9%
90
.6%
Grade 3 in 2009 Grade 4 in 2009 Grade 5 in 2009 Grade 6 in 2009 Grade 7 in 2009 Grade 8 in 2009 Grade 9 in 2009 Grade 10 in 2009 Grade 11 in 2009
2006 2007 2008 2009
3 3 54 565 63 4 73
Class of 2018 Class of 2017 Class of 2016
4 6 75 8
Grade 3 in 2006
Class of 2015
Grade 4 in 2006
Class of 2014
4
Grade 5 in 2006
Class of 2013
6 7 88 7
Grade 6 in 2006
Class of 2012
Grade 7 in 2006
Class of 2011
Grade 8 in 2006
Class of 2010
8
Percentage of Female White Students at Levels 3 and 4
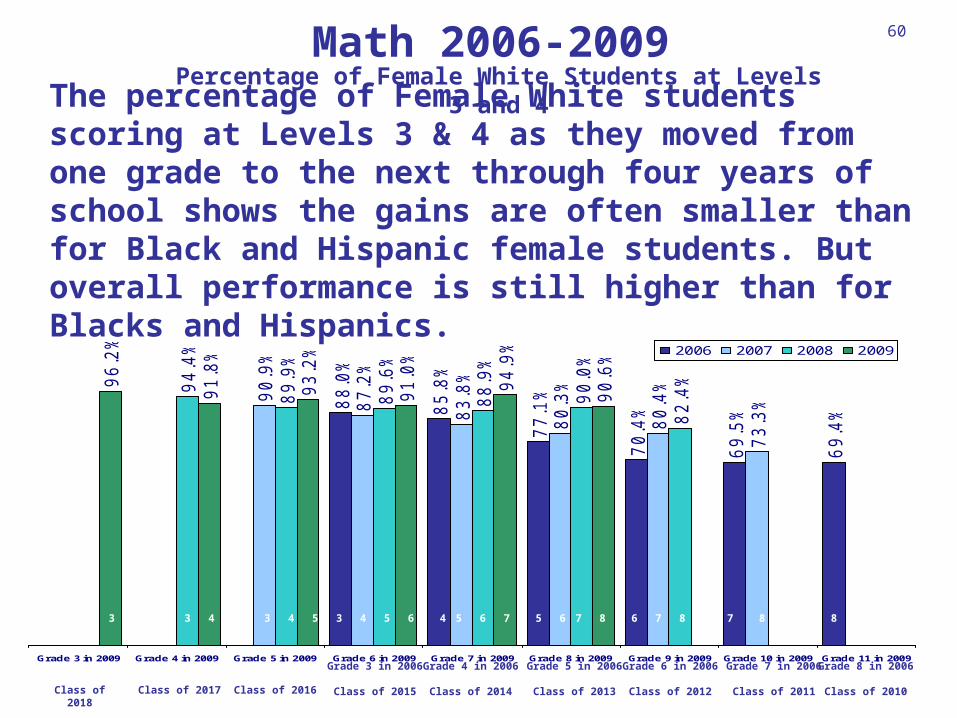
60Math 2006-2009
The percentage of Female White students scoring at Levels 3 & 4 as they moved from one grade to the next through four years of school shows the gains are often smaller than for Black and Hispanic female students. But overall performance is still higher than for Blacks and Hispanics.
68
5
68
4
67
3
66
4
66
3
66
4
69
1
68
7
68
0
67
6
67
4
66
9
69
5
69
0
68
6
68
3
68
6
67
7
69
8
69
5
69
3
68
8
68
9
68
5
Grade 3 in 2009 Grade 4 in 2009 Grade 5 in 2009 Grade 6 in 2009 Grade 7 in 2009 Grade 8 in 2009 Grade 9 in 2009 Grade 10 in 2009 Grade 11 in 2009
2006 2007 2008 2009
3 3 54 565 63 4 73
Class of 2018 Class of 2017 Class of 2016
4 6 75 8
Grade 3 in 2006
Class of 2015
Grade 4 in 2006
Class of 2014
4
Grade 5 in 2006
Class of 2013
6 7 88 7
Grade 6 in 2006
Class of 2012
Grade 7 in 2006
Class of 2011
Grade 8 in 2006
Class of 2010
8
650
Female White Students Mean Scale Scores
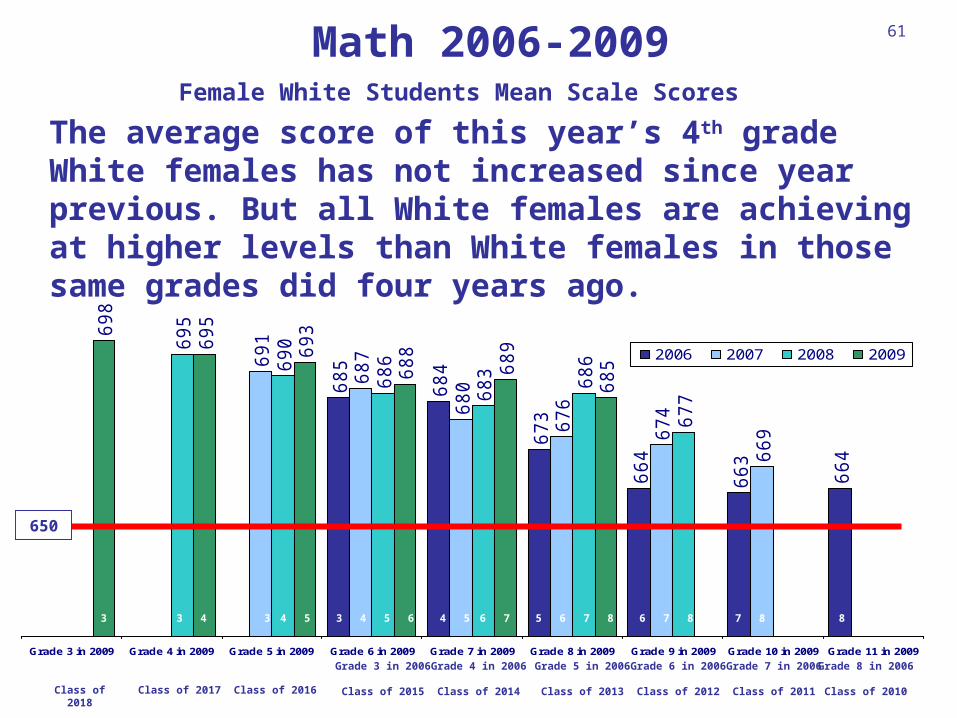
Math 2006-2009 61
The average score of this year’s 4th grade White females has not increased since year previous. But all White females are achieving at higher levels than White females in those same grades did four years ago.

88
.1%
86
.7%
78
.8%
71
.2%
68
.7%
66
.9%
76
.3%90
.8%
88
.1%
83
.8%
80
.3%
77
.3%
70
.4%
81
.5%93
.9%
89
.5%
89
.6%
86
.5%
87
.5%
79
.4%
87
.6%
95
.4%
91
.6%
92
.2%
89
.2%
93
.4%
87
.8%
91
.6%
Grade 3 Grade 4 Grade 5 Grade 6 Grade 7 Grade 8 Grades 3-8
2006 2007 2008 2009
Math 2006-2009Percentage of Male White Students Scoring at Levels 3 and 4
62
The percentage of Male White students scoring at Levels 3 & 4 has shown improvement over the past four years.

68
5
68
7
67
5
66
5
66
2
67
269
1
68
1
67
6
67
2
66
6
67
969
4
69
1
68
7
68
2
68
4
67
4
68
5
69
7
69
5
69
2
68
6
68
8
68
1
69
0
66
268
9
Grade 3 Grade 4 Grade 5 Grade 6 Grade 7 Grade 8 Grades 3-8
2006 2007 2008 2009
650
Male White Students Mean Scale Scores
63Math 2006-2009
Male White students mean scale scores increased across grade levels over the past four years.
88
.1%
86
.7%
78
.8%
71
.2%
68
.7%
66
.9%
90
.8%
88
.1%
83
.8%
80
.3%
77
.3%
70
.4%
93
.9%
89
.5%
89
.6%
86
.5%
87
.5%
79
.4%9
5.4
%
91
.6%
92
.2%
89
.2%
93
.4%
87
.8%
Grade 3 in 2009 Grade 4 in 2009 Grade 5 in 2009 Grade 6 in 2009 Grade 7 in 2009 Grade 8 in 2009 Grade 9 in 2009 Grade 10 in 2009 Grade 11 in 2009
2006 2007 2008 2009
3 3 54 565 63 4 73
Class of 2018 Class of 2017 Class of 2016
4 6 75 8
Grade 3 in 2006
Class of 2015
Grade 4 in 2006
Class of 2014
4
Grade 5 in 2006
Class of 2013
6 7 88 7
Grade 6 in 2006
Class of 2012
Grade 7 in 2006
Class of 2011
Grade 8 in 2006
Class of 2010
8
Percentage of Male White Students at Levels 3 and 4
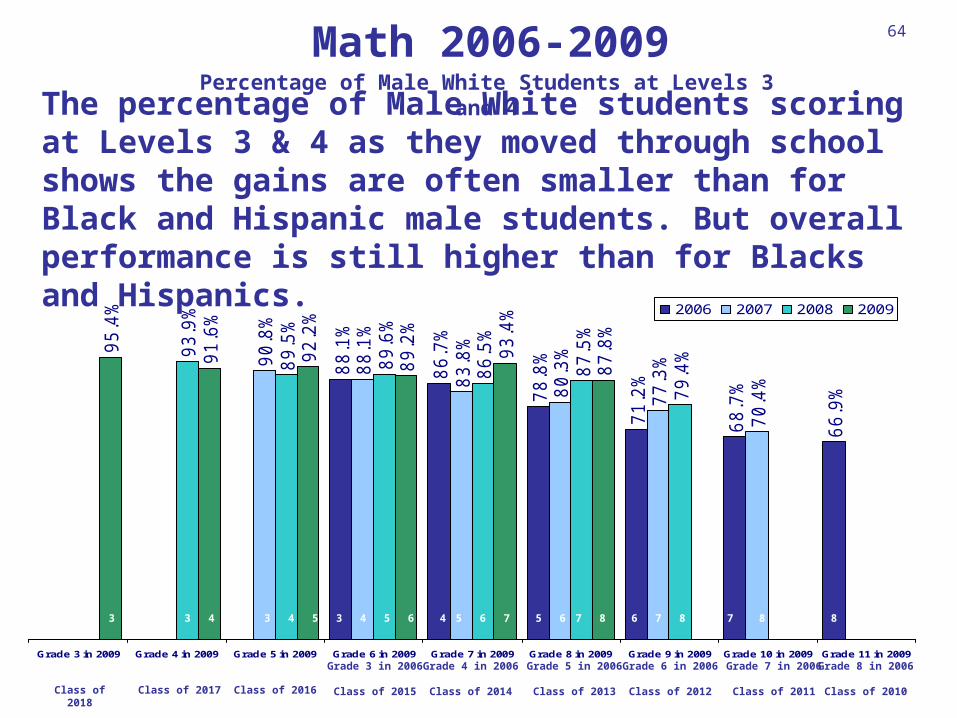
64Math 2006-2009
The percentage of Male White students scoring at Levels 3 & 4 as they moved through school shows the gains are often smaller than for Black and Hispanic male students. But overall performance is still higher than for Blacks and Hispanics.

68
5
68
7
67
5
66
5
66
2
66
2
69
1
68
9
68
1
67
6
67
2
66
6
69
4
69
1
68
7
68
2
68
4
67
4
69
7
69
5
69
2
68
6
68
8
68
1
Grade 3 in 2009 Grade 4 in 2009 Grade 5 in 2009 Grade 6 in 2009 Grade 7 in 2009 Grade 8 in 2009 Grade 9 in 2009 Grade 10 in 2009 Grade 11 in 2009
2006 2007 2008 2009
3 3 54 565 63 4 73
Class of 2018 Class of 2017 Class of 2016
4 6 75 8
Grade 3 in 2006
Class of 2015
Grade 4 in 2006
Class of 2014
4
Grade 5 in 2006
Class of 2013
6 7 88 7
Grade 6 in 2006
Class of 2012
Grade 7 in 2006
Class of 2011
Grade 8 in 2006
Class of 2010
8
650
Male White Students Mean Scale Scores
Math 2006-2009 65
The average score of this year’s 6th grade White male students has not improved as they moved through school over the 4 years. The average score of this year’s 4th and 5th graders has improved very little. But all students are achieving at higher levels than students in those grades did 4 years ago.

50
.0%
44
.8%
31
.6%
21
.6%
18
.0%
17
.1%
30
.2%
57
.1%
47
.2%
41
.7%
31
.9%
26
.8%
20
.7% 37
.2%
66
.6%
53
.4%
52
.8%
42
.4%
42
.9%
31
.0% 47
.8%
74
.2%
60
.7%
62
.4%
49
.7%
59
.0%
46
.2%
58
.4%
Grade 3 Grade 4 Grade 5 Grade 6 Grade 7 Grade 8 Grades 3-8
2006 2007 2008 2009
Math 2006-2009Percentage of at Levels 3 and 4
66
The percentage of Students with Disabilities scoring at Levels 3 & 4 has increased over the past four years.

64
7
64
0
63
0
61
7
61
3 62
6
65
5
64
0
62
9
62
6
62
1 63
666
1
64
9
64
8
63
7
63
9
62
9 64
466
6
65
7
65
7
64
7
65
3
64
3 65
4
61
2
64
5
Grade 3 Grade 4 Grade 5 Grade 6 Grade 7 Grade 8 Grades 3-8
2006 2007 2008 2009
650
Students with Disabilities Mean Scale Scores
67Math 2006-2009
Students with Disabilities mean scale scores have shown steady increase across grades since 2006.

23
.7%
28
.8% 35
.9% 44
.4%
42
.1%
44
.4%
36
.8%
17
.5% 24
.8%
23
.7% 3
3.5
%
28
.6%
40
.2%
28
.2%
11
.0% 2
0.4
%
16
.3% 23
.9%
17
.5%
29
.5%
19
.9%
5.2
%
16
.7%
9.8
% 16
.3%
6.7
%
16
.2%
11
.9%
Grade 3 Grade 4 Grade 5 Grade 6 Grade 7 Grade 8 Grades 3-8
2006 2007 2008 2009
Percentage of Students with Disabilities at Level 1
Math 2006-200968
The percentage of Students with Disabilities scoring at Level 1 has decreased significantly over the past four years.

16
.4%
22
.7% 29
.4% 4
0.4
%
39
.1%
40
.4%
29
.8%
10
.2% 18
.0%
20
.4% 3
0.6
%
27
.7% 35
.3%
22
.2%
5.2
% 12
.2%
13
.1%
18
.9%
15
.6%
21
.1%
13
.3%
2.5
% 9.5
%
7.2
% 13
.9%
6.5
% 11
.2%
8.0
%
Grade 3 Grade 4 Grade 5 Grade 6 Grade 7 Grade 8 Grades 3-8
2006 2007 2008 2009
Percentage of English Language Learners (ELL) at Level 1
69
Math 2006-2009
Similarly, the percentage of ELL Students scoring at Level 1 has declined over the past four years.

58
.5%
49
.5%
36
.7%
25
.2%
20
.6%
21
.9% 37
.8%
68
.7%
53
.8%
45
.4%
35
.2%
27
.5%
25
.6% 4
5.7
%
78
.5%
64
.1%
58
.0%
47
.7%
44
.6%
41
.2% 58
.4%
84
.4%
71
.3%
69
.4%
53
.3%
58
.1%
52
.7% 67
.1%
Grade 3 Grade 4 Grade 5 Grade 6 Grade 7 Grade 8 Grades 3-8
2006 2007 2008 2009
Math 2006-2009Percentage of ELL Students at Levels 3 and 4
70
The percentage of ELL Students scoring at Levels 3 & 4 has shown improvement over the past four years, especially for the lower grades.

65
5
64
7
63
7
62
3
62
1 63
6
66
5
64
5
63
3
62
8
62
7 64
4
67
1
65
9
65
3
64
3
64
2
64
0 65
467
5
66
7
66
3
65
1
65
3
65
0 66
2
61
7
65
2
Grade 3 Grade 4 Grade 5 Grade 6 Grade 7 Grade 8 Grades 3-8
2006 2007 2008 2009
650
ELL Students Mean Scale Scores
71Math 2006-2009
ELL Students mean scale scores increased steadily across grades since 2006.