2009 fowler et al modeling the energy potential of biomass
DESCRIPTION
Modeling the energy potential of biomassTRANSCRIPT
i n t e r n a t i o n a l j o u r n a l o f h y d r o g e n e n e r g y 3 4 ( 2 0 0 9 ) 7 0 2 7 – 7 0 4 0
Avai lab le a t www.sc iencedi rec t .com
j ourna l homepage : www.e lsev ier . com/ loca te /he
Modeling the energy potential of biomass – H2RES
Pat Fowlera,*, Goran Krajacicb, Dra�zen Loncarb, Neven Duicb
aGENIVAR, 15 Fitzgerald Road, Suite 100, Ottawa, Ontario K2H 9G1, CanadabFaculty of Mechanical Engineering and Naval Architecture, University of Zagreb, Ivana Lucica 5, Zagreb 10002, Croatia
a r t i c l e i n f o
Article history:
Received 20 November 2007
Received in revised form
10 September 2008
Accepted 10 December 2008
Available online 6 February 2009
Keywords:
Renewable energy
Biomass
Energy planning
H2RES
* Corresponding author. Tel.: þ1 613 222 429E-mail addresses: [email protected]
0360-3199/$ – see front matter ª 2008 Interndoi:10.1016/j.ijhydene.2008.12.055
a b s t r a c t
Modeling biomass as a renewable energy source poses many challenges with respect to
feedstock variability, which are difficult to account for. It is found that at the preliminary
stages of energy planning, heating value and moisture content of the feedstock are the
most important factors. In addition, the effects of harvesting, transportation and storage
are found to be significant even though they are often overlooked. Using the gathered
information a biomass module for energy planning is created and integrated to H2RES,
a renewable energy planning program. Using this excel based software, a case study for
a wood processing factory is performed, using the waste wood as feedstock. Comparing
various scenarios, it is concluded that using a combination of solid oxide fuel cells, solar
panels and steam turbines can satisfy the factories energy requirements with excess sold
to the grid.
ª 2008 International Association for Hydrogen Energy. Published by Elsevier Ltd. All rights
reserved.
1. Introduction further. This makes energy planning from biomass
Biomass is an indispensable and often overlooked resource
when assessing potential renewable energy sources. Its main
advantage, compared to other renewable sources, is the ability
to store feedstock and use it when required, like traditional
fossil fuels. Its low density however, goes against the
economics of the whole process. Nevertheless, about
3000 EJ/year of energy is stored in land biomass. With world
primary energy consumption of 451 EJ/year (2002), this means
over six times more energy is stored in biomass than is
currently being consumed [2].
In addition to the density, biomass feedstock is faced with
many other challenges, which result from external factors.
Energy, chemical composition, moisture and production
quantities vary yearly, seasonally and even daily (in the case
of municipal solid waste (MSW), for example). These varia-
tions in the feedstock consequently affect the energy
conversion process with issues such as; fouling, corrosion,
flame instabilities, etc. These hinder the overall process even
4; fax: þ1 613 829 8299.(P. Fowler), goran.krajacicational Association for H
challenging.
To further complicate things, little to no consideration is
given to the influence of harvesting, transportation and
storage on the biomass feedstock. This is understandable
when bearing in mind that a plethora of factors need to be
taken into account. However, the conclusion is that every
potential site needs to consider this, and may do so with
access to more accurate, local information on the topic.
The purpose of this paper is to gauge the biomass energy
potential for a typical Croatian wood furniture factory using
the H2RES renewable energy planning software. The meth-
odology of this paper assesses the pertinent criteria when
modeling the energy potential of biomass. The information is
used to develop and integrate a biomass module for the H2RES
software; consequently there is a focus on biomass to
hydrogen conversion. The results are tabulated using the
biomass module for the case study. They demonstrate the
value of biomass as a renewable energy source and validate
the model.
@fsb.hr (G. Krajacic), [email protected] (N. Duic).ydrogen Energy. Published by Elsevier Ltd. All rights reserved.

i n t e r n a t i o n a l j o u r n a l o f h y d r o g e n e n e r g y 3 4 ( 2 0 0 9 ) 7 0 2 7 – 7 0 4 07028
2. Methodology
2.1. Biomass feedstock
Any type of biomass can be converted into energy. Due to the
broad base of potential sources however, the main charac-
teristics which affect the energy potential of the feedstock
need to be compiled and highlighted. First, these sources need
to be identified. Then important features can be minimized.
2.1.1. TypesBiomass can be categorized into three different groups; agri-
cultural wastes, energy crops and refuse.
2.1.1.1. Agricultural waste. Agricultural waste is of interest
because it’s exactly that, waste. In some cases it’s sown back
into the ground or used as animal bedding. In others it’s
burned or landfilled, and hence a valuable source of energy is
being discarded.
Agricultural waste can be divided into wood waste,
manure, temperate and tropical crop wastes. Wood waste is
an important source of energy since it is often ignored; mill
wastes, trimmings and forest residues are commonly left to
rot or go to landfill. Manure is produced from farm animals
and is a very good energy source due to its high volatility.
Collecting it also helps reduce the green house effect since it
captures the otherwise released methane.
Temperate and tropical crop residues vary mainly in the
quantity of waste they produce. Most temperate crops such
as wheat and corn are of the C3 class, which is indicative of
the important role that molecules with three carbon atoms
play. Plants need both CO2 and sun for photosynthesis to
occur. When sun is plentiful and there’s a lack of CO2
plants can be damaged. In this case C3 plants use a process
called photorespiration which is the reverse of photosyn-
thesis. This is a safety mechanism to protect the plant, but
no useful energy is produced and hence the plant does not
grow. Tropical crops such as sugar cane and rice, on the
other hand, are generally of the C4 group, which store CO2
for times when it is lacking. This results in faster growing,
larger plants.
The main problem with agricultural waste is collection.
Since it is waste, it’s produced in a dispersed fashion. More-
over, the density is low which increases transportation costs
and further puts into question the economics of such an
energy source. Most beneficial biomass to energy facilities are
placed on site where the waste is produced. Such as large
farms, saw mills, sugar refineries or olive oil pressing facto-
ries, as examples. Energy from manure is also more
economical for animals in closed spaces such as dairy cows
and pigs where the waste is easily collected.
2.1.1.2. Energy crops. Energy crops are grown for the sole
purpose of being converted to energy. The interest is inter-
twined with mitigating greenhouse gas emissions. Energy
crops are considered CO2-neutral, when they are harvested
sustainably, since they consume as much during growth as
they release during the energy conversion process. They can
be converted to heat, electricity or biofuels. Other benefits are
usage of surplus agricultural land and reducing the depen-
dence on oil.
Energy crops can be divided into woody or grassy groups.
Woody energy crops such as willow or poplar trees (C3 group)
grow faster compared with other trees and has higher densi-
ties than grassy ones. However, experience with wood
suggests that it’s hardly grown in a sustainable fashion,
leading to environmental concerns [2]. The concept of short
rotation forestry or short rotation coppice implies periodically
cutting and allowing re-growth of forests, systematically.
Grassy energy crops are generally of the C4 category due to
their higher yields. Favored types are sugar cane and maize,
but also miscanthus is gaining interest since it grows well in
temperate climates. Energy crops can also be grown for their
oils such as rapeseed, soya beans, sunflowers, which can be
used as a substitute for diesel.
Energy crops however, do raise certain environmental
concerns such as great land use, soil desertification, water
table contamination due to fertilizers and loss of biodiversity.
2.1.1.3. Refuse. Refuse is basically waste that is not agricul-
tural which consists of municipal solid waste (MSW), indus-
trial and commercial wastes. Refuse can be a jumble of things;
metals, plastics, ceramics, etc. In addition, they can contain
hazardous chemicals, biological or even radioactivity mater.
Therefore they pose special problems.
The attraction in converting refuse is mainly to reduce
landfill quantity and to sterilize hazardous materials. Creating
energy from this source is gaining momentum around the
world. But due to the inherent composition of refuse, the by-
products pose great environmental problems. There exist
many solutions to mitigate these, but the key lies in under-
standing the nature of the refuse and separating it prior to
being converted.
2.1.2. CharacteristicsThe characteristics of biomass are very important since they
can vary greatly from location to location, seasonally and
yearly. McKendry [3] states that the influential characteristics
of biomass that are of greatest interest are:
� moisture content;
� heating value;
� fixed carbon and volatile mater proportions;
� ash content;
� alkali metal content;
� cellulose and lignin ratio.
When energy planning, it is clear that the heating value of
the fuel is the most important characteristic. In general
biomass has much lower energy content (EC) than traditional
fuels since it has a low carbon and high oxygen content.
Typically the dry ash free energy content of biomass can be
estimated as 20.4 MJ/kg �15% [28].
The moisture content (MC) is the second greatest factor,
affecting the heating value of the fuel; 10% increase in MC
means 11% decrease in LHV [2]. The MC can vary widely
depending on the type of biomass, the environmental condi-
tions and the degree of drying. In general biomass fuels with
a MC higher than 55% are not combusted or gasified. On the
i n t e r n a t i o n a l j o u r n a l o f h y d r o g e n e n e r g y 3 4 ( 2 0 0 9 ) 7 0 2 7 – 7 0 4 0 7029
other hand, a high MC is suitable for digestion or
fermentation.
A benefit of biomass is that, in general, it has a low to
negligible sulphur and metal content. However, ash content is
high which leads to fouling, and traces of chlorine might be
present causing corrosion in the equipment.
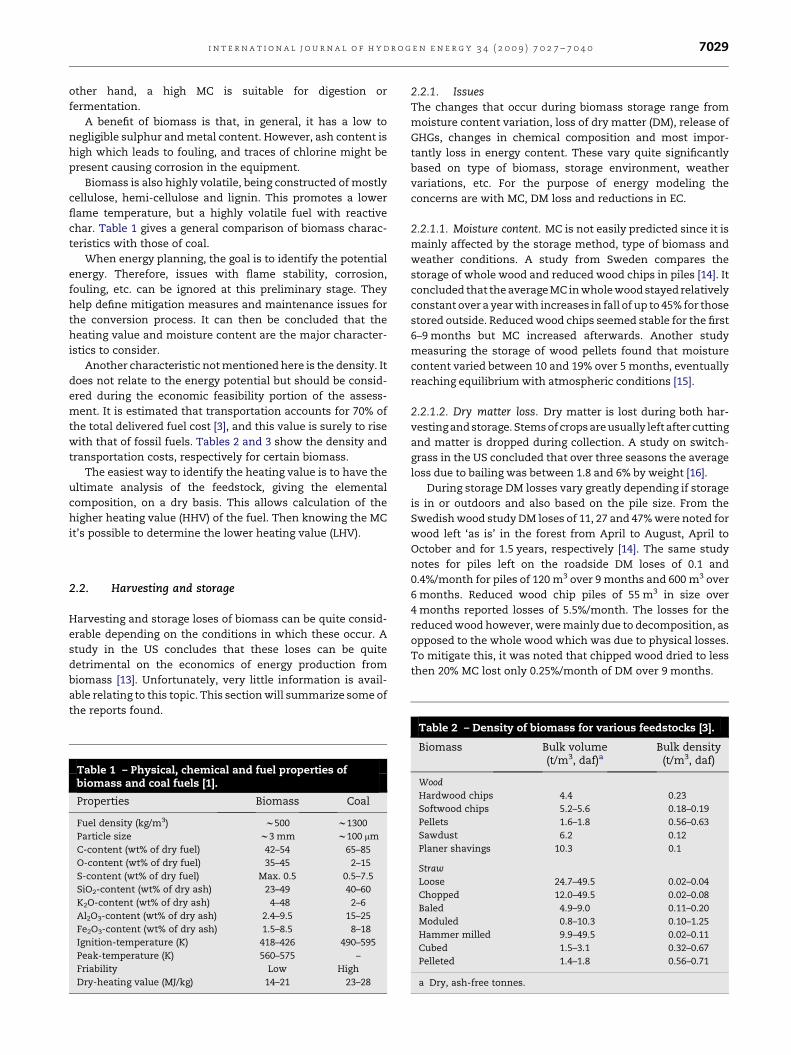
Biomass is also highly volatile, being constructed of mostly
cellulose, hemi-cellulose and lignin. This promotes a lower
flame temperature, but a highly volatile fuel with reactive
char. Table 1 gives a general comparison of biomass charac-
teristics with those of coal.
When energy planning, the goal is to identify the potential
energy. Therefore, issues with flame stability, corrosion,
fouling, etc. can be ignored at this preliminary stage. They
help define mitigation measures and maintenance issues for
the conversion process. It can then be concluded that the
heating value and moisture content are the major character-
istics to consider.
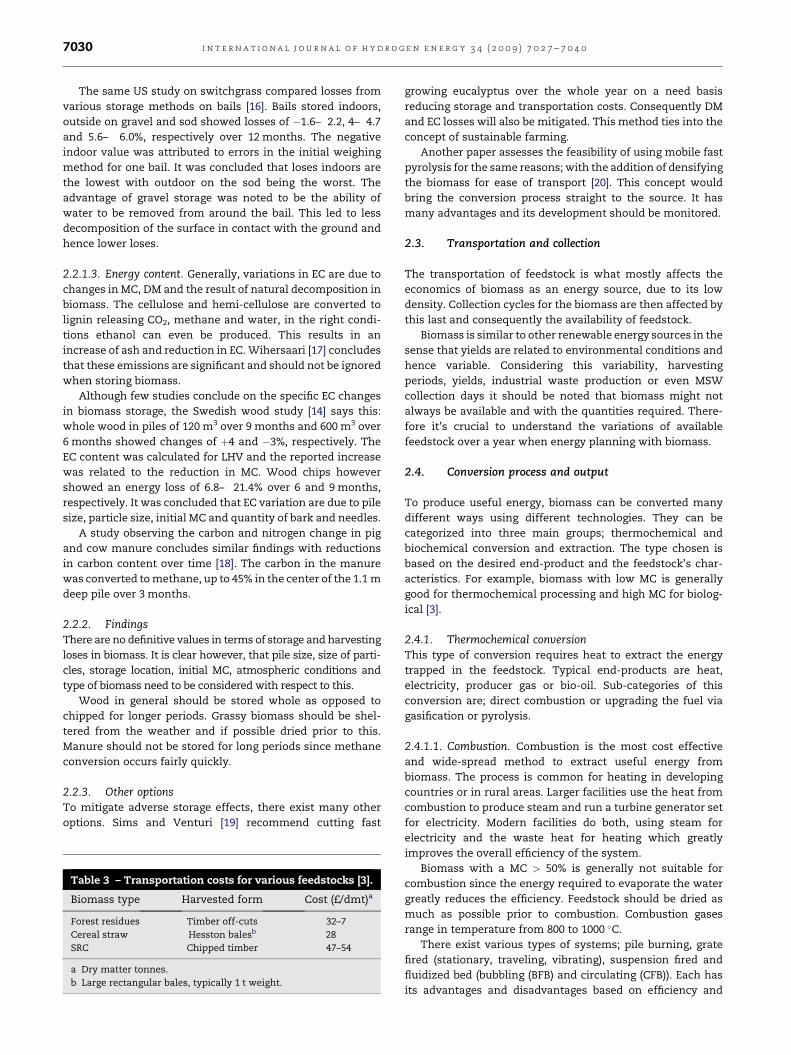
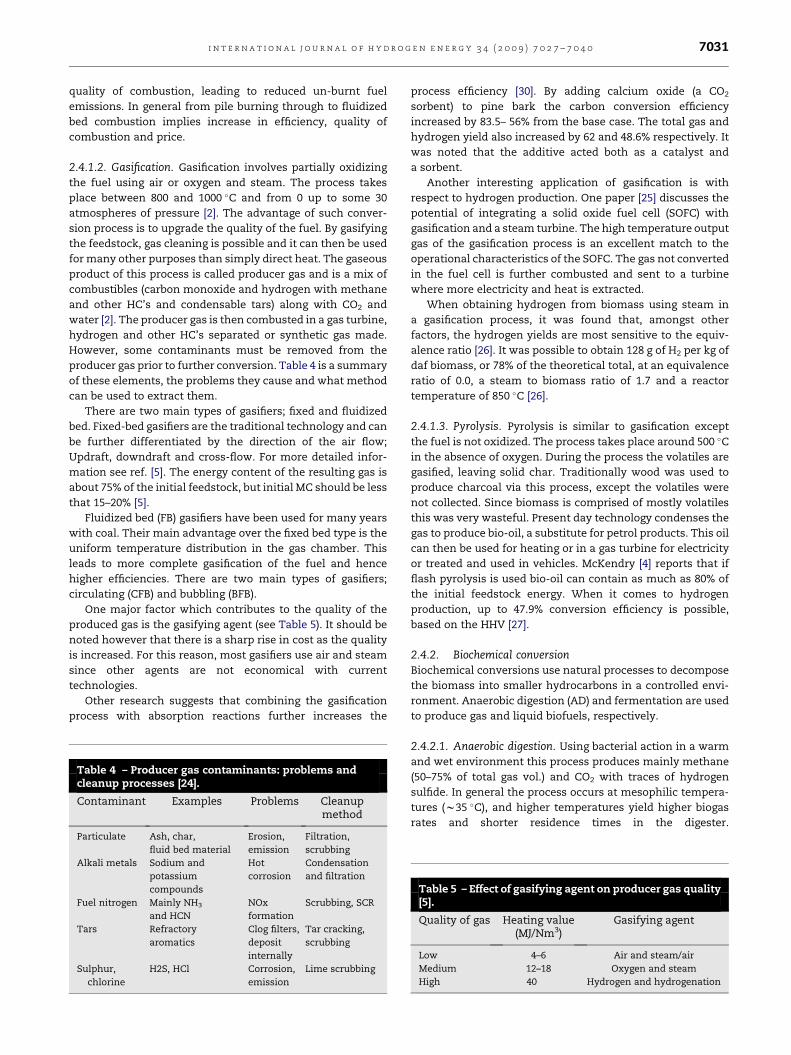
Another characteristic not mentioned here is the density. It
does not relate to the energy potential but should be consid-
ered during the economic feasibility portion of the assess-
ment. It is estimated that transportation accounts for 70% of
the total delivered fuel cost [3], and this value is surely to rise
with that of fossil fuels. Tables 2 and 3 show the density and
transportation costs, respectively for certain biomass.
The easiest way to identify the heating value is to have the
ultimate analysis of the feedstock, giving the elemental
composition, on a dry basis. This allows calculation of the
higher heating value (HHV) of the fuel. Then knowing the MC
it’s possible to determine the lower heating value (LHV).
2.2. Harvesting and storage
Harvesting and storage loses of biomass can be quite consid-
erable depending on the conditions in which these occur. A
study in the US concludes that these loses can be quite
detrimental on the economics of energy production from
biomass [13]. Unfortunately, very little information is avail-
able relating to this topic. This section will summarize some of
the reports found.
Table 1 – Physical, chemical and fuel properties ofbiomass and coal fuels [1].
Properties Biomass Coal
Fuel density (kg/m3) w500 w1300
Particle size w3 mm w100 mm
C-content (wt% of dry fuel) 42–54 65–85
O-content (wt% of dry fuel) 35–45 2–15
S-content (wt% of dry fuel) Max. 0.5 0.5–7.5
SiO2-content (wt% of dry ash) 23–49 40–60
K2O-content (wt% of dry ash) 4–48 2–6
Al2O3-content (wt% of dry ash) 2.4–9.5 15–25
Fe2O3-content (wt% of dry ash) 1.5–8.5 8–18
Ignition-temperature (K) 418–426 490–595
Peak-temperature (K) 560–575 –
Friability Low High
Dry-heating value (MJ/kg) 14–21 23–28
2.2.1. IssuesThe changes that occur during biomass storage range from
moisture content variation, loss of dry matter (DM), release of
GHGs, changes in chemical composition and most impor-
tantly loss in energy content. These vary quite significantly
based on type of biomass, storage environment, weather
variations, etc. For the purpose of energy modeling the
concerns are with MC, DM loss and reductions in EC.
2.2.1.1. Moisture content. MC is not easily predicted since it is
mainly affected by the storage method, type of biomass and
weather conditions. A study from Sweden compares the
storage of whole wood and reduced wood chips in piles [14]. It
concluded that the average MC in whole wood stayed relatively
constant over a year with increases in fall of up to 45% for those
stored outside. Reduced wood chips seemed stable for the first
6–9 months but MC increased afterwards. Another study
measuring the storage of wood pellets found that moisture
content varied between 10 and 19% over 5 months, eventually
reaching equilibrium with atmospheric conditions [15].
2.2.1.2. Dry matter loss. Dry matter is lost during both har-
vesting and storage. Stems of crops are usually left after cutting
and matter is dropped during collection. A study on switch-
grass in the US concluded that over three seasons the average
loss due to bailing was between 1.8 and 6% by weight [16].
During storage DM losses vary greatly depending if storage
is in or outdoors and also based on the pile size. From the
Swedish wood study DM loses of 11, 27 and 47% were noted for
wood left ‘as is’ in the forest from April to August, April to
October and for 1.5 years, respectively [14]. The same study
notes for piles left on the roadside DM loses of 0.1 and
0.4%/month for piles of 120 m3 over 9 months and 600 m3 over
6 months. Reduced wood chip piles of 55 m3 in size over
4 months reported losses of 5.5%/month. The losses for the
reduced wood however, were mainly due to decomposition, as
opposed to the whole wood which was due to physical losses.
To mitigate this, it was noted that chipped wood dried to less
then 20% MC lost only 0.25%/month of DM over 9 months.
Table 2 – Density of biomass for various feedstocks [3].
Biomass Bulk volume(t/m3, daf)a
Bulk density(t/m3, daf)
Wood
Hardwood chips 4.4 0.23
Softwood chips 5.2–5.6 0.18–0.19
Pellets 1.6–1.8 0.56–0.63
Sawdust 6.2 0.12
Planer shavings 10.3 0.1
Straw
Loose 24.7–49.5 0.02–0.04
Chopped 12.0–49.5 0.02–0.08
Baled 4.9–9.0 0.11–0.20
Moduled 0.8–10.3 0.10–1.25
Hammer milled 9.9–49.5 0.02–0.11
Cubed 1.5–3.1 0.32–0.67
Pelleted 1.4–1.8 0.56–0.71
a Dry, ash-free tonnes.
i n t e r n a t i o n a l j o u r n a l o f h y d r o g e n e n e r g y 3 4 ( 2 0 0 9 ) 7 0 2 7 – 7 0 4 07030
The same US study on switchgrass compared losses from
various storage methods on bails [16]. Bails stored indoors,
outside on gravel and sod showed losses of �1.6– 2.2, 4– 4.7
and 5.6– 6.0%, respectively over 12 months. The negative
indoor value was attributed to errors in the initial weighing
method for one bail. It was concluded that loses indoors are
the lowest with outdoor on the sod being the worst. The
advantage of gravel storage was noted to be the ability of
water to be removed from around the bail. This led to less
decomposition of the surface in contact with the ground and
hence lower loses.
2.2.1.3. Energy content. Generally, variations in EC are due to
changes in MC, DM and the result of natural decomposition in
biomass. The cellulose and hemi-cellulose are converted to
lignin releasing CO2, methane and water, in the right condi-
tions ethanol can even be produced. This results in an
increase of ash and reduction in EC. Wihersaari [17] concludes
that these emissions are significant and should not be ignored
when storing biomass.
Although few studies conclude on the specific EC changes
in biomass storage, the Swedish wood study [14] says this:
whole wood in piles of 120 m3 over 9 months and 600 m3 over
6 months showed changes of þ4 and �3%, respectively. The
EC content was calculated for LHV and the reported increase
was related to the reduction in MC. Wood chips however
showed an energy loss of 6.8– 21.4% over 6 and 9 months,
respectively. It was concluded that EC variation are due to pile
size, particle size, initial MC and quantity of bark and needles.
A study observing the carbon and nitrogen change in pig
and cow manure concludes similar findings with reductions
in carbon content over time [18]. The carbon in the manure
was converted to methane, up to 45% in the center of the 1.1 m
deep pile over 3 months.
2.2.2. FindingsThere are no definitive values in terms of storage and harvesting
loses in biomass. It is clear however, that pile size, size of parti-
cles, storage location, initial MC, atmospheric conditions and
type of biomass need to be considered with respect to this.
Wood in general should be stored whole as opposed to
chipped for longer periods. Grassy biomass should be shel-
tered from the weather and if possible dried prior to this.
Manure should not be stored for long periods since methane
conversion occurs fairly quickly.
2.2.3. Other optionsTo mitigate adverse storage effects, there exist many other
options. Sims and Venturi [19] recommend cutting fast
Table 3 – Transportation costs for various feedstocks [3].
Biomass type Harvested form Cost (£/dmt)a
Forest residues Timber off-cuts 32–7
Cereal straw Hesston balesb 28
SRC Chipped timber 47–54
a Dry matter tonnes.
b Large rectangular bales, typically 1 t weight.
growing eucalyptus over the whole year on a need basis
reducing storage and transportation costs. Consequently DM
and EC losses will also be mitigated. This method ties into the
concept of sustainable farming.
Another paper assesses the feasibility of using mobile fast
pyrolysis for the same reasons; with the addition of densifying
the biomass for ease of transport [20]. This concept would
bring the conversion process straight to the source. It has
many advantages and its development should be monitored.
2.3. Transportation and collection
The transportation of feedstock is what mostly affects the
economics of biomass as an energy source, due to its low
density. Collection cycles for the biomass are then affected by
this last and consequently the availability of feedstock.
Biomass is similar to other renewable energy sources in the
sense that yields are related to environmental conditions and
hence variable. Considering this variability, harvesting
periods, yields, industrial waste production or even MSW
collection days it should be noted that biomass might not
always be available and with the quantities required. There-
fore it’s crucial to understand the variations of available
feedstock over a year when energy planning with biomass.
2.4. Conversion process and output
To produce useful energy, biomass can be converted many
different ways using different technologies. They can be
categorized into three main groups; thermochemical and
biochemical conversion and extraction. The type chosen is
based on the desired end-product and the feedstock’s char-
acteristics. For example, biomass with low MC is generally
good for thermochemical processing and high MC for biolog-
ical [3].
2.4.1. Thermochemical conversionThis type of conversion requires heat to extract the energy
trapped in the feedstock. Typical end-products are heat,
electricity, producer gas or bio-oil. Sub-categories of this
conversion are; direct combustion or upgrading the fuel via
gasification or pyrolysis.
2.4.1.1. Combustion. Combustion is the most cost effective
and wide-spread method to extract useful energy from
biomass. The process is common for heating in developing
countries or in rural areas. Larger facilities use the heat from
combustion to produce steam and run a turbine generator set
for electricity. Modern facilities do both, using steam for
electricity and the waste heat for heating which greatly
improves the overall efficiency of the system.
Biomass with a MC > 50% is generally not suitable for
combustion since the energy required to evaporate the water
greatly reduces the efficiency. Feedstock should be dried as
much as possible prior to combustion. Combustion gases
range in temperature from 800 to 1000 �C.
There exist various types of systems; pile burning, grate
fired (stationary, traveling, vibrating), suspension fired and
fluidized bed (bubbling (BFB) and circulating (CFB)). Each has
its advantages and disadvantages based on efficiency and
i n t e r n a t i o n a l j o u r n a l o f h y d r o g e n e n e r g y 3 4 ( 2 0 0 9 ) 7 0 2 7 – 7 0 4 0 7031
quality of combustion, leading to reduced un-burnt fuel
emissions. In general from pile burning through to fluidized
bed combustion implies increase in efficiency, quality of
combustion and price.
2.4.1.2. Gasification. Gasification involves partially oxidizing
the fuel using air or oxygen and steam. The process takes
place between 800 and 1000 �C and from 0 up to some 30
atmospheres of pressure [2]. The advantage of such conver-
sion process is to upgrade the quality of the fuel. By gasifying
the feedstock, gas cleaning is possible and it can then be used
for many other purposes than simply direct heat. The gaseous
product of this process is called producer gas and is a mix of
combustibles (carbon monoxide and hydrogen with methane
and other HC’s and condensable tars) along with CO2 and
water [2]. The producer gas is then combusted in a gas turbine,
hydrogen and other HC’s separated or synthetic gas made.
However, some contaminants must be removed from the
producer gas prior to further conversion. Table 4 is a summary
of these elements, the problems they cause and what method
can be used to extract them.
There are two main types of gasifiers; fixed and fluidized
bed. Fixed-bed gasifiers are the traditional technology and can
be further differentiated by the direction of the air flow;
Updraft, downdraft and cross-flow. For more detailed infor-
mation see ref. [5]. The energy content of the resulting gas is
about 75% of the initial feedstock, but initial MC should be less
that 15–20% [5].
Fluidized bed (FB) gasifiers have been used for many years
with coal. Their main advantage over the fixed bed type is the
uniform temperature distribution in the gas chamber. This
leads to more complete gasification of the fuel and hence
higher efficiencies. There are two main types of gasifiers;
circulating (CFB) and bubbling (BFB).
One major factor which contributes to the quality of the
produced gas is the gasifying agent (see Table 5). It should be
noted however that there is a sharp rise in cost as the quality
is increased. For this reason, most gasifiers use air and steam
since other agents are not economical with current
technologies.
Other research suggests that combining the gasification
process with absorption reactions further increases the
Table 4 – Producer gas contaminants: problems andcleanup processes [24].
Contaminant Examples Problems Cleanupmethod
Particulate Ash, char,
fluid bed material
Erosion,
emission
Filtration,
scrubbing
Alkali metals Sodium and
potassium
compounds
Hot
corrosion
Condensation
and filtration
Fuel nitrogen Mainly NH3
and HCN
NOx
formation
Scrubbing, SCR
Tars Refractory
aromatics
Clog filters,
deposit
internally
Tar cracking,
scrubbing
Sulphur,
chlorine
H2S, HCl Corrosion,
emission
Lime scrubbing
process efficiency [30]. By adding calcium oxide (a CO2
sorbent) to pine bark the carbon conversion efficiency
increased by 83.5– 56% from the base case. The total gas and
hydrogen yield also increased by 62 and 48.6% respectively. It
was noted that the additive acted both as a catalyst and
a sorbent.
Another interesting application of gasification is with
respect to hydrogen production. One paper [25] discusses the
potential of integrating a solid oxide fuel cell (SOFC) with
gasification and a steam turbine. The high temperature output
gas of the gasification process is an excellent match to the
operational characteristics of the SOFC. The gas not converted
in the fuel cell is further combusted and sent to a turbine
where more electricity and heat is extracted.
When obtaining hydrogen from biomass using steam in
a gasification process, it was found that, amongst other
factors, the hydrogen yields are most sensitive to the equiv-
alence ratio [26]. It was possible to obtain 128 g of H2 per kg of
daf biomass, or 78% of the theoretical total, at an equivalence
ratio of 0.0, a steam to biomass ratio of 1.7 and a reactor
temperature of 850 �C [26].
2.4.1.3. Pyrolysis. Pyrolysis is similar to gasification except
the fuel is not oxidized. The process takes place around 500 �C
in the absence of oxygen. During the process the volatiles are
gasified, leaving solid char. Traditionally wood was used to
produce charcoal via this process, except the volatiles were
not collected. Since biomass is comprised of mostly volatiles
this was very wasteful. Present day technology condenses the
gas to produce bio-oil, a substitute for petrol products. This oil
can then be used for heating or in a gas turbine for electricity
or treated and used in vehicles. McKendry [4] reports that if
flash pyrolysis is used bio-oil can contain as much as 80% of
the initial feedstock energy. When it comes to hydrogen
production, up to 47.9% conversion efficiency is possible,
based on the HHV [27].
2.4.2. Biochemical conversionBiochemical conversions use natural processes to decompose
the biomass into smaller hydrocarbons in a controlled envi-
ronment. Anaerobic digestion (AD) and fermentation are used
to produce gas and liquid biofuels, respectively.
2.4.2.1. Anaerobic digestion. Using bacterial action in a warm
and wet environment this process produces mainly methane
(50–75% of total gas vol.) and CO2 with traces of hydrogen
sulfide. In general the process occurs at mesophilic tempera-
tures (w35 �C), and higher temperatures yield higher biogas
rates and shorter residence times in the digester.
Table 5 – Effect of gasifying agent on producer gas quality[5].
Quality of gas Heating value(MJ/Nm3)
Gasifying agent
Low 4–6 Air and steam/air
Medium 12–18 Oxygen and steam
High 40 Hydrogen and hydrogenation
i n t e r n a t i o n a l j o u r n a l o f h y d r o g e n e n e r g y 3 4 ( 2 0 0 9 ) 7 0 2 7 – 7 0 4 07032
Unfortunately higher digester temperatures are not econom-
ical since then most of the gas produced must be used to heat
the digester tank, depending on the environmental condi-
tions. The moisture content of the slurry should also be
between 80 and 95%. This is why manure is a great feedstock
for such systems. MSW and sewer sludge (solid by-product
from sewage treatment plants) can also be used to help
decontaminate the waste and reduce landfill needs; the
methane release to atmosphere is also mitigated. Any other
biomass can also be used. The solid by-product of the process
can be sold as a fertilized, depending on the contaminants of
the initial feedstock.
The gas can then be used in an IC engine or in a micro-
turbine to produce electricity. The waste heat can be used to
heat the digester or for other process heating. The gas can also
be stored and redistributed as needed. Except the storage,
compression equipment and energy requirements are high
which significantly reduce the benefits of such systems. The
conversion efficiency from feedstock to gas is 20–50% of the
initial energy content. Electrical efficiency is then 10–16% [4].
2.4.2.2. Fermentation. Fermentation is another anaerobic
process by which microbes convert sugars to alcohol. The
process then produces ethanol that can be used as an additive
to gasoline in normal engines or as the primary fuel in con-
verted engines such as in Brazil. The ethanol can also be used
in the esterification process used to create bio-diesel from bio-
oils. Sugar crops (sugar cane, sugar beet) or starch crops
(maize, wheat) are best suited for this. Corn will yield about
450 l of ethanol from 1 dry t [4]. The by-products can be used
as cow feed or in the case of bagasse, it can be further con-
verted using a combustor or a gasifier [12].
2.4.3. ExtractionThe final method to convert biomass is through mechanical
pressing of the feedstock; about 3 t of rapeseed gives 1 t of oil
[4]. The useful product is oil that can then replace petrol
products. In most cases, this bio-oil can directly be used in
a diesel engine except it leaves carbon deposits in the cylin-
ders which can damage the engine. If the oil is further treated
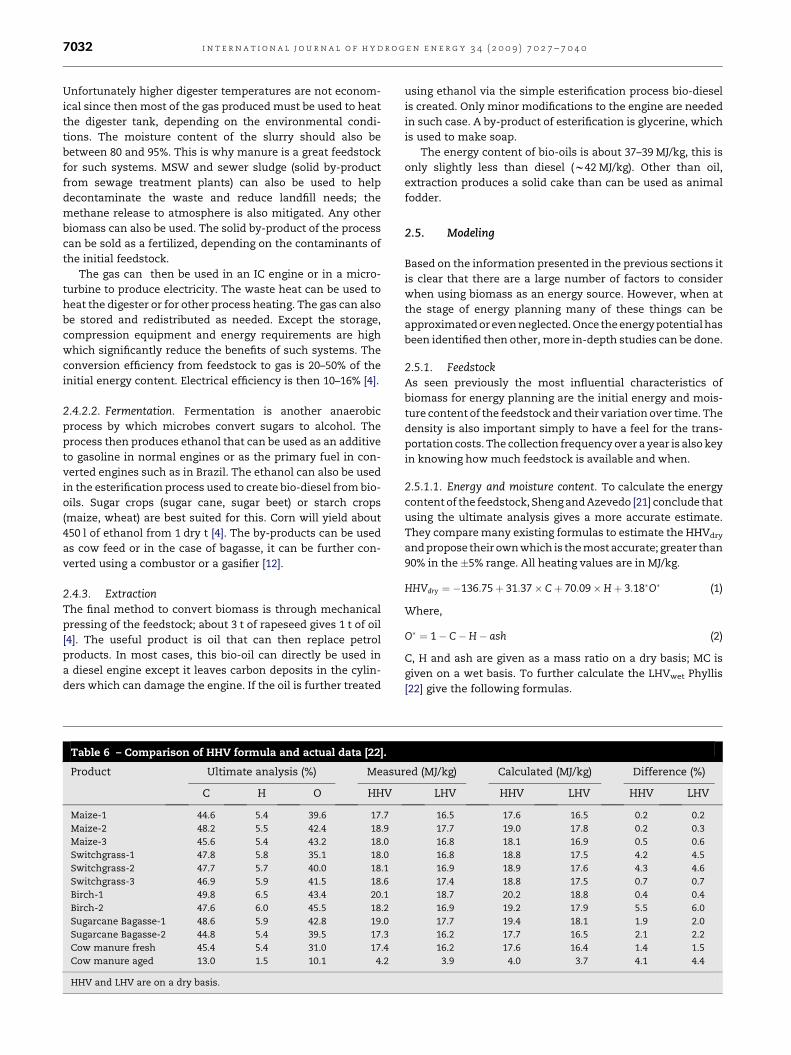
Table 6 – Comparison of HHV formula and actual data [22].
Product Ultimate analysis (%) Measu
C H O HHV
Maize-1 44.6 5.4 39.6 17.7
Maize-2 48.2 5.5 42.4 18.9
Maize-3 45.6 5.4 43.2 18.0
Switchgrass-1 47.8 5.8 35.1 18.0
Switchgrass-2 47.7 5.7 40.0 18.1
Switchgrass-3 46.9 5.9 41.5 18.6
Birch-1 49.8 6.5 43.4 20.1
Birch-2 47.6 6.0 45.5 18.2
Sugarcane Bagasse-1 48.6 5.9 42.8 19.0
Sugarcane Bagasse-2 44.8 5.4 39.5 17.3
Cow manure fresh 45.4 5.4 31.0 17.4
Cow manure aged 13.0 1.5 10.1 4.2
HHV and LHV are on a dry basis.
using ethanol via the simple esterification process bio-diesel
is created. Only minor modifications to the engine are needed
in such case. A by-product of esterification is glycerine, which
is used to make soap.
The energy content of bio-oils is about 37–39 MJ/kg, this is
only slightly less than diesel (w42 MJ/kg). Other than oil,
extraction produces a solid cake than can be used as animal
fodder.
2.5. Modeling
Based on the information presented in the previous sections it
is clear that there are a large number of factors to consider
when using biomass as an energy source. However, when at
the stage of energy planning many of these things can be
approximated or even neglected. Once the energy potential has
been identified then other, more in-depth studies can be done.
2.5.1. FeedstockAs seen previously the most influential characteristics of
biomass for energy planning are the initial energy and mois-
ture content of the feedstock and their variation over time. The
density is also important simply to have a feel for the trans-
portation costs. The collection frequency over a year is also key
in knowing how much feedstock is available and when.
2.5.1.1. Energy and moisture content. To calculate the energy
content of the feedstock, Sheng and Azevedo [21] conclude that
using the ultimate analysis gives a more accurate estimate.
They compare many existing formulas to estimate the HHVdry
and propose their own which is the most accurate; greater than
90% in the �5% range. All heating values are in MJ/kg.
HHVdry ¼ �136:75þ 31:37� Cþ 70:09�Hþ 3:18�O� (1)
Where,
O� ¼ 1� C� H� ash (2)
C, H and ash are given as a mass ratio on a dry basis; MC is
given on a wet basis. To further calculate the LHVwet Phyllis
[22] give the following formulas.
red (MJ/kg) Calculated (MJ/kg) Difference (%)
LHV HHV LHV HHV LHV
16.5 17.6 16.5 0.2 0.2
17.7 19.0 17.8 0.2 0.3
16.8 18.1 16.9 0.5 0.6
16.8 18.8 17.5 4.2 4.5
16.9 18.9 17.6 4.3 4.6
17.4 18.8 17.5 0.7 0.7
18.7 20.2 18.8 0.4 0.4
16.9 19.2 17.9 5.5 6.0
17.7 19.4 18.1 1.9 2.0
16.2 17.7 16.5 2.1 2.2
16.2 17.6 16.4 1.4 1.5
3.9 4.0 3.7 4.1 4.4
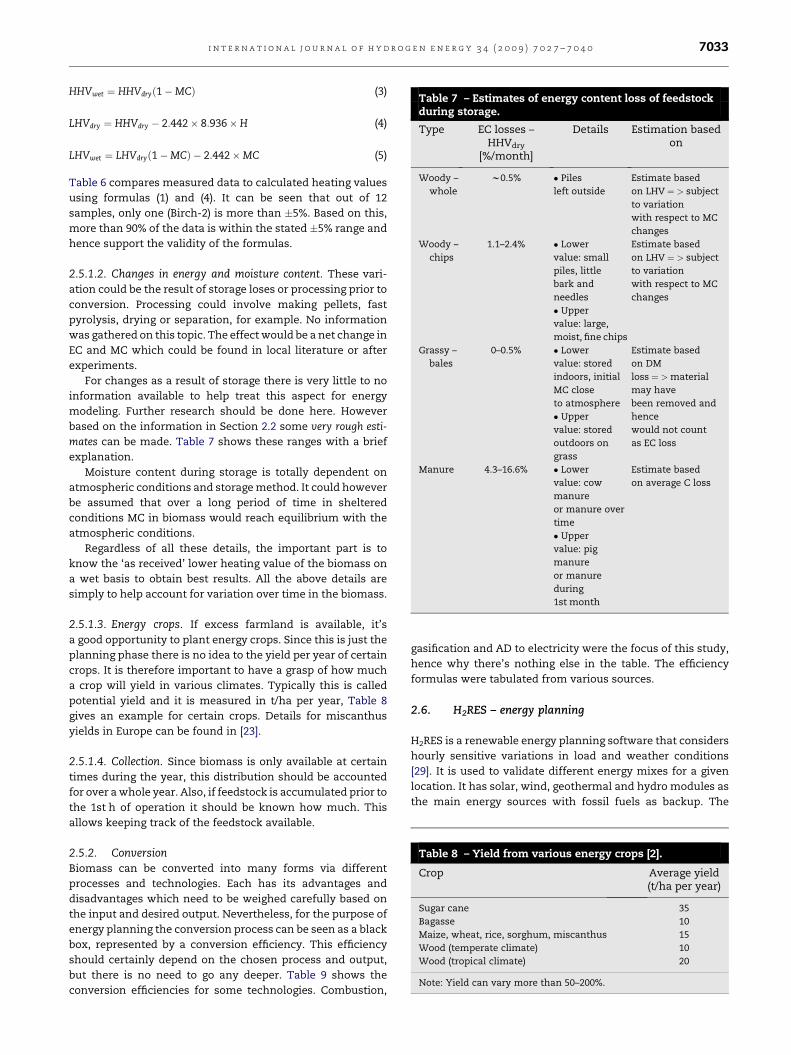
Table 7 – Estimates of energy content loss of feedstock
i n t e r n a t i o n a l j o u r n a l o f h y d r o g e n e n e r g y 3 4 ( 2 0 0 9 ) 7 0 2 7 – 7 0 4 0 7033
HHVwet ¼ HHVdryð1�MCÞ (3)
Table 8 – Yield from various energy crops [2].
Crop Average yield(t/ha per year)
Sugar cane 35
Bagasse 10
Maize, wheat, rice, sorghum, miscanthus 15
Wood (temperate climate) 10
Wood (tropical climate) 20
Note: Yield can vary more than 50–200%.
during storage.
Type EC losses –HHVdry
[%/month]
Details Estimation basedon
Woody –
whole
w0.5% � Piles
left outside
Estimate based
on LHV ¼ > subject
to variation
with respect to MC
changes
Woody –
chips
1.1–2.4% � Lower
value: small
piles, little
bark and
needles
Estimate based
on LHV ¼ > subject
to variation
with respect to MC
changes
� Upper
value: large,
moist, fine chips
Grassy –
bales
0–0.5% � Lower
value: stored
indoors, initial
MC close
to atmosphere
Estimate based
on DM
loss ¼ > material
may have
been removed and
hence
would not count
as EC loss
� Upper
value: stored
outdoors on
grass
Manure 4.3–16.6% � Lower
value: cow
manure
or manure over
time
Estimate based
on average C loss
� Upper
value: pig
manure
or manure
during
1st month
LHVdry ¼ HHVdry � 2:442� 8:936�H (4)
LHVwet ¼ LHVdryð1�MCÞ � 2:442�MC (5)
Table 6 compares measured data to calculated heating values
using formulas (1) and (4). It can be seen that out of 12
samples, only one (Birch-2) is more than �5%. Based on this,
more than 90% of the data is within the stated �5% range and
hence support the validity of the formulas.
2.5.1.2. Changes in energy and moisture content. These vari-
ation could be the result of storage loses or processing prior to
conversion. Processing could involve making pellets, fast
pyrolysis, drying or separation, for example. No information
was gathered on this topic. The effect would be a net change in
EC and MC which could be found in local literature or after
experiments.
For changes as a result of storage there is very little to no
information available to help treat this aspect for energy
modeling. Further research should be done here. However
based on the information in Section 2.2 some very rough esti-
mates can be made. Table 7 shows these ranges with a brief
explanation.
Moisture content during storage is totally dependent on
atmospheric conditions and storage method. It could however
be assumed that over a long period of time in sheltered
conditions MC in biomass would reach equilibrium with the
atmospheric conditions.
Regardless of all these details, the important part is to
know the ‘as received’ lower heating value of the biomass on
a wet basis to obtain best results. All the above details are
simply to help account for variation over time in the biomass.
2.5.1.3. Energy crops. If excess farmland is available, it’s
a good opportunity to plant energy crops. Since this is just the
planning phase there is no idea to the yield per year of certain
crops. It is therefore important to have a grasp of how much
a crop will yield in various climates. Typically this is called
potential yield and it is measured in t/ha per year, Table 8
gives an example for certain crops. Details for miscanthus
yields in Europe can be found in [23].
2.5.1.4. Collection. Since biomass is only available at certain
times during the year, this distribution should be accounted
for over a whole year. Also, if feedstock is accumulated prior to
the 1st h of operation it should be known how much. This
allows keeping track of the feedstock available.
2.5.2. ConversionBiomass can be converted into many forms via different
processes and technologies. Each has its advantages and
disadvantages which need to be weighed carefully based on
the input and desired output. Nevertheless, for the purpose of
energy planning the conversion process can be seen as a black
box, represented by a conversion efficiency. This efficiency
should certainly depend on the chosen process and output,
but there is no need to go any deeper. Table 9 shows the
conversion efficiencies for some technologies. Combustion,
gasification and AD to electricity were the focus of this study,
hence why there’s nothing else in the table. The efficiency
formulas were tabulated from various sources.
2.6. H2RES – energy planning
H2RES is a renewable energy planning software that considers
hourly sensitive variations in load and weather conditions
[29]. It is used to validate different energy mixes for a given
location. It has solar, wind, geothermal and hydro modules as
the main energy sources with fossil fuels as backup. The
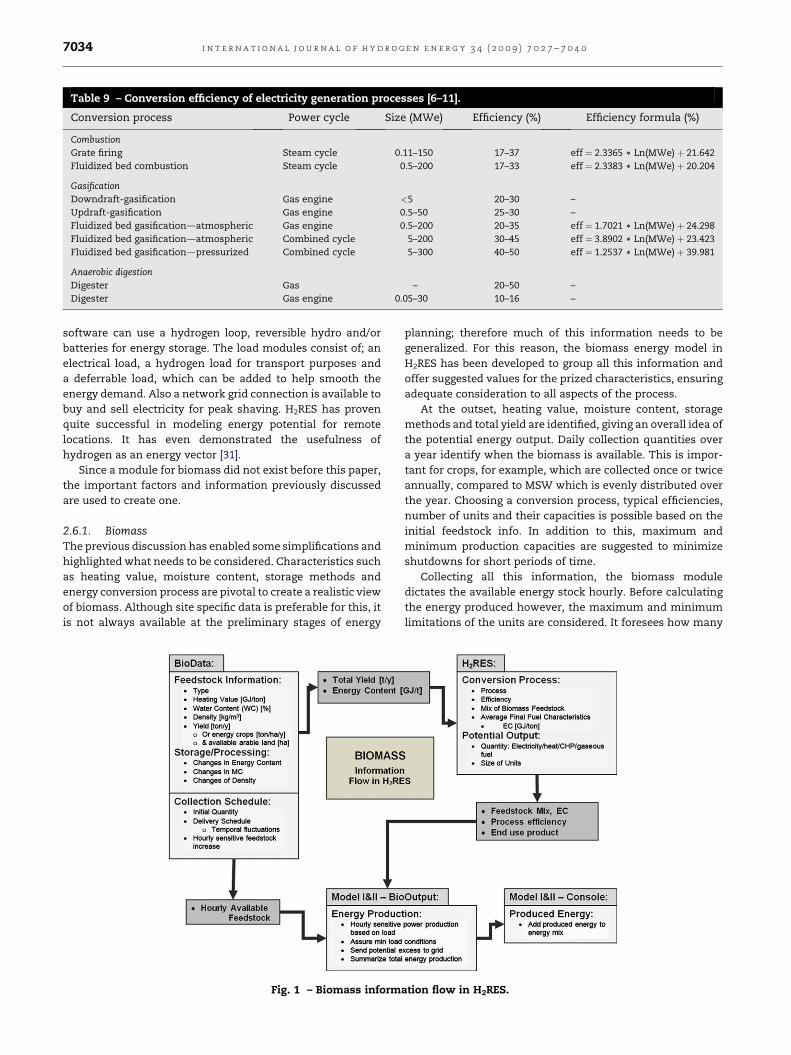
Table 9 – Conversion efficiency of electricity generation processes [6–11].
Conversion process Power cycle Size (MWe) Efficiency (%) Efficiency formula (%)
Combustion
Grate firing Steam cycle 0.11–150 17–37 eff ¼ 2.3365 ) Ln(MWe) þ 21.642
Fluidized bed combustion Steam cycle 0.5–200 17–33 eff ¼ 2.3383 ) Ln(MWe) þ 20.204
Gasification
Downdraft-gasification Gas engine <5 20–30 –
Updraft-gasification Gas engine 0.5–50 25–30 –
Fluidized bed gasificationdatmospheric Gas engine 0.5–200 20–35 eff ¼ 1.7021 ) Ln(MWe) þ 24.298
Fluidized bed gasificationdatmospheric Combined cycle 5–200 30–45 eff ¼ 3.8902 ) Ln(MWe) þ 23.423
Fluidized bed gasificationdpressurized Combined cycle 5–300 40–50 eff ¼ 1.2537 ) Ln(MWe) þ 39.981
Anaerobic digestion
Digester Gas – 20–50 –
Digester Gas engine 0.05–30 10–16 –
i n t e r n a t i o n a l j o u r n a l o f h y d r o g e n e n e r g y 3 4 ( 2 0 0 9 ) 7 0 2 7 – 7 0 4 07034
software can use a hydrogen loop, reversible hydro and/or
batteries for energy storage. The load modules consist of; an
electrical load, a hydrogen load for transport purposes and
a deferrable load, which can be added to help smooth the
energy demand. Also a network grid connection is available to
buy and sell electricity for peak shaving. H2RES has proven
quite successful in modeling energy potential for remote
locations. It has even demonstrated the usefulness of
hydrogen as an energy vector [31].
Since a module for biomass did not exist before this paper,
the important factors and information previously discussed
are used to create one.
2.6.1. BiomassThe previous discussion has enabled some simplifications and
highlighted what needs to be considered. Characteristics such
as heating value, moisture content, storage methods and
energy conversion process are pivotal to create a realistic view
of biomass. Although site specific data is preferable for this, it
is not always available at the preliminary stages of energy
Fig. 1 – Biomass inform
planning; therefore much of this information needs to be
generalized. For this reason, the biomass energy model in
H2RES has been developed to group all this information and
offer suggested values for the prized characteristics, ensuring
adequate consideration to all aspects of the process.
At the outset, heating value, moisture content, storage
methods and total yield are identified, giving an overall idea of
the potential energy output. Daily collection quantities over
a year identify when the biomass is available. This is impor-
tant for crops, for example, which are collected once or twice
annually, compared to MSW which is evenly distributed over
the year. Choosing a conversion process, typical efficiencies,
number of units and their capacities is possible based on the
initial feedstock info. In addition to this, maximum and
minimum production capacities are suggested to minimize
shutdowns for short periods of time.
Collecting all this information, the biomass module
dictates the available energy stock hourly. Before calculating
the energy produced however, the maximum and minimum
limitations of the units are considered. It foresees how many
ation flow in H2RES.
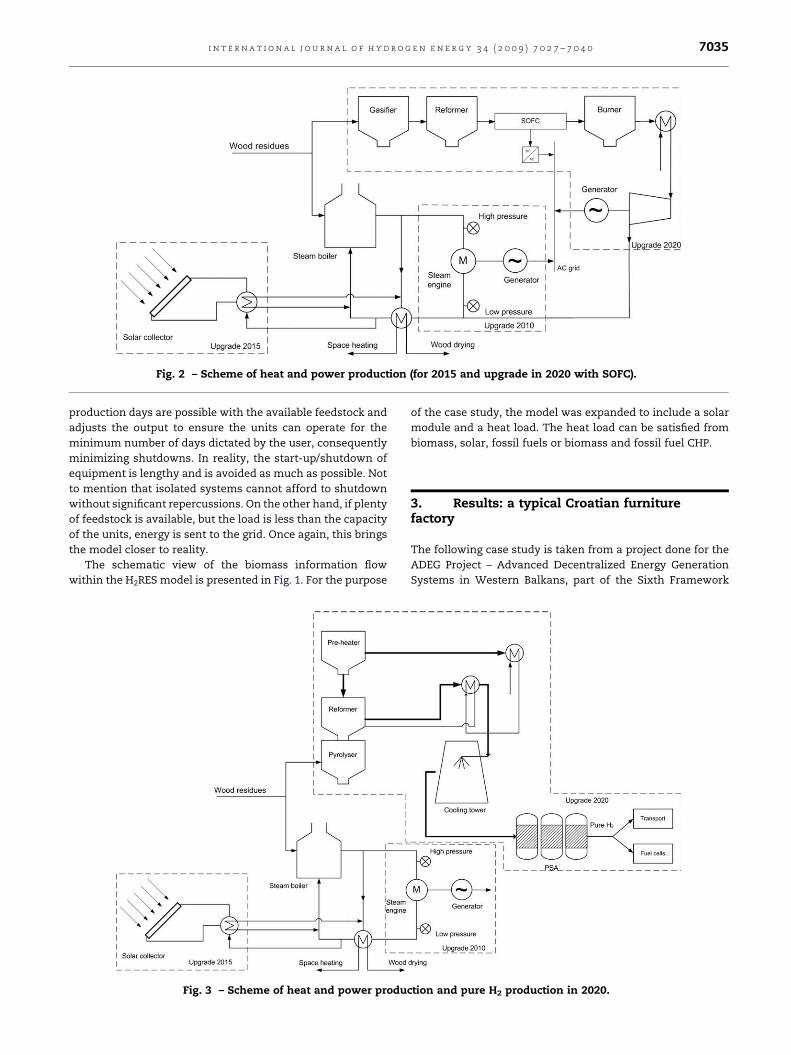
Fig. 2 – Scheme of heat and power production (for 2015 and upgrade in 2020 with SOFC).
i n t e r n a t i o n a l j o u r n a l o f h y d r o g e n e n e r g y 3 4 ( 2 0 0 9 ) 7 0 2 7 – 7 0 4 0 7035
production days are possible with the available feedstock and
adjusts the output to ensure the units can operate for the
minimum number of days dictated by the user, consequently
minimizing shutdowns. In reality, the start-up/shutdown of
equipment is lengthy and is avoided as much as possible. Not
to mention that isolated systems cannot afford to shutdown
without significant repercussions. On the other hand, if plenty
of feedstock is available, but the load is less than the capacity
of the units, energy is sent to the grid. Once again, this brings
the model closer to reality.
The schematic view of the biomass information flow
within the H2RES model is presented in Fig. 1. For the purpose
Fig. 3 – Scheme of heat and power produc
of the case study, the model was expanded to include a solar
module and a heat load. The heat load can be satisfied from
biomass, solar, fossil fuels or biomass and fossil fuel CHP.
3. Results: a typical Croatian furniturefactory
The following case study is taken from a project done for the
ADEG Project – Advanced Decentralized Energy Generation
Systems in Western Balkans, part of the Sixth Framework
tion and pure H2 production in 2020.
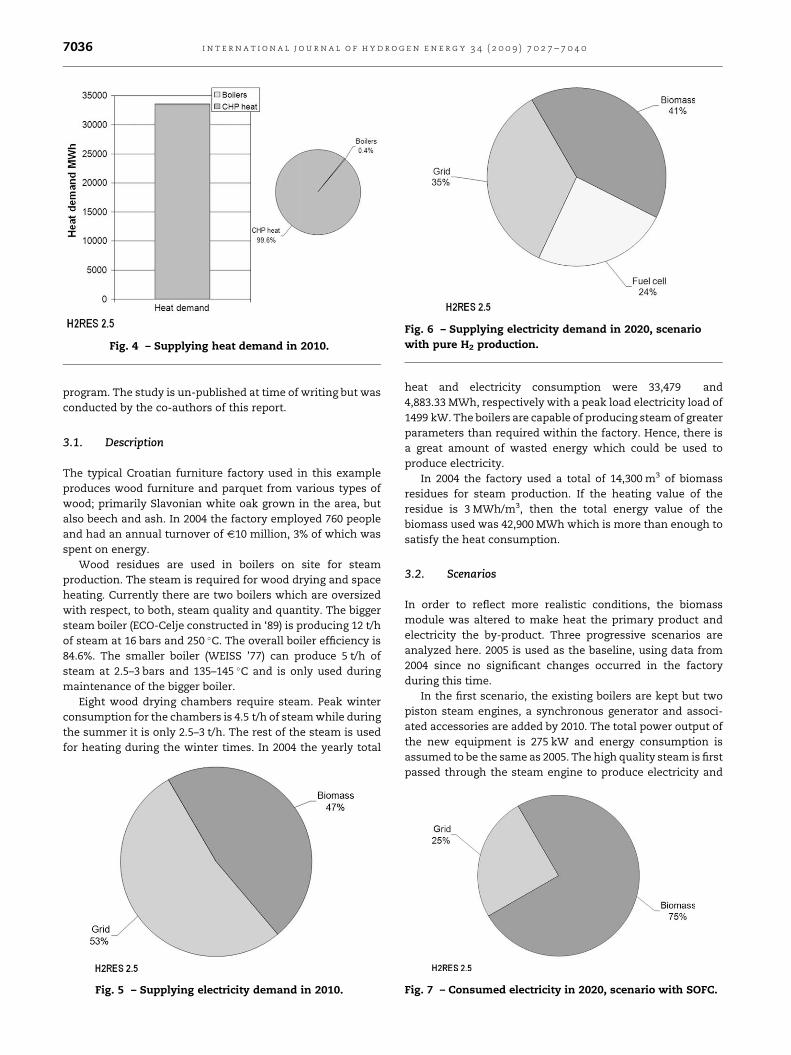
Fig. 4 – Supplying heat demand in 2010.
Fig. 6 – Supplying electricity demand in 2020, scenario
with pure H2 production.
i n t e r n a t i o n a l j o u r n a l o f h y d r o g e n e n e r g y 3 4 ( 2 0 0 9 ) 7 0 2 7 – 7 0 4 07036
program. The study is un-published at time of writing but was
conducted by the co-authors of this report.
3.1. Description
The typical Croatian furniture factory used in this example
produces wood furniture and parquet from various types of
wood; primarily Slavonian white oak grown in the area, but
also beech and ash. In 2004 the factory employed 760 people
and had an annual turnover of V10 million, 3% of which was
spent on energy.
Wood residues are used in boilers on site for steam
production. The steam is required for wood drying and space
heating. Currently there are two boilers which are oversized
with respect, to both, steam quality and quantity. The bigger
steam boiler (ECO-Celje constructed in ‘89) is producing 12 t/h
of steam at 16 bars and 250 �C. The overall boiler efficiency is
84.6%. The smaller boiler (WEISS ’77) can produce 5 t/h of
steam at 2.5–3 bars and 135–145 �C and is only used during
maintenance of the bigger boiler.
Eight wood drying chambers require steam. Peak winter
consumption for the chambers is 4.5 t/h of steam while during
the summer it is only 2.5–3 t/h. The rest of the steam is used
for heating during the winter times. In 2004 the yearly total
Fig. 5 – Supplying electricity demand in 2010.
heat and electricity consumption were 33,479 and
4,883.33 MWh, respectively with a peak load electricity load of
1499 kW. The boilers are capable of producing steam of greater
parameters than required within the factory. Hence, there is
a great amount of wasted energy which could be used to
produce electricity.
In 2004 the factory used a total of 14,300 m3 of biomass
residues for steam production. If the heating value of the
residue is 3 MWh/m3, then the total energy value of the
biomass used was 42,900 MWh which is more than enough to
satisfy the heat consumption.
3.2. Scenarios
In order to reflect more realistic conditions, the biomass
module was altered to make heat the primary product and
electricity the by-product. Three progressive scenarios are
analyzed here. 2005 is used as the baseline, using data from
2004 since no significant changes occurred in the factory
during this time.
In the first scenario, the existing boilers are kept but two
piston steam engines, a synchronous generator and associ-
ated accessories are added by 2010. The total power output of
the new equipment is 275 kW and energy consumption is
assumed to be the same as 2005. The high quality steam is first
passed through the steam engine to produce electricity and
Fig. 7 – Consumed electricity in 2020, scenario with SOFC.
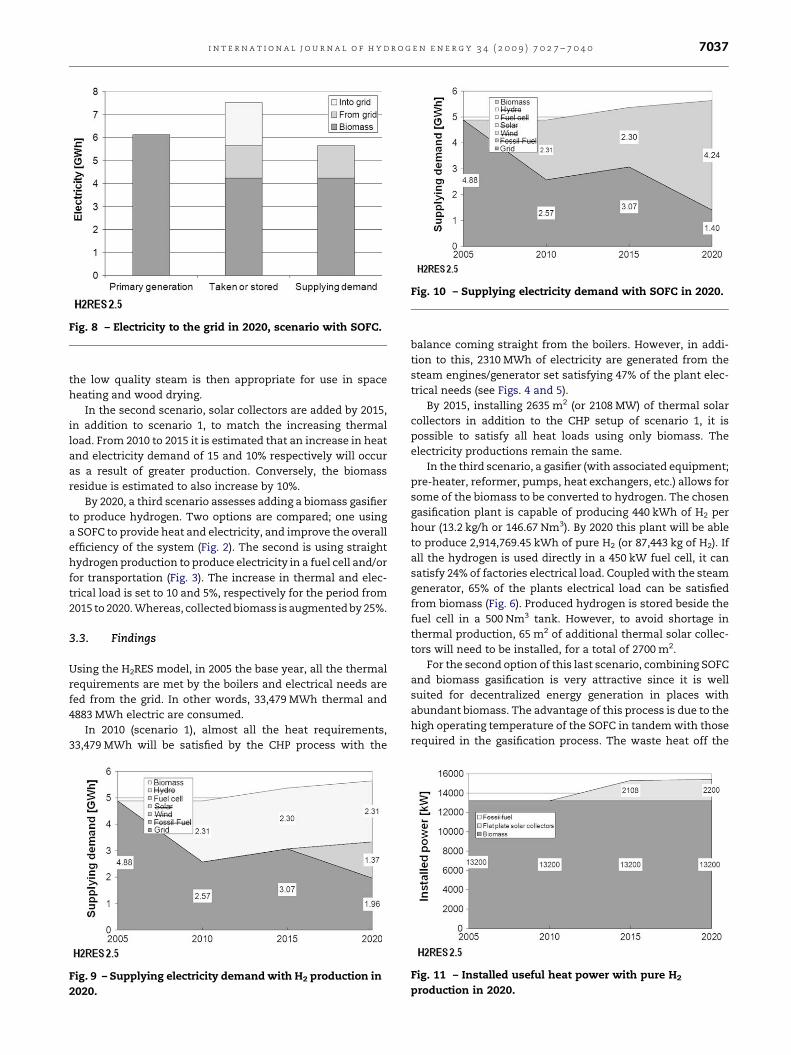
Fig. 8 – Electricity to the grid in 2020, scenario with SOFC.
Fig. 10 – Supplying electricity demand with SOFC in 2020.
i n t e r n a t i o n a l j o u r n a l o f h y d r o g e n e n e r g y 3 4 ( 2 0 0 9 ) 7 0 2 7 – 7 0 4 0 7037
the low quality steam is then appropriate for use in space
heating and wood drying.
In the second scenario, solar collectors are added by 2015,
in addition to scenario 1, to match the increasing thermal
load. From 2010 to 2015 it is estimated that an increase in heat
and electricity demand of 15 and 10% respectively will occur
as a result of greater production. Conversely, the biomass
residue is estimated to also increase by 10%.
By 2020, a third scenario assesses adding a biomass gasifier
to produce hydrogen. Two options are compared; one using
a SOFC to provide heat and electricity, and improve the overall
efficiency of the system (Fig. 2). The second is using straight
hydrogen production to produce electricity in a fuel cell and/or
for transportation (Fig. 3). The increase in thermal and elec-
trical load is set to 10 and 5%, respectively for the period from
2015 to 2020. Whereas, collected biomass is augmented by 25%.
3.3. Findings
Using the H2RES model, in 2005 the base year, all the thermal
requirements are met by the boilers and electrical needs are
fed from the grid. In other words, 33,479 MWh thermal and
4883 MWh electric are consumed.
In 2010 (scenario 1), almost all the heat requirements,
33,479 MWh will be satisfied by the CHP process with the
Fig. 9 – Supplying electricity demand with H2 production in
2020.
balance coming straight from the boilers. However, in addi-
tion to this, 2310 MWh of electricity are generated from the
steam engines/generator set satisfying 47% of the plant elec-
trical needs (see Figs. 4 and 5).
By 2015, installing 2635 m2 (or 2108 MW) of thermal solar
collectors in addition to the CHP setup of scenario 1, it is
possible to satisfy all heat loads using only biomass. The
electricity productions remain the same.
In the third scenario, a gasifier (with associated equipment;
pre-heater, reformer, pumps, heat exchangers, etc.) allows for
some of the biomass to be converted to hydrogen. The chosen
gasification plant is capable of producing 440 kWh of H2 per
hour (13.2 kg/h or 146.67 Nm3). By 2020 this plant will be able
to produce 2,914,769.45 kWh of pure H2 (or 87,443 kg of H2). If
all the hydrogen is used directly in a 450 kW fuel cell, it can
satisfy 24% of factories electrical load. Coupled with the steam
generator, 65% of the plants electrical load can be satisfied
from biomass (Fig. 6). Produced hydrogen is stored beside the
fuel cell in a 500 Nm3 tank. However, to avoid shortage in
thermal production, 65 m2 of additional thermal solar collec-
tors will need to be installed, for a total of 2700 m2.
For the second option of this last scenario, combining SOFC
and biomass gasification is very attractive since it is well
suited for decentralized energy generation in places with
abundant biomass. The advantage of this process is due to the
high operating temperature of the SOFC in tandem with those
required in the gasification process. The waste heat off the
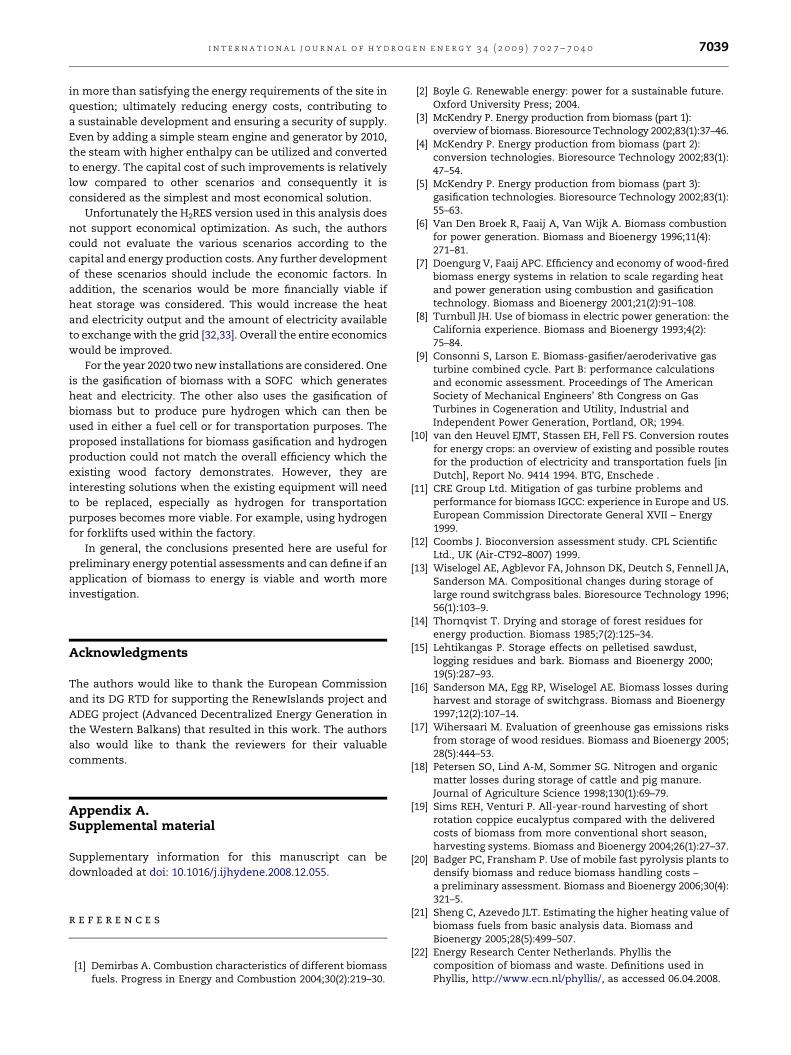
Fig. 11 – Installed useful heat power with pure H2
production in 2020.
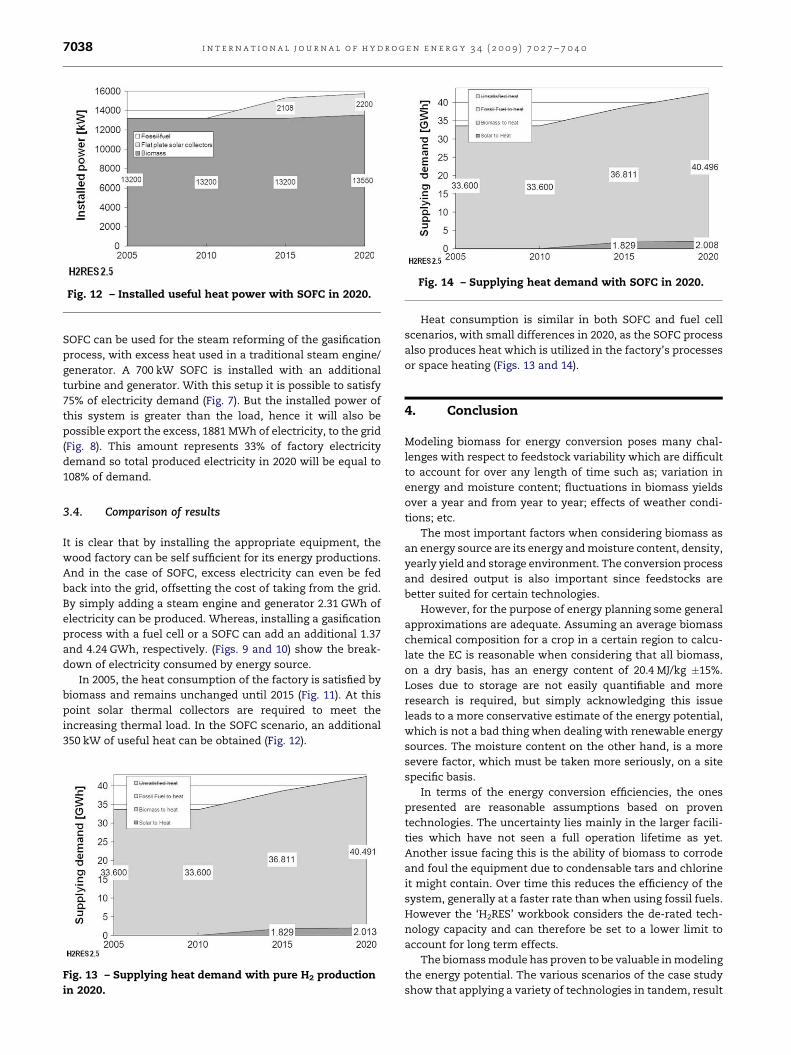
Fig. 12 – Installed useful heat power with SOFC in 2020.Fig. 14 – Supplying heat demand with SOFC in 2020.
i n t e r n a t i o n a l j o u r n a l o f h y d r o g e n e n e r g y 3 4 ( 2 0 0 9 ) 7 0 2 7 – 7 0 4 07038
SOFC can be used for the steam reforming of the gasification
process, with excess heat used in a traditional steam engine/
generator. A 700 kW SOFC is installed with an additional
turbine and generator. With this setup it is possible to satisfy
75% of electricity demand (Fig. 7). But the installed power of
this system is greater than the load, hence it will also be
possible export the excess, 1881 MWh of electricity, to the grid
(Fig. 8). This amount represents 33% of factory electricity
demand so total produced electricity in 2020 will be equal to
108% of demand.
3.4. Comparison of results
It is clear that by installing the appropriate equipment, the
wood factory can be self sufficient for its energy productions.
And in the case of SOFC, excess electricity can even be fed
back into the grid, offsetting the cost of taking from the grid.
By simply adding a steam engine and generator 2.31 GWh of
electricity can be produced. Whereas, installing a gasification
process with a fuel cell or a SOFC can add an additional 1.37
and 4.24 GWh, respectively. (Figs. 9 and 10) show the break-
down of electricity consumed by energy source.
In 2005, the heat consumption of the factory is satisfied by
biomass and remains unchanged until 2015 (Fig. 11). At this
point solar thermal collectors are required to meet the
increasing thermal load. In the SOFC scenario, an additional
350 kW of useful heat can be obtained (Fig. 12).
Fig. 13 – Supplying heat demand with pure H2 production
in 2020.
Heat consumption is similar in both SOFC and fuel cell
scenarios, with small differences in 2020, as the SOFC process
also produces heat which is utilized in the factory’s processes
or space heating (Figs. 13 and 14).
4. Conclusion
Modeling biomass for energy conversion poses many chal-
lenges with respect to feedstock variability which are difficult
to account for over any length of time such as; variation in
energy and moisture content; fluctuations in biomass yields
over a year and from year to year; effects of weather condi-
tions; etc.
The most important factors when considering biomass as
an energy source are its energy and moisture content, density,
yearly yield and storage environment. The conversion process
and desired output is also important since feedstocks are
better suited for certain technologies.
However, for the purpose of energy planning some general
approximations are adequate. Assuming an average biomass
chemical composition for a crop in a certain region to calcu-
late the EC is reasonable when considering that all biomass,
on a dry basis, has an energy content of 20.4 MJ/kg �15%.
Loses due to storage are not easily quantifiable and more
research is required, but simply acknowledging this issue
leads to a more conservative estimate of the energy potential,
which is not a bad thing when dealing with renewable energy
sources. The moisture content on the other hand, is a more
severe factor, which must be taken more seriously, on a site
specific basis.
In terms of the energy conversion efficiencies, the ones
presented are reasonable assumptions based on proven
technologies. The uncertainty lies mainly in the larger facili-
ties which have not seen a full operation lifetime as yet.
Another issue facing this is the ability of biomass to corrode
and foul the equipment due to condensable tars and chlorine
it might contain. Over time this reduces the efficiency of the
system, generally at a faster rate than when using fossil fuels.
However the ‘H2RES’ workbook considers the de-rated tech-
nology capacity and can therefore be set to a lower limit to
account for long term effects.
The biomass module has proven to be valuable in modeling
the energy potential. The various scenarios of the case study
show that applying a variety of technologies in tandem, result
i n t e r n a t i o n a l j o u r n a l o f h y d r o g e n e n e r g y 3 4 ( 2 0 0 9 ) 7 0 2 7 – 7 0 4 0 7039
in more than satisfying the energy requirements of the site in
question; ultimately reducing energy costs, contributing to
a sustainable development and ensuring a security of supply.
Even by adding a simple steam engine and generator by 2010,
the steam with higher enthalpy can be utilized and converted
to energy. The capital cost of such improvements is relatively
low compared to other scenarios and consequently it is
considered as the simplest and most economical solution.
Unfortunately the H2RES version used in this analysis does
not support economical optimization. As such, the authors
could not evaluate the various scenarios according to the
capital and energy production costs. Any further development
of these scenarios should include the economic factors. In
addition, the scenarios would be more financially viable if
heat storage was considered. This would increase the heat
and electricity output and the amount of electricity available
to exchange with the grid [32,33]. Overall the entire economics
would be improved.
For the year 2020 two new installations are considered. One
is the gasification of biomass with a SOFC which generates
heat and electricity. The other also uses the gasification of
biomass but to produce pure hydrogen which can then be
used in either a fuel cell or for transportation purposes. The
proposed installations for biomass gasification and hydrogen
production could not match the overall efficiency which the
existing wood factory demonstrates. However, they are
interesting solutions when the existing equipment will need
to be replaced, especially as hydrogen for transportation
purposes becomes more viable. For example, using hydrogen
for forklifts used within the factory.
In general, the conclusions presented here are useful for
preliminary energy potential assessments and can define if an
application of biomass to energy is viable and worth more
investigation.
Acknowledgments
The authors would like to thank the European Commission
and its DG RTD for supporting the RenewIslands project and
ADEG project (Advanced Decentralized Energy Generation in
the Western Balkans) that resulted in this work. The authors
also would like to thank the reviewers for their valuable
comments.
Appendix A.Supplemental material
Supplementary information for this manuscript can be
downloaded at doi: 10.1016/j.ijhydene.2008.12.055.
r e f e r e n c e s
[1] Demirbas A. Combustion characteristics of different biomassfuels. Progress in Energy and Combustion 2004;30(2):219–30.
[2] Boyle G. Renewable energy: power for a sustainable future.Oxford University Press; 2004.
[3] McKendry P. Energy production from biomass (part 1):overview of biomass. Bioresource Technology 2002;83(1):37–46.
[4] McKendry P. Energy production from biomass (part 2):conversion technologies. Bioresource Technology 2002;83(1):47–54.
[5] McKendry P. Energy production from biomass (part 3):gasification technologies. Bioresource Technology 2002;83(1):55–63.
[6] Van Den Broek R, Faaij A, Van Wijk A. Biomass combustionfor power generation. Biomass and Bioenergy 1996;11(4):271–81.
[7] Doengurg V, Faaij APC. Efficiency and economy of wood-firedbiomass energy systems in relation to scale regarding heatand power generation using combustion and gasificationtechnology. Biomass and Bioenergy 2001;21(2):91–108.
[8] Turnbull JH. Use of biomass in electric power generation: theCalifornia experience. Biomass and Bioenergy 1993;4(2):75–84.
[9] Consonni S, Larson E. Biomass-gasifier/aeroderivative gasturbine combined cycle. Part B: performance calculationsand economic assessment. Proceedings of The AmericanSociety of Mechanical Engineers’ 8th Congress on GasTurbines in Cogeneration and Utility, Industrial andIndependent Power Generation, Portland, OR; 1994.
[10] van den Heuvel EJMT, Stassen EH, Fell FS. Conversion routesfor energy crops: an overview of existing and possible routesfor the production of electricity and transportation fuels [inDutch], Report No. 9414 1994. BTG, Enschede .
[11] CRE Group Ltd. Mitigation of gas turbine problems andperformance for biomass IGCC: experience in Europe and US.European Commission Directorate General XVII – Energy1999.
[12] Coombs J. Bioconversion assessment study. CPL ScientificLtd., UK (Air-CT92–8007) 1999.
[13] Wiselogel AE, Agblevor FA, Johnson DK, Deutch S, Fennell JA,Sanderson MA. Compositional changes during storage oflarge round switchgrass bales. Bioresource Technology 1996;56(1):103–9.
[14] Thornqvist T. Drying and storage of forest residues forenergy production. Biomass 1985;7(2):125–34.
[15] Lehtikangas P. Storage effects on pelletised sawdust,logging residues and bark. Biomass and Bioenergy 2000;19(5):287–93.
[16] Sanderson MA, Egg RP, Wiselogel AE. Biomass losses duringharvest and storage of switchgrass. Biomass and Bioenergy1997;12(2):107–14.
[17] Wihersaari M. Evaluation of greenhouse gas emissions risksfrom storage of wood residues. Biomass and Bioenergy 2005;28(5):444–53.
[18] Petersen SO, Lind A-M, Sommer SG. Nitrogen and organicmatter losses during storage of cattle and pig manure.Journal of Agriculture Science 1998;130(1):69–79.
[19] Sims REH, Venturi P. All-year-round harvesting of shortrotation coppice eucalyptus compared with the deliveredcosts of biomass from more conventional short season,harvesting systems. Biomass and Bioenergy 2004;26(1):27–37.
[20] Badger PC, Fransham P. Use of mobile fast pyrolysis plants todensify biomass and reduce biomass handling costs –a preliminary assessment. Biomass and Bioenergy 2006;30(4):321–5.
[21] Sheng C, Azevedo JLT. Estimating the higher heating value ofbiomass fuels from basic analysis data. Biomass andBioenergy 2005;28(5):499–507.
[22] Energy Research Center Netherlands. Phyllis thecomposition of biomass and waste. Definitions used inPhyllis, http://www.ecn.nl/phyllis/, as accessed 06.04.2008.

i n t e r n a t i o n a l j o u r n a l o f h y d r o g e n e n e r g y 3 4 ( 2 0 0 9 ) 7 0 2 7 – 7 0 4 07040
[23] Lewandowski I, Clifton-Brown JC, Scurlock JMO, Huisman W.Miscanthus: European experience with a novel energy crop.Biomass and Bioenergy 2000;19(4):209–27.
[24] Belgiorno V, De Feo G, Della Rocca C, Napoli RMA. Energyfrom gasification of solid wastes. Waste Management 2003;23:1–15.
[25] Athanasiou C, Coutelieris F, Vakouftsi E, Skoulou V,Antonakou E, Marnellos G, et al. From biomass to electricitythrough integrated gasification/SOFC system-optimizationand energy balance. International Journal of HydrogenEnergy 2007;32(3):337–42.
[26] Turn S, Kinoshita C, Zhang Z, Ishimura D, Zhou J. Anexperimental investigation of hydrogen production frombiomass gasification. International Journal of HydrogenEnergy 1998;23(8):641–8.
[27] Iwasaki W. A consideration of the economic efficiency ofhydrogen production from biomass. International Journal ofHydrogen Energy 2003;28:939–44.
[28] Svaic S. Biomass properties. Renewable Energy Technology –FSB University of Zagreb; 2004.
[29] Duic N, Lerer M, Carvalho MG. Increasing the supply ofrenewable energy sources in island energy systems.International Journal of Sustainable Energy 2003;23(4):177–86.
[30] Mahishi MR, Goswami DY. An experimental study ofhydrogen production by gasification of biomass in thepresence of a CO2 sorbent. International Journal of HydrogenEnergy 2007;32(14):2803–8.
[31] Krajacic G, Martins R, Busuttila A, Duic N, da Grac-a Carvalho M.Hydrogen as an energy vector in the islands’ energy supply.International Journal of Hydrogen Energy 2008;33:1091–103.
[32] Lund H, Andersen AN. Optimal designs of small CHP plantsin a market with fluctuating electricity prices. EnergyConversion and Management 2005;46(6):893–904.
[33] Blarke MB, Lund H. The effectiveness of storage andrelocation options in renewable energy systems. RenewableEnergy 2008;33(7):1499–507.