2009 annual meeting ● assemblée annuelle 2009 halifax, nova scotia ● halifax (nouvelle-...
DESCRIPTION
Canadian Institute of Actuaries. L’Institut canadien des actuaires. 2009 Annual Meeting ● Assemblée annuelle 2009 Halifax, Nova Scotia ● Halifax (Nouvelle- Écosse ). Denise Lang Overview of the GMWB product, need it fills and impact of the economic crisis Pierre Vincent - PowerPoint PPT PresentationTRANSCRIPT

2009 Annual Meeting ● Assemblée annuelle 2009Halifax, Nova Scotia ● Halifax (Nouvelle-Écosse)
2009 Annual Meeting ● Assemblée annuelle 2009Halifax, Nova Scotia ● Halifax (Nouvelle-Écosse)
Canadian Institute
of Actuaries
Canadian Institute
of Actuaries
L’Institut canadien desactuaires
L’Institut canadien desactuaires

AGENDA
• Denise Lang• Overview of the GMWB product, need it
fills and impact of the economic crisis
• Pierre Vincent• Risks in the product – modeling, risk
appetite, risk & capital management
• Dave Wylie• Product Perspective – different
approaches to risks in the product, product changes, industry reaction
2009
Ann
ual M
eetin
g
Ass
embl
ée a
nnue
lle 2
009
2009
Ann
ual M
eetin
g
Ass
embl
ée a
nnue
lle 2
009

AGENDA
• Background - Demographic changes
• Retirement Challenges
• Needs in Retirement
• Typical GMWB (Guaranteed Minimum
Withdrawal Benefit) product features
• Impact of the economic crisis
2009
Ann
ual M
eetin
g
Ass
embl
ée a
nnue
lle 2
009
2009
Ann
ual M
eetin
g
Ass
embl
ée a
nnue
lle 2
009

Some headlines & research findings• Boomers age 47 to 60 make up roughly 22% of Canadian
population – Boomers & retirees in Canada Secondary research – July /06
• In under 10 years Canadians 55 years of age and older will control over 70% of investment assets – Investor Economics, household balance sheet report 2005
• Of leading edge boomers only 15% feel prepared for retirement, 45% feel they need same or more income – Strategic Guidance Consulting
• 50% of Canadians expect to live into their 90’s – BMO Retirement study findings quoted in Investment Executive article Jun 1 /06
• 48% of 50-something boomers are unsure of the best choices for retirement savings, 32% are worried their standard of living will drop once they reach retirement – Jonathan Chevreau, National post articles “Boomer gender battle in retirement?”, Jul 17/06 and “Stressed Boomers”, Jul 13/06
2009
Ann
ual M
eetin
g
Ass
embl
ée a
nnue
lle 2
009
2009
Ann
ual M
eetin
g
Ass
embl
ée a
nnue
lle 2
009

Changing Demographics in Canada
• Canadian population is aging
• Life expectancy continues to increase
• Implications
Consumer focus will shift from wealth accumulation to management and payout of accumulated wealth
Savings must fund a longer retirement period
Product allocation increasingly important as more baby boomers approach and enter retirement years
2009
Ann
ual M
eetin
g
Ass
embl
ée a
nnue
lle 2
009
2009
Ann
ual M
eetin
g
Ass
embl
ée a
nnue
lle 2
009

New Challenges in Retirement
• Longevity
• Interest Rates and Inflation
• Market Volatility
• Inflation
• Control and Access
2009
Ann
ual M
eetin
g
Ass
embl
ée a
nnue
lle 2
009
2009
Ann
ual M
eetin
g
Ass
embl
ée a
nnue
lle 2
009

Challenge: Market Volatility
• Investors will face their greatest risks and challenges in the few years just before and after retirement
• Choosing the right investment products is critical
2009
Ann
ual M
eetin
g
Ass
embl
ée a
nnue
lle 2
009
2009
Ann
ual M
eetin
g
Ass
embl
ée a
nnue
lle 2
009

Accumulation Phase Same Average Return = Same Accumulation Result
2009
Ann
ual M
eetin
g
Ass
embl
ée a
nnue
lle 2
009
2009
Ann
ual M
eetin
g
Ass
embl
ée a
nnue
lle 2
009 Accumulation
$0
$50,000
$100,000
$150,000
$200,000
$250,000
$300,000
$350,000
$400,000
0 1 2 3 4 5 6 7 8 9 10 11 12 13 14 15 16 17 18 19 20 21 22 23 24 25
Average return is key during accumulation

Payout PhaseSequence of returns makes a big difference
in the distribution phase
2009
Ann
ual M
eetin
g
Ass
embl
ée a
nnue
lle 2
009
2009
Ann
ual M
eetin
g
Ass
embl
ée a
nnue
lle 2
009
Distribution
$793,304
$0
$0
$200,000
$400,000
$600,000
$800,000
$1,000,000
$1,200,000
$1,400,000
$1,600,000
0 1 2 3 4 5 6 7 8 9 10 11 12 13 14 15 16 17 18 19 20 21 22 23 24 25
Strong Early ReturnsReversed: Poor Early Returns

What do Canadians want?• The majority of Canadians prefer a
monthly income stream in retirement
• Many are concerned that they may outlive their savings
• Canadians will have a strong preference for products that provide
• risk management
• income management
• tax efficiency
• GMWB products designed for these needs
2009
Ann
ual M
eetin
g
Ass
embl
ée a
nnue
lle 2
009
2009
Ann
ual M
eetin
g
Ass
embl
ée a
nnue
lle 2
009

GMWB Products• Income is predictable, sustainable and
potentially increasing
• Products allow investments in a variety of funds – usually a limit on equity exposure
• Initially a 20 year guarantee - now ‘for life’
• Upside potential in guarantees
– resets - lock in market gains
– Annual bonus (on guarantee withdrawal balance) if no withdrawal taken
2009
Ann
ual M
eetin
g
Ass
embl
ée a
nnue
lle 2
009
2009
Ann
ual M
eetin
g
Ass
embl
ée a
nnue
lle 2
009

How do guarantees work?
Product example:• Lifetime guarantee 5% p.a. if start at age 65
• 5% bonus on WB annually if no withdrawals
• Guaranteed value resets every 3rd anniversary
• 100% Death benefit
• Client deposits $500,000
At issue:
• Guaranteed Withdrawal Benefit = $500,000
• Death Benefit Guarantee = $500,000
2009
Ann
ual M
eetin
g
Ass
embl
ée a
nnue
lle 2
009
2009
Ann
ual M
eetin
g
Ass
embl
ée a
nnue
lle 2
009
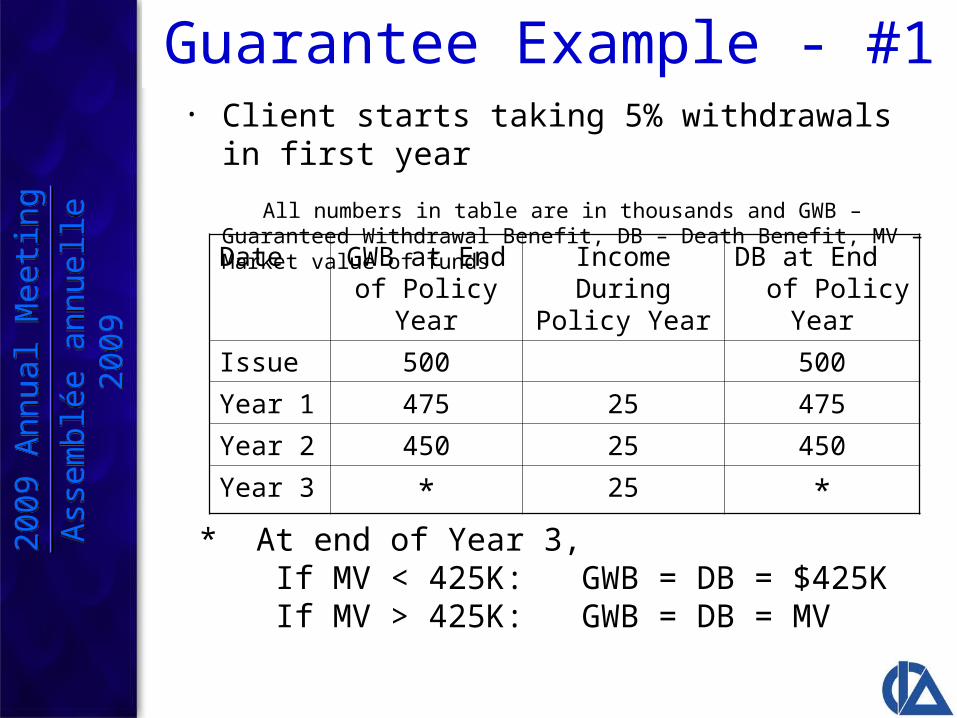
Guarantee Example - #1• Client starts taking 5% withdrawals in first year All numbers in table are in thousands and GWB – Guaranteed Withdrawal
Benefit, DB – Death Benefit, MV – Market value of funds
2009
Ann
ual M
eetin
g
Ass
embl
ée a
nnue
lle 2
009
2009
Ann
ual M
eetin
g
Ass
embl
ée a
nnue
lle 2
009
* At end of Year 3, If MV < 425K: GWB = DB = $425K If MV > 425K: GWB = DB = MV
Date GWB at End of Policy Year
Income During Policy Year
DB at End of Policy Year
Issue 500 500
Year 1 475 25 475
Year 2 450 25 450
Year 3 * 25 *
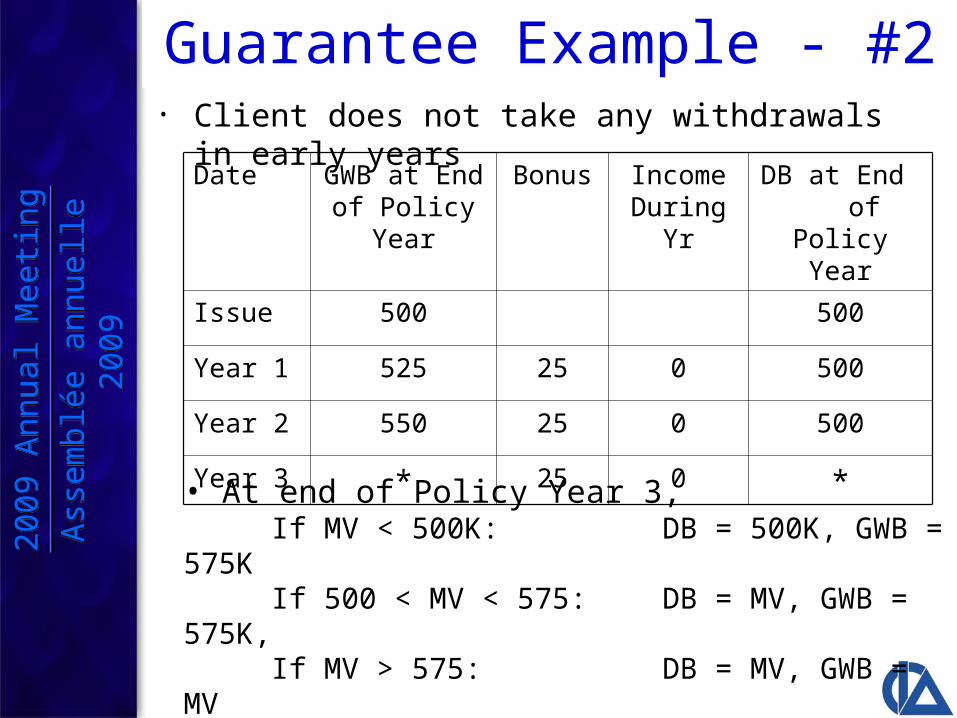
Guarantee Example - #2• Client does not take any withdrawals in early years
2009
Ann
ual M
eetin
g
Ass
embl
ée a
nnue
lle 2
009
2009
Ann
ual M
eetin
g
Ass
embl
ée a
nnue
lle 2
009
• At end of Policy Year 3, If MV < 500K: DB = 500K, GWB = 575K If 500 < MV < 575: DB = MV, GWB = 575K, If MV > 575: DB = MV, GWB = MV• If MV > 500K at 3rd anniversary, the annual bonus amount will typically be reset to 5% of that MV going forward
Date GWB at End of Policy Year
Bonus Income During Yr
DB at End of Policy Year
Issue 500 500
Year 1 525 25 0 500
Year 2 550 25 0 500
Year 3 * 25 0 *

Impact of the Economic Crisis• Reserves and required capital are typically very small at
issue for GMWB products
• When equity market declines occur, actuarial liabilities and capital increase considerably even though
– benefits are very long dated with guarantees stretching many years into the future
– guaranteed benefits cannot be accelerated by the policyholder
– the best estimate liability for the guarantees is typically very small compared to the liability required
• Reserves and capital can also be very sensitive to interest rate changes
2009
Ann
ual M
eetin
g
Ass
embl
ée a
nnue
lle 2
009
2009
Ann
ual M
eetin
g
Ass
embl
ée a
nnue
lle 2
009

Impact of the Economic Crisis
The increases in reserves and capital have
caused companies to take a number of
actions, including:
– Raising capital
– Increasing risk management activities
(e.g. hedging, reinsurance)
– Product design and pricing changes to
reduce risks
2009
Ann
ual M
eetin
g
Ass
embl
ée a
nnue
lle 2
009
2009
Ann
ual M
eetin
g
Ass
embl
ée a
nnue
lle 2
009