2008 emergency surviving future risks management
TRANSCRIPT

Our national Risk Assessment Framework
How does computer modelling help us to assess tsunami risk?
How do long-term databases help us to assess
weather-related risks?
Assessing risk
▲▲▲▲▲▲▲
▲▲▲▲▲▲▲▲
▲▲▲▲▲▲▲▲
▲▲▲▲▲▲▲▲
▲
EmERgEncy
mAnAgEmEnt
AustRAliA
And gEOsciEncE
AustRAliA
SPECIAL
EDITION
EMA invites you to help shape the future of
Australian emergency
management.
Surviving Future Risks
AdvertPrintNew.indd 1 21/4/08 1:39:16 PM
the Australian Journal of
Emergency Management
‘safer sustainable communities’
GR
EY
1579
4
Vo
l 23 n
o 4
NO
VEM
BER
2008
Vol 23 no 4 NOVEMBER 2008
EARLY BIRD
REGISTRATIONS
CLOSE 17 DECEMBER 2008
historical snapshot©
New
spix
Cover shows a number of images depicting a range of hazard, exposure and vulnerability data sets and techniques used in ‘all hazards’ risk assessment.
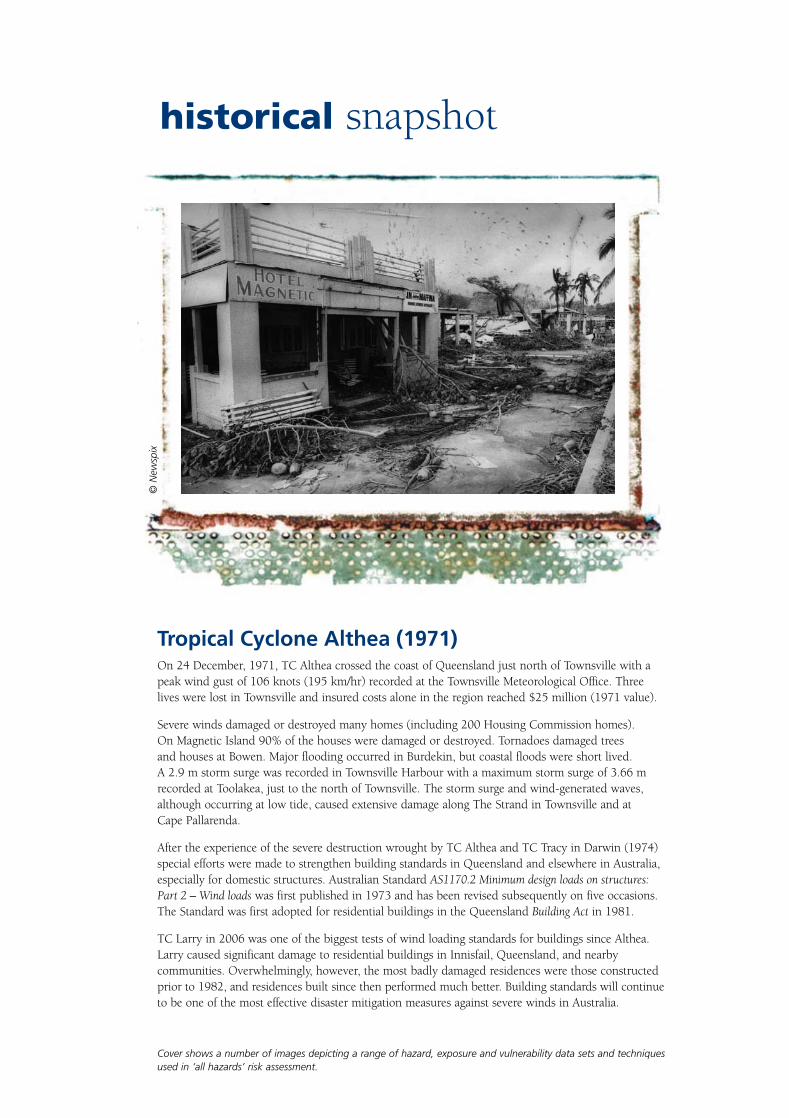
Tropical Cyclone Althea (1971)On 24 December, 1971, TC Althea crossed the coast of Queensland just north of Townsville with a peak wind gust of 106 knots (195 km/hr) recorded at the Townsville Meteorological Office. Three lives were lost in Townsville and insured costs alone in the region reached $25 million (1971 value).
Severe winds damaged or destroyed many homes (including 200 Housing Commission homes). On Magnetic Island 90% of the houses were damaged or destroyed. Tornadoes damaged trees and houses at Bowen. Major flooding occurred in Burdekin, but coastal floods were short lived. A 2.9 m storm surge was recorded in Townsville Harbour with a maximum storm surge of 3.66 m recorded at Toolakea, just to the north of Townsville. The storm surge and wind-generated waves, although occurring at low tide, caused extensive damage along The Strand in Townsville and at Cape Pallarenda.
After the experience of the severe destruction wrought by TC Althea and TC Tracy in Darwin (1974) special efforts were made to strengthen building standards in Queensland and elsewhere in Australia, especially for domestic structures. Australian Standard AS1170.2 Minimum design loads on structures: Part 2 – Wind loads was first published in 1973 and has been revised subsequently on five occasions. The Standard was first adopted for residential buildings in the Queensland Building Act in 1981.
TC Larry in 2006 was one of the biggest tests of wind loading standards for buildings since Althea. Larry caused significant damage to residential buildings in Innisfail, Queensland, and nearby communities. Overwhelmingly, however, the most badly damaged residences were those constructed prior to 1982, and residences built since then performed much better. Building standards will continue to be one of the most effective disaster mitigation measures against severe winds in Australia.
‘safer sustainable communities’
National Emergency Volunteer Support Fund
There is general acceptance that climate change is likely to result in an increased frequency and severity of emergencies including heatwave, severe storms, floods, tropical cyclones and, indirectly, serious bushfire. These events have significant economic consequences but also impact adversely on the lives of individuals, families and communities, particularly the vulnerable members of our communities.
Of vital importance in protecting communities from the effects of emergencies is our national pool of volunteers who represent a critical element of Australia’s national emergency management capability. Those volunteers play a significant role in assisting communities in responding to and recovering from the impact of emergencies. Some 500,000 people in Australia volunteer their services in some emergency management capacity and 350,000 of those are directly involved in emergency first response, principally through the various rural fire services and the State Emergency Services.
To ensure ongoing protection of communities it is critical that all volunteer agencies maintain their current levels of staffing and training.
The Australian Government is offering funding in 2009/10 through the National Emergency Volunteer Support Fund for projects which specifically address the recruitment, retention and training of
volunteers. The Fund is managed by Emergency Management Australia (EMA), a Division within the Attorney-General’s Department.
The Attorney-General, Robert McClelland, will soon be seeking grant applications from eligible organisations.
How to Apply
Applications will be invited from late November 2008. Guidelines, application forms and details on how to apply will be available on the EMA website or by contacting the Community Engagement team at EMA after that date.
Email: [email protected]
Phone: 02 6256 4608
Fax: 02 6256 4653
Website: www.ema.gov.au/communityengagement
The closing date for applications is Friday 6 March 2009.

ContentsVol 23 No 4 November 2008
Please note that contributions to the Australian Journal of Emergency Management are reviewed. Academic papers (denoted by ) are peer reviewed to appropriate academic standards by independent, qualified experts.
FOREWORD 2
Communiqué 3
Advances in risk assessment for Australian emergency management 4Trevor Jones introduces the first of our two special all hazards risk assessment editions of the Australian Journal of Emergency Management.
Assessing risk from meteorological phenomena using limited and biased databases 9Alan Sharp discusses a number of meteorological databases and briefly evaluates their usefulness in risk assessment.
Assessing the impacts of tropical cyclones 14Using Darwin as a test case, Craig Arthur, Anthony Schofield and Bob Cechet assess the benefits of Geoscience Australia’s Tropical Cyclone Risk Modelling tool in assessing the potential impact of a tropical cyclone.
Flood risk management in Australia 21The National Flood Risk Advisory Group introduces and discusses the National Flood Risk Management Guideline.
Australian Safer Community Awards 28
Tsunami planning and preparation in Western Australia: 30 application of scientific modelling and community engagementHall, Stevens and Sexton explain how a leading-edge tsunami impact assessments project combines science, technology and spatial data.
Policy implications of future increases in extreme weather events due to climate change 37Karl Sullivan of the Insurance Council of Australia outlines the shifts required to increase future communities’ resilience to more extreme weather events.
The cost of natural disasters in Australia: the case for disaster risk reduction 43Ryan Crompton and John McAneney examine the cost to Australia of natural disasters.
Phoenix: development and application of a bushfire risk management tool 47Tolhurst, Shields and Chong discuss the bushfire risk management model being developed by the Bushfire CRC.
R
‘safer sustainable communities’
The Australian Journal of Emergency ManagementVol. 23 No. 4, November 2008 ISSN: 1324 1540
PUBLISHERThe Australian Journal of Emergency Management is the official journal of Emergency Management Australia, a Division of the Federal Attorney-General’s Department, and is the nation’s most highly rated journal in its field. The purpose of the Journal is to build capacity in the emergency management industry in Australia. It provides access to information and knowledge for an active emergency management research community and practitioners of emergency management.
EDITOR-IN-CHIEFTony Pearce, Director General, Emergency Management Australia.
AJEM ADVISORY COMMITTEEChristine Jenkinson, Emergency Management AustraliaRoger Jones, Director, Board of the Victoria State Emergency Service AuthorityChas Keys, formerly of NSW State Emergency ServiceGraham Dwyer, Department of Justice, VictoriaProf Jennifer McKay, University of South AustraliaAndrew Coghlan, Australian Red Cross, MelbourneDavid Parsons, Sydney Water Corporation Cate Moore, Emergency Management Australia Morrie Bradley, Emergency Management Australia
PUBLISHER and EDITORIAL TEAMGrey Worldwide CanberraManager, Chris Robey Editor, Anita CleaverDesign and Typesetting by Grey Worldwide
CIRCULATIONPublished on the last day of August, November, February and May each year. Copies are distributed quarterly without charge to subscribers throughout Australia and overseas.
COPYRIGHTMaterial in The Australian Journal of Emergency Management is protected under the Commonwealth Copyright Act 1968. No material may be reproduced in part or in whole without written consent from the copyright holders. The views in this journal are not necessarily the views of Emergency Management Australia.
SUBMISSIONSThe Australian Journal of Emergency Management welcomes submissions. Please contact us on [email protected] for a copy of our Contributors’ Guidelines. Articles for publication may be forwarded to:
The Australian Journal of Emergency ManagementMain Road MT MACEDON VIC 3441
SUBSCRIPTIONS & SUBSCRIPTION ENQUIRIES For your free subscription contact us atEmail: [email protected] or fax 03 5421 5272 Or visit us online at www.ema.gov.au/ajemChanges to subscription details can be made by emailing [email protected]
EDITORIAL ENQUIRIES ONLYTel: (02) 6295 3662

2
The Australian Journal of Emergency Management, Vol. 23 No. 4, November 2008
AJEM FOREWORDBy Tony Pearce, Director General, Emergency Management Australia.
The aim of emergency management in Australia is to reduce disaster risk and increase disaster resilience. To achieve this we need reliable and valid information on hazards, society, infrastructure and the environment. Using this information we can develop an evidence- base of the risks that we face and thus target our management of risk.
Risk assessment in the field of emergency management is not new. EMA (then the Natural Disasters Organisation) and other partners developed a process for hazard analysis in 1985 and used this process in professional education for some years. In 1995, we began development of emergency risk management guidelines based on the draft Australian Standard on risk management. This gave us concepts, processes and language that were shared by other government sectors and the private sector, which allowed closer collaboration in managing emergency and disaster risks.
Now, the Australian Standard has been enhanced and adopted by the international community as ISO31000. One of the keys to the process described in ISO31000 is effective risk assessment.
Working with expert organisations such as Geoscience Australia and the Bureau of Meteorology, Australians will be able to access high quality information to inform decision-making on how to manage risk.
Current issues in assessing risk across Australia include:
• howdoweensureacoordinatedandconsistentapproach to risk assessment across the nation?
• howdowebestworkacrossgovernmentandwiththe private and not-for-profit sectors?
• howdowebringdecision-makersandcommunitieswith us?
• howdoweensuretherightpeoplegettherightinformation at the right time?
The articles in this special issue of AJEM address these questions through reports on some of the many current projects and trends in Australian risk assessment. The next issue in February 2009 will include articles on how risk assessment fits within current risk management projects and programs.
One of our main challenges for the future, a future of increasing uncertainty and change in the face of climate change, is to ensure an all-hazards and whole-of-government approach to reducing disaster risk and increasing disaster resilience. Risk assessment informs our consultation, decision-making and action in meeting this challenge.
Tony Pearce, Director General, Emergency Management Australia
Tony Pearce, Director General, Emergency Management Australia and Dr Neil Williams, Chief Executive Officer, Geoscience Australia.

3
The Australian Journal of Emergency Management, Vol. 23 No. 4, November 2008
The cooperation and goodwill between Ministers responsible for emergency management continued in the second meeting for 2008 of the Ministerial Council for Police and Emergency Management (MCPEM-EM), held in Sydney.
Chaired by the Australian Attorney-General Robert McClelland, the Ministerial Council also comprises State and Territory government and New Zealand ministers, and the Australian Local Government Association.
The Council unanimously agreed that the future direction for Australian emergency management should be based on creating a more disaster resilient Australia through:
• furtherdevelopmentofaNationalCatastrophicDisaster Plan;
• improvingvolunteerattractionandretention;
• developmentofclimatechangeadaptationstrategiesfor the emergency management sector;
• buildingastrategyforenhancingnationalpartnerships with the private sector and NGOs; and
• developmentofnationalstrategiesforcommunityengagement, education and enhancing self reliance and recovery.
Climate change was recognised as a very significant strategic issue for emergency management. The Council resolved to develop a MCPEM-EM climate change action plan.
The Council also endorsed the draft Australian Emergency Management Arrangements. These arrangements describe how Australia collectively approaches the management of emergencies including catastrophic disaster events and how the arrangements will assist in creating more informed and safer communities that are better able to withstand natural disasters.
The Council acknowledged the invaluable contribution of volunteers in emergency management. Options to attract, support and retain volunteers in emergency management are being developed, with an action plan to be released in 2009.
Recognising that disasters do not always confine themselves to jurisdictional boundaries, and that no single organisation or government in Australia can successfully address disaster risk alone, the Council agreed to further develop national partnerships between governments, the private sector and NGOs.
These partnerships would build on each other’s strengths and innovations, assisting more effective and efficient community engagement in emergency management.
CommuniquéMinisterial Council for Police and Emergency Management – Emergency Management
Sydney, 6 November 2008
MEMBERS OF THE MINISTERIAL COUNCIL ARE:
The Hon Robert McClelland (Australian Government Attorney-General, Chair) Cr Paul Bell AM (President, Australian Local Government Association) The Hon Neil Roberts (QLD) The Hon Tony Kelly (NSW)
The Hon Bob Cameron (VIC) The Hon Michael Wright (SA) The Hon Rob Johnson (WA) (absent) The Hon Jim Cox (TAS) The Hon Paul Henderson (NT) (absent) Mr Simon Corbell (ACT) (absent) The Hon Rick Barker (NZ) (absent)
MEMBERS OF THE MINISTERIAL COUNCIL ARE:
4
The Australian Journal of Emergency Management, Vol. 23 No. 4, November 2008
AbstractThis paper is an introduction to the two AJEM Special Issues on risk assessment. The role of risk assessment in emergency management in Australia is firmly established. Considerable progress has been made in utilising risk modelling tools and supporting data to develop new information on risk for some hazards. Several key achievements relating to the governance and science of natural disaster risk assessment are highlighted here and, while significant further work is required to reach an understanding of all hazards risks nationally, the way forward is clear.
Introduction
In the early part of this century, risk management became a fundamental principle of Emergency Management in Australia, partially influenced by the publication of the Australian/New Zealand Standard AS/NZS 4360 in 1995. This standard was revised in 1999 and 2004 (AS/NZS 4360: 2004), and a similar international standard is being prepared (ISO, 2007).
The risk management approach was promoted nationally through the Emergency Risk Management Applications Guide in 2000 and its revised version in 2004 (EMA, 2004). However, the most influential steps that led emergency managers across Australia to adopt risk management were the publication of two reports for the Council of Australian Governments (COAG). The first report to COAG on the management of natural disasters in Australia advocated ‘a fundamental shift in focus towards cost-effective, evidence-based disaster mitigation’ (High Level Group, 2002, p.3). A second national inquiry, this time on bushfires, advocated risk management and stated a vision for 2020 that ‘Decisions about bushfire mitigation and management are made within a risk-management framework …’ (COAG, 2005, p.1).
According to the AS/NZS Standard, risk assessment is an intrinsic function of the risk management process and subsequently risk assessment has also become a core
part of emergency management (AS/NZS 4360:2004, Fig. 2.1). We are unable to reproduce this figure for copyright reasons. Together, risk assessment and risk management are vital tools across Planning, Preparation, Response and Recovery (PPRR). However, the unique benefit of risk assessment to emergency management, unavailable from other means, is the ability to identify and describe future events that can be mitigated or prevented by long term, strategic risk reduction measures. These events can include extreme-impact events that may not have been experienced previously.
Many of the major recommendations of the report to COAG on natural disasters were acted upon swiftly. In the May 2003 federal budget, the Disaster Mitigation Australia Package (DMAP) was announced, managed at the Australian Government level by the (then) Department of Transport and Regional Services (DOTARS). DMAP included the highly successful Natural Disasters Mitigation Programme (NDMP), now managed by Emergency Management Australia (EMA).
The report to COAG on natural disasters set out its first Reform Commitment, ‘A five-year national programme of systematic and rigorous disaster risk assessments’. This reform was required because there was a ‘lack of independent and comprehensive systematic natural disaster risk assessments, and natural disaster data and analysis.’ DOTARS engaged Geoscience Australia (GA) as a technical advisor on risk assessment and data collection in DMAP.
The National Risk Assessment framework
The development of the National Risk Assessment Framework (NRAAG, 2007) is a milestone in establishing national arrangements to improve our knowledge of natural hazard risks in Australia. The framework was developed collaboratively by the Australian, State and Territory governments, the Australian Local Government Association, academics and representatives from the insurance industry and peak national professional organisations. It was endorsed by the Australian Emergency Management Committee (AEMC) in September 2006.
Advances in risk assessment for Australian emergency management
Trevor Jones introduces the first of our two special all hazards risk assessment editions of the Australian Journal of Emergency Management.

5
The Australian Journal of Emergency Management, Vol. 23 No. 4, November 2008
The main goal for the National Risk Assessment Framework is ‘To support the development of an evidence base for effective risk management decisions, thereby delivering the outcomes sought in Reform Commitment 1 of the report to COAG ‘Natural Disasters in Australia’’.
Three key areas are identified to achieve the goals of this framework. These are:
• agreementonrolesintheframework,withanemphasis on governance, and structures for reporting and review;
• consistentandsystematicproductionofbaselineinformation on risk and improvement of risk assessment methods and tools; and
• managementofinformationincludingenabling access to information on risk.
An outline of the main governmental roles and communication lines for the National Risk Assessment Framework is shown in Figure 1. Two committees have been formed to implement the framework. These are the Technical Risk Assessment Advisory Committee (TRAAC) and the National Risk Assessment Advisory Group (NRAAG), also shown in Figure 1.
Progress
Major progress has been made on risk assessment projects in the past four years through national grant schemes including NDMP, EMA’s Local Grants Scheme and other initiatives. The Bushfire Cooperative Research
Centre has also directed its research increasingly towards risk management and risk assessment (www.bushfirecrc.com/). Although considerable efforts are still required, several key national achievements have been made and these are outlined below.
The major report ‘Natural Hazards in Australia’ (Middelmann, 2007) provides an overview of the rapid onset natural hazards which impact on Australian communities, including tropical cyclone, flood, severe storm, bushfire, landslide, earthquake and tsunami events. Emphasis is placed on identifying risk analysis requirements for these hazards.
A draft set of National Risk Assessment Priorities has been prepared by NRAAG and TRAAC in consultation with the national framework stakeholders. Expanding on these priorities is not in the scope of this paper and the priorities are in draft form. However, in brief, the priorities cover:
• floods;
• tropicalcyclones;
• otherseverestorms;
• earthquakes;
• tsunami;
• improvedknowledgeandmodelsforcommunityexposure and vulnerability; and
• nationalelevationandbathymetricdataespeciallyincoastal areas.
Figure 1: Main governance roles in National Risk Assessment Framework. Key advisory groups are shaded.
LGPMC Local Government and Planning Ministers’ CouncilMCPEM-EM Ministerial Council for Police and Emergency Management - Emergency ManagementNSIM National Spatial and Information Management Working GroupNFRAG National Flood Risk Advisory Group

6
The Australian Journal of Emergency Management, Vol. 23 No. 4, November 2008
National Emergency Risk Assessment Guidelines are being developed by NRAAG and TRAAC and trialled in pilot projects as this Issue goes to publication. The guidelines will:
• bebasedonAS/NZS4360,andbedesignedforemergency risk assessments at state, regional (sub state) and local application;
• provideusableresultsbothwithandwithoutdetailed information inputs, so that priorities can be determined; and
• facilitateoutputsthatarecomparableandconsistent,so that they are able to be aggregated up to a national level, in principle.
Significant progress on the development of modelling tools and supporting data has also been achieved. Many of the major advances in developing and applying risk assessment tools in Australia are featured in the two Special Issues.
The AJEM special issues on risk assessment
The two AJEM Special Issues (this Issue and a further Special Issue in February 2009) give some outstanding examples of progress in Australia on risk assessment in emergency management. The Special Issues inform the reader of key areas of activity in Australian risk assessment, illustrating these activities with a series of state of the art papers. The geographic scale of the papers ranges from local to national and papers on earthquakes, tsunami, cyclones, severe storms, floods, fires and landslides are included. The papers cover many topics such as the development of computational risk assessment techniques, the need for supporting data, the role of risk assessment in risk management, progress made and future directions.
This Special Issue has the theme ‘Assessing Risk’ and its papers address current progress and future directions of risk assessment for the draft set of priority natural hazards in the National Risk Assessment Framework. The papers collectively give a national overview of current all hazards risk assessment including the methods, data requirements, and issues from a government and insurance industry point of view.
The February Special Issue has the theme ‘Assessing Risk and Risk Management’. The Issue contains some outstanding examples of risk management projects that employ risk assessment practices to enhance decision making. The projects are at a range of scales including local government, community, state/territory and regional. They cover several major topics including government and insurance treatment of coastal flooding and managing the fire-community interface. A paper on landslide risk management for Australia is included, and
we are also fortunate to include a paper on planning guidelines for landslide in New Zealand.
The reader is encouraged to investigate and enjoy the many advances reported by practitioners in the two Special Issues. Naturally, not all the progress that has been made can be included in a score of papers and the reader can find further information from Middelmann (2007) and from federal, state/territory and local organisations and their web sites.
The way ahead
The way ahead is very positive and clear in principle at least. Risk assessment tools can be constructed and the required critical datasets can be identified and assembled, as has been demonstrated in tsunami impact assessment, both nationally and in several states (see the paper by Hall and others in this Issue). Cooperative governance arrangements are also established through the National Risk Assessment Framework and the AEMC.
In addition, energetic efforts are being made in climate change programs to determine the future impacts on communities from meteorological, climatic and demographic risks. There is a significant and urgent demand for this information from government and industry. Fortunately, the information on risk required, and techniques employed to obtain it, are quite similar to those in emergency management, with the main exception that future changes to the hazards also need to be considered. Careful linking of risk assessment programs in emergency management with those in climate change will lead to accelerated gains in understanding natural hazard risks. One initiative making that link is the National Adaptation Research Plan for Disaster Management and Emergency Services (www.climatechange.gov.au/).
Although significant progress has been made, several challenges to achieving an understanding of all hazard risks remain. First and foremost, significant funds are required to maintain or increase current risk assessment programs and these programs compete against other government priorities for funding. Delays in progress need to be avoided to hold the interest of government stakeholders.
Developing quantitative risk modelling tools and data can be relatively costly (although not compared to the gains made through mitigation) and can take several years. The trade-off between delivering rapid information on risk (which may have high levels of uncertainty and have been derived using simplistic methods) versus delivering more comprehensive information in a longer time frame, and at a greater cost, requires closer attention. A pertinent question is: how good does the information on risk need to be now?
7
The Australian Journal of Emergency Management, Vol. 23 No. 4, November 2008
The National Emergency Risk Assessment Guidelines, currently being prepared, set out an initial, largely qualitative risk assessment process. This can be followed by a second phase of more quantitative studies should the risks appear significant, confidence in the results be low or more information be required for risk treatment decisions.
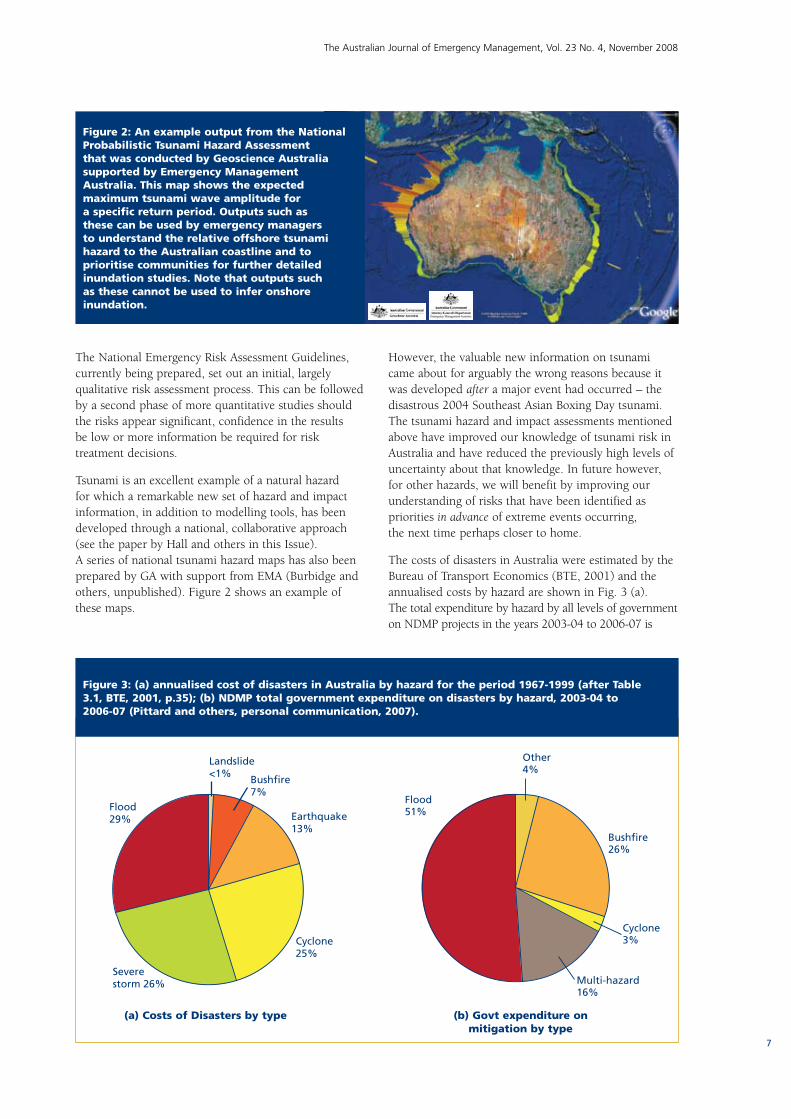
Tsunami is an excellent example of a natural hazard for which a remarkable new set of hazard and impact information, in addition to modelling tools, has been developed through a national, collaborative approach (see the paper by Hall and others in this Issue). A series of national tsunami hazard maps has also been prepared by GA with support from EMA (Burbidge and others, unpublished). Figure 2 shows an example of these maps.
However, the valuable new information on tsunami came about for arguably the wrong reasons because it was developed after a major event had occurred – the disastrous 2004 Southeast Asian Boxing Day tsunami. The tsunami hazard and impact assessments mentioned above have improved our knowledge of tsunami risk in Australia and have reduced the previously high levels of uncertainty about that knowledge. In future however, for other hazards, we will benefit by improving our understanding of risks that have been identified as priorities in advance of extreme events occurring, the next time perhaps closer to home.
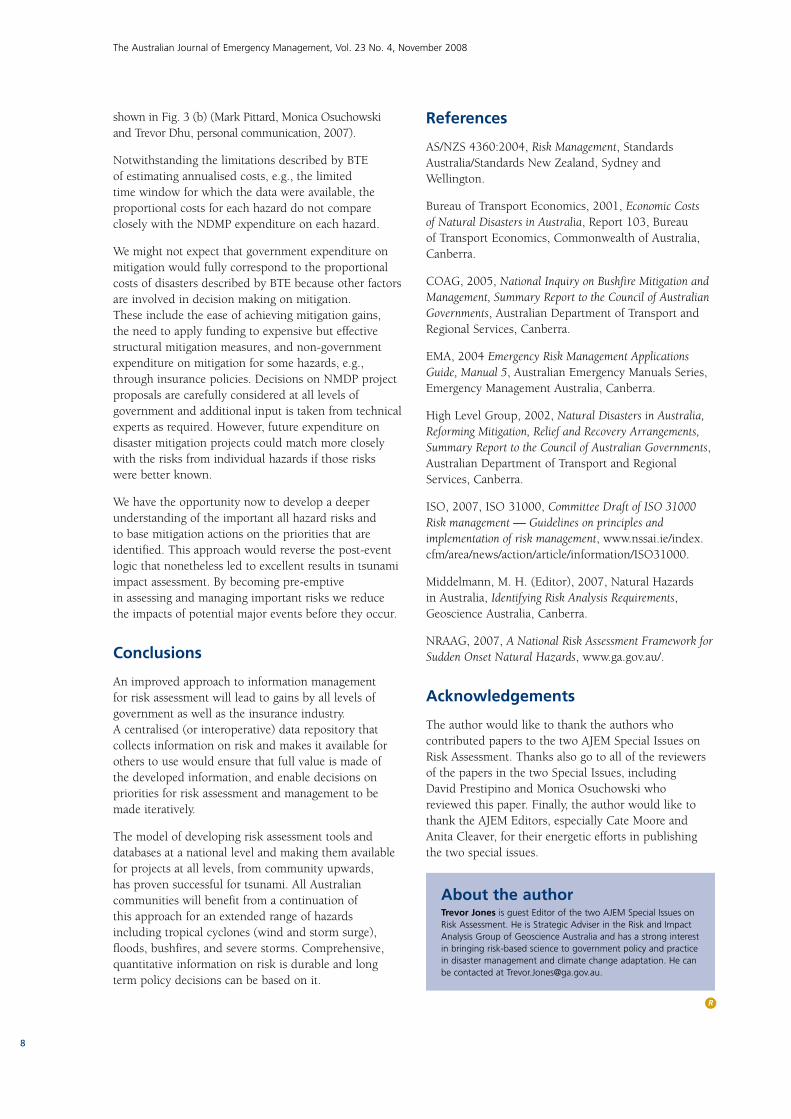
The costs of disasters in Australia were estimated by the Bureau of Transport Economics (BTE, 2001) and the annualised costs by hazard are shown in Fig. 3 (a). The total expenditure by hazard by all levels of government on NDMP projects in the years 2003-04 to 2006-07 is
Figure 2: An example output from the National Probabilistic Tsunami Hazard Assessment that was conducted by Geoscience Australia supported by Emergency Management Australia. This map shows the expected maximum tsunami wave amplitude for a specific return period. Outputs such as these can be used by emergency managers to understand the relative offshore tsunami hazard to the Australian coastline and to prioritise communities for further detailed inundation studies. Note that outputs such as these cannot be used to infer onshore inundation.
Figure 3: (a) annualised cost of disasters in Australia by hazard for the period 1967-1999 (after Table 3.1, BTE, 2001, p.35); (b) NDMP total government expenditure on disasters by hazard, 2003-04 to 2006-07 (Pittard and others, personal communication, 2007).
(a) Costs of Disasters by type (b) Govt expenditure on mitigation by type
8
The Australian Journal of Emergency Management, Vol. 23 No. 4, November 2008
shown in Fig. 3 (b) (Mark Pittard, Monica Osuchowski and Trevor Dhu, personal communication, 2007).
Notwithstanding the limitations described by BTE of estimating annualised costs, e.g., the limited time window for which the data were available, the proportional costs for each hazard do not compare closely with the NDMP expenditure on each hazard.
We might not expect that government expenditure on mitigation would fully correspond to the proportional costs of disasters described by BTE because other factors are involved in decision making on mitigation. These include the ease of achieving mitigation gains, the need to apply funding to expensive but effective structural mitigation measures, and non-government expenditure on mitigation for some hazards, e.g., through insurance policies. Decisions on NMDP project proposals are carefully considered at all levels of government and additional input is taken from technical experts as required. However, future expenditure on disaster mitigation projects could match more closely with the risks from individual hazards if those risks were better known.
We have the opportunity now to develop a deeper understanding of the important all hazard risks and to base mitigation actions on the priorities that are identified. This approach would reverse the post-event logic that nonetheless led to excellent results in tsunami impact assessment. By becoming pre-emptive in assessing and managing important risks we reduce the impacts of potential major events before they occur.
Conclusions
An improved approach to information management for risk assessment will lead to gains by all levels of government as well as the insurance industry. A centralised (or interoperative) data repository that collects information on risk and makes it available for others to use would ensure that full value is made of the developed information, and enable decisions on priorities for risk assessment and management to be made iteratively.
The model of developing risk assessment tools and databases at a national level and making them available for projects at all levels, from community upwards, has proven successful for tsunami. All Australian communities will benefit from a continuation of this approach for an extended range of hazards including tropical cyclones (wind and storm surge), floods, bushfires, and severe storms. Comprehensive, quantitative information on risk is durable and long term policy decisions can be based on it.
References
AS/NZS 4360:2004, Risk Management, Standards Australia/Standards New Zealand, Sydney and Wellington.
Bureau of Transport Economics, 2001, Economic Costs of Natural Disasters in Australia, Report 103, Bureau of Transport Economics, Commonwealth of Australia, Canberra.
COAG, 2005, National Inquiry on Bushfire Mitigation and Management, Summary Report to the Council of Australian Governments, Australian Department of Transport and Regional Services, Canberra.
EMA, 2004 Emergency Risk Management Applications Guide, Manual 5, Australian Emergency Manuals Series, Emergency Management Australia, Canberra.
High Level Group, 2002, Natural Disasters in Australia, Reforming Mitigation, Relief and Recovery Arrangements, Summary Report to the Council of Australian Governments, Australian Department of Transport and Regional Services, Canberra.
ISO, 2007, ISO 31000, Committee Draft of ISO 31000 Risk management — Guidelines on principles and implementation of risk management, www.nssai.ie/index.cfm/area/news/action/article/information/ISO31000.
Middelmann, M. H. (Editor), 2007, Natural Hazards in Australia, Identifying Risk Analysis Requirements, Geoscience Australia, Canberra.
NRAAG, 2007, A National Risk Assessment Framework for Sudden Onset Natural Hazards, www.ga.gov.au/.
Acknowledgements
The author would like to thank the authors who contributed papers to the two AJEM Special Issues on Risk Assessment. Thanks also go to all of the reviewers of the papers in the two Special Issues, including David Prestipino and Monica Osuchowski who reviewed this paper. Finally, the author would like to thank the AJEM Editors, especially Cate Moore and Anita Cleaver, for their energetic efforts in publishing the two special issues.
About the authorTrevor Jones is guest Editor of the two AJEM Special Issues on Risk Assessment. He is Strategic Adviser in the Risk and Impact Analysis Group of Geoscience Australia and has a strong interest in bringing risk-based science to government policy and practice in disaster management and climate change adaptation. He can be contacted at [email protected].
R
9
The Australian Journal of Emergency Management, Vol. 23 No. 4, November 2008
AbstractThe assessment of risk attributable to many phenomena relies on the analysis of past history. In the ideal situation, statistics derived from these data should reveal probabilities and trends in the occurrence of significant events. For more dangerous meteorological events like Tropical Cyclones and Severe Thunderstorms, the number of recorded events is somewhat limited. Changes in the nature of information gathering, and technology have biased these limited observations. We need to consider these factors when using the data to assess future risk
Introduction
The estimation of the risk of adverse impact from weather-related disasters relies heavily on hindsight. The assumption is that the frequency of major events in the past will follow on to a similar frequency in the future. There are two main questions that need to be asked:
• Istherecordedhistoryrepresentativeoflongtermclimate? and
• Isthereanychangeoccurringinclimate?
To answer each of these questions, we need to examine the available meteorological databases to assess their accuracy and limitations. The quality of the data is important. Errors and omissions will introduce biases into the dataset that will skew risk assessments. These will not necessarily be the consequence of negligence as many scientific and technical advances have improved weather observing techniques over the years. Where data is more limited, statistical theory shows the probability of the dataset being representative of population is reduced. Also, the extent of the database back into the past has to be great enough to capture longer-term fluctuations in climate.
In this paper we will discuss a number of meteorological databases and briefly evaluate their usefulness in risk assessment in the light of the above mentioned potential limitations.
Assessment of risk
Estimating the risk to the community posed by meteorological phenomena relies on an assessment of the probability of occurrence of the particular hazard phenomenon in the light of the impact that it would be expected to have on the community. Both the weather, and the impact it can have on communities are complex issues that cannot be accurately assessed in any analytical manner. We must use estimations which will often rely heavily on past experience.
Meteorological probabilities can be evaluated from the analysis of past data. The reliability of these probability estimates relies on the size and quality of the meteorological dataset used. Extreme events that pose the greatest hazard are also less common, so the statistical datasets are relatively small, hence conclusions derived from them are less reliable. Overlying real trends also need to be considered—particularly those
Assessing risk from meteorological phenomena using limited
and biased databasesAlan Sharp discusses a number of meteorological databases
and briefly evaluates their usefulness in risk assessment.
Melbourne Winter 1855-2007Average Maximum Daily Temperature and Total Season Rainfall
RAINFALL MAX TEMP
Year
420.0
Deg
rees
C
elci
us
16.0
15.0
14.0
13.0
12.0
11.0
10.0
360.0
300.0
240.0
180.0
120.0
60.01855 1870 1885 1900 1915 1930 1945 1960 1975 1990 2005
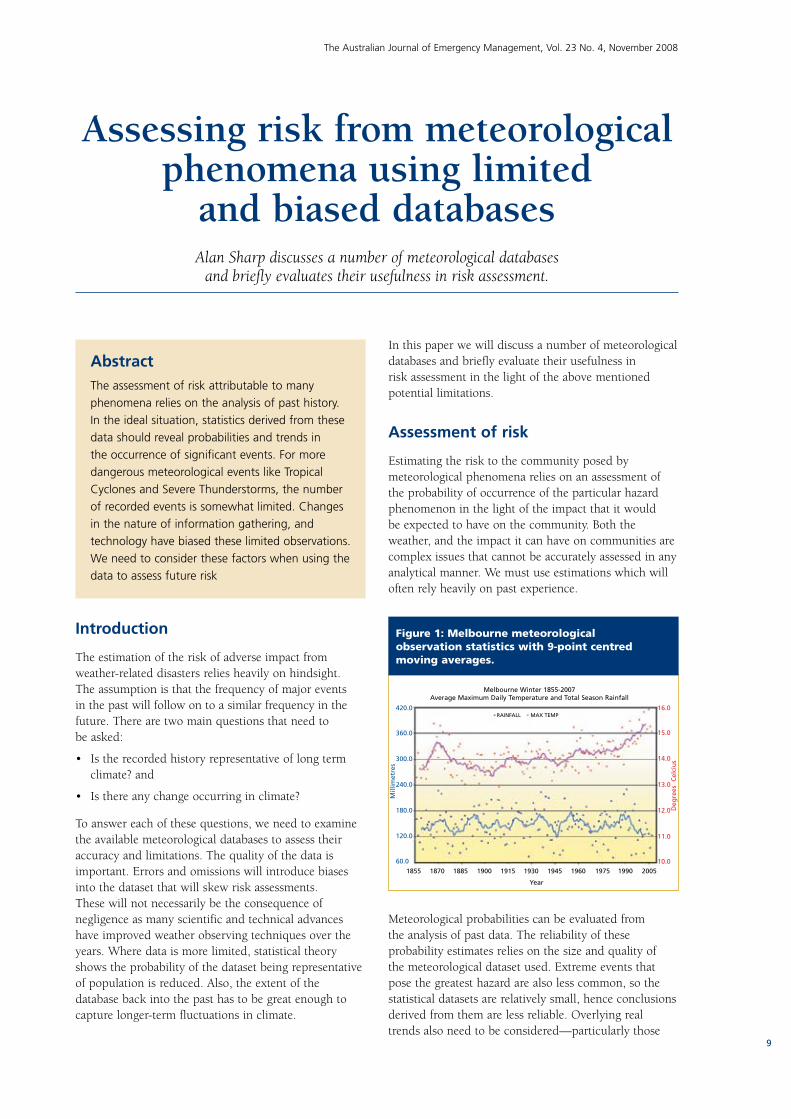
Figure 1: Melbourne meteorological observation statistics with 9-point centred moving averages.
Mill
imet
res
10
The Australian Journal of Emergency Management, Vol. 23 No. 4, November 2008
caused by global warming. The limited number of significant events also limits the assessment of impact—which is also hampered by a changing landscape and technological infrastructure. The impact assessment is beyond the scope of this paper.
Robust databases
Many of the Bureau of Meteorology’s databases are comprehensive, extending over many years. For example, to examine the winter climate of Melbourne we can look at observations from the official Melbourne observation sites. These are the current site near the corner of Latrobe and Spring Streets (since 1908), and Flagstaff gardens in most of the preceding period. This produces a database of over 14,000 daily observations dutifully made at 9am each morning since 1855. Figure 1 shows mean maximum daily temperature and total rainfall for each winter in Melbourne since reliable records commenced in 1855. Before this time there is doubt about the quality of the instrumentation and measurement techniques used.
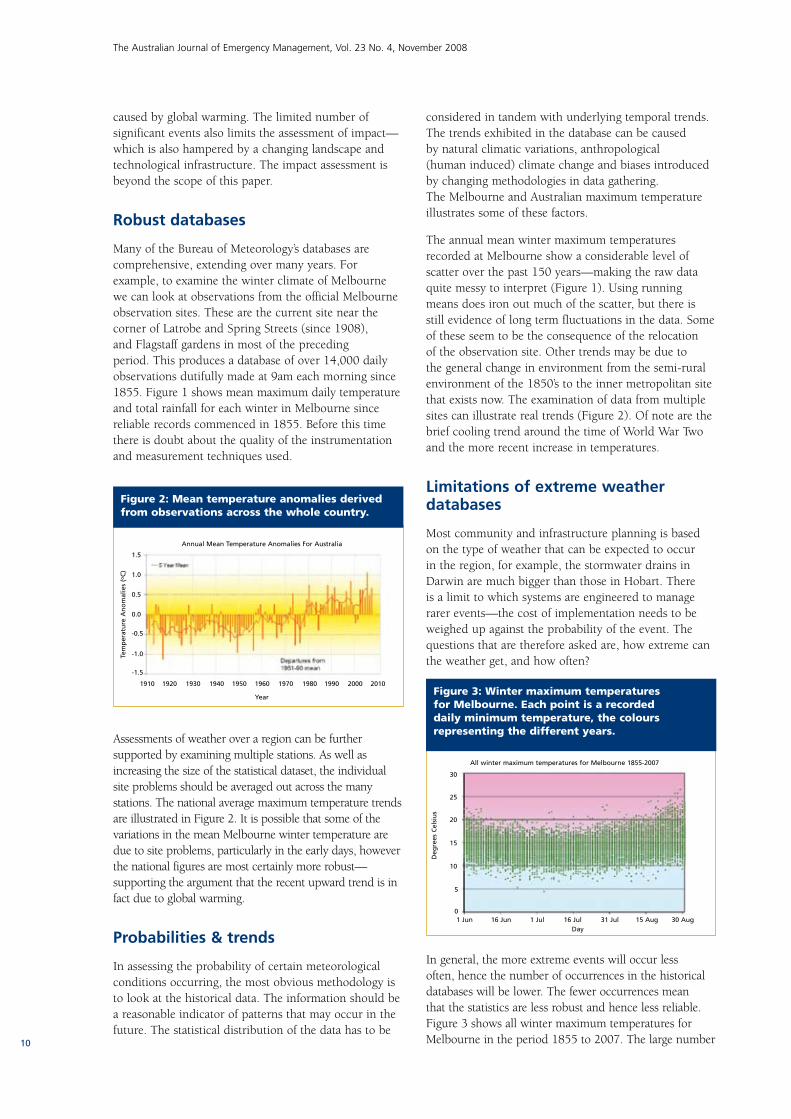
Assessments of weather over a region can be further supported by examining multiple stations. As well as increasing the size of the statistical dataset, the individual site problems should be averaged out across the many stations. The national average maximum temperature trends are illustrated in Figure 2. It is possible that some of the variations in the mean Melbourne winter temperature are due to site problems, particularly in the early days, however the national figures are most certainly more robust—supporting the argument that the recent upward trend is in fact due to global warming.
Probabilities & trends
In assessing the probability of certain meteorological conditions occurring, the most obvious methodology is to look at the historical data. The information should be a reasonable indicator of patterns that may occur in the future. The statistical distribution of the data has to be
considered in tandem with underlying temporal trends. The trends exhibited in the database can be caused by natural climatic variations, anthropological (human induced) climate change and biases introduced by changing methodologies in data gathering. The Melbourne and Australian maximum temperature illustrates some of these factors.
The annual mean winter maximum temperatures recorded at Melbourne show a considerable level of scatter over the past 150 years—making the raw data quite messy to interpret (Figure 1). Using running means does iron out much of the scatter, but there is still evidence of long term fluctuations in the data. Some of these seem to be the consequence of the relocation of the observation site. Other trends may be due to the general change in environment from the semi-rural environment of the 1850’s to the inner metropolitan site that exists now. The examination of data from multiple sites can illustrate real trends (Figure 2). Of note are the brief cooling trend around the time of World War Two and the more recent increase in temperatures.
Limitations of extreme weather databases
Most community and infrastructure planning is based on the type of weather that can be expected to occur in the region, for example, the stormwater drains in Darwin are much bigger than those in Hobart. There is a limit to which systems are engineered to manage rarer events—the cost of implementation needs to be weighed up against the probability of the event. The questions that are therefore asked are, how extreme can the weather get, and how often?
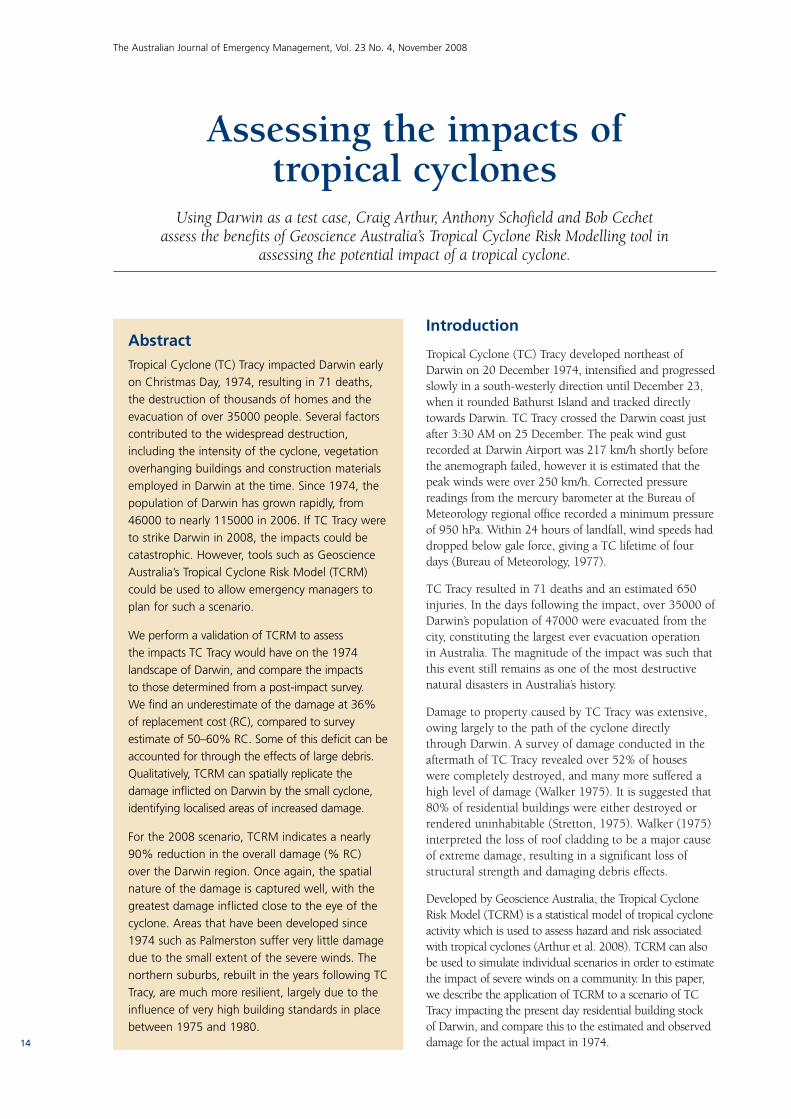
In general, the more extreme events will occur less often, hence the number of occurrences in the historical databases will be lower. The fewer occurrences mean that the statistics are less robust and hence less reliable. Figure 3 shows all winter maximum temperatures for Melbourne in the period 1855 to 2007. The large number
Figure 2: Mean temperature anomalies derived from observations across the whole country.
Annual Mean Temperature Anomalies For Australia
Year
1910
1.5
1.0
0.5
0.0
-0.5
-1.0
-1.5
1920 1930 1940 1950 1960 1970 1980 1990 2000 2010
Tem
per
atu
re A
no
mal
ies
(oC
)
Figure 3: Winter maximum temperatures for Melbourne. Each point is a recorded daily minimum temperature, the colours representing the different years.
All winter maximum temperatures for Melbourne 1855-2007
Day
30
25
20
15
10
5
01 Jun 16 Jun 1 Jul 16 Jul 31 Jul 15 Aug 30 Aug
Deg
rees
Cel
siu
s

11
The Australian Journal of Emergency Management, Vol. 23 No. 4, November 2008
of observations shows the obvious trend with the coolest expected period being in early July and an obvious warming trend by the end of August. This agrees with the expected trend as the days get longer. If you look at the extremes, that are the days with a maximum less than 7oC, the dataset is much more limited. Viewed in isolation, the warmer trend is not so obvious.
In the case of extreme temperatures, we can view this in the light of the non-extreme data, and common sense. For unusual extreme weather phenomena, like Tropical Cyclones or Severe Thunderstorms—there is not an option of viewing the data in light of “less extreme cases”. While some conclusions can be drawn from meteorological reasoning, the issues are complex—particularly when considering the possible influences of global warming.
Tropical Cyclone database
The Australian tropical cyclone database has been maintained by the Bureau of Meteorology since its inception in 1908. Despite this being a relatively long period of 100 years, the total number of cyclones in the database amounts to less than 1000. The annual frequency shown in Figure 4 illustrates the improvement in cyclone detection efficiency rather than any real trends. In the first half of the twentieth century, most cyclones passed unnoticed. Cyclones that did not impact the coast near populated areas were mostly not recorded. Very few systems were detected at sea—and often if a ship did come across a cyclone, it never returned to tell the tale. Through the middle part of the century, improved technology and radio communications improved the detection efficiency, but it was not until the introduction of satellite technology in the 60’s that most storms could be detected. It was 1978 when routine geostationary satellite imagery became available, allowing for effective monitoring of cyclones throughout their lifetimes.
In the past thirty to forty years, satellite imagery has permitted the detection of almost all tropical cyclones around the world. Very few cyclones actually pass over a barometer or anemometer and in earlier times most instruments were destroyed by the stronger cyclones. The estimation of intensity of many cyclones relies on satellite image interpretation. The assessment of cyclone intensity over this period has not been consistent as technology and knowledge has evolved. In recent years there has been much debate about the recent trends in cyclone frequency and intensity. The existing database suggests that the frequency of cyclones is mostly unchanged, but that the mean intensity is increasing. The question being asked is: Is the trend in intensity real—possibly a consequence of global warming—or is it a result of improved analysis techniques?
The answer to this question cannot be discovered without a detailed reanalysis of older data—at least to the start of the satellite era. This can be done by the Bureau, but will require significant resources currently not available.
Whatever the nature of the trend observed in the current database, it still must be considered when assessing risk. If it is real, then we must consider the possibility of the trend continuing into the future if global warming continues. Even if it is not real, the implications to existing risk profiles is serious. The most recent data is more reliable, but many decisions on coastal defences and building codes have been based risks assessments that were developed some time ago using just the less reliable data that was then available. It is likely that these risks may be understated in the light of more recent information. An example is the frequency of Severe Cyclones (those with hurricane-force winds defined as category 3 or above1) impacting the coast between Gove and Kalumburu. Figure 5 shows the recorded coastal impacts up until 2002. There have been three category five impacts in the zone in the ensuing three years. Cyclone Monica (2006) was particularly savage as it crossed the Top End coast, however the impact on populated centres was limited. It was only post-event aerial photography that revealed the serious damage to vegetation (Figure 6). Had this cyclone occurred 50 years earlier it is likely to have been recorded as Category 2-3 crossing “somewhere west of Maningrida”.
Severe thunderstorm database
Like the cyclone database, the severe thunderstorm database is biased by the limitations in the ability to detect the events. Thunderstorms can be detected nationwide using satellite imagery and, more recently, lightning sensor networks. These observations cannot distinguish between severe and non-severe thunderstorms. Even radar is not reliable beyond a range of about 70km, and the Bureau radar network contains many gaps in spatial coverage.
1 See table 1.
Figure 4: Tropical Cyclones Recorded in Bureau of Meteorology Database.
Annual Recorded Cyclone Frequency
Season
20
18
16
14
12
10
8
6
4
2
0
1906
1911
1916
1921
1926
1931
1936
1941
1946
1951
1956
1961
1966
1971
1976
1981
1986
1991
1996
2001
2006

12
The Australian Journal of Emergency Management, Vol. 23 No. 4, November 2008
The verification of severe thunderstorms relies mainly on eye-witness accounts and damage assessment.
In recent years, the Bureau of Meteorology has implemented measures to better detect and verify severe thunderstorms. This includes the implementation of a storm-spotter network of about 3000 volunteers, Severe Weather Sections in each capital city Bureau office that are better equipped to follow up suspected events, and increased and improved weather radar. Not surprisingly, the frequency of severe thunderstorms recorded has increased in recent years. Severe thunderstorms are more frequent than tropical cyclones, so a lesser time period is required to build up valid statistics. Longer term trends will be more difficult to detect. At present the database is fragmented between states, a project is planned to consolidate these data and make them available to the public.
Solutions
For some extreme weather conditions, the data available will provide good guidance on threat and trends in threat posed. For example, extreme fire weather situations relate to temperature and wind for which much data exists. Even though extreme events are uncommon, these represent the tail of a much bigger and robust
statistical database. This benefit can be enhanced by reanalysis where possible. Better understanding of risk relies on the collection of supporting information from some less conventional sources.
For isolated phenomena like tropical cyclones, the assessment of risk is more difficult.
The removal of errors and complete reanalysis of the cyclone database using current scientific knowledge will improve the utility of the database. Despite this, the period of reliable data still will be limited as little information exists before the satellite era. To assess risk, there needs to be research done beyond the scope of detection of cyclones by meteorological systems. Some information exists on significant cyclone impacts in living history—like Cyclone Mahina that impacted Bathurst Bay north of Cooktown in 1899 causing the most recorded deaths for a single event in Australia.
To better understand the risks posed in the longer term we need to find data that may reveal fluctuations in frequency that may occur over periods of greater than
Figure 5: Recorded tropical cyclone coastal impacts: 1906-2002 (severe impacts in red).
Figure 6: Impact of Cyclone Monica (2006) on tropical trees at landfall 35 km west of Maningrida. Notice the trees have been striped of foliage and small branches.
Figure 7: Correlation of 20th century tropical cyclone events with stalagmite isotope ratios in caves at Chillagoe, west of Cairns. (Nott, et al, 2007). The graph shows the deviation of 18O:16O isotope ratio.
Figure 8: Stalagmite isotope ratios from caves at Chillagoe, west of Cairns. (Nott, et al, 2007). The graph shows the size of the variation from maximum to minimum between years.
Tropical cycloneWet season > 1000mm rainNo tropical cyclone year
Year AD
Year AD
1 event 7 events 2 events 0 events
2000
2000
180
dif
fere
nce
(cr
est
- tr
ou
gh
)
-4.50
-4.00
-3.00
-3.00
-2.50
-2.00
-1.50
-1.00
-0.50
-0.00
0.50
1900 1800 1700 1600 1500 1400 1300 1200
1980 1960 1940 1920 1900
-5
-4
-3
-2
-1

13
The Australian Journal of Emergency Management, Vol. 23 No. 4, November 2008
a few decades. This includes the collation of historic disaster reports, and the examination of physical evidence using paleoclimatology. More obvious examples of these techniques involve the detection of past ice-ages. More subtle analysis of specific information can reveal trends over the past millennium. Research into oxygen atom isotope ratios (16O:18O) in stalagmites in caves at Chillagoe, 130 km inland from Cairns, suggests evidence of markers that can identify floods caused by past cyclones. Work by Nott, et al (2007) illustrates this (figures 7 & 8). The correlation is established in the twentieth century, but the longer time series suggest that the 20th century records may represent a relatively quiet period. The period 1600-1800 shows a much higher frequency of large peaks that have been shown to be correlated to major cyclone/flood events.
The importance of sourcing alternative pre-historic data is also presented in a paper by Nott (2003) that examines past impact evidence to evaluate the threat based on a longer-term period—particularly in the Cairns Region. This includes the examination of debris deposits from past storm surges, and tsunamis; landslides; past floods etc. While these data do show that historical records may underestimate the variability in severe weather phenomena over time, there is also scope for much more detailed research in this area. It should be noted that long-term climate variations have also been observed in the northern hemisphere where history extends much further into the past. This includes a cool period between 1550 and 1850 referred to as “The Little Ice Age” (Grove, 1988) which illustrates that significant climatic variation can occur century to century. The cause of the cooling is unknown, although theories include reduced solar radiation, volcanic activity and/or disruption to ocean currents.
Conclusions
The existing meteorological databases for the occurrences of extreme weather conditions do show some limitations. These limitations can affect the usefulness and accuracy of risk assessments that are
derived from the data. However, knowledge of these limitations is important in that it can be factored into any future risk estimates in a sensible way. This appropriate evaluation and use of the data allows it to play an important role in the disaster mitigation assessment process, and reduces the possibility of false definitive conclusions being reached by planners.
There is a need to continue extending and improving the meteorological databases. This will not only improve the statistical robustness of the database, but also help to measure climatic variations that may be occurring at this time—particularly man-made global warming. A main consequence of global warming is likely to be a change in frequency and severity of significant weather events. The sooner we can assess the nature of these changes the sooner we can update the estimate of risk to the community.
References
Grove, J.M. (1988), The Little Ice Age, Methuen, London.
Kossin, J.P, Knapp, K.R, Vimont, D.J, Murnane, R.J. and Harber, B.A, (2007), ‘A globally consistent reanalysis of hurricane variability and trends’, Geophysical Research Letters, Vol. 34, pp. 1-6.
Nott, J. (2003), ‘The importance of Prehistoric Data and Variability of Hazard Regimes in Natural Hazard Risk Assessment—Examples from Australia’ Natural Hazards, vol 30, pp. 43-58.
Nott, J., Haig, J., Neil, H. & Gillieson, D. (2007), ‘Greater frequency variability of landfalling tropical cyclones at centennial compared to seasonal and decadal scales’, Earth and Planetary Science Letters, vol. 255, pp. 367—372.
About the authorAlan Sharp, is the national manager of tropical cyclone warning service policy and development at the Bureau of Meteorology. [email protected]
R
Table 1: Australian Tropical Cyclone Category Scale
Category Strongest gust (km/h) Typical effects
1 Less than 125 km/h Gales
Minimal house damage. Damage to some crops, trees and caravans. Boats may drag moorings.
2 125 - 164 km/h Destructive winds
Minor house damage. Significant damage to signs, trees and caravans. Heavy damage to some crops. Risk of power failure. Small boats may break moorings.
3 165 - 224 km/h Very destructive winds
Some roof and structural damage. Some caravans destroyed. Power failure likely.
4 225 - 279 km/h Very destructive winds
Significant roofing and structural damage. Many caravans destroyed and blown away. Dangerous airborne debris. Widespread power failures.
5 More than 280 km/h Extremely destructive winds
Extremely dangerous with widespread destruction.
14
The Australian Journal of Emergency Management, Vol. 23 No. 4, November 2008
AbstractTropical Cyclone (TC) Tracy impacted Darwin early on Christmas Day, 1974, resulting in 71 deaths, the destruction of thousands of homes and the evacuation of over 35000 people. Several factors contributed to the widespread destruction, including the intensity of the cyclone, vegetation overhanging buildings and construction materials employed in Darwin at the time. Since 1974, the population of Darwin has grown rapidly, from 46000 to nearly 115000 in 2006. If TC Tracy were to strike Darwin in 2008, the impacts could be catastrophic. However, tools such as Geoscience Australia’s Tropical Cyclone Risk Model (TCRM) could be used to allow emergency managers to plan for such a scenario.
We perform a validation of TCRM to assess the impacts TC Tracy would have on the 1974 landscape of Darwin, and compare the impacts to those determined from a post-impact survey. We find an underestimate of the damage at 36% of replacement cost (RC), compared to survey estimate of 50–60% RC. Some of this deficit can be accounted for through the effects of large debris. Qualitatively, TCRM can spatially replicate the damage inflicted on Darwin by the small cyclone, identifying localised areas of increased damage.
For the 2008 scenario, TCRM indicates a nearly 90% reduction in the overall damage (% RC) over the Darwin region. Once again, the spatial nature of the damage is captured well, with the greatest damage inflicted close to the eye of the cyclone. Areas that have been developed since 1974 such as Palmerston suffer very little damage due to the small extent of the severe winds. The northern suburbs, rebuilt in the years following TC Tracy, are much more resilient, largely due to the influence of very high building standards in place between 1975 and 1980.
Introduction
Tropical Cyclone (TC) Tracy developed northeast of Darwin on 20 December 1974, intensified and progressed slowly in a south-westerly direction until December 23, when it rounded Bathurst Island and tracked directly towards Darwin. TC Tracy crossed the Darwin coast just after 3:30 AM on 25 December. The peak wind gust recorded at Darwin Airport was 217 km/h shortly before the anemograph failed, however it is estimated that the peak winds were over 250 km/h. Corrected pressure readings from the mercury barometer at the Bureau of Meteorology regional office recorded a minimum pressure of 950 hPa. Within 24 hours of landfall, wind speeds had dropped below gale force, giving a TC lifetime of four days (Bureau of Meteorology, 1977).
TC Tracy resulted in 71 deaths and an estimated 650 injuries. In the days following the impact, over 35000 of Darwin’s population of 47000 were evacuated from the city, constituting the largest ever evacuation operation in Australia. The magnitude of the impact was such that this event still remains as one of the most destructive natural disasters in Australia’s history.
Damage to property caused by TC Tracy was extensive, owing largely to the path of the cyclone directly through Darwin. A survey of damage conducted in the aftermath of TC Tracy revealed over 52% of houses were completely destroyed, and many more suffered a high level of damage (Walker 1975). It is suggested that 80% of residential buildings were either destroyed or rendered uninhabitable (Stretton, 1975). Walker (1975) interpreted the loss of roof cladding to be a major cause of extreme damage, resulting in a significant loss of structural strength and damaging debris effects.
Developed by Geoscience Australia, the Tropical Cyclone Risk Model (TCRM) is a statistical model of tropical cyclone activity which is used to assess hazard and risk associated with tropical cyclones (Arthur et al. 2008). TCRM can also be used to simulate individual scenarios in order to estimate the impact of severe winds on a community. In this paper, we describe the application of TCRM to a scenario of TC Tracy impacting the present day residential building stock of Darwin, and compare this to the estimated and observed damage for the actual impact in 1974.
Assessing the impacts of tropical cyclones
Using Darwin as a test case, Craig Arthur, Anthony Schofield and Bob Cechet assess the benefits of Geoscience Australia’s Tropical Cyclone Risk Modelling tool in
assessing the potential impact of a tropical cyclone.
15
The Australian Journal of Emergency Management, Vol. 23 No. 4, November 2008
The first step in estimating the impact of a TC on a community is to estimate the maximum wind speed experienced during the passage of the storm. We use TCRM to generate a regional wind field, which excludes local influences on the wind speed. The regional wind speeds are modified for local effects such as topography, land-use classification and shielding from surrounding structures. Local wind speeds are then related to residential building damage through vulnerability curves, which provide an estimate of the loss (as a percentage of replacement cost) amongst a population of buildings given an incident wind speed.
Here we focus on spatially defining the level of damage inflicted, which can provide emergency managers with invaluable information such as where to deploy resources in a recovery operation. We also restrict the analysis to residential buildings only. We draw comparisons between surveyed damage and the modelled damage for the impact in 1974, and then extend the analysis to determine the potential impact on the present-day landscape of Darwin.
Wind field modelling process
Although it is possible to generate synthetic TC tracks within TCRM, this investigation uses the ‘best track’ of TC Tracy recorded in the Bureau of Meteorology tropical cyclone best track database (Trewin and Sharp 2007). Wind field simulations are undertaken as a two-stage process within TCRM. To reflect the behaviour of real-world TCs, a radial wind profile model is used to construct a symmetric, gradient-level wind field. This gradient wind field is then modified by a boundary layer model that incorporates the asymmetric distribution of winds in a moving tropical cyclone, providing a regional estimate (1 km horizontal resolution) of the winds associated with the cyclone.
To incorporate the influences of terrain, topography and shielding from structures, wind field multipliers based on the site-specific factors described in the Australian/New Zealand Wind Loading Standard (AS/NZS 2002) are applied to modify the regional wind field. These are simple multiplicative factors, derived at a resolution of 25 m, are directionally dependent and are pre-calculated for ease of use. As the urban footprint of Darwin has increased dramatically since 1974, the multipliers have determined for both the 1974 and present-day Darwin landscapes. The resulting modelled wind fields represent the maximum three second gust wind speed predicted for a location over the lifetime of the event.
TCRM uses a 2-dimensional model of the wind field associated with a tropical cyclone. While it is a parametric model, it retains sufficient detail to reproduce many features of a TC wind field. The 2-dimensional model allows the wind field to be quickly simulated
at a resolution that would not be feasible in a full 3-dimensional atmospheric model. TCRM can also be applied in situations where there are few observations to constrain a fully 3-dimensional model.
Several options for radial wind profiles and boundary layer models are available to users including the profiles of Schloemer (1954), Jelesnianski (1966), Holland (1980), McConochie et al. (also referred to as double Holland; McConochie et al. 2004), Willoughby et al. (2006), and a Rankine vortex. Boundary layer models include those of Kepert (2001), Hubbert et al (1991) and McConochie et al (2004). Users can select any combination of radial and boundary layer models at run time.
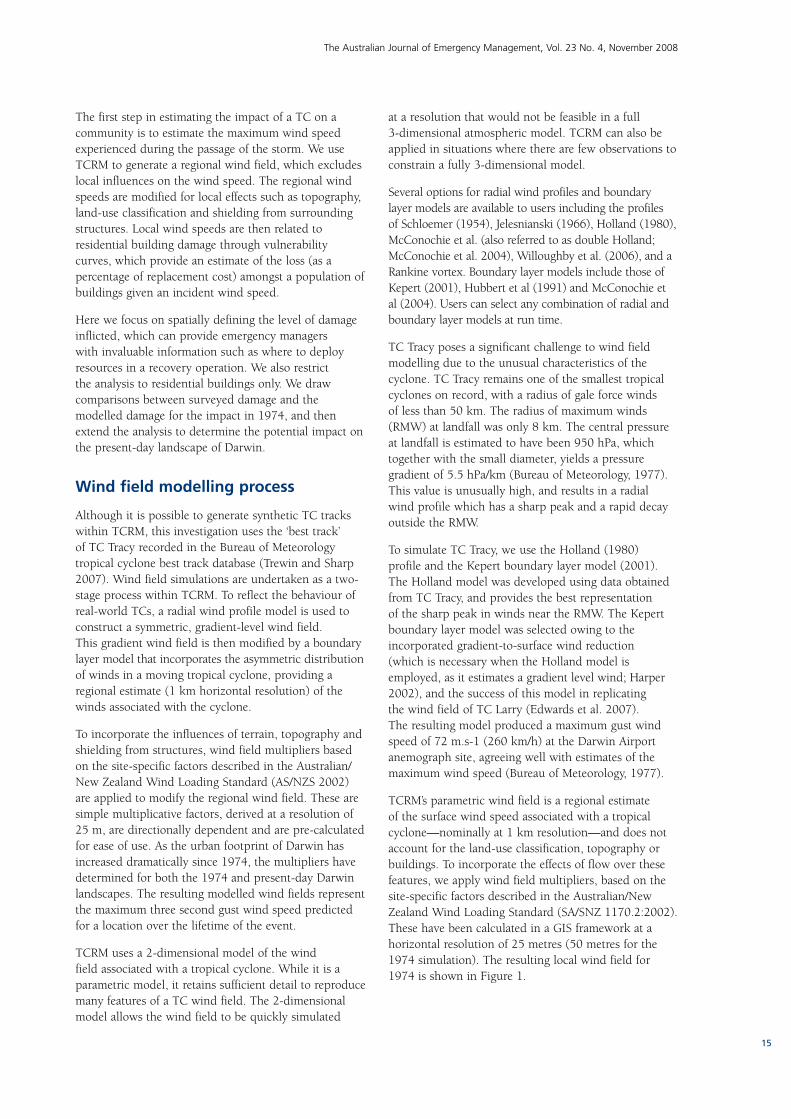
TC Tracy poses a significant challenge to wind field modelling due to the unusual characteristics of the cyclone. TC Tracy remains one of the smallest tropical cyclones on record, with a radius of gale force winds of less than 50 km. The radius of maximum winds (RMW) at landfall was only 8 km. The central pressure at landfall is estimated to have been 950 hPa, which together with the small diameter, yields a pressure gradient of 5.5 hPa/km (Bureau of Meteorology, 1977). This value is unusually high, and results in a radial wind profile which has a sharp peak and a rapid decay outside the RMW.
To simulate TC Tracy, we use the Holland (1980) profile and the Kepert boundary layer model (2001). The Holland model was developed using data obtained from TC Tracy, and provides the best representation of the sharp peak in winds near the RMW. The Kepert boundary layer model was selected owing to the incorporated gradient-to-surface wind reduction (which is necessary when the Holland model is employed, as it estimates a gradient level wind; Harper 2002), and the success of this model in replicating the wind field of TC Larry (Edwards et al. 2007). The resulting model produced a maximum gust wind speed of 72 m.s-1 (260 km/h) at the Darwin Airport anemograph site, agreeing well with estimates of the maximum wind speed (Bureau of Meteorology, 1977).
TCRM’s parametric wind field is a regional estimate of the surface wind speed associated with a tropical cyclone—nominally at 1 km resolution—and does not account for the land-use classification, topography or buildings. To incorporate the effects of flow over these features, we apply wind field multipliers, based on the site-specific factors described in the Australian/New Zealand Wind Loading Standard (SA/SNZ 1170.2:2002). These have been calculated in a GIS framework at a horizontal resolution of 25 metres (50 metres for the 1974 simulation). The resulting local wind field for 1974 is shown in Figure 1.

16
The Australian Journal of Emergency Management, Vol. 23 No. 4, November 2008
Wind speeds over the northern suburbs of Darwin exceed 75 m.s-1 (270 km/h) near the outskirts of built-up areas and close to the coastline. On the southern side of the cyclone’s path, peaks winds in the southern suburbs are in the range of 40—50 m.s-1 (145—180 km/h).
Damage modelling
Damage to residential structures is estimated by utilising a suite of vulnerability curves, appropriately selected for the class of building present in the region of interest (Figure 2). The population of structure types in Darwin and the standards to which they are built are significantly different between 1974 and 2008, due to the reconstruction of structures following TC Tracy and the revision of building codes with time (Nicholls, 2007).
The vulnerability relations have been derived through a series of wind vulnerability workshops conducted by Geoscience Australia (Timber ED Services, 2006). The relations were developed by consultation with wind engineers and are based predominantly on engineering judgement of the damage incurred as a percentage of replacement cost (% RC) at various incident wind speeds. We make two key assumptions about the vulnerability relations: (1) the differences in the vulnerability relations are representative of the changes in building standards over time and (2) all buildings in each class are identical and perform (under wind loading) in line with the
appropriate relation. Each vulnerability relation contains three functions, providing not only a mean estimate of the loss for a building population, but upper and lower confidence limit estimates of the range of loss amongst that population.
Information on building age and location for the 2008 scenario is provided by Geoscience Australia’s National Exposure Information System (NEXIS), a nationally consistent spatial database of building exposure (Nadimpalli et al. 2007). For the 2008 analysis, residential structures are classified into four groups based on age. No classification on construction type was performed.
TC TracyRadial profile: Holland =1.8Asymmetry model: KepertV
max = 82.6 m/s
<30 55-60 85-9030-35
12º15’0”S
12º20’0”S
12º25’0”S
12º30’0”S
12º35’0”S
130º45’0”E 130º50’0”E 130º55’0”E 131º0’0”E 131º50’0”E
60-65 90-9535-40 65-70 95-10040-45 70-75 >10045-50 75-8050-55 80-85
Kilometres
0 2.5 5 10
Figure 1: Estimated maximum wind speed from TC Tracy in 1974, incorporating site-specific influences on the wind speed arising due to topography, terrain and existing structures.
Figure 2: Comparative mean damage model curves for building classes present in Darwin for the 2008 analysis.
Wind speed (m/s)
200%
10%
20%
30%
40%
50%
60%
Less
(%
)
70%
80%
90%Reconstruction 1975-1980Post-1980 constructionRepaired and retrofittedPre-1974 construction
100%
30 40 50 60 70 80 90 100 110 120
17
The Australian Journal of Emergency Management, Vol. 23 No. 4, November 2008
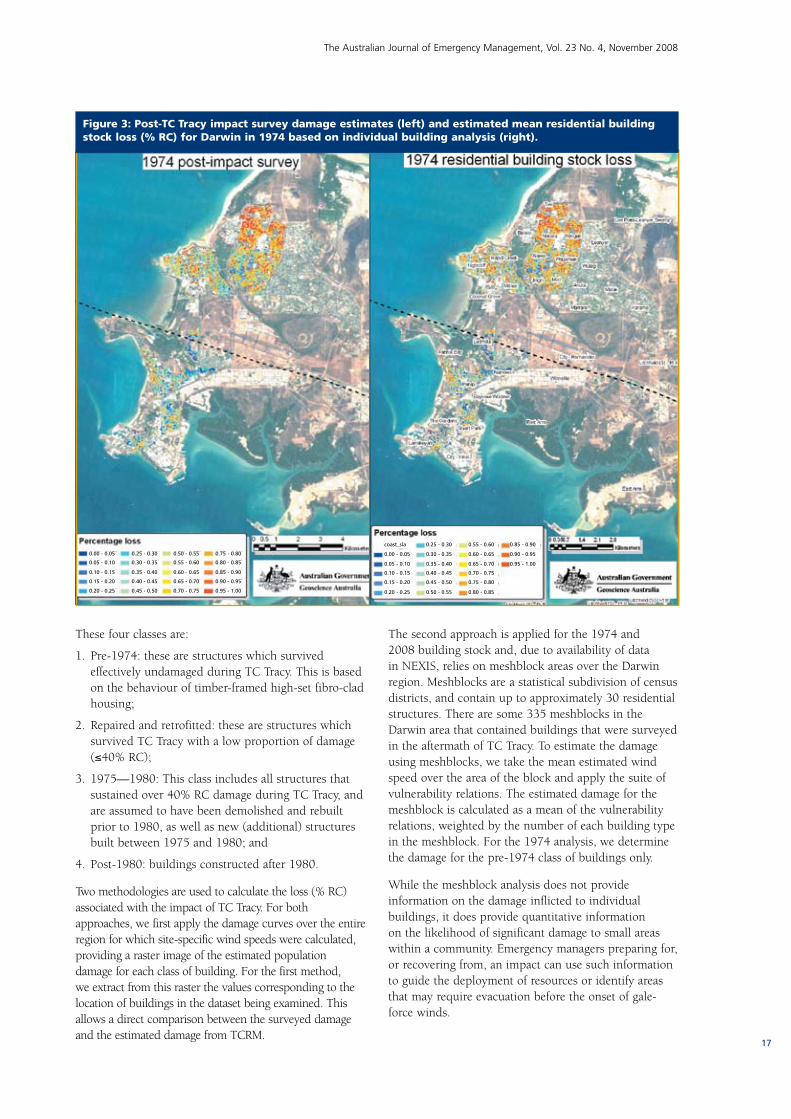
These four classes are:
1. Pre-1974: these are structures which survived effectively undamaged during TC Tracy. This is based on the behaviour of timber-framed high-set fibro-clad housing;
2. Repaired and retrofitted: these are structures which survived TC Tracy with a low proportion of damage (≤40% RC);
3. 1975—1980: This class includes all structures that sustained over 40% RC damage during TC Tracy, and are assumed to have been demolished and rebuilt prior to 1980, as well as new (additional) structures built between 1975 and 1980; and
4. Post-1980: buildings constructed after 1980.
Two methodologies are used to calculate the loss (% RC) associated with the impact of TC Tracy. For both approaches, we first apply the damage curves over the entire region for which site-specific wind speeds were calculated, providing a raster image of the estimated population damage for each class of building. For the first method, we extract from this raster the values corresponding to the location of buildings in the dataset being examined. This allows a direct comparison between the surveyed damage and the estimated damage from TCRM.
The second approach is applied for the 1974 and 2008 building stock and, due to availability of data in NEXIS, relies on meshblock areas over the Darwin region. Meshblocks are a statistical subdivision of census districts, and contain up to approximately 30 residential structures. There are some 335 meshblocks in the Darwin area that contained buildings that were surveyed in the aftermath of TC Tracy. To estimate the damage using meshblocks, we take the mean estimated wind speed over the area of the block and apply the suite of vulnerability relations. The estimated damage for the meshblock is calculated as a mean of the vulnerability relations, weighted by the number of each building type in the meshblock. For the 1974 analysis, we determine the damage for the pre-1974 class of buildings only.
While the meshblock analysis does not provide information on the damage inflicted to individual buildings, it does provide quantitative information on the likelihood of significant damage to small areas within a community. Emergency managers preparing for, or recovering from, an impact can use such information to guide the deployment of resources or identify areas that may require evacuation before the onset of gale-force winds.
Figure 3: Post-TC Tracy impact survey damage estimates (left) and estimated mean residential building stock loss (% RC) for Darwin in 1974 based on individual building analysis (right).
0.00 - 0.05 0.25 - 0.30 0.50 - 0.55 0.75 - 0.80
0.05 - 0.10 0.30 - 0.35 0.55 - 0.60 0.80 - 0.85
0.10 - 0.15 0.35 - 0.40 0.60 - 0.65 0.85 - 0.90
0.15 - 0.20 0.40 - 0.45 0.65 - 0.70 0.90 - 0.95
0.20 - 0.25 0.45 - 0.50 0.70 - 0.75 0.95 - 1.00
coast_sla 0.25 - 0.30 0.55 - 0.60 0.85 - 0.90
0.00 - 0.05 0.30 - 0.35 0.60 - 0.65 0.90 - 0.95
0.05 - 0.10 0.35 - 0.40 0.65 - 0.70 0.95 - 1.00
0.10 - 0.15 0.40 - 0.45 0.70 - 0.75
0.15 - 0.20 0.45 - 0.50 0.75 - 0.80
0.20 - 0.25 0.50 - 0.55 0.80 - 0.85

18
The Australian Journal of Emergency Management, Vol. 23 No. 4, November 2008
1974 analysis
Surveys undertaken in the months following impact show that TC Tracy inflicted significant damage across the northern suburbs such as Nakara and Wanguri, with the majority suffering major damage or complete destruction (Halpern Glick Pty. Ltd., 1975). Walker (1975) attributes some of this to the poor resilience of newer roofing materials to sustained loading induced by the severe winds. The failure of roofing materials generated large debris (e.g. entire roof structures), which then caused significant damage to downwind buildings. This may in part explain the relative spatial uniformity of damage through the northern suburbs. On the basis of the survey, the mean damage in Darwin is estimated at 56% RC, however uncertainties in the data mean this figure is in the range of 50—60% RC.
The location of buildings provided in the survey data is used to extract damage estimates from the TCRM simulation. Our results show greater damage over the suburbs of Nightcliff and Rapid Creek compared to the survey results (Figure 3). The difference is in part due to the proximity of these suburbs to the coastline and hence higher site wind speeds. The northern suburbs of Nakara and Wanguri show less damage compared to the survey—most notably only buildings near the outskirts
of the suburbs suffer significant damage. Using the 1974 damage model, the mean predicted loss for the city of Darwin during TC Tracy in 1974 is estimated at 35% RC (5th percentile: 17% RC, 95th percentile: 50% RC) of the replacement cost for residential buildings.
The meshblock analysis produces almost identical results to the individual building analysis, with a mean loss of 36% RC (5th percentile: 18% RC, 95th percentile: 52% RC) (Figure 4). Spatially, the results are also very similar, with meshblocks on the outskirts of built-up areas suffering higher damage than those in the interior. Areas along the track of the storm (e.g. Ludmilla) suffer significant damage, while areas to the south of the track (e.g. Stuart Park and Larrakeyah) suffer the least damage.
TC Tracy was remembered for the levels of complete destruction over many parts of Darwin. The effect of destruction of residential buildings and vegetation is to decrease the level of shielding afforded to adjacent buildings and a coincident increase in the site wind speed. In applying the wind field multipliers (AS/NZS 2002), we have throughout assumed the shielding values remain static during the passage of the TC. In the case of the 1974 impact, the complete destruction of buildings may result in the value of the shielding
0.00 - 0.05
coast_sla 0.25 - 0.30
0.50 - 0.55
0.75 - 0.80
0.05 - 0.10
0.30 - 0.35
0.55 - 0.60
0.80 - 0.85
0.10 - 0.15
0.35 - 0.40
0.60 - 0.65
0.85 - 0.90
0.15 - 0.20
0.40 - 0.45
0.65 - 0.70
0.90 - 0.95
0.20 - 0.25
0.45 - 0.50
0.70 - 0.75
0.95 - 1.00
Figure 4: Estimated mean residential building stock loss (% RC) for Darwin in 1974 using the meshblock methodology.
Figure 5: Estimated mean residential building stock loss (% RC) for Darwin in 2008 using the meshblock methodology.

19
The Australian Journal of Emergency Management, Vol. 23 No. 4, November 2008
multiplier (Ms) approaching unity, in turn increasing the site wind speed and the resulting damage inflicted on buildings that would normally have significant shielding. We surmise that this dynamic shielding effect may account for a significant portion of the shortfall in damage for the 1974 simulation.
2008 analysis
For the 2008 analysis, we use the meshblock methodology to determine the damage incurred. Additionally, the wind field multipliers are updated for the terrain and shielding classifications for the modern landscape of Darwin.
One of the most significant changes to Darwin between 1974 and 2008 is the population. From 47,000 prior to TC Tracy, Darwin is now home to around 115,000 people. In the intervening years, there have also been significant changes to the building standards employed in the city (Nicholls 2007) affecting the resilience of residential buildings. Because of these changes, approximately 1% of the buildings in present-day Darwin remain unchanged from 1974. Over one third were repaired and retrofitted while nearly half the current building population were built to the very high standards that existed between 1975 and 1980 (Nicholls 2007).
A cyclone identical to TC Tracy impacting Darwin in the present day landscape would result in losses of 3.5% RC (5th percentile: 1.8% RC, 95th percentile: 5.2% RC; Figures 5 and 6). These results reflect a 90% reduction in mean losses compared to the 1974 analysis. In contrast to the 1974 simulation, the improved building standards mean there would be a vast reduction in the number of buildings suffering complete destruction. This has the effect of minimising the dynamic shielding effect and local increases in site wind speed.
Much of the reduction in damage in the modern day scenario can be attributed to changes in building vulnerability in the intervening years. However, some of this reduction is almost certainly due to the growth of the urban footprint of Darwin. The small size of TC Tracy results in destructive winds affecting only a small proportion of the residential building stock in present-day Darwin. To isolate the influence improved building standards have made, the present-day damage is calculated only for those meshblocks identified as containing residential structures in 1974. Based on this, damage is estimated to be 5.2% RC (5th percentile: 2.6% RC, 95th percentile: 7.7% RC; Figure 6). This figure is likely to be a better representation of the improvements to building vulnerability.
Conclusions
The results presented here indicate both the wind field and damage generated by TC Tracy in 1974 are well replicated using the TCRM. The spatial distribution and magnitude of wind-related damage is well captured, allowing emergency managers to identify likely areas of significant damage at the suburb level. Based on the accurate modelling of the impact of TC Tracy, we believe that TCRM is a valid tool for examining the impacts of an identical storm in the present-day environment. The workflows outlined here are also able to be directly applicable to other historical TC events or future scenarios.
The TCRM can be used to identify areas likely to suffer significant severe wind damage due to the impact of a tropical cyclone, providing invaluable information to emergency managers involved in the preparation and recovery phases. Quantitative differences between the observed damage and estimated damage using TCRM can in part be accounted for by inclusion of large debris-induced damage.
2008 footprint
20001997Post Survey
Loss
100
80
60
40
20
0
Figure 6: Mean damage (% RC) associated with TC Tracy determined from the post-impact survey, TCRM analysis for 1974, TRCM for 2008 and TCRM for 2008 (using only the 1974 urban footprint). Black vertical bars indicate the range of the 5th and 95th percentile.
20
The Australian Journal of Emergency Management, Vol. 23 No. 4, November 2008
The design of TCRM, which allows users to apply a range of radial profiles and boundary layer models, permits a probabilistic approach to impact assessments. Because TCRM uses a parametric model of the tropical cyclone wind field, impact scenarios can be assessed rapidly allowing emergency managers to make better informed decisions in a timely manner. A set of pre-calculated scenarios may also be of great benefit to emergency managers for training and demonstration purposes.
References
Arthur, W. C., A. Schofield, R. P. Cechet, and L. A. Sanabria, (2008): Return period cyclonic wind hazard in the Australian Region. 28th AMS Conference on Hurricanes and Tropical Meteorology, Orlando, FL, USA.
AS/NZS 1170.2, (2002): Structural design actions, Part 2: Wind actions, Australian/New Zealand Standard.
Bureau of Meteorology (1977): Report on Cyclone Tracy, December, 1974. Australian Government Publishing Service, Canberra, Australia.
Edwards, M. R., R. P. Cechet, W. C. Arthur, K. Nadimpalli, N. A. Corby, K. Dale, B. Divi, and I. Hartig, (2007): Cyclone Larry: Spatially enabled local wind hazard assessment and comparison with post-disaster damage surveys. 12th International Conference on Wind Engineering, Cairns, Australia, 1935-1942 pp.
Halpern Glick Pty. Ltd. (1975): Indicators of wind velocities during cyclone ‘Tracy’ from the behaviour of simple structures. In: Report on Cyclone Tracy—Effect on Buildings—December 1974, Australian Department of Housing and Construction, Melbourne vol. 2, Appendix 1.
Harper, B. A., (2002): Tropical Cyclone Parameter Estimation in the Australian Region: Wind Pressure Relationships and Related Issues for Engineering Planning and Design, J0106-PR003E, 92 pp.
Holland, G. J., (1980): An Analytic Model of the Wind and Pressure Profiles in Hurricanes. Monthly Weather Review, 108, 8, 1212-1218.
Hubbert, G. D., G. J. Holland, L. M. Leslie, and M. J. Manton, (1991): A Real-Time System for Forecasting Tropical Cyclone Storm Surges. Weather and Forecasting, 6, 86-97.
Jelesnianski, C. P., (1966): Numerical Computations of Storm Surges without Bottom Stress. Monthly Weather Review, 94, 6, 379-394.
Kepert, J. D., (2001): The Dynamics of Boundary Layer Jets within the Tropical Cyclone Core. Part I: Linear Theory. Journal of Atmospheric Sciences, 58, 2469-2484.
McConochie, J. D., T. A. Hardy, and L. B. Mason, (2004): Modelling tropical cyclone over-water wind and pressure fields. Ocean Engineering, 31, 1757-1782.
Nadimpalli, K., M. Edwards and D. Mullaly, (2007): National Exposure Information System (NEXIS) for Australia: Risk Assessment Opportunities, In Oxley, L. and D. Kulasiri (eds): MODSIM 2007 International Congress on Modelling and Simulation. Modelling and Simulation Society of Australia and New Zealand, December 2007, 1674—1680.
Nicholls, M., (2007): Review on NT Cyclone Risks, 79 pp.
Schloemer, R. W., (1954): Analysis and synthesis of hurricane wind patterns over Lake Okeechobee, Report 31.
Schofield, A. W.C. Arthur and R.P. Cechet (2008): Assessing the impacts of TC Tracy—1974 and 2008. Proceedings of TC Tracy Symposium.
Timber ED Services (2006): Report on Wind Vulnerability Workshop, 14-15 March 2006. Wind Vulnerability Research Workshop, James Cook University.
Trewin, B., and A. Sharp, (2007): An improved tropical cyclone dataset for the Australian region. 2007 Australian Meteorological and Oceanographic Society (AMOS) Conference.
Walker, G. R., (1975): Report on Cyclone “Tracy” - Effect on buildings - December 1974. Department of Housing and Construction. 106 pp.
Willoughby, H. E., R. W. Darling, and M. E. Rahn, (2006): Parametric Representation of the Primary Hurricane Vortex. Part II: A New Family of Sectionally Continuous Profiles. Monthly Weather Review, 134, 4, 1102-1120.
About the authorsCraig Arthur is an atmospheric scientist leading the Severe Wind Hazard & Risk activity at Geoscience Australia. His research interests include numerical modelling of severe weather, dynamic meteorology and oceanography.
He previously worked as a forecaster and computational modeller at The Weather Company, Sydney.
Anthony Schofield joined Geoscience Australia in 2007 as part of the Graduate Program and spent 3 months with the Risk and Impact Analysis Group examining the impacts of TC Tracy on Darwin. He is now working in the Onshore Energy and Minerals Division at Geoscience Australia.
Bob Cechet is the Project Leader of the Climate Change Project within the Risk and Impact Analysis Group. His research interests include natural hazard impact and risk as well as the affect of climate change on climate extremes.
He has been involved in climate change research since the early 1990s as a member of observational and modelling programs.
Current climate change activities involve severe wind, bushfires and coastal vulnerability. He was a member of the CSIRO team that received the Sherman Eureka prize for Environmental Research (Australian Museum Trust) for their work on “Australian climate change projections” derived from the findings of the IPCC 3rd Assessment Report. Bob is also a member of the executive of the Australasian Wind Engineering Society.
R
21
The Australian Journal of Emergency Management, Vol. 23 No. 4, November 2008
AbstractThis paper introduces the work of the National Flood Risk Advisory Group in providing advice and guidance on the management of flood risk in Australia, in particular its work on the development of a set of national guidelines. The guidelines are included as an appendix and they highlight that communities utilise the support and cooperation of departments and agencies across all levels of government to effectively access the broad range of skills and the funding essential to implement flood risk management solutions. The paper discusses the more important flood risk considerations embodied in the guidelines.
Introduction
Floods are the most expensive natural hazard experienced in Australia leading to an average annual damage bill of over $300M (BTE 2001). This has been evidenced in the past 18 months, where major flood episodes on the east coast of Australia resulted in several billion dollars in damage to public infrastructure and private property with major impacts on the national economy.
Flood behaviour
Flood behaviour and therefore hazard is influenced by a range of factors (including the catchment and floodplain topography, discussed below) that vary significantly with location and need to be understood and managed locally.
The catchment
Catchment size, shape, slope, development and vegetation all significantly influence the hydrological processes, in particular the conversion of rainfall into runoff. The speed of conversion from rainfall to runoff, the volume and peak runoff and the speed of rise of water, all influence flood behaviour and the length of time a flood will last.
The topography of the floodplain
Floodplain shape, slope, storage, development, vegetation and flood controls, both natural (gorges, ocean levels in tidal areas) and man made (roads and structures), all have a significant influence on the routing of flood flows (i.e. hydraulic processes) and therefore the derivation of flood behaviour from hydrological analyses. These factors significantly influence flood hazard to people and property.
Flood risk
Flood risk at a location depends upon the frequency of flooding and the associated consequences to the community. Management of flood risk usually involves reducing the impacts on people and on public and private infrastructure by reducing either the frequency of flooding, or its consequences, or both.
Urban expansion and consolidation and changing demographics within floodplains, along with changes in flood behaviour due to development of catchments as well as the influence of climate change on flood producing rainfall events and sea levels, act to increase the exposure of the community to flood risk. Without effective flood risk management, the scale of these impacts on people, property, local industry and economies will increase.
Management of flood risk to reduce the devastating impacts on the community has evolved significantly since the 1950s when the main focus was on reducing risk through mitigation works where they were cost effective. Today an effective flood risk reduction strategy requires consideration of existing and future communities and a combination of the following options.
Reducing the exposure of the community to flood risk
For existing communities this may require structural flood mitigation measures such as: levees that protect existing development from flooding, detention basins that reduce downstream flows, or works to increase the flow capacity in the floodplain. Where such measures are proposed careful consideration needs to be given to any potential environmental impacts to ensure that these
Flood risk management in Australia
The National Flood Risk Advisory Group introduces and discusses the National Flood Risk Management Guideline.
22
The Australian Journal of Emergency Management, Vol. 23 No. 4, November 2008
measures are sustainable. In addition, consideration should be given to the potential to undertake environmental enhancement as part of the project. Voluntary purchase of houses in areas where the flood situation is particularly hazardous to occupants and potential rescuers can effectively remove the exposure of these properties and their inhabitants to flood hazard.
For communities that will occupy new land release areas this can be effectively undertaken through land use planning, subdivision layout and development controls to exclude development from the most hazardous areas and enable development to proceed in less hazardous areas having regard for the flood risk. The most common application of the latter in urban areas is to set minimum floor levels. Land use zoning can also be used to restrict certain types of development. For example having a rural or open space zone in a high hazard area will prevent the number of people at risk of flooding from increasing as a result of urban encroachment.
Structural measures, and in some cases land use planning controls, require establishing a standard beyond which they no longer provide protection and this is usually linked to the frequency of flooding. The standard is ideally established in consultation with the community, and it needs to be both acceptable and affordable. Consideration needs to be given to situations in which the standard is exceeded (see below).
Reducing the vulnerability of people and property to flood risk
Reducing the exposure of existing communities may involve options including voluntary house raising in less hazardous areas to reduce the frequency of damage due to flooding.
For future communities this may involve considering the potential vulnerability of future occupants of buildings when utilising land use planning and development controls. What might be considered an acceptable level of risk to the general community may not be acceptable to the aged or infirm. Therefore aged care homes, hospitals or other buildings associated with more vulnerable members of the community shouldn’t be placed in areas exposed to flooding if evacuation is difficult, if there is little flood warning, or if the facilities cannot be self evacuated within the available timeframe.
For all communities, reducing the vulnerability of people and property involves a combination of:
• floodawarenessandreadiness.Thisaimstoensurethat people in the community clearly understand their risks of flooding, are ready and able to listen to emergency services and are prepared for the actions they may need to take in the lead up to a flood event. This includes consideration of situations in which the design standard for structural mitigation works is
exceeded or when floods exceed minimum floor levels established through development or planning controls.
• floodforecastingandwarning.Theseenablethecommunity to be made aware of a potential flood situation and how they should act in response to the flood threat.
• assistanceinfloodresponse.Emergencyserviceorganisations assist the community with responding to flooding in a planned manner with an understanding of the scale of flood risk and the logistical and access problems that exist. Emergency response planning requires essential logistical and risk exposure information that can be derived from the floodplain management process.
• availabilityofinfrastructurecriticalinresponsetoand recovery from flood events.
• appropriatetechnicalspecificationsforbuildings.Requirements are set out in the Building Code of Australia, and in relevant Standards and State and Territory Building Legislation. Additional guidance emphasising the use of materials that can reduce flood damages in new development and in renovations and extensions could include advice on:
– structural and non-structural design practices and durable materials that reduce the effects of inundation.
– structural design practices that reduce the impacts of flood debris and maintain structural integrity after a flood event.
• theabilitytorecoverfinanciallyafterafloodevent.Previous studies (Cox et al, 2001) have indicated that households feel that they cannot readily recover from a financial shock of more than $10,000 from their own resources. Given that only minor over floor flooding is likely to cause significantly more than $10,000 damage (an above floor flood depth of 1 metre is likely to result in around $80,000 damage, (from Figure 1, McLuckie et al 2007)) a flood event can be financially devastating. The recent interest rate rises and the associated financial toll on the community highlight the limited ability of individuals within the community to recover from financial shocks.
• insuranceisanimportanttoolintherecoveryofthe community after a flood event that needs to be encouraged and the insurance industry is understood to be working on making flood insurance more available to the community. However, the insurance premiums necessary to cover the risks faced by the worst affected properties may be unaffordable for their occupants. The alternative of subsidised insurance to those worst affected properties may give a false indication of the level of risk these properties and their inhabitants face from flooding.
23
The Australian Journal of Emergency Management, Vol. 23 No. 4, November 2008
The guidelines
The complexity of floodplain management today highlights the need to utilise a range of different skills and disciplines including floodplain management, civil and water engineering, hydrology and hydraulics, emergency management, land use planning, research, policy making and insurance in an integrated manner. To effectively access these skills and the funding essential to implement costly solutions means that communities rely upon the support and cooperation of all levels of government and the different departments and agencies within government.
The benefits of cooperation between all levels of government and the different jurisdictions was highlighted by the 2002 Council of Australian Governments (COAG) review of Natural Disaster Mitigation, Relief and Recovery Arrangements (COAG 2004). This led to the formation of the National Flood Risk Advisory Group (NFRAG), a working group of the Australian Emergency Management Committee (AEMC), in late 2006. The membership of NFRAG includes representatives of each of the States and Territories, the Australian Government, the Australian Local Government Association, the research community, the Australian Building Code Board, and the Insurance Council of Australia.
The role of NFRAG is to provide expert advice to the AEMC and its other committees on flood risk management in general and in the implementation and subsequent follow up of the COAG reform commitments. As part of its role, the NFRAG has prepared its vision and objectives for flood risk management in Australia, a copy of which is appended. It provides guidance on the responsibility of government and the community for the effective management of flood risk. The guideline also discusses the importance of understanding both flood risk and flood behaviour for decision-making with respect to managing risk for both future as well as existing developments.
This guideline will form part of the work NFRAG is leading to provide national guidance on flood risk management through an update of the Australian Emergency Manuals on flood management published by Emergency Management Australia which will be consolidated with an update to “Floodplain Management in Australia: Best Practice Principles and Guidelines” (SCARM Report 73, 2000). This latter document will outline how the emergency risk management process and the associated national risk assessment framework can be used for floodplain management in an effective and robust way, for informed strategic decision-making on flood risk management at a local level with effective community involvement. Progress on updating this manual along with the other flood manuals in this series is continuing. Revision of the full range of manuals is expected to be completed in 2009.
References
BTE (2001) Economic Cost of Natural Disasters in Australia. Report 103, Bureau of Transport Economics, Canberra.
COAG (2004) Natural Disasters in Australia. Reforming Mitigation, Relief and Recovery Arrangements. A report to the Council of Australian Governments by a high-level officials’ group, August 2002, Department of Transport and Regional Services, Canberra.
EMA (1999) Managing the Floodplain. Australian Emergency Management Series, Part 3, Volume 3, Guide 3, Emergency Management Australia, Canberra.
SCARM (2000) Floodplain Management in Australia: Best Practice Principles and Guidelines. Agriculture and Resource Management Council of Australia and New Zealand, Standing Committee on Agriculture and Resource Management (SCARM). Report No 73. CSIRO Publishing, 2000
Cox, G and Gutteridge Haskins and Davey (2001). Analysis of Community Attitudes of Flood Related Risks Volumes 1 and 2, Hawkesbury Nepean Floodplain Management Strategy, Parramatta.
NSW Department of Environment and Climate Change October (2007). Floodplain Risk Management Guideline on Residential Flood Damages.
About the authorsThe paper and guideline were put together by the NFRAG under the leadership of Duncan McLuckie, the Manager Urban Flood, New South Wales, Department of Environment and Climate Change. He can be contacted on [email protected].
The National Flood Risk Advisory Group provides expert advice to the Australian Emergency Management Committee and its other committees on flood risk management and in the implementation and follow up of the COAG reform commitments.
For further information on the committee, or to provide feedback on the document Flood Risk Management in Australia: Vision, Objectives and Guidance, please contact the NFRAG Secretariat ([email protected] or [email protected]).
R
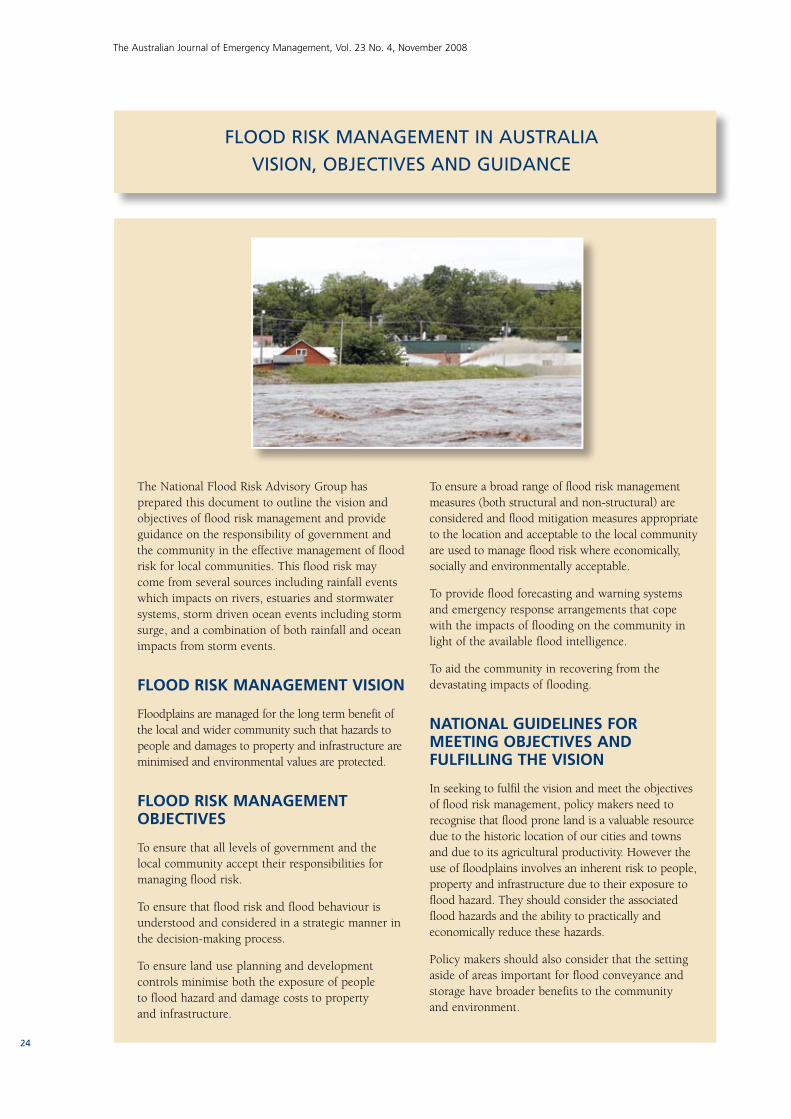
24
The Australian Journal of Emergency Management, Vol. 23 No. 4, November 2008
The National Flood Risk Advisory Group has prepared this document to outline the vision and objectives of flood risk management and provide guidance on the responsibility of government and the community in the effective management of flood risk for local communities. This flood risk may come from several sources including rainfall events which impacts on rivers, estuaries and stormwater systems, storm driven ocean events including storm surge, and a combination of both rainfall and ocean impacts from storm events.
FLOOD RISK MANAGEMENT VISION
Floodplains are managed for the long term benefit of the local and wider community such that hazards to people and damages to property and infrastructure are minimised and environmental values are protected.
FLOOD RISK MANAGEMENT OBJECTIVES
To ensure that all levels of government and the local community accept their responsibilities for managing flood risk.
To ensure that flood risk and flood behaviour is understood and considered in a strategic manner in the decision-making process.
To ensure land use planning and development controls minimise both the exposure of people to flood hazard and damage costs to property and infrastructure.
To ensure a broad range of flood risk management measures (both structural and non-structural) are considered and flood mitigation measures appropriate to the location and acceptable to the local community are used to manage flood risk where economically, socially and environmentally acceptable.
To provide flood forecasting and warning systems and emergency response arrangements that cope with the impacts of flooding on the community in light of the available flood intelligence.
To aid the community in recovering from the devastating impacts of flooding.
NATIONAL GUIDELINES FOR MEETING OBJECTIVES AND FULFILLING THE VISION
In seeking to fulfil the vision and meet the objectives of flood risk management, policy makers need to recognise that flood prone land is a valuable resource due to the historic location of our cities and towns and due to its agricultural productivity. However the use of floodplains involves an inherent risk to people, property and infrastructure due to their exposure to flood hazard. They should consider the associated flood hazards and the ability to practically and economically reduce these hazards.
Policy makers should also consider that the setting aside of areas important for flood conveyance and storage have broader benefits to the community and environment.
FLOOD RISK MANAGEMENT IN AUSTRALIAVISION, OBJECTIVES AND GUIDANCE
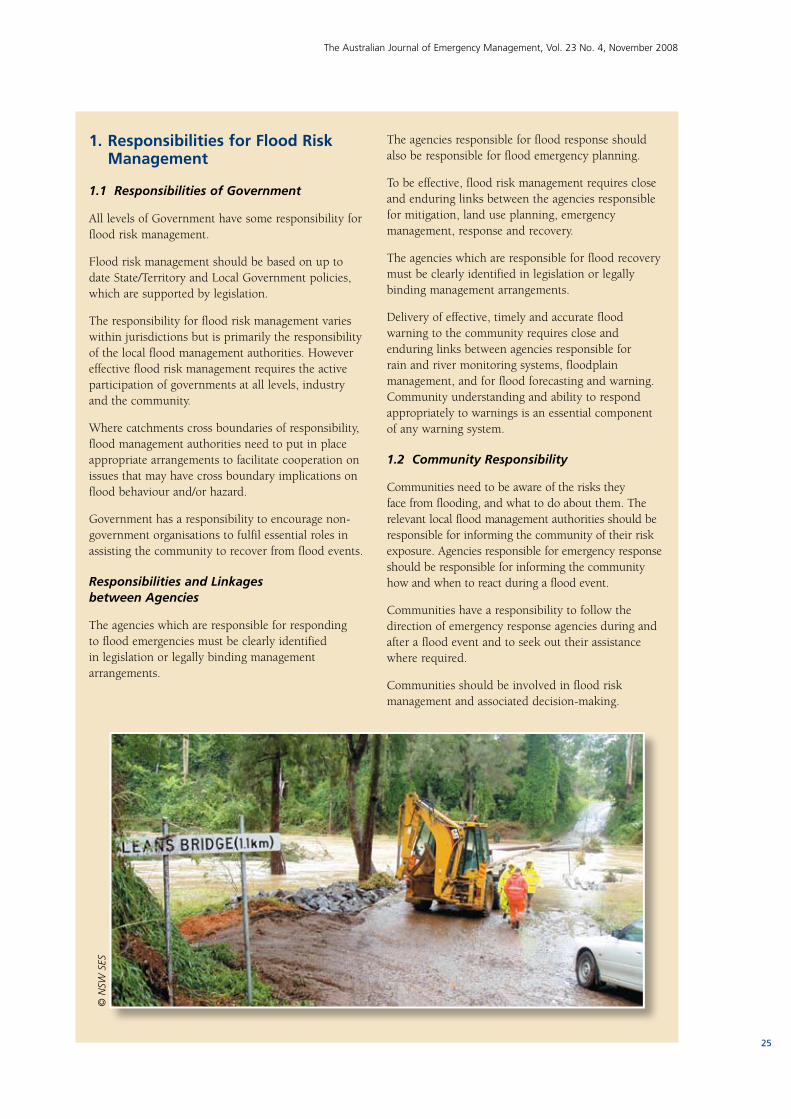
25
The Australian Journal of Emergency Management, Vol. 23 No. 4, November 2008
1. Responsibilities for Flood Risk Management
1.1 Responsibilities of Government
All levels of Government have some responsibility for flood risk management.
Flood risk management should be based on up to date State/Territory and Local Government policies, which are supported by legislation.
The responsibility for flood risk management varies within jurisdictions but is primarily the responsibility of the local flood management authorities. However effective flood risk management requires the active participation of governments at all levels, industry and the community.
Where catchments cross boundaries of responsibility, flood management authorities need to put in place appropriate arrangements to facilitate cooperation on issues that may have cross boundary implications on flood behaviour and/or hazard.
Government has a responsibility to encourage non-government organisations to fulfil essential roles in assisting the community to recover from flood events.
Responsibilities and Linkages between Agencies
The agencies which are responsible for responding to flood emergencies must be clearly identified in legislation or legally binding management arrangements.
The agencies responsible for flood response should also be responsible for flood emergency planning.
To be effective, flood risk management requires close and enduring links between the agencies responsible for mitigation, land use planning, emergency management, response and recovery.
The agencies which are responsible for flood recovery must be clearly identified in legislation or legally binding management arrangements.
Delivery of effective, timely and accurate flood warning to the community requires close and enduring links between agencies responsible for rain and river monitoring systems, floodplain management, and for flood forecasting and warning. Community understanding and ability to respond appropriately to warnings is an essential component of any warning system.
1.2 Community Responsibility
Communities need to be aware of the risks they face from flooding, and what to do about them. The relevant local flood management authorities should be responsible for informing the community of their risk exposure. Agencies responsible for emergency response should be responsible for informing the community how and when to react during a flood event.
Communities have a responsibility to follow the direction of emergency response agencies during and after a flood event and to seek out their assistance where required.
Communities should be involved in flood risk management and associated decision-making.
© N
SW S
ES
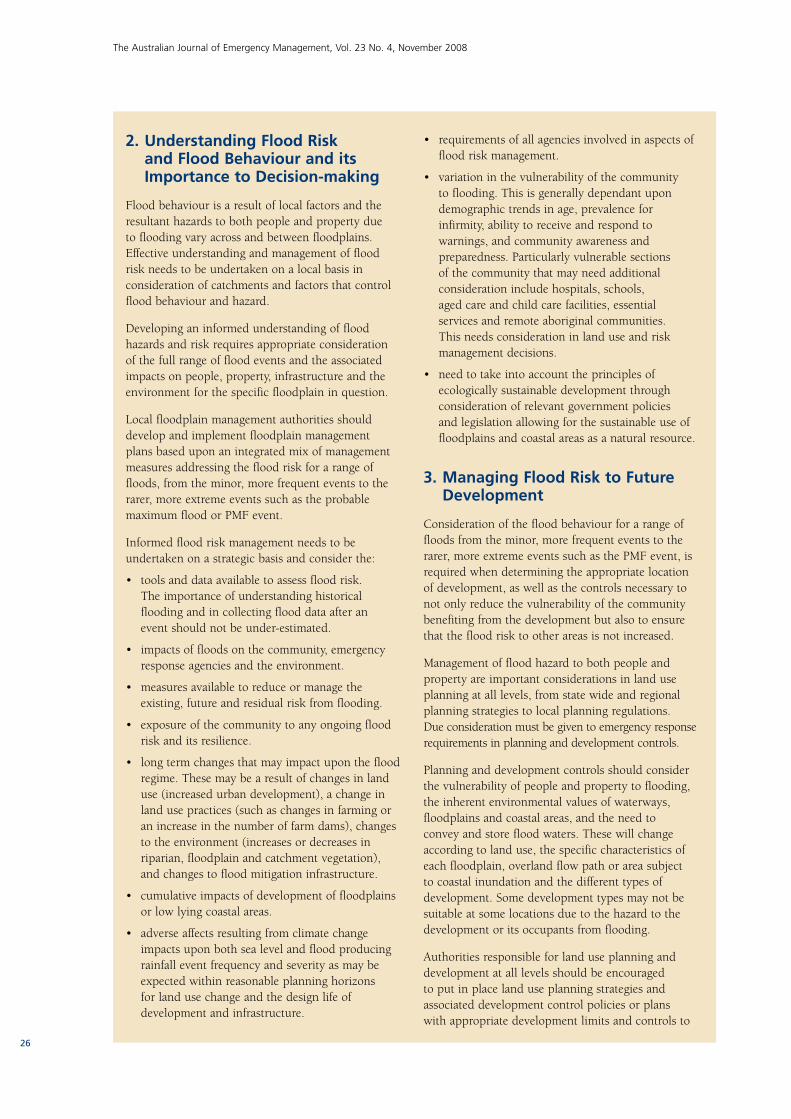
26
The Australian Journal of Emergency Management, Vol. 23 No. 4, November 2008
2. Understanding Flood Risk and Flood Behaviour and its Importance to Decision-making
Flood behaviour is a result of local factors and the resultant hazards to both people and property due to flooding vary across and between floodplains. Effective understanding and management of flood risk needs to be undertaken on a local basis in consideration of catchments and factors that control flood behaviour and hazard.
Developing an informed understanding of flood hazards and risk requires appropriate consideration of the full range of flood events and the associated impacts on people, property, infrastructure and the environment for the specific floodplain in question.
Local floodplain management authorities should develop and implement floodplain management plans based upon an integrated mix of management measures addressing the flood risk for a range of floods, from the minor, more frequent events to the rarer, more extreme events such as the probable maximum flood or PMF event.
Informed flood risk management needs to be undertaken on a strategic basis and consider the:
• toolsanddataavailabletoassessfloodrisk. The importance of understanding historical flooding and in collecting flood data after an event should not be under-estimated.
• impactsoffloodsonthecommunity,emergencyresponse agencies and the environment.
• measuresavailabletoreduceormanagetheexisting, future and residual risk from flooding.
• exposureofthecommunitytoanyongoingfloodrisk and its resilience.
• longtermchangesthatmayimpactuponthefloodregime. These may be a result of changes in land use (increased urban development), a change in land use practices (such as changes in farming or an increase in the number of farm dams), changes to the environment (increases or decreases in riparian, floodplain and catchment vegetation), and changes to flood mitigation infrastructure.
• cumulativeimpactsofdevelopmentoffloodplainsor low lying coastal areas.
• adverseaffectsresultingfromclimatechangeimpacts upon both sea level and flood producing rainfall event frequency and severity as may be expected within reasonable planning horizons for land use change and the design life of development and infrastructure.
• requirementsofallagenciesinvolvedinaspectsofflood risk management.
• variationinthevulnerabilityofthecommunityto flooding. This is generally dependant upon demographic trends in age, prevalence for infirmity, ability to receive and respond to warnings, and community awareness and preparedness. Particularly vulnerable sections of the community that may need additional consideration include hospitals, schools, aged care and child care facilities, essential services and remote aboriginal communities. This needs consideration in land use and risk management decisions.
• needtotakeintoaccounttheprinciplesofecologically sustainable development through consideration of relevant government policies and legislation allowing for the sustainable use of floodplains and coastal areas as a natural resource.
3. Managing Flood Risk to Future Development
Consideration of the flood behaviour for a range of floods from the minor, more frequent events to the rarer, more extreme events such as the PMF event, is required when determining the appropriate location of development, as well as the controls necessary to not only reduce the vulnerability of the community benefiting from the development but also to ensure that the flood risk to other areas is not increased.
Management of flood hazard to both people and property are important considerations in land use planning at all levels, from state wide and regional planning strategies to local planning regulations. Due consideration must be given to emergency response requirements in planning and development controls.
Planning and development controls should consider the vulnerability of people and property to flooding, the inherent environmental values of waterways, floodplains and coastal areas, and the need to convey and store flood waters. These will change according to land use, the specific characteristics of each floodplain, overland flow path or area subject to coastal inundation and the different types of development. Some development types may not be suitable at some locations due to the hazard to the development or its occupants from flooding.
Authorities responsible for land use planning and development at all levels should be encouraged to put in place land use planning strategies and associated development control policies or plans with appropriate development limits and controls to

27
The Australian Journal of Emergency Management, Vol. 23 No. 4, November 2008
manage flood hazard to both people and property. It should be recognised that controls can be expected to vary across the floodplain as the factors influencing flood hazard and the degree of flood hazard vary.
4. Managing Flood Risk to Existing Development
Consideration should be given to mitigating flood hazard where economic and socially acceptable; to reduce its devastating impacts on the community rather than relying on response and recovery.
Management of flood risk to existing development needs to consider the potential impacts of a range of floods from the minor, more frequent events to the rarer, more extreme events such as the PMF event in deciding upon appropriate mitigation strategies. These will generally relate to a specific area and they will need to consider future development needs or constraints as well as make provision for any flood risk that cannot be eliminated. A wide range of mitigation measures should be considered to ensure that the most appropriate and cost effective measures are selected and that there is community acceptance of the residual exposure to flood risk.
5. Flood Warning and Response - Enabling People to be Safe
Effective flood warning systems are required as part of flood response arrangements for the specific flood problem in question. Flood warning systems may be simple or technically complex. They must be designed to serve the particular needs of the emergency response agencies and community being warned.
Effective flood warning messages should enable the public to understand the threat posed by the flood event, the action they should take in response to this threat, and the assistance that may be available to them. The use of consistent language in flood
predictions and flood warnings can assist the public understanding of warnings.
A high standard of flood emergency planning based on State/Territory guidelines is fundamental to effective flood risk management. It should be subject to regular audit.
Flood Emergency Response:
• needstobebasedonfloodintelligencefromall credible sources. Flood intelligence should be improved through data collection after flood events and using information from flood investigations and the information gathered as part of these investigations.
• shouldincludedetailedevacuationplanningwherehuman populations are threatened.
• shouldidentifyinfrastructure(suchasemergencyhospitals and evacuation centres and routes and services to them (including emergency water, sewerage and power supplies)) critical to emergency response and recovery and understand the limitations that flooding may place upon its operation and use during and after an event.
6. Recovery After a Flood Event
Flood recovery operations may involve a range of agencies from different levels of government and non-government organisations. In response to large scale events a coordinating committee of relevant agencies should be established and the lead agency for each area of recovery should be identified. “One-Stop-Shop” arrangements for government and non-government assistance may assist in the recovery of the community in the aftermath of major flood events.
The mobilisation of flood recovery operations must commence as soon as response operations begin.
Flood recovery arrangements will need to take account of the availability or otherwise of insurance within the impact area.

28
The Australian Journal of Emergency Management, Vol. 23 No. 4, November 2008
The 2008 Australian Safer Communities Awards ceremony
was held in the Mural Hall at Parliament House, Canberra on
Tuesday 11 November 2008.
The Awards recognise best practices and innovations that
help to build safer communities. They cover organisations and
individuals working in risk assessment, research, education and
training, information and knowledge management, prevention,
preparedness, response and recovery.
The Attorney-General, the Hon Robert McClelland MP,
presented the Awards.
SAFER COMMUNITIES
AUSTRALIAN
AWARDS
Paul McGuiggan, Geoff Luther (New South Wales Fire Brigades, Australian
Communications & Media Authority).
Tim Wall, Andrew Thompson (Shire of Busselton).
Yair Miller, Alan Deutsch, Ronnie Figdor (New South Wales Jewish Board of Deputies, New South Wales Jewish Board of Deputies,
Jewish Emergency Management Plan - Victoria).
Mary Ireland, Martin Lindsell (South Australian Department of Families
& Communities, City of Playford).
Rod Wright, Steve Kozlowski, Rob Cook (East Gippsland Shire Council).
Zoltan Maklary (Transurban Victoria).
Rachael Uhr, Nicola Moore, Michael Dickinson (Local Government Association of Queensland,
Emergency Management Queensland, Local Government Association of Queensland).
Mollie Thomas, Col Mitchell, Ian Gannell (Campbelltown City Council,
Wollindilly Council, Camden Council).
David Holland, Nigel Taylor (Life Saving Victoria).
Mel Fazackerley (Tasman Council).
Lewis Winter (City of Bunbury).
Maria Fletcher, Steve Pendlebury (Heritage Factory, Tasmania Flood
Warning Consultative).

29
The Australian Journal of Emergency Management, Vol. 23 No. 4, November 2008
29For more information about the Australian Safer Communities Awards
(ASCA), please refer to www.ema.gov.au and select the ASCA link.
Winner - State/Territory Government Agency
Emergency Management Queensland and the Local Govt Association of Queensland – ‘Red Alert’ and ‘Get Ready Kidnas’ Disaster Education for Young People and Children Project
Highly Commended - State/Territory Government Agency
New South Wales Fire Brigades on behalf of the 2007 National Triple Zero (000) Awareness Campaign – 2007 National Triple Zero (000) Awareness Campaign
Highly Commended - State/Territory Government Agency
South Australian Department of Families and Communities – Virginia Safety in Emergencies
Winner – Local Government East Gippsland Shire Council, Victoria – Compass Emergency Recovery Management System
Winner – Local Government City of Bunbury WA – RISK - Regional Information Sharing of Knowledge
Highly Commended – Local Government
Tasman Council Tasmania – Property Bushfire Risk Management Plan Development Kit
Highly Commended – Local Government Shire of Busselton, WA – Living Safely in Bush Fire Prone Areas
Highly Commended – Local Government
Campbelltown City Council, Camden Council and Wollondilly Shire Council NSW – ‘Drives for Learners in Macarthur’ Booklet and Log Book Run Events
Winner - Volunteer Organisations
New South Wales Jewish Board of Deputies – Jewish Emergency Management Plan for NSW
Winner – Private Sector Organisations Transurban Victoria – CityLink Tunnel Safety Project
Winner – Education, Training and Research Bodies
Tasmanian Flood Warning Consultative Committee – Floods and You Teaching Resource
Winner – Education, Training and Research Bodies
Northern Territory Fire and Rescue Service – Smart Sparx – Remote Communities Fire Education Program
Winner – Not-for-Profit Organisations
Life Saving Victoria – Culturally and Linguistically Diverse Communities – Discovering the Australian Lifesaver
Winner – Projects of National Significance or Cross-Jurisdictional
Surf Life Saving Australia – The Australian Coastal Public Safety Guidelines
Highly Commended – Projects of National Significance or Cross-Jurisdictional
Australian Geomechanics Society & Sydney Coastal Councils Group – Landslide Risk Management Guidelines
Highly Commended – Projects of National Significance or Cross-Jurisdictional
Mitigation of the Adverse Impact of Cyclones Steering Group Queensland – Mitigating the Adverse Impacts of Cyclones – Evacuation and Shelter
Emergency Management Queensland and the Local Govt Association of
CATEGORY RECIPIENT/PROJECT
Alan Stephens, Glenda Ramage (Northern Territory Fire and Rescue Services).
Andrew Leventhall, Neil Benson (Australian Geomechanics Society).
Trevor Leverington, Bruce Grady (Queensland Department of Public Works,
Emergency Management Queensland).
Norm Farmer, Peter Agnew (Surf Life Saving Australia).

30
The Australian Journal of Emergency Management, Vol. 23 No. 4, November 2008
AbstractTsunami planning and preparation in Western Australia (WA) has been shaped by a collaborative project between the Fire and Emergency Services Authority (WA) and Geoscience Australia. The project has led to the development of tsunami impact assessments in communities identified as vulnerable to tsunami inundation. Tsunami preparation and emergency response plans have been initiated, based on community engagement workshops to increase stakeholder awareness of the science and risk of tsunami. The project has integrated data and expertise across State and Federal government bodies to build safer communities in WA.
This tsunami project demonstrates the advantages of combining science, technology and spatial data to achieve a leading edge risk assessment.
Introduction
The tragic events of the Indian Ocean tsunami on 26 December 2004 highlighted shortcomings in the response and alert systems for the threat of tsunami to Western Australia’s (WA) coastal communities.
The relative risk of a tsunami event to the towns, remote indigenous communities, and infrastructure for the oil, gas and mining industries was not clearly understood in 2004. Consequently, no current detailed response plans for a tsunami event in WA coastal areas existed.
The Indian Ocean tsunami affected the WA coastline from Bremer Bay on the south coast, to areas north of Exmouth on the north-west coast, with a number of
people rescued from abnormally strong currents and rips, personal belongings were reportedly inundated by wave activity at some beaches. More than 30 cm of water flowed down a coast-side road in Geraldton on the mid-west coast, and Geordie Bay at Rottnest Island (19 km off the coast of Fremantle) experienced five “tides” in three hours, resulting in boats hitting the ocean bed a number of times.
Vivid images of the devastation caused by the 2004 event across a wide geographical area changed the public perception of tsunami and demonstrated the potential enormity of impact from this low frequency, but high consequence natural hazard.
The source location of the Indian Ocean tsunami event, the Sunda Arc, is widely recognised as a high probability area for intra-plate earthquakes. WA’s close proximity to the area demands a better understanding of tsunami risk through modelling of the potential social and economic impacts on communities and critical infrastructure along the Western Australian coast. Under WA’s emergency management arrangements, the Fire and Emergency Services Authority (FESA), has responsibility for ensuring effective emergency management plans are in place for tsunami events across the PPRR1 framework.
To improve community awareness and understanding of tsunami hazard and impact for Western Australia, FESA established a partnership with Geoscience Australia (GA) to utilise their considerable scientific expertise to develop numerical modelling capabilities, three-dimensional visualisations and GIS-based decision making tools for tsunami impact on selected WA coastal communities. Modelling has been completed for the north-west communities of Broome, Port Hedland, Dampier, Karratha, Exmouth and Onslow. These locations were selected following a probabilistic tsunami assessment for WA conducted by Burbidge et al, 2007 and combined with anecdotal evidence of community
Tsunami planning and preparation in Western Australia: application of scientific modelling
and community engagementHall, Stevens and Sexton explain how a leading-edge tsunami impact assessments project
combines science, technology and spatial data.
1 Prevention, Preparedness, Response and Recovery (PPRR).

31
The Australian Journal of Emergency Management, Vol. 23 No. 4, November 2008
impact experienced from the Boxing Day 2004 tsunami. A second phase is now focussed on selected coastal communities from Carnarvon to Busselton including a number of Perth metropolitan coastal locations.
The best available scientific data has greatly assisted in shaping local land-use and emergency response planning. It also provides a tool to assist emergency responders in the event of a tsunami alert and guides community awareness programs undertaken by FESA. This project highlights the need for high-quality elevation datasets to support tsunami research.
Methodology
The tsunami project for Western Australia consisted of two parts:
• thescientificprocess,whichconsideredthetsunamirisk and;
• thepreparationandemergencyresponserequiredfor a tsunami event, which involved community engagement workshops with stakeholders, to define the science and risk of tsunamis.
The project objectives were to:
• identifycoastalareasthatmaybeatriskfromtsunami inundation;
• identifyemergencymanagersandresponderswhorequire extra knowledge of the risk and challenges of tsunami;
• facilitatethelocaltsunamiemergencyresponseplanning for each local government to be affected by tsunami;
• definedifferingrolesandresponsibilitiesoftheemergency managers and responders;
• developandimplementacommunicationplantoraise stakeholder awareness of the potential impacts of tsunami; and
• enhanceplanningrequirementsunderWAEmergency Planning legislation.
The Scientific Process
The scientific process adopted in this project followed the standard natural hazard risk methodology. This methodology starts with developing an understanding of the source and likelihood of the hazard. These factors are then combined with vulnerability and exposure models, to estimate potential risk. The process was underpinned by the needs of emergency managers and reviewed regularly through strong communication and interaction between FESA and GA.
The methodology adopted to assess tsunami risk is based predominantly on computational modelling. The methodology can be described by the following five key components:
1. A source model that describes the likelihood of a tsunamigenic source (earthquake, landslide, volcano or asteroid) initiating a tsunami of a given size and shape at a given location;
2. A tsunami deep-water propagation model to propagate the wave from the source to the shallow water off the coast of interest, typically 100m water depth. The results of this stage can be used to produce a tsunami hazard map for the region;
3. An inundation model to determine the run-up (maximum elevation above sea level reached by the wave) and inundation distance (maximum distance from the coast reached by the wave) at a given locality on the coast;
4. A vulnerability model that characterises the nature and magnitude of the damage that a structure will experience from a wave of a given amplitude and velocity, and;
5. An exposure database for the area of interest. Combining the hazard, inundation, vulnerability and exposure data together (steps 3 to 5), formed a tsunami risk assessment for the area concerned.
The outputs from steps 1 and 2 were critical in allowing FESA to undertake community profiling and identify communities at risk. The outputs consisted of probabilistic offshore tsunami hazard maps that describe the minimum offshore tsunami wave height for a given return period, or conversely, the probability of exceedence for a given wave height, Burbidge et al, 20072. An example of an offshore tsunami hazard is seen in Figure 1 where the minimum offshore wave height has a chance of 1 in 500 years of occurring. Additionally, these outputs also allow the tsunami source to be identified that contributes to that hazard. Combining the inundation, vulnerability and exposure data together (steps 3 to 5), formed a tsunami risk assessment for the area concerned.
The modelling methodology has relied on two separate models; URS for the source model (see Wang et al 2006) and deep water propagation (based on the model of Satake et al 1992) and ANUGA (see Nielsen et al, 2005) for the inundation and impact ashore. The reason why two models are used are twofold; firstly, it is important to understand the offshore hazard separately so that locations can be prioritised for detailed modelling and secondly, it is computationally intensive to use one model to conduct inundation modelling at one location.
2 For details on how the probability of tsunami hazard are calculated, see Burbidge et al, 2007.

32
The Australian Journal of Emergency Management, Vol. 23 No. 4, November 2008
The URS and ANUGA models solve the same wave equations and utilise different computational methods that are advantageous to their prime purpose. Both these models have been validated against benchmark problems and continue to be validated against tsunami events when data is available. Each model requires a range of inputs. The source model component of the URS model requires geophysical inputs such as convergence rates and seismicity information, and the propagation component requires bathymetry grids. The output of the propagation component of the URS model is then an input to ANUGA. In addition, ANUGA requires bathymetry and topography at a much higher resolution than URS as the tsunami propagation behaviour is increasingly complicated in the near shore environment.
FESA used the hazard map to identify communities for detailed inundation modelling and to inform a discussion of the type of event they wished to plan for. FESA decided to plan for the plausible “worst-case” scenario which led to source events with a 1 in 10,000 year return period being selected from the hazard map. Three tsunamis were selected to be representative of the 1 in 10,000 year hazard for the North West Shelf with the larger of these events generated south of Java and the remaining two generated further east in the Sumba section of the Indonesian Arc, see Burbidge et al 2007.
The deep-water propagation model was then coupled with the inundation model to estimate the inundation depth and speed and resulting extent. To make an impact assessment, the outputs from the inundation model were then coupled with exposure and vulnerability models to determine the effect on structures. The vulnerability models have been developed for framed residential construction based on limited data found in the literature as well as observations from the Indian Ocean tsunami event. The models predict the probability of collapse for an exposed population and incorporate the following parameters thought to influence building damage; inundation depth at building, distance from the coast, building material (residential framed construction) and inundation depth in house above floor level, Papathoma and Dominey-Howes, 2003. The scientific process is summarised in the schematic shown in Figure 2. However, there is limited data available to develop these models and observations from more recent events are assisting in the ongoing development of these models. Based on this limited understanding, the number of residential buildings is reported in terms of structural and contents losses, rather than damage.
The National Exposure Information System (NEXIS) contains information about building type, construction type, people, replacement value and contents value at buildings level, Krishna and Dhu, 2007. It is built from a number of fundamental datasets, such as Census, Mesh blocks, Cadastre, ABS Housing Survey and the Geo-coded National Address Framework etc. NEXIS-Residential is used to estimate the number of residential buildings affected by a tsunami event. Business or commercial buildings and infrastructure are not considered in this project as this NEXIS component is not yet mature and the vulnerability models are developed for residential buildings only. The input datasets are of various quality and resolution; therefore NEXIS derives building level information based on generic rules and assumptions which produce errors and uncertainties. Any estimates of damage based on this data therefore are compared on a relative scale, rather than in absolute figures.
Figure 1: Offshore Tsunami Hazard Map describing the minimum off-shore tsunami height with a probability of exceedance of 1 in 500.
Figure 2: Schematic of modelling process.
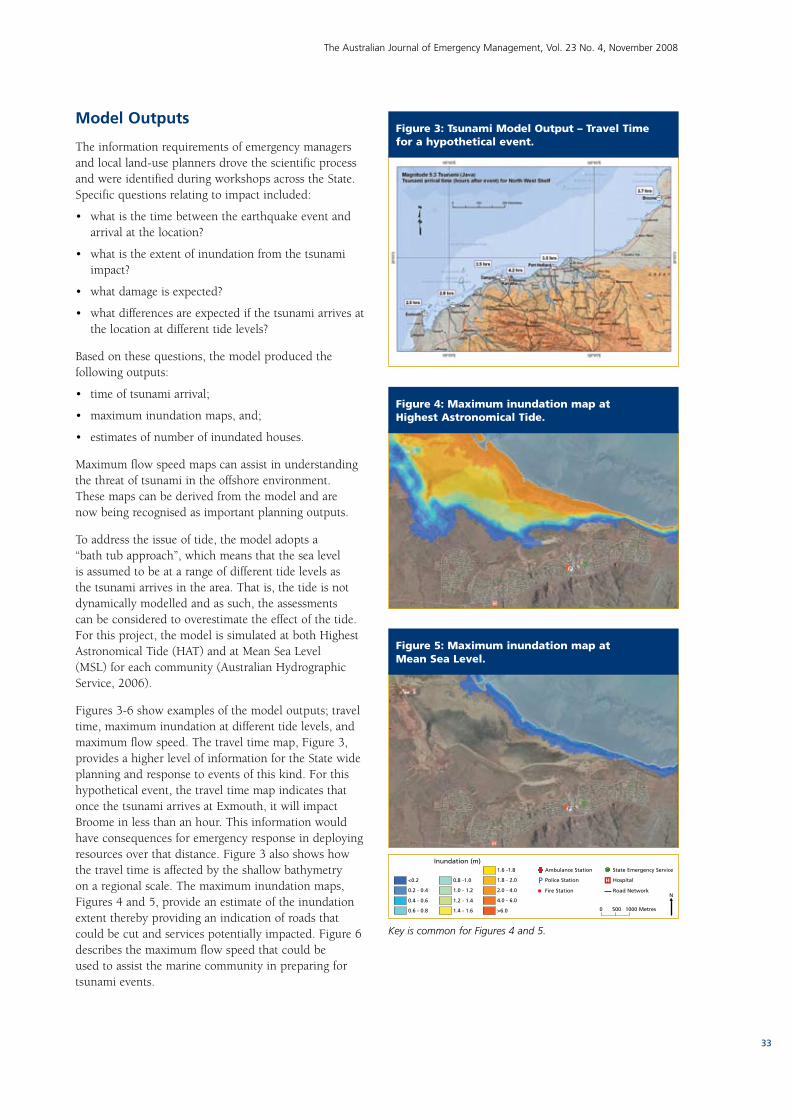
33
The Australian Journal of Emergency Management, Vol. 23 No. 4, November 2008
Model Outputs
The information requirements of emergency managers and local land-use planners drove the scientific process and were identified during workshops across the State. Specific questions relating to impact included:
• whatisthetimebetweentheearthquakeeventandarrival at the location?
• whatistheextentofinundationfromthetsunamiimpact?
• whatdamageisexpected?
• whatdifferencesareexpectedifthetsunamiarrivesatthe location at different tide levels?
Based on these questions, the model produced the following outputs:
• timeoftsunamiarrival;
• maximuminundationmaps,and;
• estimatesofnumberofinundatedhouses.
Maximum flow speed maps can assist in understanding the threat of tsunami in the offshore environment. These maps can be derived from the model and are now being recognised as important planning outputs.
To address the issue of tide, the model adopts a “bath tub approach”, which means that the sea level is assumed to be at a range of different tide levels as the tsunami arrives in the area. That is, the tide is not dynamically modelled and as such, the assessments can be considered to overestimate the effect of the tide. For this project, the model is simulated at both Highest Astronomical Tide (HAT) and at Mean Sea Level (MSL) for each community (Australian Hydrographic Service, 2006).
Figures 3-6 show examples of the model outputs; travel time, maximum inundation at different tide levels, and maximum flow speed. The travel time map, Figure 3, provides a higher level of information for the State wide planning and response to events of this kind. For this hypothetical event, the travel time map indicates that once the tsunami arrives at Exmouth, it will impact Broome in less than an hour. This information would have consequences for emergency response in deploying resources over that distance. Figure 3 also shows how the travel time is affected by the shallow bathymetry on a regional scale. The maximum inundation maps, Figures 4 and 5, provide an estimate of the inundation extent thereby providing an indication of roads that could be cut and services potentially impacted. Figure 6 describes the maximum flow speed that could be used to assist the marine community in preparing for tsunami events.
Figure 3: Tsunami Model Output – Travel Time for a hypothetical event.
Figure 4: Maximum inundation map at Highest Astronomical Tide.
Figure 5: Maximum inundation map at Mean Sea Level.
<0.2 0.8 -1.0
1.6 -1.8
Inundation (m)
0.2 - 0.4 1.0 - 1.2
1.8 - 2.0
0.4 - 0.6 1.2 - 1.4
2.0 - 4.0
0.6 - 0.8 1.4 - 1.6
4.0 - 6.0
>6.0
Ambulance Station
Police Station Hospital
Fire Station Road Network
State Emergency Service+
•P
0 500 1000 Metres
N
Key is common for Figures 4 and 5.
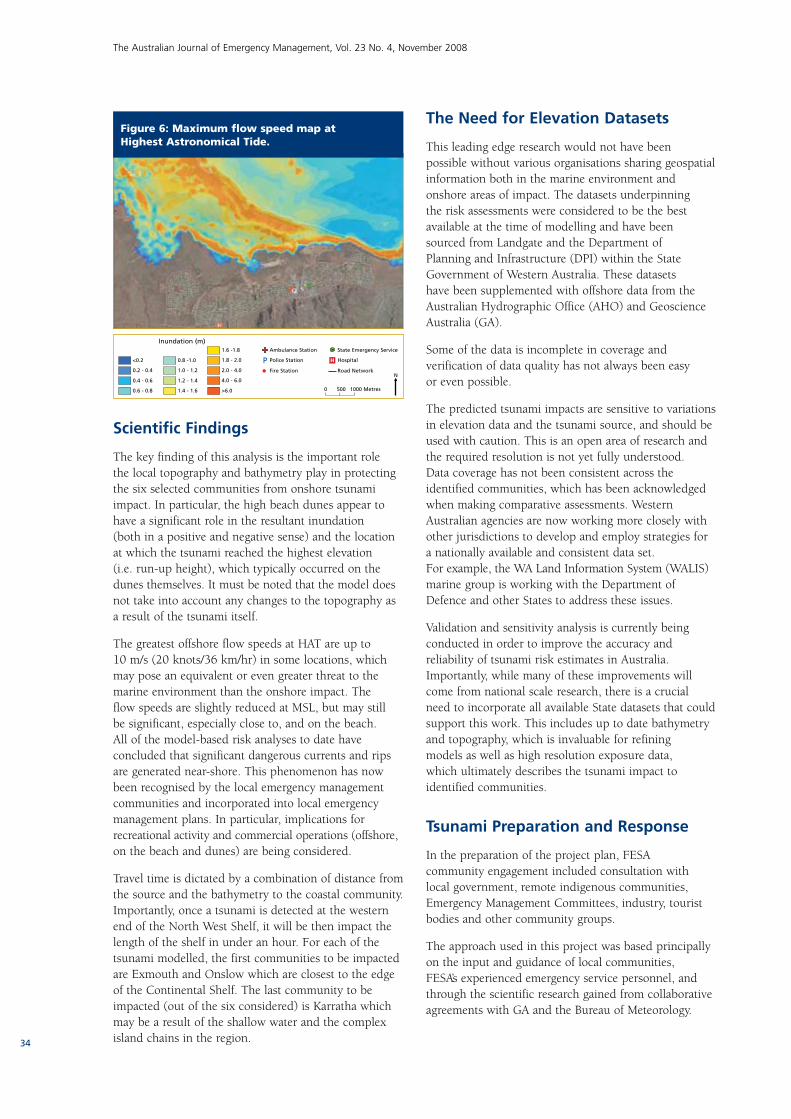
34
The Australian Journal of Emergency Management, Vol. 23 No. 4, November 2008
Scientific Findings
The key finding of this analysis is the important role the local topography and bathymetry play in protecting the six selected communities from onshore tsunami impact. In particular, the high beach dunes appear to have a significant role in the resultant inundation (both in a positive and negative sense) and the location at which the tsunami reached the highest elevation (i.e. run-up height), which typically occurred on the dunes themselves. It must be noted that the model does not take into account any changes to the topography as a result of the tsunami itself.
The greatest offshore flow speeds at HAT are up to 10 m/s (20 knots/36 km/hr) in some locations, which may pose an equivalent or even greater threat to the marine environment than the onshore impact. The flow speeds are slightly reduced at MSL, but may still be significant, especially close to, and on the beach. All of the model-based risk analyses to date have concluded that significant dangerous currents and rips are generated near-shore. This phenomenon has now been recognised by the local emergency management communities and incorporated into local emergency management plans. In particular, implications for recreational activity and commercial operations (offshore, on the beach and dunes) are being considered.
Travel time is dictated by a combination of distance from the source and the bathymetry to the coastal community. Importantly, once a tsunami is detected at the western end of the North West Shelf, it will be then impact the length of the shelf in under an hour. For each of the tsunami modelled, the first communities to be impacted are Exmouth and Onslow which are closest to the edge of the Continental Shelf. The last community to be impacted (out of the six considered) is Karratha which may be a result of the shallow water and the complex island chains in the region.
The Need for Elevation Datasets
This leading edge research would not have been possible without various organisations sharing geospatial information both in the marine environment and onshore areas of impact. The datasets underpinning the risk assessments were considered to be the best available at the time of modelling and have been sourced from Landgate and the Department of Planning and Infrastructure (DPI) within the State Government of Western Australia. These datasets have been supplemented with offshore data from the Australian Hydrographic Office (AHO) and Geoscience Australia (GA).
Some of the data is incomplete in coverage and verification of data quality has not always been easy or even possible.
The predicted tsunami impacts are sensitive to variations in elevation data and the tsunami source, and should be used with caution. This is an open area of research and the required resolution is not yet fully understood. Data coverage has not been consistent across the identified communities, which has been acknowledged when making comparative assessments. Western Australian agencies are now working more closely with other jurisdictions to develop and employ strategies for a nationally available and consistent data set. For example, the WA Land Information System (WALIS) marine group is working with the Department of Defence and other States to address these issues.
Validation and sensitivity analysis is currently being conducted in order to improve the accuracy and reliability of tsunami risk estimates in Australia. Importantly, while many of these improvements will come from national scale research, there is a crucial need to incorporate all available State datasets that could support this work. This includes up to date bathymetry and topography, which is invaluable for refining models as well as high resolution exposure data, which ultimately describes the tsunami impact to identified communities.
Tsunami Preparation and Response
In the preparation of the project plan, FESA community engagement included consultation with local government, remote indigenous communities, Emergency Management Committees, industry, tourist bodies and other community groups.
The approach used in this project was based principally on the input and guidance of local communities, FESA’s experienced emergency service personnel, and through the scientific research gained from collaborative agreements with GA and the Bureau of Meteorology.
Figure 6: Maximum flow speed map at Highest Astronomical Tide.
<0.2 0.8 -1.0
1.6 -1.8
Inundation (m)
0.2 - 0.4 1.0 - 1.2
1.8 - 2.0
0.4 - 0.6 1.2 - 1.4
2.0 - 4.0
0.6 - 0.8 1.4 - 1.6
4.0 - 6.0
>6.0
Ambulance Station
Police Station Hospital
Fire Station Road Network
State Emergency Service+
•P
0 500 1000 Metres
N
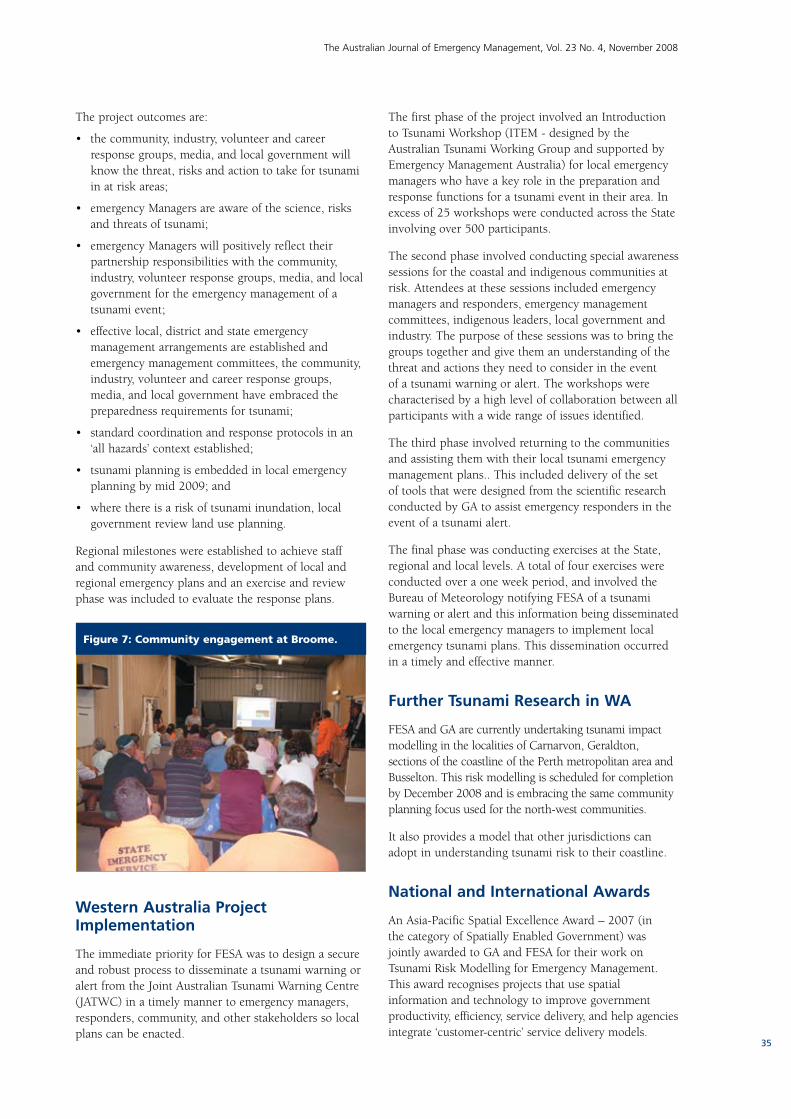
35
The Australian Journal of Emergency Management, Vol. 23 No. 4, November 2008
The project outcomes are:
• thecommunity,industry,volunteerandcareerresponse groups, media, and local government will know the threat, risks and action to take for tsunami in at risk areas;
• emergencyManagersareawareofthescience,risksand threats of tsunami;
• emergencyManagerswillpositivelyreflecttheirpartnership responsibilities with the community, industry, volunteer response groups, media, and local government for the emergency management of a tsunami event;
• effectivelocal,districtandstateemergencymanagement arrangements are established and emergency management committees, the community, industry, volunteer and career response groups, media, and local government have embraced the preparedness requirements for tsunami;
• standardcoordinationandresponseprotocolsinan‘all hazards’ context established;
• tsunamiplanningisembeddedinlocalemergencyplanning by mid 2009; and
• wherethereisariskoftsunamiinundation,localgovernment review land use planning.
Regional milestones were established to achieve staff and community awareness, development of local and regional emergency plans and an exercise and review phase was included to evaluate the response plans.
Western Australia Project Implementation
The immediate priority for FESA was to design a secure and robust process to disseminate a tsunami warning or alert from the Joint Australian Tsunami Warning Centre (JATWC) in a timely manner to emergency managers, responders, community, and other stakeholders so local plans can be enacted.
The first phase of the project involved an Introduction to Tsunami Workshop (ITEM - designed by the Australian Tsunami Working Group and supported by Emergency Management Australia) for local emergency managers who have a key role in the preparation and response functions for a tsunami event in their area. In excess of 25 workshops were conducted across the State involving over 500 participants.
The second phase involved conducting special awareness sessions for the coastal and indigenous communities at risk. Attendees at these sessions included emergency managers and responders, emergency management committees, indigenous leaders, local government and industry. The purpose of these sessions was to bring the groups together and give them an understanding of the threat and actions they need to consider in the event of a tsunami warning or alert. The workshops were characterised by a high level of collaboration between all participants with a wide range of issues identified.
The third phase involved returning to the communities and assisting them with their local tsunami emergency management plans.. This included delivery of the set of tools that were designed from the scientific research conducted by GA to assist emergency responders in the event of a tsunami alert.
The final phase was conducting exercises at the State, regional and local levels. A total of four exercises were conducted over a one week period, and involved the Bureau of Meteorology notifying FESA of a tsunami warning or alert and this information being disseminated to the local emergency managers to implement local emergency tsunami plans. This dissemination occurred in a timely and effective manner.
Further Tsunami Research in WA
FESA and GA are currently undertaking tsunami impact modelling in the localities of Carnarvon, Geraldton, sections of the coastline of the Perth metropolitan area and Busselton. This risk modelling is scheduled for completion by December 2008 and is embracing the same community planning focus used for the north-west communities.
It also provides a model that other jurisdictions can adopt in understanding tsunami risk to their coastline.
National and International Awards
An Asia-Pacific Spatial Excellence Award – 2007 (in the category of Spatially Enabled Government) was jointly awarded to GA and FESA for their work on Tsunami Risk Modelling for Emergency Management. This award recognises projects that use spatial information and technology to improve government productivity, efficiency, service delivery, and help agencies integrate ‘customer-centric’ service delivery models.
Figure 7: Community engagement at Broome.

36
The Australian Journal of Emergency Management, Vol. 23 No. 4, November 2008
The Australian Safer Communities Award - 2007 (sponsored by Emergency Management Australia), category of Pre-Disaster – Projects of National Significance, was jointly awarded to GA and FESA for their development and application of applying state of the art science to model tsunami risk, and the effective communication of this science to inform and underpin local emergency management plans and response arrangements in Western Australia.
Conclusion
The FESA – GA tsunami modelling has improved community safety in WA, by raising community awareness and providing a solid platform of knowledge on which emergency management planners can now base plans. It allows emergency managers to prioritise planning and mitigation activities for communities that are identified at greater risk and provides initial estimates of tsunami impact based on a selection of representative “worst-case” scenarios. FESA can now gain a picture of how a tsunami could affect the length of the WA coastline and also identify potential implications that may compromise emergency response infrastructure.
Emergency management planning is now based on a realistic understanding of the likely consequences of a tsunami in WA. This project has served to emphasise and highlight phenomena associated with tsunami that must be managed for an effective response.
Acknowledgements
FESA wish to acknowledge the assistance of the Australian Government who partially funded this research through the 2007/08 Natural Disaster Mitigation Programme (NDMP) and the Working Together to Manage Emergencies (WTTME) scheme.
References
Burbidge, D., Cummins, P. and Mleczko, R, (2007) A Probabilistic Tsunami Hazard Assessment for Western Australia, Report to the Fire and Emergency Services Authority of Western Australia.
Wang, R., Martin, F. L., and Roth, F., (2006) Computation of deformation induced by earthquakes in a multi-layered crust – FORTRAN programs EDGRN EDCMP, Comp. & Geosc., 29, 195-207 (inc. erratum).
Satake K. Yoshida Y. Abe K., (1992) Tsunami from the Mariana earthquake of April 5, 1990: its abnormal propagation and implications to tsunami potential from outer-rise earthquakes. Geophys Res Lett 19:301–304.
Nielsen, O., Roberts, S., Gray, D., McPherson, A. and Hitchman, A. (2005) Hydrodynamic modelling of coastal inundation, MODSIM 2005 International Congress on Modelling and Simulation. Modelling and Simulation Society of Australian and New Zealand, 518-523, URL: http://www.mssanz.org.au/modsim05/papers/nielsen.pdf.
Papathoma, M. and Dominey-Howes, D. (2003) Tsunami vulnerability assessment and its implications for coastal hazard analysis and disaster management planning, Gulf of Corinth, Greece, Natural Hazards and Earth System Sciences, 3, 733-747.
Nadimpalli, K. and Dhu, T. (2007) National Exposure Information System (NEXIS) for risk assessment, Proceedings of Spatial Sciences Conference, Hobart, May 2007.
Australian Hydrographic Service, (2006), Australian National Tide Tables 2006: Australia, Papua New Guinea, Solomon Islands and Antarctica and East Timor. Australian Hydrographic Publication 11.
About the authorsRussell Stevens is the Director of Research and Liaison at the Fire and Emergency Services Authority (FESA WA) and oversees FESA’s tsunami research activities. Prior to taking up this role Russell was involved in emergency response and planning for 25 years.
Gordon Hall is currently the Director for Corporate Governance and Strategic Projects for the Fire and Emergency Services Authority (FESA) in Western Australia. Prior to this, he was the Project Director for the tsunami warning system for Western Australia following being a Regional Director for the State Emergency Service and FESA.
Dr Jane Sexton is currently leading the tsunami risk modelling activity at Geoscience Australia. Prior to this, Jane worked on applied mathematical aspects of defence acquisition and operational projects at DSTO following combustion projects at the University of Sydney.
R
Figure 8: Some of the FESA and Geoscience Australia team members.
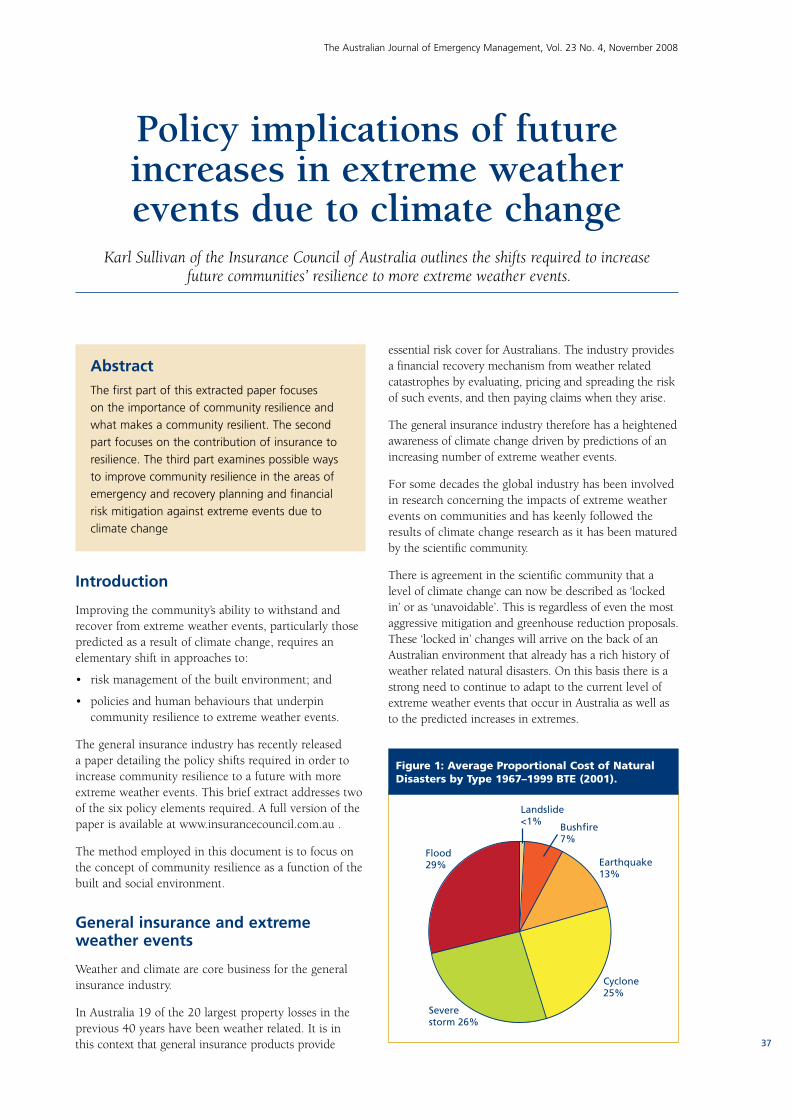
37
The Australian Journal of Emergency Management, Vol. 23 No. 4, November 2008
AbstractThe first part of this extracted paper focuses on the importance of community resilience and what makes a community resilient. The second part focuses on the contribution of insurance to resilience. The third part examines possible ways to improve community resilience in the areas of emergency and recovery planning and financial risk mitigation against extreme events due to climate change
Introduction
Improving the community’s ability to withstand and recover from extreme weather events, particularly those predicted as a result of climate change, requires an elementary shift in approaches to:
• riskmanagementofthebuiltenvironment;and
• policiesandhumanbehavioursthatunderpincommunity resilience to extreme weather events.
The general insurance industry has recently released a paper detailing the policy shifts required in order to increase community resilience to a future with more extreme weather events. This brief extract addresses two of the six policy elements required. A full version of the paper is available at www.insurancecouncil.com.au .
The method employed in this document is to focus on the concept of community resilience as a function of the built and social environment.
General insurance and extreme weather events
Weather and climate are core business for the general insurance industry.
In Australia 19 of the 20 largest property losses in the previous 40 years have been weather related. It is in this context that general insurance products provide
essential risk cover for Australians. The industry provides a financial recovery mechanism from weather related catastrophes by evaluating, pricing and spreading the risk of such events, and then paying claims when they arise.
The general insurance industry therefore has a heightened awareness of climate change driven by predictions of an increasing number of extreme weather events.
For some decades the global industry has been involved in research concerning the impacts of extreme weather events on communities and has keenly followed the results of climate change research as it has been matured by the scientific community.
There is agreement in the scientific community that a level of climate change can now be described as ‘locked in’ or as ‘unavoidable’. This is regardless of even the most aggressive mitigation and greenhouse reduction proposals. These ‘locked in’ changes will arrive on the back of an Australian environment that already has a rich history of weather related natural disasters. On this basis there is a strong need to continue to adapt to the current level of extreme weather events that occur in Australia as well as to the predicted increases in extremes.
Policy implications of future increases in extreme weather events due to climate change
Karl Sullivan of the Insurance Council of Australia outlines the shifts required to increase future communities’ resilience to more extreme weather events.
Figure 1: Average Proportional Cost of Natural Disasters by Type 1967–1999 BTE (2001).

38
The Australian Journal of Emergency Management, Vol. 23 No. 4, November 2008
The focus for the general insurance industry is to assist in increasing community resilience to extreme weather events as they manifest now and how they may manifest into the future.
What is Resilience?
Resilience in the context of an extreme weather event is the measure of a community’s or individual’s ability to respond effectively to change or an extreme event.
Communities that develop a high level of resilience are better able to withstand a crisis event and have an enhanced ability to recover from residual impacts. Communities that possess resilience characteristics can also arrive on the other side of a crisis in a stronger position than pre-event. For example a community with:
• wellrehearsedemergencyplans;
• superiorfiremitigationprocessesinthecoolermonths;
• appropriatebuildingcontrols,suitabletolocalhazards and risks; and
• widelyadoptedpersonalandbusinessfinancialmitigation measures (eg insurance suitable to the risks)
is likely to suffer less during an extreme fire event and is likely to be able to recover quickly both financially and physically, and as a community.
Communities that exhibit poor resilience are unable to effectively absorb the impacts of extreme events and therefore are prone to suffering greater physical,
financial and societal damage. Recovery from the extreme event takes longer and the final results are often that the community is permanently weakened and prone to further impacts from smaller scale events. For example a community with:
• poorfiremitigationprocesses;
• inappropriatebuildingcontrols&landusezoning;and
• alowtakeupofpersonalandbusinessinsurance
that faces the same extreme fire event as in the previous example is likely to suffer greater financial, physical, emotional and societal impact and could be expected to take longer to recover, if it recovers at all.
It’s not just the weather that is changing
It is important to recognise that an increase in the scale and frequency of extreme weather events is not the only factor that will lead to potentially greater impacts on individuals, businesses and the community.
Urban development and growth is literally changing the Australian landscape. Prosperous communities are becoming more densely populated and construction and rebuilding costs increase each year as do the values of the individual assets that can be found inside a geographic area.
As an example, Rhodes in NSW underwent significant (but typical) urban development during the last 70 years.
Figure 2: High vs Poor Resilience Communities – Response to & Recovery from a Crisis Event.
Community with High Resilience CharacteristicsEg – A fire affected community that has:• Superior fire mitigation
efforts• Appropriate building
controls• Appropriate insurance
cover
Community with Poor Resilience CharacteristicsEg – A fire affected community that has:• Poor fire mitigation
processes• Inappropriate building
controls & land use zoning
• A low take up of personal and business insurance
Chart data provided by Insurance Council of Australia.

39
The Australian Journal of Emergency Management, Vol. 23 No. 4, November 2008
Models show that an extreme hail event occurring in this location in 1930 would have cost an equivalent of $5 million. However, due to the increased development in this area, the changes in the nature of its use and a subsequent increase in the value of the assets to be found in the area – the same storm occurring in 2007 yields a potential damage bill of $900 million.
Community resilience to extreme weather events relies fundamentally on the nature of the community and the geography that it occupies. As we move forward into a climate presenting more extreme weather events it is critical that we note and, where necessary adapt urban planning and development to address the growing risks and the consequential losses to the community.
The nexus between community resilience and extreme weather events under climate change
Resilience can be characterised by six key ingredients, which in turn are driven by the community’s understanding and acceptance of the risks they face in their environment.
The policies, procedures and practices that enshrine the community’s approach to maintaining resilience are captured by legislation and regulation at local, state and federal government levels. Building codes, state planning legislation, local government by-laws, zoning arrangements, emergency planning arrangements and even taxation arrangements all serve to guide the community in maintaining a safe and profitable approach to life and business.
This spectrum of regulations and arrangements have been formed over time and have been based upon historical assumptions about the nature, frequency and intensity of extreme weather events and coastal sea levels. For example coastal planning guidelines have been based in part on the assumption of a certain mean sea level for the life of a development. Building codes and standards have also been based upon static assumptions of historic gust wind speeds, and many stormwater mitigation and drainage systems have been designed for historic 1:100 inundation events.
So far, this approach has delivered a fitting balance between the risks and costs to the community. However, present day climate change modelling indicates that many historic assumptions used in making decisions for life-cycle management of the built environment and community operation are no longer appropriate.
This extract will provide a summary of policy conclusions for community emergency planning and financial risk mitigation.
Community emergency & recovery planning
Australian governments have undertaken considerable efforts in recent years to improve emergency response and recovery capabilities in Australia. This has involved investment in training and resources at the tactical level (SES, Fire Brigades etc), at the operational level (State Recovery Committees etc) and in many instances at the community level (local government emergency planning and guidance for personal emergency planning).
Both the States and Commonwealth should continue robust development of Tactical Response Capabilities and inter & intra State Coordination Capabilities. Development of these capabilities must keep pace with any observed change in the frequency, intensity and nature of extreme weather events.
It is recommended that the Australian Emergency Management Committee adopt a standing agenda item regarding climate change observations and weather impacts, to facilitate discussion about growing needs in the emergency services environment to face new or increased threats.
It is equally important that the general insurance industry maintain pace with advancements in government response arrangements, so that delivery of insurance services ‘at the time of greatest need’ following an extreme weather event is as efficient as possible. In this context the general insurance industry will maintain a continuous improvement program for the Industry Catastrophe Coordination Arrangements, first developed in 2007.
The characteristics of a resilient community.
COMMUNITY UNDERSTANDING OF WEATHER RELATED RISKS
RISK APPROPRIATE LANDUSE PLANNING & ZONING
RISK APPROPRIATE MITIGATION MEASURES
RISK APPROPRIATE PROPERTY PROTECTION STANDARDS
FINANCIAL RISK MITIGATION IN THE COMMUNITY
COMMUNITY EMERGENCY & RECOVERY PLANNING

40
The Australian Journal of Emergency Management, Vol. 23 No. 4, November 2008
Financial risk mitigation in the community
Effective and efficient insurance markets remain a fundamental feature of advanced economies. The provision of insurance enables economic agents to cost the risk of a given activity and if appropriate, transfer this risk according to their own risk profile. This profiling of risk enables economies to more flexibly and efficiently allocate resources, thereby encouraging stronger investment/growth leading to higher living standards.
In other words, general insurance serves as an economic enabler, with its contribution to economic growth being:
• theimportanttaskofpricingriskand“monetising”risky activity;
• facilitatingtheallocationofresourcesacrossthe wider economy;
• reducingtransactionandfrictioncostsaspartiesseekto transfer risk from the adverse to those more willing to take on risk;
• supportingeconomicdevelopmentbyfacilitatingactivities/investment of a higher risk;
• reducingtheburdenonGovernment/publicsector resources in the event of a major event or catastrophe, thereby transferring the cost of recovery from the public to private sector; and
• supportingtheprincipleofmutualobligationandpersonal responsibility within individuals and communities by encouraging risk adaptation and risk mitigation strategies.
Personal risk offsetting through the adoption of appropriate insurance cover for an individual’s significant assets remains the best way for community members to protect themselves against the residual risk (post mitigation) of extreme weather related events.
A resilient community will have a good level of general insurance cover access and availability, allowing individuals recourse to financial re-imbursement should assets and belongings be damaged or lost due to an insurable event.
Communities who do not have adequate levels of insurance will have a greater reliance on government relief and community appeals – placing an additional burden on the community, the government and ultimately on all tax payers. Personal adoption of financial risk mitigation against future events remains the most cost effective and resilient course of action.
Unfortunately there are obstacles to achieving comprehensive levels of insurance coverage in communities. In May 2007, the Insurance Council released the report “Non Insurance: Who, Why and Trends”. This study, undertaken by the Centre for Law and Economics at the Australian National University profiled non insurance in the Australian community.
Using data from the ABS Household Expenditure Survey, the Non Insurance Report found that of Australia’s 7.7 million residential households, some 1.8 million or 23 per cent did not have a building or contents insurance policy. The report also utilised previously unpublished data from the Roy Morgan Single Source Survey (RMSS) to profile the characteristics and demographics of the non insured population of Australia.
Who are the non-insured?
Non insurance is closely correlated to many demographic variables such as life stage, age, location, education and country of birth. In particular, non insurance tended to be associated with households:
• thatwereyoungoratearlierstagesoflife;
• livingincitiesandinparticularlocalitiesandregionsin cities;
• borninnonWesternsocieties;
• withlowerlevelsofeducation;and
• withoutfulltimework.
The report also found that those households with weaker capacities to protect against loss (i.e., they have limited financial reserves) were less likely to take out insurance to inoculate themselves against future loss.
Reducing the non-insurance rate in Australia to help increase community resilience
The approach taken by the Insurance Council to address non-insurance has been to establish a financial inclusion framework. This framework has as its core components integrating three elements:
• improvingtheunderstandingofinsurancethroughfinancial literacy;
• ensuringthatregulatoryandpolicysettingssupportand encourage insurance (such as taxation relief on insurance); and
• ensuringthatcommerciallysustainablesupplyandproduct is available to meet the needs of consumers.
1 Insurance Council of Australia (2007): “The Non Insured: Who, Why and Trends” page 37, www.ica.com.au

41
The Australian Journal of Emergency Management, Vol. 23 No. 4, November 2008
Improving financial literacy
The Insurance Council, in conjunction with a non government partner, is committed to the development of insurance “curricula” for integration with financial literacy programs currently undertaken by non-government organisations (NGOs). Research from the Insurance Council has indicated that insurance literacy programs are underdeveloped and that non-government organisations welcome strengthening this aspect of their financial literacy efforts.
The Insurance Council has been rolling out the curricula in a financial literacy framework amongst NGOs in the second half of 2008. The underlying goals of the project are:
• tostrengthenthecapacitiesofindividualsinmarginalcommunities to understand the basic concepts and principles operating in insurance;
• toseetherolethatinsuranceplaysinprotectionofloss; and
• tobettervalueandpriceinsurance.
Improving regulatory settings for insurance
The Non-Insurance Report1 commissioned by the Insurance Council concluded that:
• statetaxesonbuildingandcontentsinsuranceinAustralia are significant, varying between 18% and 45% on top of the pre tax premiums;
• analysissuggeststhatthesestatetaxeshaveimpactedthe take-up of insurance and in doing so, caused losses to society. The analysis supports the view that demand for contents insurance is more price sensitive than for building insurance; and
• onlyNSWandVictoriastillimposeafireservicelevy on insurance premiums. The data presented supports the view that this approach to funding the fire services is costly to society. Other jurisdictions have successfully migrated to other more efficient and equitable funding methods. These should be explored by NSW and Victoria. All states should also consider alternatives to stamp duties on insurance.
The Insurance Council commissioned the Australian National University’s Dr Richard Tooth to undertake further and more detailed analysis into the elasticity of demand for house and contents insurance1.
The elasticity study used econometric analysis to more closely examine the factors that affect demand for house and contents insurance. The report sought to determine:
• theeffectofachangeingovernmentpoliciestowardstate taxes on insurance;
• anestimateapriceelasticityofdemand2 for house and contents insurance; and
• otherfactorsthatmayinfluencethedemandforinsurance.
Estimated effect of removing premium based taxes on the take-up of contents insurance (source: Tooth, 2007)
Households (000s) without contents insurance
Forecast reduction today if
From 2003/04 survey
FSL were removed FSL, stamp duties, and IPT were removed
Jurisdiction Estimate Estimate Std. Error Estimate Std. Error
New South Wales 795 98.6 (26.9) 130.6 (37.9)
Victoria 491 83.2 (22.7) 109.5 (31.7)
Queensland 441 24.3 (6.7)
South Australia 137 13.6 (3.8)
Western Australia 210 16.3 (4.6)
Tasmania 47 2.6 (0.7)
A.C.T. and N.T. 49 3.0 (0.9)
Total 2,170 182 (49) 300 (86)
1 Dr Richard Tooth (2007) “An Analysis of the Demand for House and Contents Insurance in Australia” (A report for the Insurance Council of Australia).
2 Given the nature of insurance provision, the elasticity estimated is that of the combined effect of supply and demand.
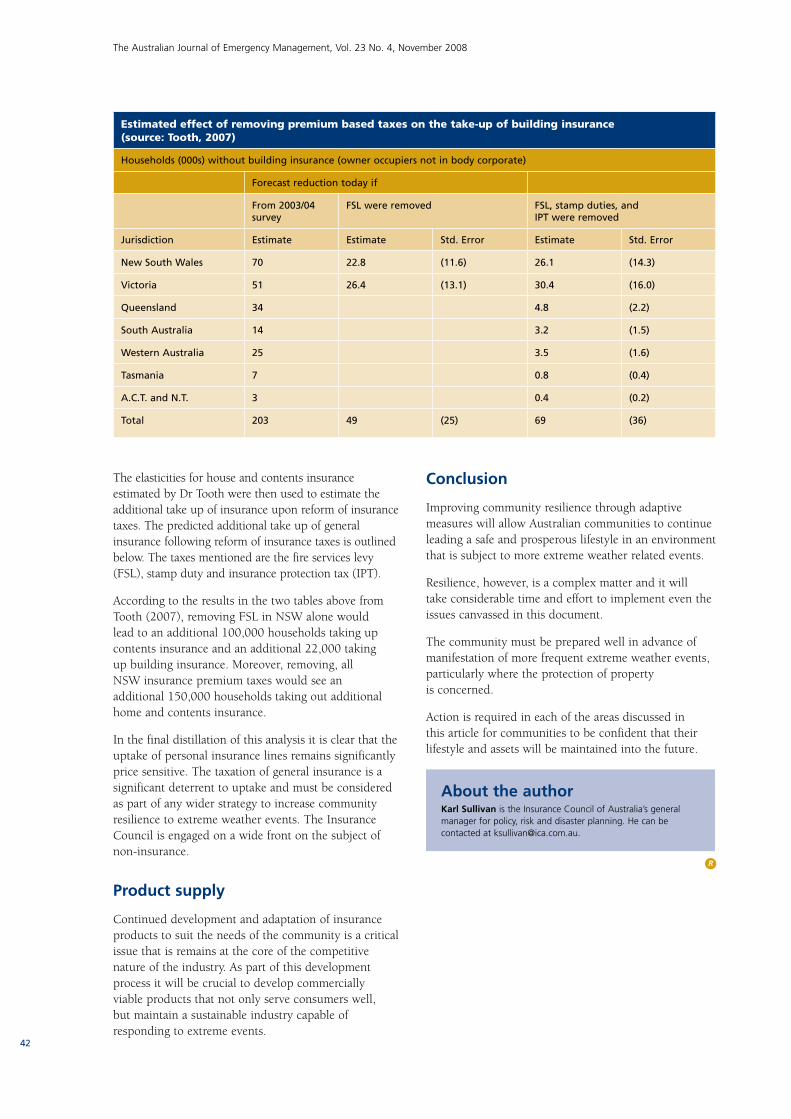
42
The Australian Journal of Emergency Management, Vol. 23 No. 4, November 2008
The elasticities for house and contents insurance estimated by Dr Tooth were then used to estimate the additional take up of insurance upon reform of insurance taxes. The predicted additional take up of general insurance following reform of insurance taxes is outlined below. The taxes mentioned are the fire services levy (FSL), stamp duty and insurance protection tax (IPT).
According to the results in the two tables above from Tooth (2007), removing FSL in NSW alone would lead to an additional 100,000 households taking up contents insurance and an additional 22,000 taking up building insurance. Moreover, removing, all NSW insurance premium taxes would see an additional 150,000 households taking out additional home and contents insurance.
In the final distillation of this analysis it is clear that the uptake of personal insurance lines remains significantly price sensitive. The taxation of general insurance is a significant deterrent to uptake and must be considered as part of any wider strategy to increase community resilience to extreme weather events. The Insurance Council is engaged on a wide front on the subject of non-insurance.
Product supply
Continued development and adaptation of insurance products to suit the needs of the community is a critical issue that is remains at the core of the competitive nature of the industry. As part of this development process it will be crucial to develop commercially viable products that not only serve consumers well, but maintain a sustainable industry capable of responding to extreme events.
Conclusion
Improving community resilience through adaptive measures will allow Australian communities to continue leading a safe and prosperous lifestyle in an environment that is subject to more extreme weather related events.
Resilience, however, is a complex matter and it will take considerable time and effort to implement even the issues canvassed in this document.
The community must be prepared well in advance of manifestation of more frequent extreme weather events, particularly where the protection of property is concerned.
Action is required in each of the areas discussed in this article for communities to be confident that their lifestyle and assets will be maintained into the future.
About the authorKarl Sullivan is the Insurance Council of Australia’s general manager for policy, risk and disaster planning. He can be contacted at [email protected].
R
Estimated effect of removing premium based taxes on the take-up of building insurance (source: Tooth, 2007)
Households (000s) without building insurance (owner occupiers not in body corporate)
Forecast reduction today if
From 2003/04 survey
FSL were removed FSL, stamp duties, and IPT were removed
Jurisdiction Estimate Estimate Std. Error Estimate Std. Error
New South Wales 70 22.8 (11.6) 26.1 (14.3)
Victoria 51 26.4 (13.1) 30.4 (16.0)
Queensland 34 4.8 (2.2)
South Australia 14 3.2 (1.5)
Western Australia 25 3.5 (1.6)
Tasmania 7 0.8 (0.4)
A.C.T. and N.T. 3 0.4 (0.2)
Total 203 49 (25) 69 (36)
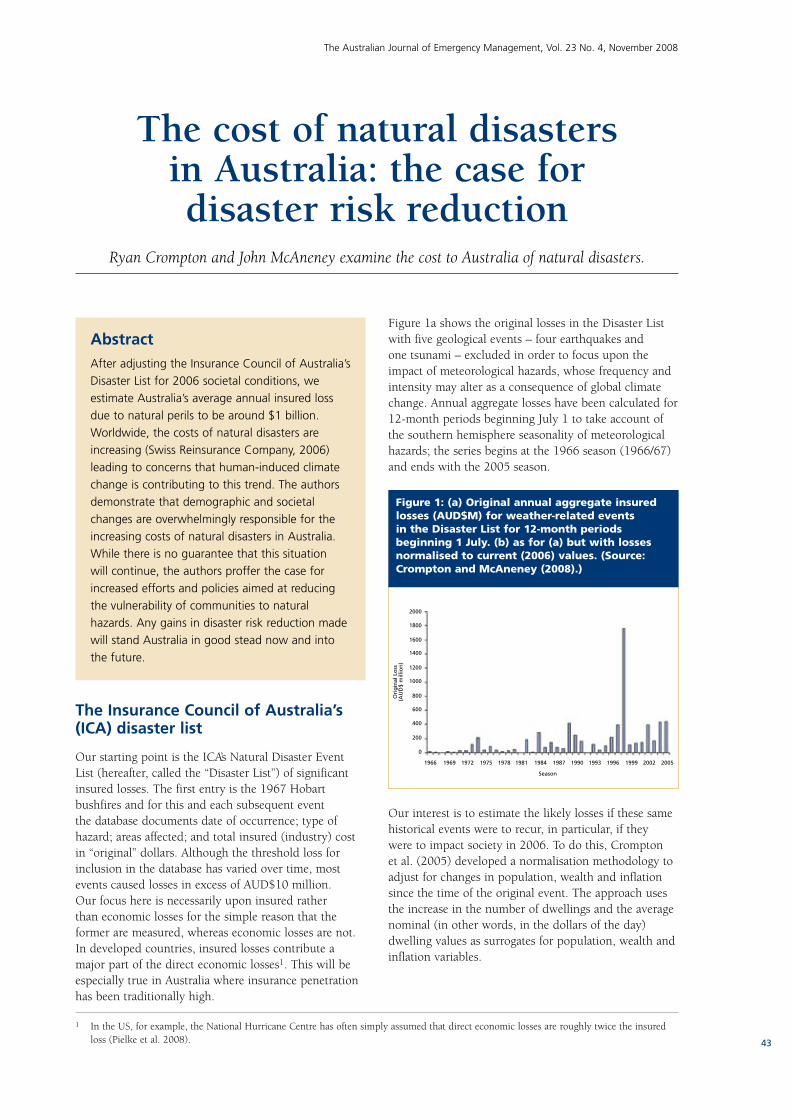
43
The Australian Journal of Emergency Management, Vol. 23 No. 4, November 2008
AbstractAfter adjusting the Insurance Council of Australia’s Disaster List for 2006 societal conditions, we estimate Australia’s average annual insured loss due to natural perils to be around $1 billion. Worldwide, the costs of natural disasters are increasing (Swiss Reinsurance Company, 2006) leading to concerns that human-induced climate change is contributing to this trend. The authors demonstrate that demographic and societal changes are overwhelmingly responsible for the increasing costs of natural disasters in Australia. While there is no guarantee that this situation will continue, the authors proffer the case for increased efforts and policies aimed at reducing the vulnerability of communities to natural hazards. Any gains in disaster risk reduction made will stand Australia in good stead now and into the future.
The Insurance Council of Australia’s (ICA) disaster list
Our starting point is the ICA’s Natural Disaster Event List (hereafter, called the “Disaster List”) of significant insured losses. The first entry is the 1967 Hobart bushfires and for this and each subsequent event the database documents date of occurrence; type of hazard; areas affected; and total insured (industry) cost in “original” dollars. Although the threshold loss for inclusion in the database has varied over time, most events caused losses in excess of AUD$10 million. Our focus here is necessarily upon insured rather than economic losses for the simple reason that the former are measured, whereas economic losses are not. In developed countries, insured losses contribute a major part of the direct economic losses1. This will be especially true in Australia where insurance penetration has been traditionally high.
Figure 1a shows the original losses in the Disaster List with five geological events – four earthquakes and one tsunami – excluded in order to focus upon the impact of meteorological hazards, whose frequency and intensity may alter as a consequence of global climate change. Annual aggregate losses have been calculated for 12-month periods beginning July 1 to take account of the southern hemisphere seasonality of meteorological hazards; the series begins at the 1966 season (1966/67) and ends with the 2005 season.
Our interest is to estimate the likely losses if these same historical events were to recur, in particular, if they were to impact society in 2006. To do this, Crompton et al. (2005) developed a normalisation methodology to adjust for changes in population, wealth and inflation since the time of the original event. The approach uses the increase in the number of dwellings and the average nominal (in other words, in the dollars of the day) dwelling values as surrogates for population, wealth and inflation variables.
The cost of natural disasters in Australia: the case for disaster risk reduction
Ryan Crompton and John McAneney examine the cost to Australia of natural disasters.
1 In the US, for example, the National Hurricane Centre has often simply assumed that direct economic losses are roughly twice the insured loss (Pielke et al. 2008).
Season
2000
1800
1600
1400
1200
1000
800
600
400
200
0
1966 1969 1972 1975 1978 1981 1984 1987 1990 1993 1996 1999 2002 2005
Ori
gin
al L
oss
(AU
D$
mill
ion
)
Figure 1: (a) Original annual aggregate insured losses (AUD$M) for weather-related events in the Disaster List for 12-month periods beginning 1 July. (b) as for (a) but with losses normalised to current (2006) values. (Source: Crompton and McAneney (2008).)

44
The Australian Journal of Emergency Management, Vol. 23 No. 4, November 2008
An additional factor that cannot be ignored under Australian conditions is the influence of building regulations that stipulate more wind-resistant construction in tropical cyclone–prone areas. These regulations were introduced in Darwin after Tropical Cyclone Tracy (1974), in Queensland officially in 1982, but in Townsville from about 1976, and in the rest of Australia in about 1990 (G. R. Walker, pers. com.). In this study we have assumed a ‘common’ introduction date of 1981, a year that also coincides with the Australian census. For complete details of the normalisation methodology, including the adjustment for tropical cyclone losses, the reader is referred to Crompton and McAneney (2008). In the next section, we discuss the normalised losses and then briefly examine the implications of these results for policy and disaster management.
Results
When correctly normalised for the variables mentioned above, the time series of insured losses (Figure 1b) exhibits no obvious trend (increase or decrease) over the last four decades. In other words, the increasing cost of insured losses over time is overwhelmingly explained by demographic and societal changes. Contrary to popular belief, there is no discernable evidence that human-induced climate change is significantly impacting Australian insured losses, yet. This is an important conclusion and consistent with that reached by Pielke and Landsea (1998) and Pielke et al. (2008) in relation to economic losses from hurricanes in the US.
Table 1 ranks the top 10 normalised event losses (all perils now, not just meteorological) with the Newcastle earthquake and Tropical Cyclone Tracy topping the list with losses of around AUD$4 billion. Five distinct perils are represented in the top 10 losses. The reason that a repeat of the Newcastle earthquake is expected to cause a similar insured loss to a repeat of Tropical Cyclone Tracy (Table 1) is a direct result of the fact that no seismic building codes analogous to the wind loading prescriptions exist for the design of residential homes. Seismic risk is simply not treated seriously in Australia, a fact that is no doubt occasioned by the relatively low frequency of damaging earthquakes. The Newcastle experience, however, makes it clear that a modest earthquake in a built-up area can be expensive in terms of property losses and lives lost.
Table 1: Ten highest ranked insured event normalised losses. The current loss estimates the loss if the historical event was to recur in 2006.
Rank Event Year Location State Original Loss (AUD$million)
Current Loss as at 2006 (AUD$million)
1 Earthquake 1989 Newcastle NSW 862 4300
2 Tropical Cyclone Tracy
1974 Darwin NT 200 3650
3 Hailstorm 1999 Sydney NSW 1700 3300
4 Flood* 1974 Brisbane QLD 68 2090
5 Hailstorm 1985 Brisbane QLD 180 1710
6 Ash Wednesday Bushfires
1983 Multiple VIC / SA 176 1630
7 Hailstorm 1990 Sydney NSW 319 1470
8 Tropical Cyclone Madge
1973 Multiple QLD / NT / WA 30 1150
9 Hailstorm 1976 Sydney NSW 40 730
10 Hailstorm 1986 Sydney NSW 104 710
*The 1974 Brisbane floods resulted from the degeneration of Tropical Cyclone Wanda.
Year
1966
4500
4000
3500
1969 1972 1975 1978 1981 1984 1987 1990 1993 1996 1999 2002 2005
No
rmal
ised
Lo
sses
(20
06)
(AU
D$
mill
ion
)
Figure 1: (b)
3000
2500
2000
1500
1000
500
0

45
The Australian Journal of Emergency Management, Vol. 23 No. 4, November 2008
Figure 2 classifies the weather-related normalised losses by hazard-type showing their contribution to relative event frequency and to the total normalised loss. Tropical cyclone and hailstorms together are responsible for 37% of the total number of events but over 60% of the total normalised loss. Conversely, thunderstorms account for nearly the same number of events, but only 11% of the total loss. Riverine flooding is potentially under-represented in this analysis because this peril has not been consistently insured.
Figure 3 shows the contribution of the various states and territories to the average annual loss in current (2006) dollars of AUD$930 million2. This figure includes earthquake losses. New South Wales accounts for nearly half of this amount. Rapid development in other states may act to change this balance in the future.
Policy implications
The evidence reviewed here suggests that societal factors – dwelling numbers and values - are the predominant reasons for the increasing cost of insured losses due to natural disasters in Australia. There are simply more people and insured assets in vulnerable parts of the country. The impact of anthropogenic climate change on Australian insured losses is not detectable at this time. This being the case, it seems logical that in addition to reducing greenhouse gas emissions, significant investments be made to reduce our society’s vulnerability to current and future extreme events, irrespective of how their frequency and intensity might change in the future.
We are aware of few disaster risk reduction policies explicitly developed to help Australian communities adapt to a changing climate, yet disaster risk reduction should be core to climate adaptation policies (Bouwer et al. 2007). Improvements in construction standards, as mentioned earlier, have seen dramatic reductions in wind-induced losses in Tropical Cyclones Winifred (1986) and Aivu (1989) (Walker, 1999) and most recently, Larry (2006) (Henderson et al. 2006, Guy Carpenter 2006). While wind code regulation was not introduced with adaptation to climate change in mind, it underlines the important gains that can be made and why there is a need to expand the role of disaster risk reduction.
Figure 2: Percentage of the number of and total normalised loss from all weather-related events in the normalised Disaster List by hazard-type. Event losses from hailstorms have been separated from other forms of thunderstorms (Crompton and McAneney, 2008)).
Figure 3: Distribution by State and Territory of the national average annual normalised loss. Losses due to geological hazards have been included in this figure. (Data source: Crompton and McAneney (2008).)
2 Values in Figures 2 and 3 vary slightly from those given Crompton et al. (2008) due to ongoing refinements to the normalisation process and data sources.
The success of regulated wind-codes in reducing the vulnerability of residential homes in areas prone to tropical cyclones is an example of what can be achieved when there is a demonstrated need and political will.
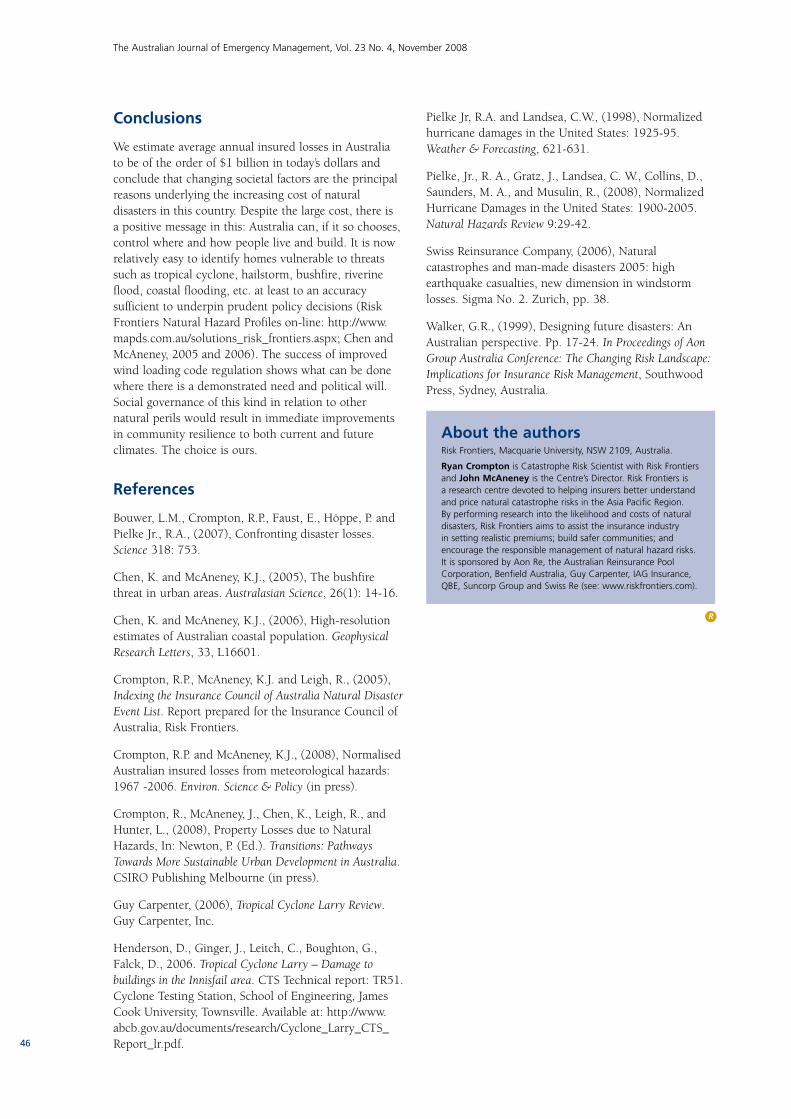
46
The Australian Journal of Emergency Management, Vol. 23 No. 4, November 2008
Conclusions
We estimate average annual insured losses in Australia to be of the order of $1 billion in today’s dollars and conclude that changing societal factors are the principal reasons underlying the increasing cost of natural disasters in this country. Despite the large cost, there is a positive message in this: Australia can, if it so chooses, control where and how people live and build. It is now relatively easy to identify homes vulnerable to threats such as tropical cyclone, hailstorm, bushfire, riverine flood, coastal flooding, etc. at least to an accuracy sufficient to underpin prudent policy decisions (Risk Frontiers Natural Hazard Profiles on-line: http://www.mapds.com.au/solutions_risk_frontiers.aspx; Chen and McAneney, 2005 and 2006). The success of improved wind loading code regulation shows what can be done where there is a demonstrated need and political will. Social governance of this kind in relation to other natural perils would result in immediate improvements in community resilience to both current and future climates. The choice is ours.
References
Bouwer, L.M., Crompton, R.P., Faust, E., Höppe, P. and Pielke Jr., R.A., (2007), Confronting disaster losses. Science 318: 753.
Chen, K. and McAneney, K.J., (2005), The bushfire threat in urban areas. Australasian Science, 26(1): 14-16.
Chen, K. and McAneney, K.J., (2006), High-resolution estimates of Australian coastal population. Geophysical Research Letters, 33, L16601.
Crompton, R.P., McAneney, K.J. and Leigh, R., (2005), Indexing the Insurance Council of Australia Natural Disaster Event List. Report prepared for the Insurance Council of Australia, Risk Frontiers.
Crompton, R.P. and McAneney, K.J., (2008), Normalised Australian insured losses from meteorological hazards: 1967 -2006. Environ. Science & Policy (in press).
Crompton, R., McAneney, J., Chen, K., Leigh, R., and Hunter, L., (2008), Property Losses due to Natural Hazards, In: Newton, P. (Ed.). Transitions: Pathways Towards More Sustainable Urban Development in Australia. CSIRO Publishing Melbourne (in press).
Guy Carpenter, (2006), Tropical Cyclone Larry Review. Guy Carpenter, Inc.
Henderson, D., Ginger, J., Leitch, C., Boughton, G., Falck, D., 2006. Tropical Cyclone Larry – Damage to buildings in the Innisfail area. CTS Technical report: TR51. Cyclone Testing Station, School of Engineering, James Cook University, Townsville. Available at: http://www.abcb.gov.au/documents/research/Cyclone_Larry_CTS_Report_lr.pdf.
Pielke Jr, R.A. and Landsea, C.W., (1998), Normalized hurricane damages in the United States: 1925-95. Weather & Forecasting, 621-631.
Pielke, Jr., R. A., Gratz, J., Landsea, C. W., Collins, D., Saunders, M. A., and Musulin, R., (2008), Normalized Hurricane Damages in the United States: 1900-2005. Natural Hazards Review 9:29-42.
Swiss Reinsurance Company, (2006), Natural catastrophes and man-made disasters 2005: high earthquake casualties, new dimension in windstorm losses. Sigma No. 2. Zurich, pp. 38.
Walker, G.R., (1999), Designing future disasters: An Australian perspective. Pp. 17-24. In Proceedings of Aon Group Australia Conference: The Changing Risk Landscape: Implications for Insurance Risk Management, Southwood Press, Sydney, Australia.
About the authorsRisk Frontiers, Macquarie University, NSW 2109, Australia.
Ryan Crompton is Catastrophe Risk Scientist with Risk Frontiers and John McAneney is the Centre’s Director. Risk Frontiers is a research centre devoted to helping insurers better understand and price natural catastrophe risks in the Asia Pacific Region. By performing research into the likelihood and costs of natural disasters, Risk Frontiers aims to assist the insurance industry in setting realistic premiums; build safer communities; and encourage the responsible management of natural hazard risks. It is sponsored by Aon Re, the Australian Reinsurance Pool Corporation, Benfield Australia, Guy Carpenter, IAG Insurance, QBE, Suncorp Group and Swiss Re (see: www.riskfrontiers.com).
R

47
The Australian Journal of Emergency Management, Vol. 23 No. 4, November 2008
AbstractThe need for an independent and comprehensive risk assessment system for all natural disasters in Australia was recognised by the Council of Australian Governments (COAG). The Australian/New Zealand Standard for Risk Management provides a framework for this consistent and comprehensive approach, but this system needs to be applied to each type of disaster taking into account the unique facets of each. The Bushfire Risk Management Model being developed by the Bushfire CRC is one application of this framework. This model goes further than previous models and developed internationally because it directly relates the impact of various management strategies to changes in fire characteristics across the landscape, using PHOENIX, and then to the nature of the impact on various values and assets in the landscape. This model is intended for use by fire agencies, land managers, town and land planners, and policy makers.
Introduction
State and federal governments need consistent and comparative measures on all types of natural disasters (DOTARS 2004) to allocate resources and formulate policies. Fire managers, land managers, policy makers and land use planners need decision support tools that can assess the level of bushfire risk to a wide range of values and assets, and also demonstrate the benefits or otherwise of alternative management strategies.
The traditional approach to fire management has been based on fire suppression using “Standards of Fire Cover”. This methodology has been used at least since World War II (Home Office 1985) and has been adopted in many countries of the world, including Australia. The underlying theory of fire cover is that across an agency’s management area, like-risk receives like-
cover. As an example, the Victorian public land Model (standard) of Fire Cover (NRE 2000, CFA 2001, OESC 2001) classifies the threat from each identified problem element and mitigation limitation (e.g. travel time) into low, medium or high risk categories. These elements are then assessed in combination to obtain an overall level of threat.
A more spatially explicit approach, using Geographic Information Systems (GIS) technology, is Wildfire Threat Analysis (WTA) (e.g. Hawkes & Beck 1997, Vakalis et al. 2004, Daniel & Tunstead 2004). This process attempts to quantify the spatial distribution of wildfire risk. The typical output of WTA is a map depicting the different levels of “threat”. “Threat” is determined using various mathematical summations of the specified input elements from GIS layers. WTA has been widely applied in Australia, New Zealand and elsewhere with probably the best developed systems being in Western Australia (Sneeuwjagt 1998) and New Zealand (Leathwick & Briggs 2001). However, WTA takes a relatively static view of fire.
In some places, Wildfire Threat Analysis has lead to more detailed wildfire risk assessments. These tend to be either quite complex, using detailed spatial data, or quite simple, relying on simple questionnaire material. The spatial models are used by governments or fire agencies and at a landscape scale. The simpler models tend to be developed and used by a local community or individual home owners and are used at a community and home scale.
Examples of complex models application include:
• theFireProgramAnalysisinUSAusingFSPro(Finney 2007);
• WildlandFireSituationAnalysisusingFSProandthe“Rapid Assessment of Values at Risk” (RAVAR) in the USA (McDaniel 2007);
• wildfiresusceptibilitymappingwithBurn-P3inCanada (Parisien et al. 2005);
Phoenix: development and application of a bushfire risk
management toolTolhurst, Shields and Chong discuss the bushfire risk management model
being developed by the Bushfire CRC.

48
The Australian Journal of Emergency Management, Vol. 23 No. 4, November 2008
• theSpatialFireManagementSystemin Canada (Canadian Forest Service, http://cwfis.cfs.nrcan.gc.ca/);
• theGreaterVancouverWaterCatchmentin Canada (Blackwell 2003); and
• theNSWRuralFireService,BushfireRiskManagement Planning Guidelines for Bushfire Management Committees (RFS 2007).
All of these examples are landscape scale models and rely strongly on developing large underlying datasets and use a matrix overlay to combine the notions of likelihood and consequence. The value of these complex models is undermined when different users subjectively weight impacts, thus manipulating the results of what otherwise would be an objective assessment process (Shields & Tolhurst 2003).
Examples of simpler models include the Wildfire Management Overlay, Victoria (CFA 2008) and UC Berkeley Fire Toolkit (UC Berkeley 2008). These simple models are designed to allow home owners to assess the risk to their own home and provide guidance on what actions might reduce this level of risk.
The Australian Standard for Risk Management (AS/NZS 4360-2004) was developed to be applicable to a wide range of industries and situations. The standard provides a generic framework for establishing the context, identification, evaluation, treatment, monitoring and communication of risk. A new ISO standard (31000) will update parts of AS/NZS 4360. The ISO standard will hold most of the key process aspects of the AS/NZS 4360, but de-emphasises the use of a risk matrix as the assessment method. Since publication of the Risk Standard (AS/NZS 4360-2004), there have been several attempts to apply the generic risk management framework to the fire management business.
Although new risk assessment frameworks attempt to systematically address or calculate risk, they are suboptimal when it comes to assessing management options. A critical element in any performance management framework is the need to make explicit, the logic that connects treatment delivery and outcomes. Many performance measurement frameworks simply assume implicit relationships between these two elements. A risk management model needs to incorporate the way various risk treatments contribute to the achievement of risk outcomes, and to be able to determine what the best or most cost effective treatment options are.
To achieve this, the Bushfire Risk Management Model, being developed as part of the Bushfire Cooperative Research Centre (CRC), draws together three separate by inextricably linked processes. Firstly, the bushfire management “business” needs to be modeled. Secondly, the implication of various management options then
needs to be quantified in terms of the changed fire characteristics in the landscape. And finally, the impact and consequence of these changed fire characteristics needs to be quantified and presented to the fire manager as an aid for decision making.
Method
PHOENIX is one component of a bushfire risk management model, being developed by the Bushfire CRC, for southern Australia. There are three components to the risk management model – a fire management business model, a fire characterization model and a fire impact model (Figure 1). These three elements in combination with the use of performance measures for monitoring and review make up the risk management process as outlined in the Australian/New Zealand Standard of Risk Management (AS/NZS 4360:2004).
PHOENIX is a scenario based model where particular scenarios must be created by the fire manager and the risk management model will describe the likely consequences of each scenario in term of the degree of impact each management scenario will have on specified values and assets.
Business model
The Bushfire Business Management Model establishes the context of the risk management process and within that context; the model can be used to explore the strength and types of interactions between the various elements of bushfire management.
The Business Model was based on 54 elements of bushfire management and these elements were grouped into five strategies – prevention, preparedness, response, recovery and fire regime management (Tolhurst et al. 2006). The 54 elements cover a spectrum of fire management activities including: legislation, planning, public education, firefighter training, equipment
Figure 1. The three main components of the Bushfire Risk Management Model.
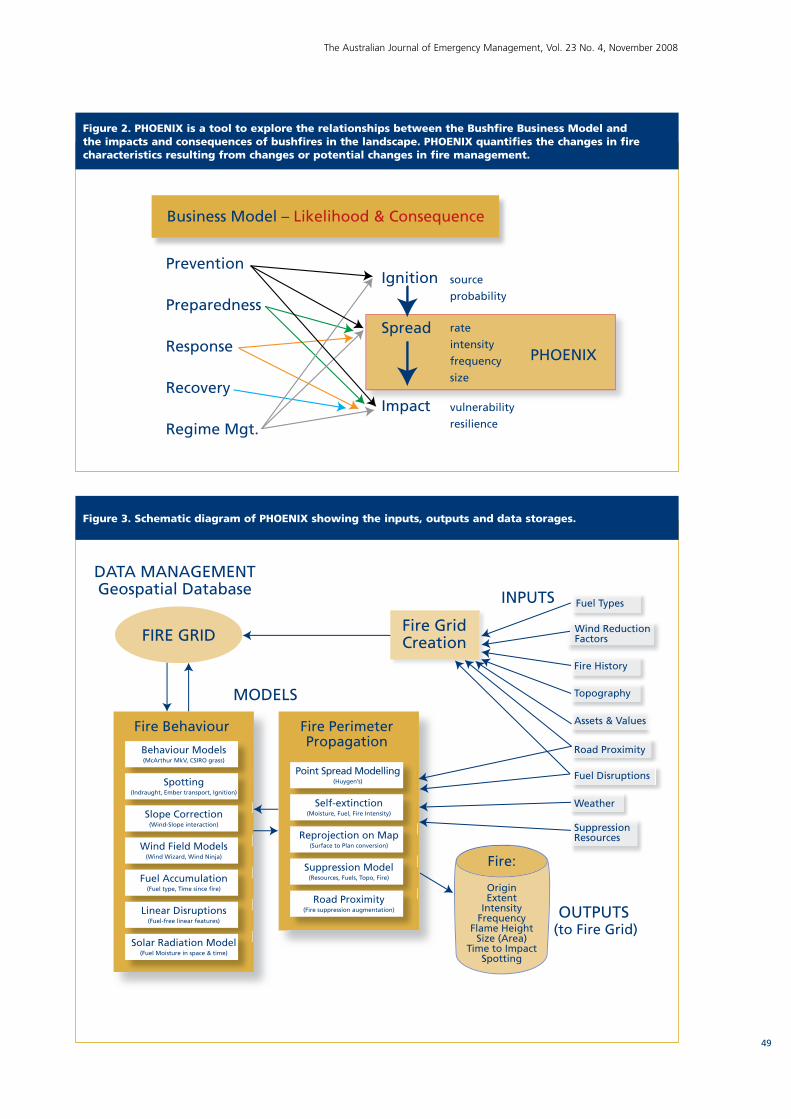
49
The Australian Journal of Emergency Management, Vol. 23 No. 4, November 2008
Figure 2. PHOENIX is a tool to explore the relationships between the Bushfire Business Model and the impacts and consequences of bushfires in the landscape. PHOENIX quantifies the changes in fire characteristics resulting from changes or potential changes in fire management.
Figure 3. Schematic diagram of PHOENIX showing the inputs, outputs and data storages.

50
The Australian Journal of Emergency Management, Vol. 23 No. 4, November 2008
development, prescribed burning, fuel management, fire detection, firefighting, use of aircraft, post-fire recovery, environmental rehabilitation and others. The Business Model quantifies the relationship between the 54 elements of the bushfire management business and gives a relative measure of any combination of these elements in terms of the level of residual bushfire risk. The two types of interaction included in the model are the interchangeability of the elements and the interdependence between the elements. The strengths of these relationships are measured in terms of the resource cost (budget) and their ability to reduce the overall level of bushfire risk. The Business Model provides a means of optimizing the combination of management options to result in the greatest level of risk mitigation. The business model is therefore a non-spatially explicit bushfire risk mitigation model.
The effect of changing different elements of the bushfire management business can be explored spatially through the use of PHOENIX, a spatially and temporally explicit fire characterization model (Figure 2).
Fire Characterisation model
PHOENIX is a dynamic fire behaviour and characterisation model. Unlike many standard fire behaviour models, PHOENIX runs in an environment where it can respond to changes in conditions of the fire in addition to changes to fuel, weather and topographic conditions as a fire grows and moves across the landscape. Two specific examples of this dynamic nature is how spotfires ahead of the main fire front increase the rate of spread of the fire, a second example is how different strata of the fuel are included or excluded in the fire behaviour calculations as the fire changes in intensity around the fire perimeter and over time.
Two basic fire behaviour models underpin PHOENIX. These are the CSIRO southern grassland fire spread model (Cheney & Sullivan 1997, Cheney et al. 1998) and the McArthur Mk5 forest fire behaviour model (McArthur 1962, 1967, 1973, Noble et al. 1980). However, some important modifications were made to both models for inclusion in PHOENIX, to make them respond to the dynamic nature of the interaction between fire and its environment.
The fire behaviour models are used to calculate the point rate of spread, flame height, and fireline intensity. To translate how the fire behaviour at each point around the perimeter of the fire then moves across the landscape, a spread algorithm is used.
The fire spread algorithm used in PHOENIX is Huygen’s (Richards 1995). Huygen’s approach is used by FARSITE (Finney 2004), PROMETHEUS (Tymstra 2004, Tymstra & Bryce 2007) and SIROFire (Coleman & Sullivan 1995). Each implementation of Huygen’s approach varies (e.g. Richards & Bryce 1995, Finney 2004,
Coleman & Sullivan 1995, 1996) and PHOENIX used the approach most like that used in SIROFire (Knight & Coleman 1993).
PHOENIX operates in a landscape divided into uniform-sized square cells. Each cell has many attributes (currently 31) which are either used as inputs or outputs to the simulation (Figure 3). These attributes are stored in a personal geodatabase (MS-Access). These data can be analyzed externally to PHOENIX as with any other data stored in a spreadsheet or database. The size of each cell is specified by the user during the creation of the grid. Grids as small as 5 m have been used for very detailed analysis of a small area, but a grid size of 100m or 200m is usually found to be sufficient for most operational purposes.
PHOENIX incorporates a number of models apart from the basic fire behaviour models. Models involved in modifying the inputs or outputs from the fire behaviour models deal with the effect of spotfire induced indraughts at the fire front, ember transport and distribution, spotfire ignition, wind-slope interactions, linear disruption to fire behaviour, fuel accumulation rates, solar radiation, and fuel moisture models. A second set of models is used to describe the spread of fire across the landscape given the general fire behaviour conditions. This is done by considering the conditions at each point on the fire perimeter so that the movement or extinction of that point can be determined from one time period to the next. These models include Huygen’s perimeter growth, point self-extinction, surface-to-plan reprojection and fire suppression modelling. The time interval between perimeter spread calculations varies from one minute for fast moving fires to 15 minutes for slow moving fires.
Figure 4. Fire intensity as simulated by PHOENIX in each 200m block near Airey’s Inlet, Otways Ranges, Victoria, based on fuel, topography and weather conditions on Ash Wednesday 1983. Darker colours indicate higher intensity fire. The fire was spreading from the top-left to bottom-right in this image.

51
The Australian Journal of Emergency Management, Vol. 23 No. 4, November 2008
Outputs from PHOENIX characterize the fire in each cell across the landscape in terms of the origin of the source fire, the size of the fire at the time of impact, fireline intensity, flame height, time to impact the cell from ignition, and ember density falling in the cell. An example of the spatial variation in fire intensity from a wildfire is given in Figure 4. Other outputs from PHOENIX could be displayed in a similar fashion. Where there is a multi-fire simulation, the number of fires affecting each cell is also recorded to help calculate the likelihood of fire at that location. It is possible to determine the probability of a fire starting at the point of ignition from historic fire probability data and this can be included in the calculation of fire likelihood.
Impact and consequence model
The approach taken in the Bushfire Risk Management Model is to calculate the estimated physical “impact” of the fire on specified values and assets and then to provide this information in a form that can be used to assess the consequence of these impacts. We consider “consequence” to be a relative term which must be considered in the context of the scale of the impact, the importance of the value or asset to its community at the time of the fire, the level of vulnerability of the value or asset at the time of the impact, and the ability of that value or asset to recover or be replaced following the fire. Because “consequence” is a conditional term, the Bushfire Risk Management Model only goes as far as quantify the degree of impact from which the consequence can be assessed.
The spatially and temporally explicit output from PHOENIX can be used to estimate the nature and extent of the impact of the fire on specified values or assets. In the case of the township of Airey’s Inlet, shown in Figure 4, 196 homes were destroyed there in the Ash Wednesday fires. The re-creation of this event in PHOENIX produces modelled estimates of fire intensity, ember density, flame height, fire size and various other fire characteristics that can be used in an impact model.
A simple demonstration of this is given in Figure 5, where the proportion of houses destroyed in five townships is shown as a function of ember density, as calculated in PHOENIX. The data point for Anglesea (far right) is an outlier of this dataset indicating that factors other than just ember density are important. With enough data, impact relationships for a range of values and assets and various fire characteristics can be developed.
Having determined the likely impact of a fire event, it is then possible to develop a set of potential impact curves for each fire event or suite of fire events in a multi-fire scenario. For example, under one management scenario, the probability of house loss might be represented by a curve similar to that in Figure 6, where the probability of one, ten, 100, or 1000 houses being lost can be shown graphically. The probability of different levels of loss will be determined as a function of the probability of a fire starting and the number of times fires may be expected to reach a particular value or asset (Figure 7). With a change in the elements of the Bushfire Business Management Model (Figure 2), the change in the potential impact curve can be seen. Such a set of curves can then be used by the fire manager to decide on the most desired management strategy to reduce the level of risk to an acceptable level or achieve the lowest level of risk for the level of resources available.
Figure 6. A hypothetical demonstration of the type of data that will be produced from impact evaluations in PHOENIX. The difference between the two impact curves is due to different management scenarios.
Figure 5. Relationship between estimated ember density (PHOENIX) and proportion of house loss in the Dean’s Marsh fire on Ash Wednesday 1983. The data points from left-to-right are for Lorne, Airey’s Inlet, Fairhaven, Moggs Creek and Anglesea respectively.
100.0
80.0
60.0
40.0
20.0
0.00.0 1.0 2.0
y = 3e 0.91x
3.0 4.0 5.0
Ember Density (#/m2)
Ho
use
Lo
ss (
%)
0.08
0.07
0.06
0.05
0.04
0.03
0.02
0.01
00 1 2 3 4 5
House Loss (10x)
Scenario 1Scenario 2
Pro
bab
ility
(0-
1)

52
The Australian Journal of Emergency Management, Vol. 23 No. 4, November 2008
The acceptable level of risk can be described in terms of the consequence. Frequently used terms of consequence such as “catastrophic”, “fatal”, and “serious” would imply unacceptable levels of risk, whereas “minor” and “negligible” consequences are more likely to be acceptable levels of risk. However, the potential consequences are always considered with reference to the context of the managed environment and the overall management objectives.
Discussion
The strengths of the Bushfire Risk Management Model are that it provides an objective basis for evaluating various fire management options in a real-to-life situation and quantifies the level of impact on a range of values and assets without making a priori value judgements. The complexity of this process has resulted in many previous wildfire risk models resorting to weightings of critical input factors and weighting of relative impacts to simplify the information presented to the fire manager.
A further strength of the Bushfire Risk Management Model is the need for the fire manager to explicitly specify the conditions of the scenarios being tested, including the range of management options, the design weather conditions, and the identification of critical assets and values in the area of interest.
The results from the Bushfire Risk Management Model encapsulate the complex interaction of ignition, spread, suppression, terrain, weather, fire history, fire protection measures and a range of other factors affecting the final impact of fire across the landscape. Unlike Wildfire Threat Analysis, it is not based on static inputs or subjective weightings.
Some of the weaknesses of the Bushfire Risk Management Model include the reliance on good quality input data such as fuels and weather at a spatial and temporal accuracy as good as or better than the
required output accuracy. The model also requires the users to have a range of skills including knowledge of Geographic Information Systems (GIS), fire behaviour models, database management skills and a good appreciation of the fire management process.
Some of the powers of this modelling process include the ability to produce repeatable results, provide good graphic material for presentation to various stakeholders and managers, and deal with very complex situations and interactions in a relatively simple fashion.
Conclusions
The Australian/New Zealand standard on risk management (AS/NZS 4360:2004) provides a consistent terminology and framework for risk management. This standard is well suited to bushfire risk management.
The fire characterization model, PHOENIX provides a critical tool to describe the interaction of weather, topography, the fire itself, suppression actions and fire protection measures across the landscape. In the context of the Bushfire Risk Management Model, PHOENIX provides a platform for exploring the impact of various management options in terms of their impact on specific values and assets.
Spatially and temporally explicit modelling is critical in a wildfire environment because many of the impact factors result from fire attributes such as fire size, number of fires in the landscape, suppression resource effectiveness, time from ignition to impact, fire intensity, spotting activity, ember production and local weather factors. Without these interactions, it is not possible to make a realistic assessment of the true wildfire risk, nor the effectiveness of mitigation measures. Most existing wildfire risk models only show the area of assets or values potentially impacted by fire rather than quantifying the impact as affected by the nature of the fire and the vulnerability of the assets or values.
Figure 7. Fire ignition probability for Otways region (left) based on historic lightning fire records and fire frequency map (right) resulting from a grid of ignition points across the region under a single set of weather and ignition times.
53
The Australian Journal of Emergency Management, Vol. 23 No. 4, November 2008
We believe that the “consequence” of particular wildfires will be dependent on factors such as scale (local, regional, national, international), periods of economic stress (recessions, droughts), periods of political uncertainty, times of multiple disasters (e.g. storms and wildfire), and other recent events affecting vulnerability and resilience of a community. Therefore, this risk management model only goes as far as producing data on wildfire impacts in terms of risk curves rather than specifying a level of consequence. “Consequence” is very scale and time dependent and thus cannot be objectively incorporated into a single model.
The effect of different management scenarios on the level of wildfire risk needs to be displayed graphically so that a wide audience can understand the nature of the impacts. PHOENIX provides a powerful visualization tool as well as being a powerful analytical tool. This is a major benefit of GIS based modelling.
An over-emphasis on GIS tools to model risk has been a limitation of some past risk assessment approaches. The GIS environment does not lend itself to understanding the Fire Management Business, nor does it provide a very efficient platform for modelling complex fire interactions or for complex statistical data analysis. GIS tools are best used in combination with other information and data management tools.
PHOENIX and the Bushfire Risk Management Model provide a decision support tool for land-use planners, land managers, fire agencies and governments. The dynamic nature of this model make it more realistic than many of the past risk assessment techniques. In the future, the Bushfire Risk Management Model could be used to not only explore the value of various management options, but also provide a basis for determining research and data collection priorities.
References
AS/NZS 4360:2004, (2004), Australian/New Zealand Standard – Risk Management, Standards Australia – Standards New Zealand, 32pp.
Blackwell B.A., (2003), Greater Vancouver Watershed Wildfire Risk Assessment, 3rd International Wildland Fire Conference, Sydney Australia.
CFA, (2008), ‘Wildfire Management Overlay’, Country Fire Authority, Victoria. Available at: www.cfa.vic.gov.au/residents/buildings, [5 June 2008].
CFA, (2001), ‘A model of fire cover for Victoria: CFA’s submission to the OESC in response to the Discussion Paper’, Victoria, Country Fire Authority.
Cheney, N.P. and Sullivan, A.L., (1997), Grassfires: Fuel Weather and Fire Behaviour, CSIRO Publishing, Melbourne.
Cheney, N.P., Gould, J.S. and Catchpole, W.R., (1998), ‘Prediction of fire spread in grasslands’, International Journal of Wildland Fire, Vol. 8, No. 1, pp. 1-13.
Coleman, J.R. and Sullivan, A.L., (1995), ‘SiroFire: the CSIRO bushfire spread simulator’, in: Proc. Inst. Foresters Aust. 16th Biennial Conf., pp. 309-319, Canberra. Available at: http://ffp.cSiro.au/nfm/fbm/software/Sirofire/home.html, [15 May 2008]
Coleman, J.R. and Sullivan, A.L., (1996), ‘A real-time computer application for the prediction of fire spread across the Australian landscape’, Simulation, Vol. 67, No. 4, pp. 230-240.
Daniel,G and Tunstead, G., (2004), ‘The application of GIS based wildfire threat analysis in the Western Australian goldfields’, 11th annual AFAC conference and inaugural Bushfire CRC conference, 7-9 October 2004, Perth, Western Australia.
DOTARS, (2004), Natural Disasters in Australia – Reforming mitigation, relief and recovery arrangement, a report to the Council of Australian Governments (COAG), Department of Transport and Regional Services, Commonwealth of Australia, 201pp.
Finney, M.A., (2004), ‘FARSITE: Fire Area Simulator – model development and evaluation’, Res. Pap. RMRS-RP-4 (revised), Ogden, UT: USDA Forest Service, Rock Mountain Research Station, 47pp.
Finney, M.A., (2007), ‘A prototype simulation system for large fire planning in FPA’, attachment to the White Paper by National Interagency Fire Center, USA. Available at: www.fpa.nifc.gov/Library/Docs/Science/FPA_SimulationPrototype_0705.pdf 39pp., [25 June 2008]
Hawkes, B. and Beck, J., (1997), A wildfire threat rating system – McGregor Model Forest, Technology Transfer Notes No. 1, Forestry Research Applications, Pacific Forestry Centre, Canadian Forest Service, British Columbia, 6pp.
Home Office (1985), Report on the Joint Committee on Standards of Fire Cover, United Kingdom.
Knight, I. and Coleman, J.R., (1993), ‘A fire perimeter expansion algorithm based on Huygens’ wavelet propagation’, International Journal of Wildland Fire, Vol. 3, No. 2, pp. 73-84.
54
The Australian Journal of Emergency Management, Vol. 23 No. 4, November 2008
Leathwick, J.R. and Briggs, C.M., (2001), ‘Spatial prediction of wildfire hazard across New Zealand’, New Zealand Fire Service Commission, Research Report No.22, 13pp.
McArthur, A.G., (1962), Control burning in eucalypt forests, Forest Research Institute, Forestry and Timber Bureau, Leaflet 80, Commonwealth of Australia, Canberra.
McArthur, A.G., (1967), Fire behaviour in eucalypt forest, Forest Research Institute, Forestry and Timber Bureau, Leaflet 107, Commonwealth of Australia, Canberra.
McArthur, A.G., (1973), Forest Fire Danger Meter, Mk V, Forest Research Institute, Forestry and Timber Bureau, Commonwealth of Australia, Canberra.
McDaniel, J., (2007), ‘Calculated risk’, Wildfire Magazine, March/April 2007.
Noble, I.R., Bary, G.A.V., and Gill, A.M., (1980), ‘McArthur’s fire-danger meters expressed as equations’, Australian Journal of Ecology, Vol. 5, pp. 201-203.
NRE, (2000), ‘Standards of Cover for Fire Suppression: North East Region’, Melbourne, Victoria, Department of Natural Resources and Environment, Victoria.
OESC, (2001), ‘Discussion Paper: A Model of Fire Cover for Victoria’, Department of Justice, Office of the State Emergency Commissioner, Victoria.
Preisler, H.K., Brillinger, D.R., Burgan, R.E. and Benoit, J.W., (2004), ‘Probalility based models for estimation of wildfire risk’, International Journal of Wildland Fire, Vol. 13, pp. 133-142.
RFS, (2007), Bushfire Risk Management Planning Guidelines for Bushfire Management Committees, Rural Fire Service, NSW. Available at: www.rfs.nsw.gov.au, [15 May 2008].
Richards, G.D., (1995), ‘A general mathematical framework for modeling two-dimensional wildland fire spread’, International Journal of Wildland Fire, Vol. 5, No. 2, pp. 63-72.
Richards, G.D. and Bryce, R.W., (1995), ‘A computer algorithm for simulating the spread of wildland fire perimeters for heterogeneous fuel and meteorological conditions’, International Journal of Wildland Fire, Vol. 5, No. 2, pp. 73-80.
Shields B.J. and Tolhurst K.G., (2003), ‘A Theoretical Framework for Wildfire Risk Assessment’, 3rd International Wildland Fire Conference, Sydney Australia.
Sneeuwjagt, R., (1998), ‘Application of Wildfire Threat Analysis in South-Western Forest of Western Australia’, III International Conference on Forest Fire Research and 14th Conference on Fire and Forest Meteorology, D. X. Viegas (ed.), Portugal, ADAI, Vol. II, pp. 2155 - 2176.
Tolhurst, K.G., Chong, D.M., and Strandgard, M.N., (2006), ‘Wildfire risk management model for strategic management’, Proceedings of V International Conference on Forest Fire Research, ed. D.X. Viegas, Figueira da Foz, Coimbra, Portugal, 27-30 November 2006. 15pp.
Tymstra, C., (2004), Prometheus fire growth model. Available at: http://www.firegrowthmodel.com, [10 March 2007].
Tymstra, C. and Bryce, R.W., (2007), Prometheus – User Manual Version 4.4, 202pp., Alberta Sustainable Resource Development, Forest Protection Division.
UC Berkeley, (2008), Fire Toolkit. Available at: www.firecentre.berkeley.edu/homeassessment/, [15 May 2008].
Vakalis, D., Sarimveis, H., Kiranoudis, C., Alexandridis, A. and Bafas, G., (2004), ‘A GIS based operational system for wildland fire crisis management, I. Mathematical modelling and simulation’, Applied Mathematical Modelling, Vol. 28, pp. 389-410.
About the authorsDr Kevin Tolhurst is a Senior Lecturer in Fire Ecology and Management at the University of Melbourne. He has over 30 years of fire experience ranging from fire fighting, fire behaviour prediction, fire ecology research and fire education. As part of the Bushfire CRC, Kevin has undertaken to develop a decision support system for fire managers based on risk management.
Brett Shields is a Principal Consultant (Forests and Environment) with GHD based in Sydney. He has had extensive experience in forest fire management in Australia and S.E.Asia and continues to have a passion for taking a social and risk based perspective on wildfire management.
Derek Chong is a software developer based in the University of Melbourne and funded by the Bushfire CRC. Derek’s software development background was in the area of tree growth and timber production area before shifting to bushfire modelling in the CRC.
Dr Kevin Tolhurst can be contacted at: [email protected]
R
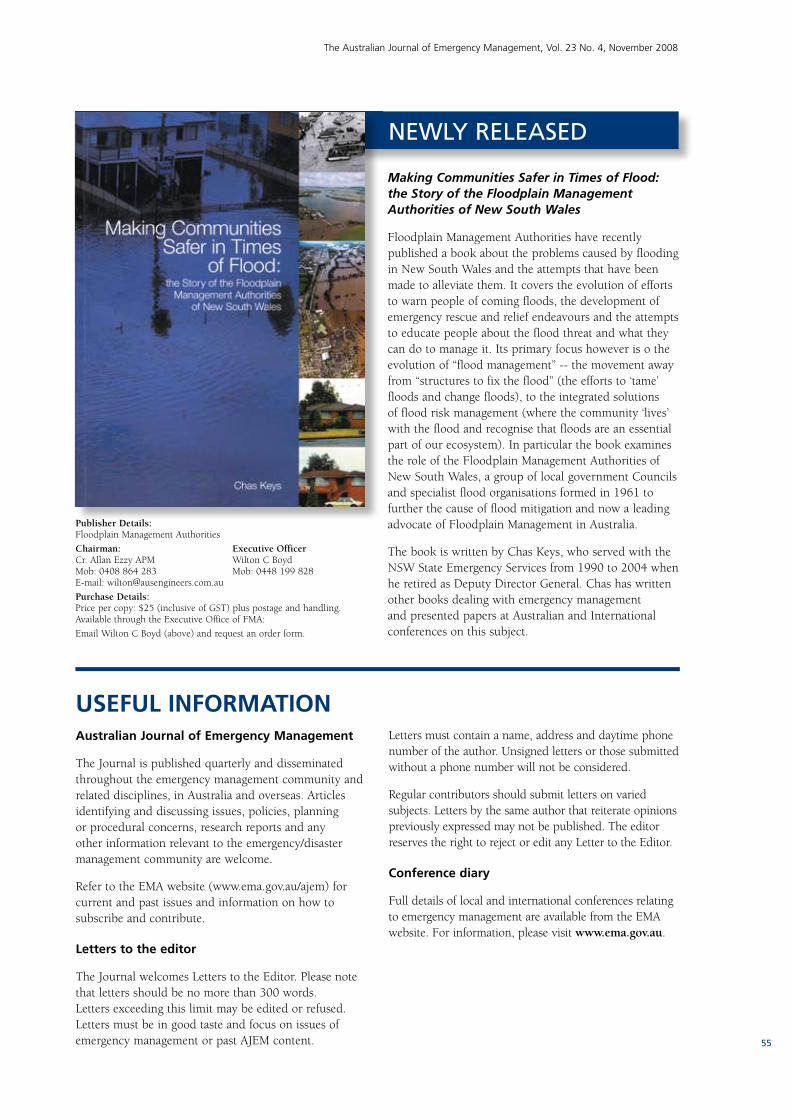
55
The Australian Journal of Emergency Management, Vol. 23 No. 4, November 2008
Australian Journal of Emergency Management
The Journal is published quarterly and disseminated throughout the emergency management community and related disciplines, in Australia and overseas. Articles identifying and discussing issues, policies, planning or procedural concerns, research reports and any other information relevant to the emergency/disaster management community are welcome.
Refer to the EMA website (www.ema.gov.au/ajem) for current and past issues and information on how to subscribe and contribute.
Letters to the editor
The Journal welcomes Letters to the Editor. Please note that letters should be no more than 300 words. Letters exceeding this limit may be edited or refused. Letters must be in good taste and focus on issues of emergency management or past AJEM content.
USEFUL INFORMATIONLetters must contain a name, address and daytime phone number of the author. Unsigned letters or those submitted without a phone number will not be considered.
Regular contributors should submit letters on varied subjects. Letters by the same author that reiterate opinions previously expressed may not be published. The editor reserves the right to reject or edit any Letter to the Editor.
Conference diary
Full details of local and international conferences relating to emergency management are available from the EMA website. For information, please visit www.ema.gov.au.
Making Communities Safer in Times of Flood: the Story of the Floodplain Management Authorities of New South Wales
Floodplain Management Authorities have recently published a book about the problems caused by flooding in New South Wales and the attempts that have been made to alleviate them. It covers the evolution of efforts to warn people of coming floods, the development of emergency rescue and relief endeavours and the attempts to educate people about the flood threat and what they can do to manage it. Its primary focus however is o the evolution of “flood management” -- the movement away from “structures to fix the flood” (the efforts to ‘tame’ floods and change floods), to the integrated solutions of flood risk management (where the community ‘lives’ with the flood and recognise that floods are an essential part of our ecosystem). In particular the book examines the role of the Floodplain Management Authorities of New South Wales, a group of local government Councils and specialist flood organisations formed in 1961 to further the cause of flood mitigation and now a leading advocate of Floodplain Management in Australia.
The book is written by Chas Keys, who served with the NSW State Emergency Services from 1990 to 2004 when he retired as Deputy Director General. Chas has written other books dealing with emergency management and presented papers at Australian and International conferences on this subject.
NEWLY RELEASED
Publisher Details: Floodplain Management Authorities
Chairman: Executive Officer Cr. Allan Ezzy APM Wilton C Boyd Mob: 0408 864 283 Mob: 0448 199 828 E-mail: [email protected]
Purchase Details: Price per copy: $25 (inclusive of GST) plus postage and handling.Available through the Executive Office of FMA:
Email Wilton C Boyd (above) and request an order form.
interesting websites
Natural Hazards Online is a new resource available to emergency managers, researchers and the general public. It is a website that presents information about natural hazards including bushfire, cyclone, earthquake, flood, landslide, severe weather, tsunami, and volcano.
Natural Hazards Online is a joint initiative of Geoscience Australia and Emergency Management Australia, and was established as a contribution to the Disaster Mitigation Australia package. The website was developed in response to the Council of Australian Governments (COAG) Report on reforming mitigation, relief and recovery arrangements for natural disasters in Australia which identified the need ‘to ensure a sound knowledge base on natural disasters and disaster mitigation’.
This is the first time in Australia that a single website has been created to consolidate the broad range of information, data, maps, models and decision-support tools available about natural hazards. The site provides users with a one-stop-shop for natural hazards information ensuring that available content is easy to find and access.
The website provides details about each hazard, the processes behind their occurrence, where they occur in Australia and how they impact on communities. A selection of previous natural hazard events is described and a series of links are available for those who would like to find out more about a particular event.
Photographs and images are available for each type of hazard as well as reports published by Geoscience Australia that can be downloaded from the site. Guidelines and reports published by other agencies as well as a series of maps and databases can also be accessed.
A number of key emergency response tools are easily accessible through Natural Hazards Online, including the Joint Australian Tsunami Warning Centre, the Sentinel bushfire monitoring system, the Bureau of Meteorology’s tropical cyclone warning service and national weather warnings summary.
Users can also access the Global Disaster Alert and Coordination System, the Australian Disaster Information Network and the new report Natural Hazards in Australia: Identifying Risk Analysis Requirements. The website includes data-bases detailing riverine flood studies, recent and historic earthquakes, and landslides, as well as a link to an online risk prevention game.
The website also presents information about risk modelling, emergency management, and natural hazard policy as well as information about expert committees working to reduce the impact of natural hazards in Australia.
Natural Hazards Online is currently receiving approximately 17 000 hits per month. Eighty percent of these hits are from new visitors to the site, and the website presently holds the number one ranking on ‘Google’ for a natural hazards search on Australian pages.
New information and tools are being added to the website as they become available, to provide emergency managers and other decision makers involved in disaster risk reduction with important resources which will help them to assess the hazard, vulnerability and risk posed by natural disasters and make informed decisions about their management.
For more information phone Monica Osuchowski +61 2 6249 9717 (email [email protected])
Natural Hazards Online
www.ga.gov.au/hazards
historical snapshot
© N
ewsp
ix
Cover shows a number of images depicting a range of hazard, exposure and vulnerability data sets and techniques used in ‘all hazards’ risk assessment.
Tropical Cyclone Althea (1971)On 24 December, 1971, TC Althea crossed the coast of Queensland just north of Townsville with a peak wind gust of 106 knots (195 km/hr) recorded at the Townsville Meteorological Office. Three lives were lost in Townsville and insured costs alone in the region reached $25 million (1971 value).
Severe winds damaged or destroyed many homes (including 200 Housing Commission homes). On Magnetic Island 90% of the houses were damaged or destroyed. Tornadoes damaged trees and houses at Bowen. Major flooding occurred in Burdekin, but coastal floods were short lived. A 2.9 m storm surge was recorded in Townsville Harbour with a maximum storm surge of 3.66 m recorded at Toolakea, just to the north of Townsville. The storm surge and wind-generated waves, although occurring at low tide, caused extensive damage along The Strand in Townsville and at Cape Pallarenda.
After the experience of the severe destruction wrought by TC Althea and TC Tracy in Darwin (1974) special efforts were made to strengthen building standards in Queensland and elsewhere in Australia, especially for domestic structures. Australian Standard AS1170.2 Minimum design loads on structures: Part 2 – Wind loads was first published in 1973 and has been revised subsequently on five occasions. The Standard was first adopted for residential buildings in the Queensland Building Act in 1981.
TC Larry in 2006 was one of the biggest tests of wind loading standards for buildings since Althea. Larry caused significant damage to residential buildings in Innisfail, Queensland, and nearby communities. Overwhelmingly, however, the most badly damaged residences were those constructed prior to 1982, and residences built since then performed much better. Building standards will continue to be one of the most effective disaster mitigation measures against severe winds in Australia.
‘safer sustainable communities’
National Emergency Volunteer Support Fund
There is general acceptance that climate change is likely to result in an increased frequency and severity of emergencies including heatwave, severe storms, floods, tropical cyclones and, indirectly, serious bushfire. These events have significant economic consequences but also impact adversely on the lives of individuals, families and communities, particularly the vulnerable members of our communities.
Of vital importance in protecting communities from the effects of emergencies is our national pool of volunteers who represent a critical element of Australia’s national emergency management capability. Those volunteers play a significant role in assisting communities in responding to and recovering from the impact of emergencies. Some 500,000 people in Australia volunteer their services in some emergency management capacity and 350,000 of those are directly involved in emergency first response, principally through the various rural fire services and the State Emergency Services.
To ensure ongoing protection of communities it is critical that all volunteer agencies maintain their current levels of staffing and training.
The Australian Government is offering funding in 2009/10 through the National Emergency Volunteer Support Fund for projects which specifically address the recruitment, retention and training of
volunteers. The Fund is managed by Emergency Management Australia (EMA), a Division within the Attorney-General’s Department.
The Attorney-General, Robert McClelland, will soon be seeking grant applications from eligible organisations.
How to Apply
Applications will be invited from late November 2008. Guidelines, application forms and details on how to apply will be available on the EMA website or by contacting the Community Engagement team at EMA after that date.
Email: [email protected]
Phone: 02 6256 4608
Fax: 02 6256 4653
Website: www.ema.gov.au/communityengagement
The closing date for applications is Friday 6 March 2009.
Our national Risk Assessment Framework
How does computer modelling help us to assess tsunami risk?
How do long-term databases help us to assess
weather-related risks?
Assessing risk
▲▲▲▲▲▲▲
▲▲▲▲▲▲▲▲
▲▲▲▲▲▲▲▲
▲▲▲▲▲▲▲▲
▲
EmERgEncy
mAnAgEmEnt
AustRAliA
And gEOsciEncE
AustRAliA
SPECIAL
EDITION
EMA invites you to help shape the future of
Australian emergency
management.
Surviving Future Risks
AdvertPrintNew.indd 1 21/4/08 1:39:16 PM
the Australian Journal of
Emergency Management
‘safer sustainable communities’
GR
EY
1579
4
Vo
l 23 n
o 4
NO
VEM
BER
2008
Vol 23 no 4 NOVEMBER 2008
Surviving Future Risks
EARLY BIRD
REGISTRATIONS
CLOSE 17 DECEMBER 2008