2008 accountability annual meeting bureau of research and evaluation florida department of education...
TRANSCRIPT

2008 Accountability Annual Meeting
Bureau of Research and EvaluationFlorida Department of Education
September 4, 2008
2
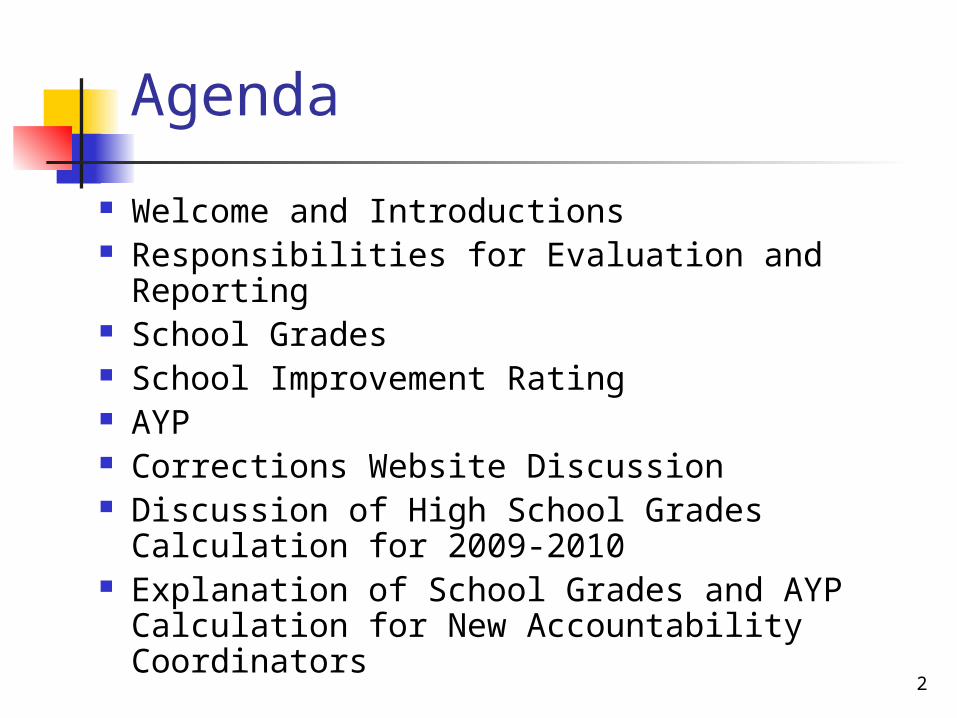
Agenda
Welcome and Introductions Responsibilities for Evaluation and Reporting School Grades School Improvement Rating AYP Corrections Website Discussion Discussion of High School Grades
Calculation for 2009-2010 Explanation of School Grades and AYP
Calculation for New Accountability Coordinators

3
Welcome and Introductions
4
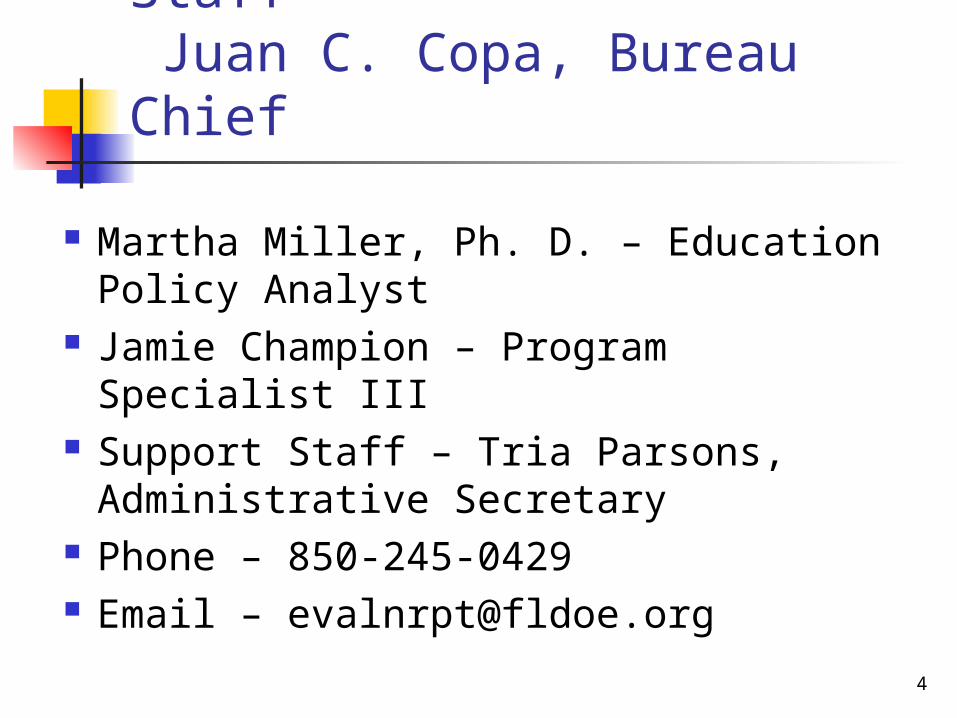
Research and Evaluation Staff Juan C. Copa, Bureau Chief
Martha Miller, Ph. D. – Education Policy Analyst
Jamie Champion – Program Specialist III Support Staff – Tria Parsons,
Administrative Secretary Phone – 850-245-0429 Email – [email protected]

5
Evaluation and Reporting Staff
Accountability Programs – Ed Croft, Director State Accountability Programs – Tracy Selman,
Program Director Analysts – Sue Klos; Gambhir Shrestha, Ph. D.
Federal Accountability Programs – Reneé Bruno, Program Director
Analysts – Kiersten Farmer, Nadya Collins Support Staff – Toye Coxe, Staff Assistant Phone – 850-245-0411 E-mail – [email protected]

6
Responsibilities

7
Evaluation and Reporting
School Grades Under A+ and A++ Plans Alternative Schools Accountability
Adequate Yearly Progress (AYP) Schools in Need of Improvement Voluntary Pre-Kindergarten
Accountability (VPK) Merit Award Program (MAP) Supplemental Education Service
Accountability

8
Research, Analysis, and Evaluation. Evaluation and Reporting is tasked with a
number of analyses, focusing mainly on examining the impact of programs and policies on student achievement.
SAT/ ACT/ PSAT/ PLAN and Teacher Projections
Teacher Projections Projected High School Graduates
Research, Analysis and Evaluation

9
2005-2006 School Grades and AYP Results
School Grades

10
This year, schools that showed improvement in the lowest 25 percent of students in reading and math but did not meet the annual learning gains goal of 50 percent would not have their grade reduced.
“A,” “B” and “C” schools keep their grade if: 40% or more of lowest quartile make gains in reading and
math and this percentage is at least 1 percentage point more than the previous year.
Less than 40% of lowest quartile make gains in reading and math and this percentage is at least 5 percentage points more than the previous year.
Sixty-six (66) schools did not meet the 50 percent goal, yet showed improvement in the lowest 25 percent of their students thus avoiding a drop in their grade.
2007-08 School Grade Changes

11
School Grades - 1999-2008
12
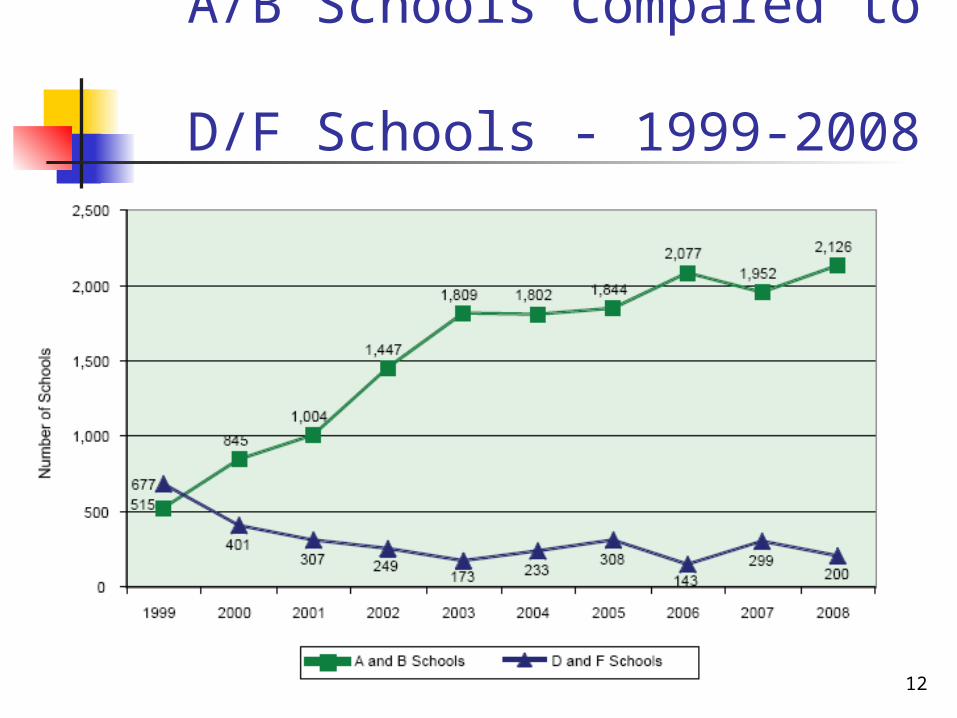
A/B Schools Compared to D/F Schools - 1999-2008

13
School Grades by Type 2008
14
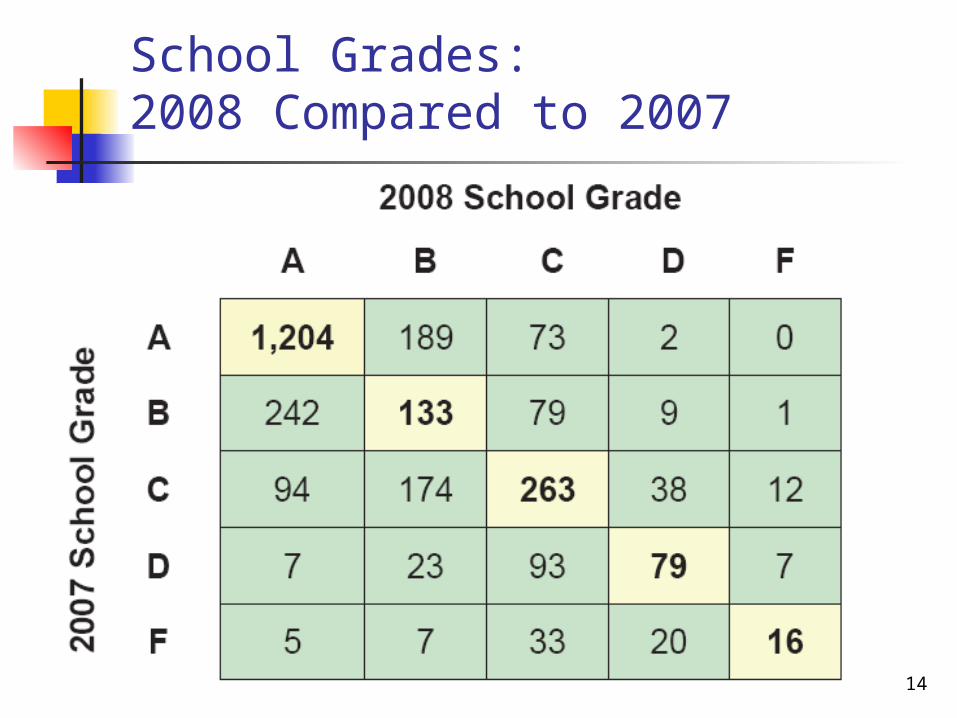
School Grades: 2008 Compared to 2007
15
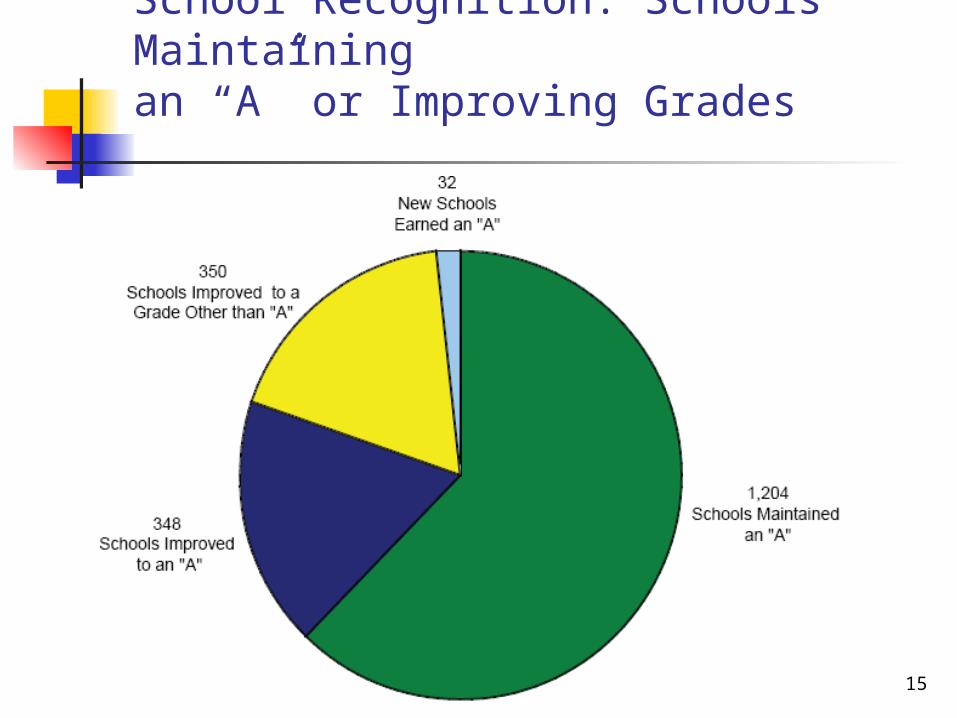
School Recognition: Schools Maintaining an “A” or Improving Grades

16
2008 Grades for 2007 “F” Schools

17
38 Schools That Earned the Bonus Points Improved a Letter Grade
18
2005-2006 School Grades and AYP Results
School Improvement
Rating

19
2007 – 2008 School Improvement Ratings for Alternative Schools – School
Alternative Schools were identified based on their Primary Service Type as reported on the Master School Identification (MSID) file and district input and adjustment.
DJJ schools are not included as alternative schools. Districts may request certain types of schools be excluded.
School serves 100% dropout retrievals. School serves 100% alternative-to-expulsion students School is a jail or adjudicated youth facility and does not get
referrals from home schools. These schools are subject to school grading.
Each Alternative School is given the option of receiving a school improvement rating or a school grade.
Must have at least 10 students with FCAT scores in reading and math for the current year and the previous two years.
Schools deciding not to choose, default to improvement rating.

20
Identify students who are to be included in the calculation Student enrolled in either Survey 2 or 3
or both. Student tested in FCAT in reading and/or
math at alternative school with scores in current and two previous years.
Student is 10th grader and has not passed the FCAT in reading and/or math.
2007 – 2008 School Improvement Ratings for Alternative Schools – Student

21
2007 – 2008 School Improvement Ratings for Alternative Schools – Students
Students who are not to be included in the calculation. Students reported by districts to the
Department of Education’s automated student database via the Federal/State Indicator Status reporting format.
“R”—students in dropout retrieval programs
“E”—students in “alternative to expulsion programs.”

22
Zoned District and School
The student should have been referred to, or placed in, the alternative school prior to enrolling in the alternative school.
Data Elements on Student Demographic reported in Survey 3.
School Number, Zoned School. District Number, Zoned School.
District and school personnel have the opportunity to update student status on the Student Data Updates web site in the spring.
Since 2007-08 was year 1 of the rating system, only referrals that were made in 2006-07 or 2007-08 were used for identifying zoned schools.
Zoned school and alternative schools must have the same grade levels as the referred student.

23
Improvement Rating Calculation
Calculate current-year learning gains (CYLG) the same as for school grades.
Calculate prior-year learning gains (PYLG) the same as for current year except using data from prior year and the year previous to that.
Assign improvement rating status to each subject area based on the following criteria:
“Improving” – CYLG at least 5 percentage points higher than PYLG.
“Maintaining” – CYLG varied by less than 5 percentage points (up or down) from PYLG.
“Declining” – CYLG were at least 5 percentage points lower than PYLG.
24
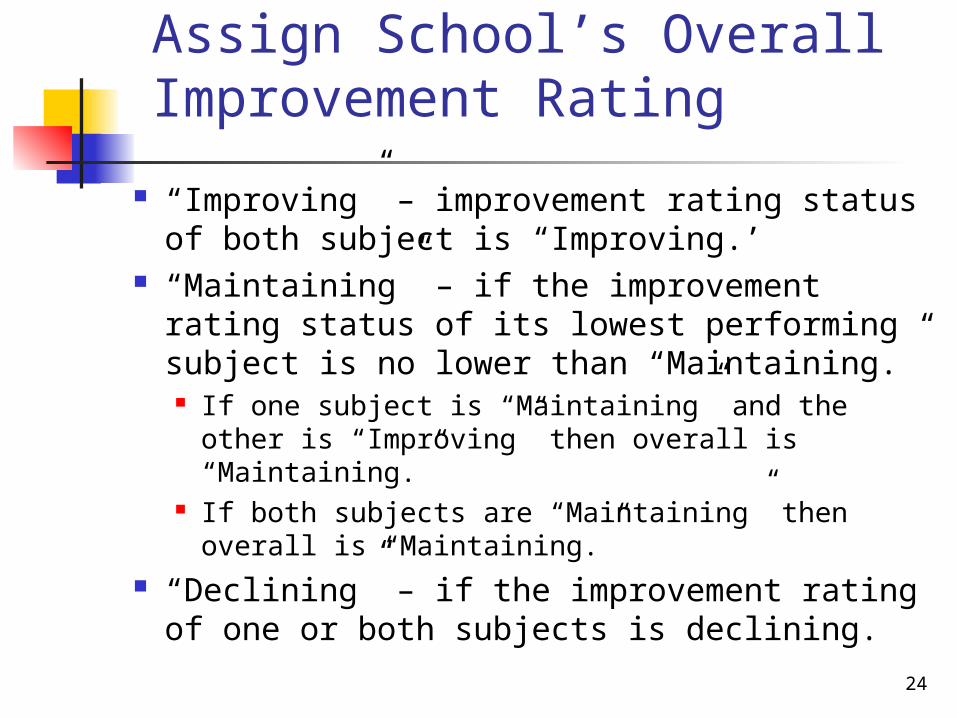
Assign School’s Overall Improvement Rating
“Improving” – improvement rating status of both subject is “Improving.’
“Maintaining” – if the improvement rating status of its lowest performing subject is no lower than “Maintaining.” If one subject is “Maintaining” and the other
is “Improving” then overall is “Maintaining.” If both subjects are “Maintaining” then
overall is “Maintaining.” “Declining” – if the improvement rating
of one or both subjects is declining.

25
Determine the Percent Tested
An alternative school must test at least 90% of eligible students.
The Commissioner of Education is authorized to assign a rating of “I” or otherwise withhold the rating pending availability of data.
The percent tested is calculated by dividing the total number of eligible students tested in each subject by the number of eligible students in membership who are expected to take each subject test.
All eligible students are included in calculation unless they took an alternate test.

26
School Improvement Rating for Alternative Schools 2008

27
2008-09 Improvement Rate Changes
Home School/Zone School "home school" means the school to
which the student would be assigned if the student were not assigned to an alternative school.
28
2005-2006 School Grades and AYP Results
Adequate Yearly
Progress (AYP)

29
No Child Left Behind Adequate Yearly Progress
2008 vs. 2007

30
2007 School Grades Compared to AYP
31
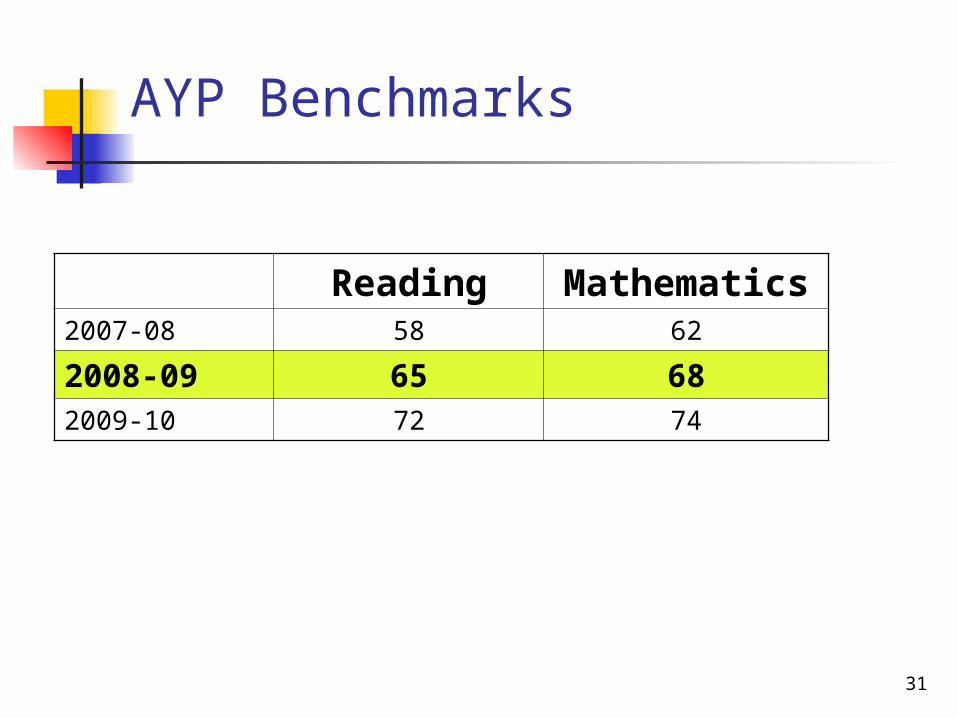
AYP Benchmarks
Reading Mathematics
2007-08 58 62
2008-09 65 682009-10 72 74
32
Education, Information, and Accountability Services (EIAS) Process

33
2008-09 EIAS Process Timeline
Survey 3, 2008-09. Survey Week: February 9-13, 2009. State Processing: February 16 – March 13, 2009.
Correct errors and submit corrections by 4:00 p.m. EST on Friday, March 13, 2008.
For Technical Questions Contact:Tsung-Yuan Lin [email protected] 850.245.9074Or
Ruth Jones [email protected] 850.245.9577
34
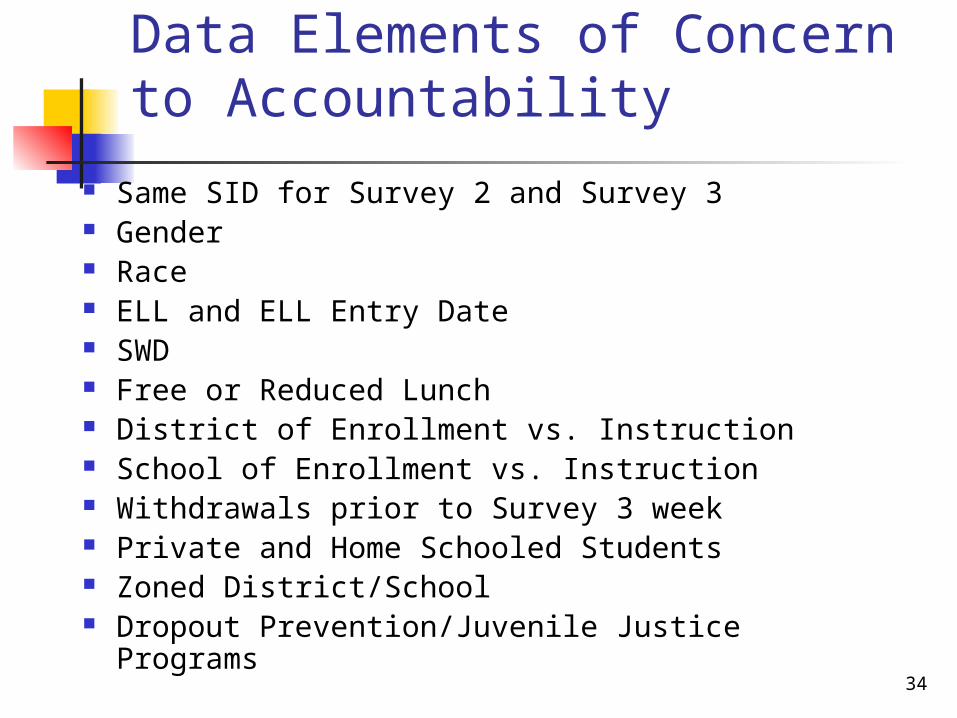
Data Elements of Concern to Accountability
Same SID for Survey 2 and Survey 3 Gender Race ELL and ELL Entry Date SWD Free or Reduced Lunch District of Enrollment vs. Instruction School of Enrollment vs. Instruction Withdrawals prior to Survey 3 week Private and Home Schooled Students Zoned District/School Dropout Prevention/Juvenile Justice Programs
35
Evaluation and Reporting Processes

36
Tentative Timeline for Corrections Processes
Primary District Accountability Coordinators Appointed by Superintendent– September 2008
School Types – January/February 2009 Prior Year Data – February April/May 2009 Student Data Updates – March April/May
2009 Retakes – March April/May 2009 Assessment Corrections – June 2009 Appeals –July to August 2009

37
Website Improvements
Pages are easier to navigate (tabs), uniform across applications, and more aesthetically pleasing.
Links for downloading views into Excel. Error messages are more meaningful and
consistent among applications. A “View All Errors” tab were added to the
district home page. Instructions were more user friendly. A link was added to the upload page so
districts could download the formats in Excel. A “view all records” tab was added to the
Assessment Corrections application.
38
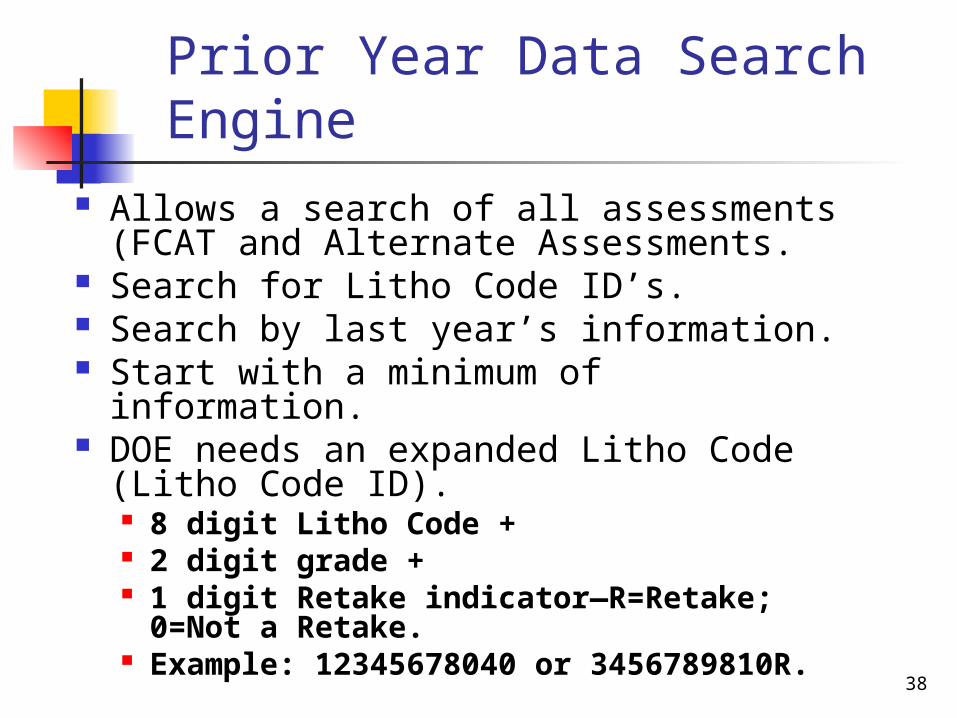
Prior Year Data Search Engine
Allows a search of all assessments (FCAT and Alternate Assessments.
Search for Litho Code ID’s. Search by last year’s information. Start with a minimum of information. DOE needs an expanded Litho Code
(Litho Code ID). 8 digit Litho Code + 2 digit grade + 1 digit Retake indicator—R=Retake;
0=Not a Retake. Example: 12345678040 or
3456789810R.

39
Corrections Process Contact Information
Website: https://app2.fldoe.org/ARM_Applications/ARM_Login
Email: [email protected]
40
Feedback and Suggestions

41
Feedback Put Subject on results screen of Prior Year Search
Engine. Consider extending corrections time during the day. Change test type from “FCT” to “FCA” since the latter
is used in all other DOE applications. Keep prior year data to check against for Retakes. Provide help online for code definitions. Create a separate tab for non-correctable/updateable
records. Compatibility with non-Explorer applications. Anyway to filter a screen by code. i.e. Prior Year Data
Codes D, S, or X? Add a warning several minutes before the application
is to close. Freeze the column labels.

42
Contact Information
Evaluation and Reporting Office Florida Department of Education325 West Gaines Street, Room 445Tallahassee, FL 32399
Website: http://www.fldoe.org/evaluation/
Email: [email protected]

43
Florida’s Differentiated Accountability Pilot Program
44
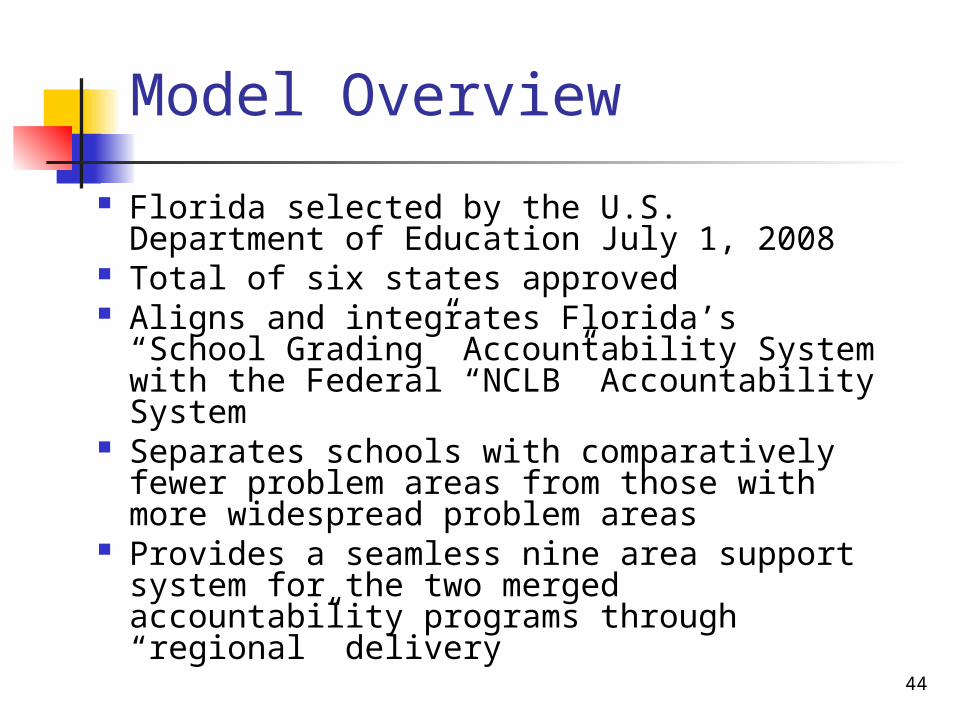
Model Overview
Florida selected by the U.S. Department of Education July 1, 2008
Total of six states approved Aligns and integrates Florida’s “School
Grading” Accountability System with the Federal “NCLB” Accountability System
Separates schools with comparatively fewer problem areas from those with more widespread problem areas
Provides a seamless nine area support system for the two merged accountability programs through “regional” delivery

45
Florida’s Need for a Differentiated Accountability System
Title I Schools at or Beyond the “Planning for Restructuring” Stage:
Number of Title I schools in Year 4 or higher of “in need of improvement” status (SINI 4 or higher) in 2007 = 436
Number of Title I schools in Year 4 or higher of “in need of improvement” status (SINI 4 or higher) in 2008 = 640

46
System Objectives
provide more school-wide assistance and direction for schools at or in restructuring to improve school performance and maintain success;
provide targeted and/or school-wide support and intervention for schools not yet in restructuring to prevent the need for complete restructuring; and
provide focused assistance for schools that have previously been identified for improvement but have demonstrated recent improvement and have the opportunity to exit “in need of improvement” status.

47
Factors in Developing Florida’s Model
School Grading Results (2007) NCLB (2007)
1 2 3 4 5
School Grade Number of Schools by
Grade
Percent of AYP Criteria Met
Schools from Column 2 Meeting Criteria from
Column 3
Percent (Column 4 ÷ Column 2)
A 1,483 90% or more 1,400 94%
B 469 80% or more 413 88%
C 587 70% or more 525 89%
D 216 60% or more 202 94%
F 83 50% or more 80 96%
Correlation between % AYP Criteria Met and School Grades (2007)
48
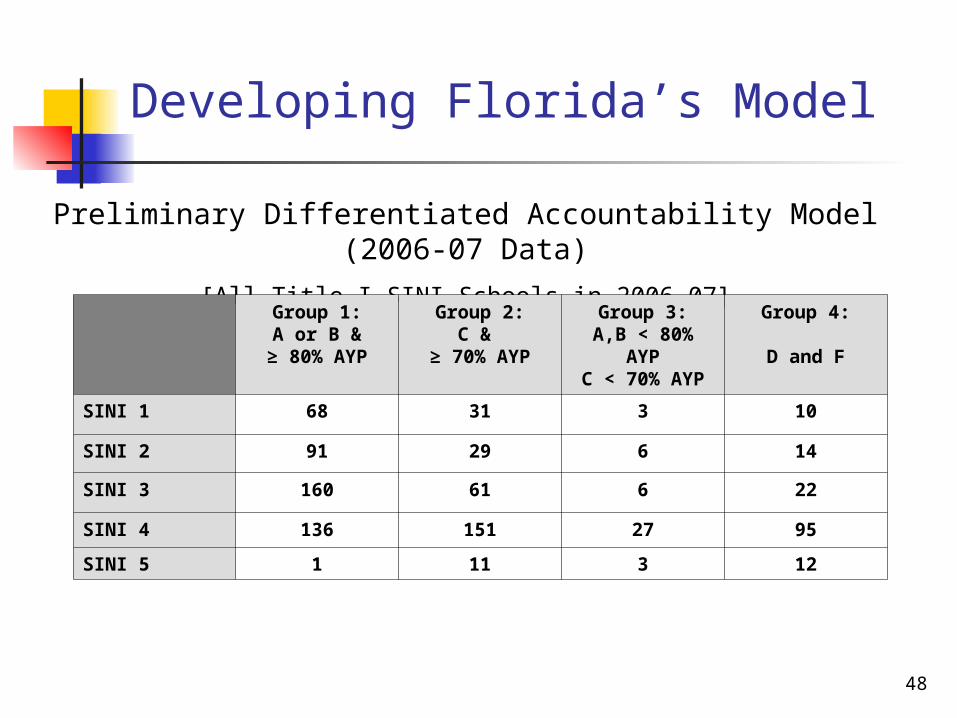
Developing Florida’s Model
Preliminary Differentiated Accountability Model (2006-07 Data)
[All Title I SINI Schools in 2006-07]
Group 1:A or B &
≥ 80% AYP
Group 2:C &
≥ 70% AYP
Group 3:A,B < 80% AYPC < 70% AYP
Group 4:
D and F
SINI 1 68 31 3 10
SINI 2 91 29 6 14
SINI 3 160 61 6 22
SINI 4 136 151 27 95
SINI 5 1 11 3 12

49
Developing Florida’s Model
Next Steps:
Consolidating Groups in the Model
50
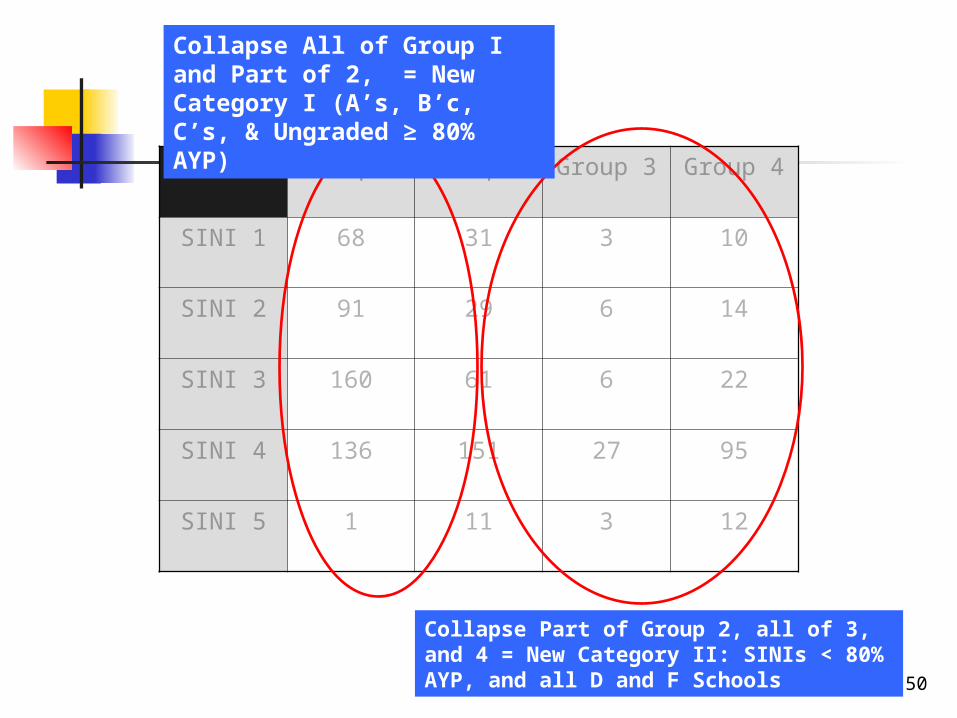
Group 1 Group 2 Group 3 Group 4
SINI 1 68 31 3 10
SINI 2 91 29 6 14
SINI 3 160 61 6 22
SINI 4 136 151 27 95
SINI 5 1 11 3 12
Collapse Part of Group 2, all of 3, and 4 = New Category II: SINIs < 80% AYP, and all D and F Schools
Collapse All of Group I and Part of 2, = New Category I (A’s, B’c, C’s, & Ungraded ≥ 80% AYP)

51
Category I:A,B,C & Ungraded;
≥ 80% AYP
Category II:Graded and
Ungraded; less than 80% AYP; and all D &
F
SINI 1
SINI 2
SINI 3
SINI 4
SINI 5
SINI schools in improvement action or preventative status
SINI Schools with longer-term problems in corrective status
SINIs 1-3 form “Preventive” Grouping; SINIs 4 and up form “Corrective” Grouping

52
Category I:A,B,C &
Ungraded;≥ 80% AYP
Category II:Graded and
Ungraded; less than 80% AYP; and all D &
F
SINI Prevent
SINI Correct
Schools generally performing well which have missed few AYP components
Schools performing poorly which have missed multiple AYP components
A Simpler, more Consolidated Structure:

53
Category I:A,B,C &
Ungraded;≥ 80% AYP
Category II:Graded and
Ungraded; less than 80% AYP; and all D
& F
SINI Prevent
416 85
SINI Correct
248 188
The Basic Idea – to differentiate SINI Schools based on a combination of School Grades & AYP Status with progressive interventions for schools that continue to not make AYP
DifferentiationP
rog
ressive Interven
tion
s
54
Final Development:
Identify schools most intensively in need of intervention (stay tuned for forthcoming slides).
Expand model to include more non-Title I schools (to further consolidate state and federal systems of accountability).
Apply updated data (2007-08) and implement provisions for intervention and support.

55
Differentiated Accountability Today

56
Major System Functions
Differentiated Accountability . . . Streamlines two accountability systems Focuses support progressively Increases requirements as school
grades and percent of AYP met declines

57
Classifying Schools in the Model
Title I Schools are grouped by SINI status, school grade and the percent of AYP criteria met.
Non-Title I Repeating F, F, and D schools are included in the model to ensure continued support.

58
Specific Criteria for School Categories

59
School Counts by Category
*Non-Title I D schools are included in Prevent II; non-Title I F and Repeating Fschools are included in Correct II

60
Identifying “Intervene” Schools
Title I schools that are SINI 4 or more and have met less than 80% of AYP criteria or were graded D or F, and all repeating F schools (regardless of Title I status), are further analyzed using the following four questions:
Has the percentage of non-proficient students in reading increased or stayed the same (failed to improve) since 2003?
Has the percentage of non-proficient students in math increased or stayed the same (failed to improve) since 2003?
Are 65 percent or more of the school’s students non-proficient in reading? Are 65 percent or more of the school’s students non-proficient in math?
Schools for which three or more answers are “Yes” are classified as Intervene schools.
In addition, any school, regardless of Title I status, that has received 4 or more F grades in the last six years is classified as an Intervene school.

61
Roles of the School, District, and State
Prevent I – school directs intervention, district provides assistance, state monitors
Correct I – district directs intervention, state reviews progress
Prevent II – district directs intervention and provides assistance
Correct II – school and district implement state-directed interventions
Intervene – school and district implement state-directed interventions and face possible closure, state monitors

62
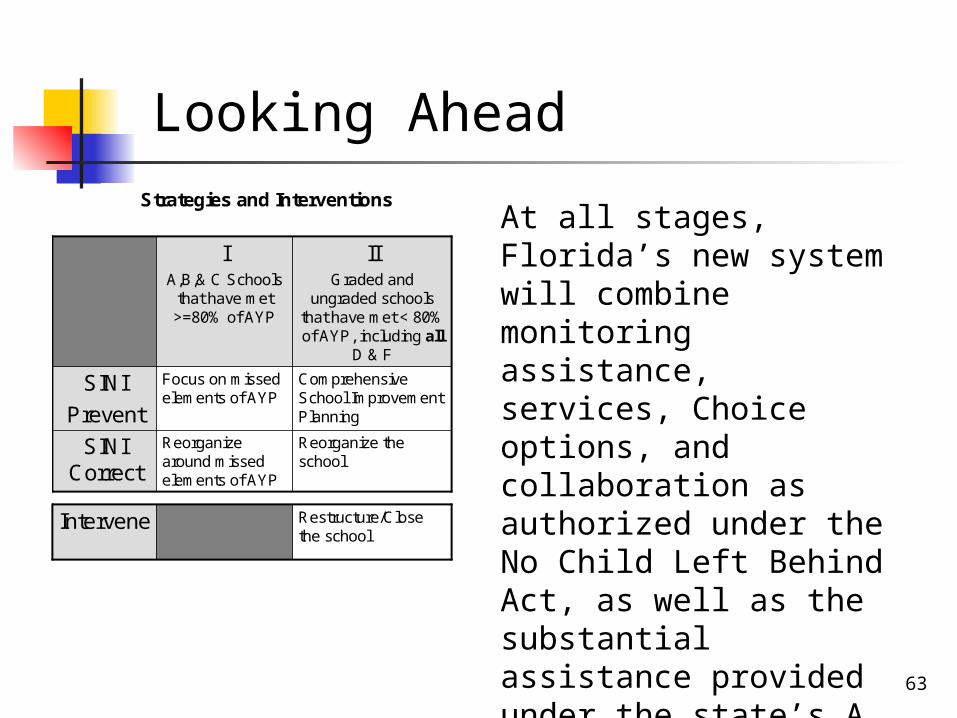
Category I Category II
Prevent Focus on missed elements of AYP
Comprehensive School Improvement Planning
Correct Reorganize around missed elements of AYP
Reorganize the school
Intervene
Restructure/Close the school
Strategies and Interventions
63
At all stages, Florida’s new system will combine monitoring assistance, services, Choice options, and collaboration as authorized under the No Child Left Behind Act, as well as the substantial assistance provided under the state’s A + plan.
Reorganize the school
Reorganize around missed elements of AYP
SINI Correct
Comprehensive School Improvement Planning
Focus on missed elements of AYP
SINI
Prevent
IIGraded and
ungraded schools that have met < 80% of AYP, including all
D & F
IA,B,& C Schools
that have met >=80% of AYP
Reorganize the school
Reorganize around missed elements of AYP
SINI Correct
Comprehensive School Improvement Planning
Focus on missed elements of AYP
SINI
Prevent
IIGraded and
ungraded schools that have met < 80% of AYP, including all
D & F
IA,B,& C Schools
that have met >=80% of AYP
Restructure/Close the school
Intervene Restructure/Close the school
Intervene
Strategies and Interventions
Looking Ahead