2007 textron financial annual report · pdf file2007 annual report | 7 | aviation finance: ......
TRANSCRIPT


2 0 0 7 A n n u A l R e p o R t | 1 |
Managed Finance Receivables
Income from Continuing OperationsBefore Income Taxes
(Dollars in millions) 2007 2006 % Incr/(Decr) For the yearNet interest margin $ 460 $ 430 7%Provision for losses 33 26 27%Income from continuing operations before income taxes 222 210 6%
At year endTotal managed finance receivables $11,123 $ 10,421 9%Total owned finance receivables 8,603 8,310 4%Allowance for losses on receivables 89 93 -4%Shareholders’ equity 1,138 1,142 0%
RatiosReturn on average assets 1.60% 1.84%Return on average equity 13.28% 14.13%Selling and administrative expenses as a percentage of
average managed and serviced finance receivables 1.71% 1.84%Net charge-offs as a percentage of average finance receivables 0.45% 0.38%Allowance for losses on finance receivables as a percentage
of finance receivables 1.03% 1.11%Nonperforming assets as a percentage of finance assets 1.34% 1.28%
0
2,000
4,000
6,000
8,000
10,000
12,000
2003 2004 2005
Year
Year
Year
(in m
illio
ns)
2006 2007
0.0%
0.5%
1.0%
1.5%
2.0%
2.5%
2003 2004 2005
(per
cent
)
2006 2007
Year
0.0%
0.5%
1.0%
1.5%
2.0%
2.5%
3.0%
2003 2004 2005
(per
cent
)
2006 2007
0
50
100
150
200
250
2003 2004 2005
(in m
illio
ns)
2006 20070
2,000
4,000
6,000
8,000
10,000
12,000
2003 2004 2005
Year
Year
Year
(in m
illio
ns)
2006 2007
0.0%
0.5%
1.0%
1.5%
2.0%
2.5%
2003 2004 2005
(per
cent
)
2006 2007
Year
0.0%
0.5%
1.0%
1.5%
2.0%
2.5%
3.0%
2003 2004 2005
(per
cent
)
2006 2007
0
50
100
150
200
250
2003 2004 2005
(in m
illio
ns)
2006 2007
Financial Highlights

| 2 | t e X t R o n F I n A n C I A l C o R p o R A t I o n
Ted French (left) Jay Carter (right)
This past year marks an important milestone as Textron Financial celebrated its 45th anniversary and
another year of record net operating profits and excellent credit quality. More specifically, we achieved
solid growth of 9 percent managed receivables and a 6 percent increase in operating income, despite
difficulties in the capital markets during 2007. Indeed, our steadfast commitment to maintaining a
disciplined credit culture equals our impassioned focus on growing receivables.
While Textron Financial was originally established to provide financing programs for products
manufactured by our parent company, Textron Inc., we have since grown into a financial leader in the
areas of Aviation Finance, Asset-Based lending, Distribution Finance, Golf Finance, Resort Finance,
and Structured Capital. By maintaining liquidity through diversified funding sources, we are well-
positioned to meet the growing needs of our customers.
Across our core businesses, we experienced solid growth in 2007. Of particular note was our Aviation
Finance Division, which greatly expanded its international presence and reach. The Resort Division also
recorded excellent results as our specialty real estate business continued to perform well. Even our Golf
business, which felt the pressures of a flattening industry, delivered solid growth and profitability.
Besides accelerating growth in our core businesses, our long-term strategy revolves around pursuing
opportunities to expand into adjacent spaces and new geographic markets. The successful launch of
a Marine Division and a Vendor Finance Division, along with the opening of our first European operation
for our inventory financing business, are among our 2007 accomplishments.
Management Letter

2 0 0 7 A n n u A l R e p o R t | 3 |
Underscoring this strategy has been an unwavering focus on satisfied customers, talented
employees, world-class processes, and, ultimately, superior financial performance. Certainly,
our deployment of Six Sigma and lean has made it easier for customers to do business with
us, and easier for employees to do their jobs. We have also maintained an emphasis on ethics
and compliance, diversity, business continuity, and safety – all of which make us an employer of
choice and a more dependable provider to our customers. Extensive feedback from employees and
customers validates this.
On that note, we are proud to say that the Company made notable strides in 2007 in assessing the
satisfaction level of our customers and engagement level of our employees. The results on both
fronts were quite encouraging – showing that our customers rate us significantly higher than other
financial companies, and our employees are highly engaged compared to global norms. We firmly
believe that there is a strong correlation between these two accomplishments.
All in all, 2007 was a year in which smart growth continued for Textron Financial across North
America, including Canada and Mexico, and into Europe. Going forward, we are in a prime position
to expand into new industries and territories by exploring exciting opportunities while controlling risk.
Here’s to another 45 years of enriching relationships with customers, employees, and partners.
“Our customers rate us significantly higher
than other financial companies, and our employees
are highly engaged compared to global norms.”
Ted French Chairman and CEO
Jay Carter President and COO

| 4 | t e X t R o n F I n A n C I A l C o R p o R A t I o n
Textron Financial has a long tradition of providing
inventory (or floorplan) financing to dealers and
manufacturers in various industries, and has
consistently achieved strong results year-after-year
as we pursue opportunities to expand into new and
adjacent spaces.
Case in point: In 2007, we strengthened our
position as a premier lender for marine watercraft by
establishing a dedicated Marine Division. Through the
focused talents and customer-centered mindset of
our employees, the Marine Division delivered stellar
performance in its inaugural year.
This dedication came into focus when Chaparral Boats,
a long-time Textron Financial customer, was facing
challenges with its growth in international business.
We dispatched a team of textron Six Sigma Black
Distribution Finance: Strong Results, Dedicated Resources, Global Reach
| 1 9 6 2 | | 1 9 7 1 | | 1 9 7 8 |
Textron Financial begins servicing the financial
needs of Bell Helicopter and E-Z-GO customers
Textron Financial begins inventory financing for major manufacturers
of snowmobiles
Financing is offered for turf care products with Textron’s acquisition
of Jacobsen

2 0 0 7 A n n u A l R e p o R t | 5 |
Belts to help them improve certain processes. This kind of support has made our Marine Division
a significant contributor to the company’s overall growth and success.
To the dealers and manufacturers we support, our Field Services representatives are the eyes
and ears of this company. Each day, they are visiting dealer locations to ensure that every piece
of equipment that is financed – whether a piano or an automobile – is present and accounted
for. While it is typically hard to engage
employees who do not routinely come
into the office, our Field Services group
implemented a process to educate
employees about the benefits of Six
Sigma and lean. Their involvement
resulted in more than 200 ideas and
$2 million in savings and efficiencies.
In 2007, we also began marketing our
inspection services to other banks and
manufacturing companies.
| 1 9 9 0 | | 1 9 9 8 | | 2 0 0 2 |
Textron Financial establishes the Golf
and Timeshare Divisions
Financing services are offered to the transportation and temporary staffing
industries
We opened Textron Financial Limited in Guildford, Surrey, United Kingdom initially to provide inventory financing to dealers in the UK and eventually throughout Western Europe. This Distribution Finance Group operation not only puts us closer to prospects in a new marketplace, but also better positions us to support our North American customers who want us to finance their dealers in Europe.
Textron Financial’s Customer Care Center opens

| 6 | t e X t R o n F I n A n C I A l C o R p o R A t I o n
Textron Financial provides sound financial backing for golf,
timeshare, marina, and hospitality industry clients throughout
North America. Nurturing customer relationships and leveraging
proven expertise bolstered our presence in the hotel and marina
industries in 2007. By expanding on successful niches, we
not only exceeded all financial targets despite an economic
downturn, but also further established ourselves as leaders in
the areas of specialty real estate and equipment financing.
Pursuing opportunities to expand into related products and industries has been a proven formula for success
within Textron Financial. For example, in 1990 we built upon our knowledge of the golf equipment business to
begin providing mortgage financing to golf course operators. Today, we continue to recognize new ways to grow
and have leveraged our golf equipment processes and expertise to establish a new Vendor Finance Division.
In addition to providing golf and turf equipment financing solutions for our sister companies, Vendor Finance will
pursue non-textron equipment leasing relationships across multiple industries, beginning with construction
and agricultural equipment in the U.S. and Canada. With dedicated resources and top-notch leaders with a proven
record of equipment leasing capabilities, we are well positioned to achieve sustainable growth in this area.
Specialty Real Estate & Equipment Finance: Solid Growth, New Records, Focused Support
The Resort Finance Division had its best year ever in 2007, exceeding budget related
to profitability measures while maintaining consistently strong credit quality. Exceptional
customer service, as evidenced by high satisfaction ratings, was a significant
contributor to this. This division also expanded its footprint in the hospitality industry
with 11 new customers in 2007, closing commitments of $136 million.
| 2 0 0 4 | | 2 0 0 5 | | 2 0 0 6 |
Asset-Based Lending Division begins to finance healthcare
receivables
Distribution Finance Group expands its full line of products and services to the Canadian market
Textron Financial acquires Electrolux
Financial Corporation’s inventory finance
business

2 0 0 7 A n n u A l R e p o R t | 7 |
Aviation Finance: Global Presence, Customer Commitment, Strong Collaboration
The Aviation Finance Division of Textron Financial began serving the financing needs of its sister
company, Cessna Aircraft, more than 50 years ago. Since that time, we have grown to also serve
the needs of another Textron company – namely, Bell Helicopter – in addition to non-textron
aircraft. Today, as one of the largest general aviation finance companies serving fixed and rotor
wing aircraft, we have proudly provided more than $17 billion in financing for over 180,000 aircraft
in use around the world.
Indeed, in 2007, the world became a smaller place to us. We extended our reach to 65 countries,
and established offices with dedicated resources in Brazil, Singapore, and the United Kingdom. We
reaped the rewards of moving closer to our customers as international volume grew 76 percent
over 2006. That growth boosted our international
portfolio to more than $1 billion in managed receivables.
In all we do, Aviation Finance has an unwavering
focus on customers and collaboration with our sister
companies. As an example, this has made us Cessna
Aircraft’s preferred lender and Textron Financial’s 2007
division of the year.
Robert Curtis of Aviation Finance (center) received a call from a customer having trouble. Weeks before, the same customer had informed him that he was planning to finance one of Cessna’s Citation Mustangs with a competitor. With plane delivery set to take place the very next day, the customer had discovered that the financier had included unacceptable terms. Robert jumped into action and closed the transaction in record time with Textron Financial. Robert earned Cessna Aircraft’s
“Taking Care of Customers” award.
| 2 0 0 6 | | 2 0 0 7 | | 2 0 0 7 |
Textron Financial surpasses $10 billion mark for receivables growth and delivers its “Best Year Ever”
Textron Financial establishes dedicated
Marine Division
Vendor Finance Division established

| 8 | t e X t R o n F I n A n C I A l C o R p o R A t I o n
45 Years of Smart Growth
Net Charge-Off %NPA as % of Finance Assets
0
2,000
4,000
6,000
8,000
10,000
12,000
2003 2004 2005
Year
Year
Year
(in m
illio
ns)
2006 2007
0.0%
0.5%
1.0%
1.5%
2.0%
2.5%
2003 2004 2005
(per
cent
)
2006 2007
Year
0.0%
0.5%
1.0%
1.5%
2.0%
2.5%
3.0%
2003 2004 2005
(per
cent
)
2006 2007
0
50
100
150
200
250
2003 2004 2005
(in m
illio
ns)
2006 2007
Nearly a half-century of experience has taught us that great things come from within. With “Greatness
Starts with Me” as a rallying cry, our employees have embraced this concept and have demonstrated
a steadfast commitment to understanding how they add value. Each day, they approach their jobs
with a firm resolve to apply their knowledge and skills to achieving the common vision we all share –
namely, to become the premier commercial finance company.
We wholeheartedly believe aptitude and attitude are key to achieving superior financial results. Part
of this is knowing what deals to make and which ones to walk away from. We call this disciplined or
smart growth, and it is the reason we have achieved many years of outstanding portfolio quality in
our core businesses.
With that, as we close another year of record Net Operating Profit and all-time low delinquency, we
acknowledge once again that greatness starts with a talented base of employees and is constructed
on a foundation of sound investments, superior customer service, world-class processes, and
innovative products and solutions.0
2,000
4,000
6,000
8,000
10,000
12,000
2003 2004 2005
Year
Year
Year
(in m
illio
ns)
2006 2007
0.0%
0.5%
1.0%
1.5%
2.0%
2.5%
2003 2004 2005
(per
cent
)
2006 2007
Year
0.0%
0.5%
1.0%
1.5%
2.0%
2.5%
3.0%
2003 2004 2005
(per
cent
)
2006 2007
0
50
100
150
200
250
2003 2004 2005
(in m
illio
ns)
2006 2007
With credit discipline as an enabler of long-term success, Textron Financial launched a Credit
Knowledge Program in 2007 to build employees’ technical credit skills and business acumen. Anyone
going through this program starts by evaluating approximately 25 skills necessary to credit analysis
and underwriting. From that work, training needs are identified and a personalized training plan is
created. Deemed an internal best practice, this tool is being leveraged by other functional and
operational areas across Textron Financial that are looking to assess and track competencies.

UNITED STATESSECURITIES AND EXCHANGE COMMISSION
Washington, D.C. 20549
FORM 10-K¥ ANNUAL REPORT PURSUANT TO SECTION 13 OR 15(d)OF THE
SECURITIES EXCHANGE ACT OF 1934For the fiscal year ended December 29, 2007
OR
n TRANSITION REPORT PURSUANT TO SECTION 13 OR 15(d)OF THESECURITIES EXCHANGE ACT OF 1934
For the transition period from to
Commission file number 0-27559
Textron Financial Corporation(Exact Name of Registrant as Specified in Its Charter)
Delaware 05-6008768(State or Other Jurisdiction ofIncorporation or Organization)
(I.R.S. EmployerIdentification No.)
40 Westminster Street, P.O. Box 6687, Providence, R.I. 02940-6687(Address of Principal Executive Offices) (Zip Code)
Registrant’s Telephone Number, Including Area Code:(401) 621-4200
Securities registered pursuant to Section 12(b) of the Act:Title of Class Name of Each Exchange on Which Registered
$100,000,000 5.125% Notes New York Stock Exchangedue August 15, 2014
Securities registered pursuant to Section 12(g) of the Act:
Common Stock, $100.00 par value
Indicate by check mark if the registrant is a well-known seasoned issuer as defined in Rule 405 of the Securities Act. Yes ¥ No n
Indicate by check mark if the registrant is not required to file reports pursuant to Section 13 or Section 15(d) of the Act. Yes n No ¥
Indicate by check mark whether the registrant (1) has filed all reports required to be filed by Section 13 or 15(d) of the Securities Exchange Act of1934 during the preceding 12 months (or for such shorter period that the registrant was required to file such reports) and (2) has been subject to suchfiling requirements for the past 90 days. Yes ¥ No n
Indicate by check mark if disclosure of delinquent filers pursuant to Item 405 of Regulation S-K is not contained herein, and will not be containedherein, and will not be contained, to the best of registrant’s knowledge, in definitive proxy or information statements incorporated by reference in Part IIIof this Form 10-K or any amendment to this Form 10-K. (Not applicable).
Indicate by check mark whether the registrant is a large accelerated filer, an accelerated filer, a non-accelerated filer, or a smaller reportingcompany. See the definitions of “large accelerated filer,” “accelerated filer” and “smaller reporting company” in Rule 12b-2 of the Exchange Act.(Check one):
n Large accelerated filer n Accelerated filer ¥ Non-accelerated filer n Smaller reporting company
(Do not check if a smaller reporting company)
Indicate by check mark whether the registrant is a shell company (as defined in Rule 12b-2 of the Exchange Act). Yes n No ¥
All of the shares of common stock of the registrant are owned by Textron Inc. and there was no voting or non-voting common equity held by non-affiliates as of the last business day of the registrant’s most recently completed fiscal quarter.
REGISTRANT MEETS THE CONDITIONS SET FORTH IN GENERAL INSTRUCTION I (1) (a) AND (b) OFFORM 10-K AND IS THEREFORE FILING THIS FORM WITH THE REDUCED DISCLOSURE FORMAT.

TABLE OF CONTENTS
PART I.Item 1. Business . . . . . . . . . . . . . . . . . . . . . . . . . . . . . . . . . . . . . . . . . . . . . . . . . . . . . . . . . . . . . . . . 3
Item 1A. Risk Factors. . . . . . . . . . . . . . . . . . . . . . . . . . . . . . . . . . . . . . . . . . . . . . . . . . . . . . . . . . . . . . 8
Item 1B. Unresolved Staff Comments . . . . . . . . . . . . . . . . . . . . . . . . . . . . . . . . . . . . . . . . . . . . . . . . . . 10
Item 2. Properties . . . . . . . . . . . . . . . . . . . . . . . . . . . . . . . . . . . . . . . . . . . . . . . . . . . . . . . . . . . . . . . 10
Item 3. Legal Proceedings . . . . . . . . . . . . . . . . . . . . . . . . . . . . . . . . . . . . . . . . . . . . . . . . . . . . . . . . . 10
Item 4. Submission of Matters to a Vote of Security Holders . . . . . . . . . . . . . . . . . . . . . . . . . . . . . . . . 10
PART II.Item 5. Market for Registrant’s Common Equity and Related Stockholder Matters . . . . . . . . . . . . . . . . 10
Item 6. Selected Financial Data . . . . . . . . . . . . . . . . . . . . . . . . . . . . . . . . . . . . . . . . . . . . . . . . . . . . . 11
Item 7. Management’s Discussion and Analysis of Financial Condition and Results of Operations . . . . 12
Item 7A. Quantitative and Qualitative Disclosure about Market Risk . . . . . . . . . . . . . . . . . . . . . . . . . . . 27
Item 8. Financial Statements and Supplementary Data. . . . . . . . . . . . . . . . . . . . . . . . . . . . . . . . . . . . . 28
Item 9. Changes in and Disagreements with Accountants on Accounting and Financial Disclosure . . . . 58Item 9A. Controls and Procedures . . . . . . . . . . . . . . . . . . . . . . . . . . . . . . . . . . . . . . . . . . . . . . . . . . . . . 58
Item 9B. Other Information . . . . . . . . . . . . . . . . . . . . . . . . . . . . . . . . . . . . . . . . . . . . . . . . . . . . . . . . . 59
PART III.Item 10. Directors and Executive Officers of the Registrant. . . . . . . . . . . . . . . . . . . . . . . . . . . . . . . . . . 59
Item 11. Executive Compensation . . . . . . . . . . . . . . . . . . . . . . . . . . . . . . . . . . . . . . . . . . . . . . . . . . . . 59
Item 12. Security Ownership of Certain Beneficial Owners and Management . . . . . . . . . . . . . . . . . . . . 59
Item 13. Certain Relationships and Related Transactions . . . . . . . . . . . . . . . . . . . . . . . . . . . . . . . . . . . . 59
Item 14. Principal Accounting Fees and Services . . . . . . . . . . . . . . . . . . . . . . . . . . . . . . . . . . . . . . . . . 59
PART IV.Item 15. Exhibits, Financial Statement Schedules . . . . . . . . . . . . . . . . . . . . . . . . . . . . . . . . . . . . . . . . . 59
2

PART I.
Item 1. Business
General
Textron Financial Corporation (“Textron Financial” or the “Company”) is a diversified commercial financecompany with core operations in six segments. Asset-Based Lending provides revolving credit facilities secured byreceivables and inventory, related equipment and real estate term loans, and factoring programs across a broad rangeof manufacturing and service industries; Aviation Finance provides financing for new and used Cessna businessjets, single engine turboprops, piston-engine airplanes, Bell helicopters, and other general aviation aircraft;Distribution Finance primarily offers inventory finance programs for dealers of Textron manufactured productsand for dealers of a variety of other household, housing, leisure, agricultural and technology products; Golf Financeprimarily makes mortgage loans for the acquisition and refinancing of golf courses and provides term financing forE-Z-GO golf cars and Jacobsen turf-care equipment; Resort Finance primarily extends loans to developers ofvacation interval resorts, secured principally by notes receivable and interval inventory; and Structured Capitalprimarily engages in long-term leases of large-ticket equipment and real estate, primarily with investment gradelessees.
All of Textron Financial’s stock is owned by Textron Inc. (“Textron”), a global multi-industry company withoperations in four business segments: Bell, Cessna, Industrial and Finance. At December 29, 2007, 19% of TextronFinancial’s total managed finance receivables represent finance receivables originated in connection with the sale orlease of Textron manufactured products. For further information on Textron Financial’s relationship with Textron,see “Relationship with Textron” below.
Textron Financial’s financing activities are confined almost exclusively to secured lending and leasing tocommercial markets. Textron Financial’s services are offered primarily in North America. However, TextronFinancial finances products worldwide, principally Bell helicopters and Cessna aircraft.
Textron Financial also maintains a Corporate and Other segment that includes non-core assets related tofranchise finance, media finance and other liquidating portfolios from product lines that were discontinued in 2001.The Company ceased finance receivable originations in these business markets, and continues to actively managethe accounts to maximize value as the accounts are collected or sold. The Corporate and Other segment alsoincludes unallocated Corporate expenses.
Consistent with the Company’s strategy to exit these non-core businesses, Textron Financial sold its smallbusiness direct portfolio (small business finance) in December 2003. The selected financial data in Item 6, and thediscussion of the Company’s results in Item 7, exclude the results of this discontinued operation, as defined byStatement of Financial Accounting Standards (“SFAS”) No. 144, “Accounting for the Impairment or Disposal ofLong-lived Assets,” which is described in Note 3 to the Consolidated Financial Statements in Item 8 of thisForm 10-K.
For additional financial information regarding Textron Financial’s business segments, refer to Note 18 to theConsolidated Financial Statements in Item 8 of this Form 10-K.
Competition
The commercial finance environment in which Textron Financial operates is highly fragmented and extremelycompetitive. Textron Financial is subject to competition from various types of financing institutions, includingbanks, leasing companies, insurance companies, commercial finance companies and finance operations ofequipment vendors. Competition within the commercial finance industry is primarily focused on price, term,structure and service. The Company may lose market share to the extent that it is unwilling to match competitors’practices. To the extent that Textron Financial matches these practices, the Company may experience decreasedmargins, increased risk of credit losses or both. Many of Textron Financial’s competitors are large companies thathave substantial capital, technological and marketing resources. This has become increasingly the case given theconsolidation activity in the commercial finance industry. In some instances, Textron Financial’s competitors haveaccess to capital at lower costs than Textron Financial.
3
Relationship with Textron
General
Textron Financial derives a portion of its business from financing the sale and lease of products manufacturedand sold by Textron. Textron Financial paid Textron $1.2 billion in 2007, $1.0 billion in 2006 and $0.8 billion in2005 for the sale of manufactured products to third parties that were financed by the Company. In addition, theCompany paid Textron $27 million in 2007, $63 million in 2006 and $41 million in 2005 for the purchase ofequipment on operating leases. Textron Financial recognized finance charge revenues from Textron and affiliates(net of payments or reimbursements for interest charged at more or less than market rates on Textron manufacturedproducts) of $4 million in 2007, $10 million in 2006 and $7 million in 2005, and operating lease revenues of$27 million in 2007 and $26 million in both 2006 and 2005.
Textron Financial and Textron utilize an intercompany account for the allocation of Textron overhead chargesand for the settlement of captive receivables. For additional information regarding the relationship between TextronFinancial and Textron, see Notes 4, 5 and 10 to the Consolidated Financial Statements in Item 8 of this Form 10-K.
Agreements with Textron
Textron Financial and Textron are parties to several agreements, which govern many areas of the TextronFinancial-Textron relationship. They are described below:
Receivables Purchase Agreement
Under a Receivables Purchase Agreement with Textron, Textron Financial has recourse to Textron with respectto certain finance receivables and operating leases relating to products manufactured and sold by Textron. Financereceivables of $87 million at December 29, 2007 and $152 million at December 30, 2006, and operating leases of$167 million at December 29, 2007 and $183 million at December 30, 2006, were subject to recourse to Textron ordue from Textron.
Support Agreement with Textron
Under a Support Agreement with Textron dated as of May 25, 1994, Textron is required to pay to TextronFinancial, quarterly, an amount sufficient to provide that Textron Financial’s pre-tax earnings, before extraordinaryitems and fixed charges (including interest on indebtedness and amortization of debt discount “fixed charges”), asadjusted for the inclusion of required payments under the Support Agreement, will not be less than 125% of theCompany’s fixed charges. No payments under the Support Agreement have ever been required. Textron Financial’sfixed-charge coverage ratios (as defined) were 156%, 159% and 177% for the years ended 2007, 2006 and 2005,respectively. Textron also has agreed to maintain Textron Financial’s consolidated shareholder’s equity at anamount not less than $200 million. Pursuant to the terms of the Support Agreement, Textron is required to directly orindirectly own 100% of Textron Financial’s common stock. The Support Agreement also contains a third-partybeneficiary provision entitling Textron Financial’s lenders to enforce its provisions against Textron.
Tax Sharing Agreement with Textron
Textron Financial’s revenues and expenses are included in the consolidated federal tax return of Textron. TheCompany files some of its state income tax returns on a separate basis. Under a Tax Sharing Agreement withTextron, Textron Financial is allocated federal tax benefits and charges on the basis of statutory U.S. tax ratesapplied to the Company’s taxable income or loss included in the consolidated returns. The benefits of generalbusiness credits, foreign tax credits and any other tax credits are utilized in computing current tax liability. TextronFinancial is paid for tax benefits generated and utilized in Textron’s consolidated federal and unitary or combinedstate income tax returns, whether or not the Company would have been able to utilize those benefits on a separatetax return. Income tax assets or liabilities are settled on a quarterly basis. Textron has agreed to lend TextronFinancial, on a junior subordinated interest-free basis, an amount equal to Textron’s deferred income tax liabilityattributable to the manufacturing profit not yet recognized for tax purposes on products manufactured by Textron
4

and financed by Textron Financial. Borrowings under this arrangement are reflected in “Amounts due toTextron Inc.” on the Consolidated Balance Sheets in Item 8 of this Form 10-K.
Regulations
Textron Financial’s activities are subject, in certain instances, to supervision and regulation by state and federalgovernmental authorities. These activities also may be subject to various laws, including consumer finance laws insome instances, and judicial and administrative decisions imposing various requirements and restrictions, which,among other things:
• Regulate credit-granting activities;
• Establish maximum interest rates, finance charges and other charges;
• Require disclosures to customers;
• Govern secured transactions;
• Affect insurance brokerage activities; and
• Set collection, foreclosure, repossession and claims handling procedures and other trade practices.
Although most states do not intensively regulate commercial finance activity, many states impose limitationson interest rates and other charges, and prohibit certain collection and recovery practices. They also may requirelicensing of certain business activities and specific disclosure of certain contract terms. The Company also may besubject to regulation in those foreign countries in which it has operations.
Existing statutes and regulations have not had a material adverse effect on the Company’s business. However,it is not possible to forecast the nature of future legislation, regulations, judicial decisions, orders or interpretationsor their impact upon Textron Financial’s future business, financial condition, results of operations or prospects.
Employees
As of December 29, 2007, Textron Financial had 1,209 employees. The Company is not subject to anycollective bargaining agreements.
Risk Management
Textron Financial’s business activities involve various elements of risk. The Company considers the principaltypes of risk to be:
• Credit risk;
• Asset/liability risk (including interest rate and foreign exchange risk); and
• Liquidity risk.
Proper management of these risks is essential to maintaining profitability. Accordingly, the Company hasdesigned risk management systems and procedures to identify and quantify these risks. Textron Financial hasestablished appropriate policies and set prudent limits in these areas. The Company’s management of these risks,and levels of compliance with its policies and limits, is continuously monitored by means of administrative andinformation systems.
Credit Risk Management
Textron Financial manages credit risk through:
• Underwriting procedures;
• Centralized approval of individual transactions exceeding certain size limits; and
• Active portfolio and account management.
5
The Company has developed underwriting procedures for each operating unit that assesses a prospectivecustomer’s ability to perform in accordance with financing terms. These procedures include:
• Analyzing business or property cash flows and collateral values;
• Performing financial sensitivity analyses; and
• Assessing potential exit strategies.
Textron Financial has developed a tiered credit approval system, which allows certain transaction types andsizes to be approved at the operating unit level. The delegation of credit authority is done under strict policyguidelines. Textron Financial’s operating units are also subject to annual internal audits by the Company andTextron.
Depending on transaction size and complexity, transactions outside of operating unit authority require theapproval of a Group President and Group Credit Officer or Corporate Risk Management Officer. Transactionsexceeding group authority require one or more of the Executive Vice President and Chief Credit Officer, thePresident and Chief Operating Officer, Textron Financial’s Credit Committee, or the Chairman and Chief ExecutiveOfficer depending on the size of the transaction, and in some cases approvals are required by Textron up to andincluding its Board of Directors. As of December 29, 2007, Textron Financial’s Credit Committee is comprised ofits President and Chief Operating Officer, Executive Vice President and Chief Credit Officer, Executive VicePresident and Chief Financial Officer, Executive Vice President, General Counsel and Secretary, Senior VicePresident and Treasurer, Group President of the Revolving Credit Group and Group President of Specialty RealEstate and Equipment Finance.
The Company controls the credit risk associated with its portfolio by limiting transaction sizes, as well asdiversifying transactions by industry, geographic area, property type and borrower. Through these practices,Textron Financial identifies and limits exposure to unfavorable risks and seeks favorable financing opportunities.Management reviews receivable aging trends and watch list reports and conducts regular business reviews in orderto monitor portfolio performance. Certain receivable transactions are originated with the intent of fully or partiallyselling them. This strategy provides an additional tool to manage credit risk.
Geographic Concentration
Textron Financial continuously monitors its portfolio to avoid any undue geographic concentration in anyregion of the U.S. or in any foreign country. At December 29, 2007, the largest concentration of domesticreceivables was in the Southeastern U.S., representing 25% of Textron Financial’s total managed finance receivableportfolio. At December 29, 2007, international receivables represented 22% of Textron Financial’s managedfinance receivable portfolio. For additional information regarding Textron Financial’s concentrations, see Note 5 tothe Consolidated Financial Statements in Item 8 of this Form 10-K.
Asset/Liability Risk Management
The Company continuously measures and quantifies interest rate risk and foreign exchange risk, in each casetaking into account the effect of hedging activity. Textron Financial uses derivatives as an integral part of its asset/liability management program in order to reduce:
• Interest rate exposure arising from changes in interest rate indices; and
• Foreign currency exposure arising from changes in exchange rates.
The Company does not use derivative financial instruments for the purpose of generating earnings fromchanges in market conditions. Before entering into a derivative transaction, the Company determines that there is ahigh correlation between the change in value of, or the cash flows associated with, the hedged asset or liability andthe value of, or the cash flows associated with, the derivative instrument. When Textron Financial executes atransaction, it designates the derivative to a specific asset, liability, or set of cash flows and as either a fair value orcash flow hedge. Textron Financial monitors the effectiveness of derivatives through a review of the amounts and
6

maturities of assets, liabilities and derivative positions. The Company’s Treasurer and Chief Financial Officerregularly review this information, so that appropriate remedial action can be taken, as necessary.
Textron Financial carefully manages exposure to counterparty risk in connection with its derivatives. Ingeneral, the Company engages in transactions with counterparties having ratings of at least A by Standard & Poor’sRating Service or A2 by Moody’s Investors Service. Total credit exposure is monitored by counterparty, andmanaged within prudent limits. At December 29, 2007, the Company’s largest single counterparty credit exposurewas $3 million.
Interest Rate Risk Management
Textron Financial manages interest rate risk by monitoring the duration and interest rate sensitivities of itsassets, and by incurring liabilities (either directly or synthetically with derivatives) having a similar duration andinterest sensitivity profile. The Company’s internal policies limit the aggregate mismatch of floating-rate assets andliabilities to 10% of total assets. For additional information regarding Textron Financial’s interest rate risk, see“Management’s Discussion and Analysis of Financial Condition and Results of Operations — Interest RateSensitivity,” in Item 7 of this Form 10-K.
Foreign Exchange Risk Management
A portion of the finance assets owned by Textron Financial are located outside of North America. Thesereceivables are generally in support of Textron’s overseas product sales and are predominantly denominated inU.S. Dollars. Textron Financial has foreign currency receivables primarily denominated in Canadian Dollars. Inorder to minimize the effect of fluctuations in foreign currency exchange rates on the Company’s financial results,Textron Financial borrows in these currencies and/or enters into forward exchange contracts and foreign currencyinterest rate exchange agreements in amounts sufficient to substantially hedge its foreign currency exposures.
Liquidity Risk Management
The Company requires cash to fund asset growth and to meet debt obligations and other commitments. TextronFinancial’s primary sources of funds are:
• Cash from operations;
• Commercial paper borrowings;
• Issuances of medium-term notes and other term debt securities; and
• Syndication and securitization of receivables.
All commercial paper borrowings are fully backed by committed bank lines of credit, providing liquidity in theevent of capital market disruption. If Textron Financial is unable to access these markets on acceptable terms, theCompany can draw on its bank line of credit facilities and use cash flows from operations and portfolio liquidationsto satisfy its liquidity needs. For additional information regarding Textron Financial’s liquidity risk management,see “Management’s Discussion and Analysis of Financial Condition and Results of Operations — Liquidity andCapital Resources,” in Item 7 of this Form 10-K.
Available Information
The Company makes available free of charge on its Internet website (http://www.textronfinancial.com) itsAnnual Report on Form 10-K, Quarterly Reports on Form 10-Q, Current Reports on Form 8-K, and amendments tothose reports filed or furnished pursuant to Section 13(a) or 15(d) of the Securities Exchange Act of 1934 as soon asreasonably practicable after the Company electronically files such material with, or furnishes it to, the Securitiesand Exchange Commission.
7

Forward-looking Information
Certain statements in this Annual Report on Form 10-K and other oral and written statements made by TextronFinancial from time to time are forward-looking statements, including those that discuss strategies, goals, outlookor other non-historical matters; or project revenues, income, returns or other financial measures. These forward-looking statements speak only as of the date on which they are made, and we undertake no obligation to update orrevise any forward-looking statements. These forward-looking statements are subject to risks and uncertainties thatmay cause actual results to differ materially from those contained in the statements, including the following:(a) changes in worldwide economic and political conditions that impact interest and foreign exchange rates; (b) theoccurrence of slowdowns or downturns in customer markets in which Textron products are sold or supplied andfinanced or where we offer financing; (c) the ability to realize full value of receivables and investments in securities;(d) the ability to control costs and successful implementation of various cost reduction programs; (e) increases inpension expenses and other post-retirement employee costs; (f) the impact of changes in tax legislation; (g) theability to maintain portfolio credit quality; (h) access to debt financing at competitive rates; (i) access to equity inthe form of retained earnings and capital contributions from Textron; (j) uncertainty in estimating contingentliabilities and establishing reserves tailored to address such contingencies; (k) the launching of significant newproducts or programs which could result in unanticipated expenses; and (l) risks and uncertainties related toacquisitions and dispositions.
Item 1A. Risk Factors
Our business, financial condition and results of operations are subject to various risks, including thosediscussed below, which may affect the value of our securities. The risks discussed below are those that we currentlybelieve are the most significant, although additional risks not presently known to us or that we deem less significantcurrently may also impact our business, financial condition or results of operations, perhaps materially.
We may be unable to effectively mitigate pricing pressures
Our profitability is directly affected by our ability to competitively price the financial services we provide.Pricing pressures arise out of a divergence in the perception of customers’ value expectations for a particularservice, and the price at which we can viably offer that service. These pressures are impacted by a number of factors,including but not limited to the competitive environment in which we operate, our ability to efficiently borrow cost-effective capital at rates consistent with our credit profile, and our cost structure.
Our business is dependent on its continuing access to reliable capital markets
We depend on our ability to access reliable sources of capital in order to fund asset growth, fund operations,and meet debt obligations and other commitments. We currently raise capital through commercial paper borrow-ings, issuances of medium-term notes and other term debt securities, and syndication and securitization ofreceivables. Additional liquidity is provided through bank lines of credit. Much of the capital markets fundingis made possible by the maintenance of credit ratings that are acceptable to investors. If our credit ratings were to belowered, we might face higher borrowing costs, a disruption of our ability to access the capital markets or both. Inaddition, we could experience reduced access to the securitization market due to deterioration in our financereceivable portfolio quality or a reduction of new finance receivable originations in the businesses that utilize thesefunding arrangements. We also could lose access to financing for other reasons, such as a general disruption of thecapital markets. Any disruption of our access to the capital markets could adversely affect our business andprofitability.
If we are unable to maintain portfolio credit quality, our financial performance may be adversely affected
A key determinant of financial performance is our ability to maintain the quality of loans, leases and othercredit products in our finance asset portfolios. Portfolio quality may adversely be affected by several factors,including finance receivable underwriting procedures, collateral quality, geographic or industry concentrations orgeneral economic downturns. Any inability to successfully collect our finance receivable portfolio and to resolveproblem accounts may adversely affect our cash flow, profitability and financial condition.
8
The use of estimates and assumptions in determining our allowance for losses may adversely affect ourprofitability
We examine current delinquencies, historical loss experience, the value of the underlying collateral andgeneral economic conditions in determining our allowance for losses. The use of estimates and assumptions in theaforementioned considerations is inherently subjective, and any changes in these assumptions or estimates maymaterially impact our allowance for losses, profitability and financial condition.
Currency and interest rate fluctuations, and our ability to hedge those transactions may adversely affect ourresults
We are affected by changes in foreign exchange rates and interest rates. Changes in foreign exchange rates mayadversely affect our income from international operations and the value realized on assets and liabilities denom-inated in non-functional currencies. Increases or decreases in interest rates may adversely affect interest marginsdue to variances between the interest rate profile of our receivable portfolio and our debt obligations. Thesevariances can be attributed to a combination of interest rate and currency basis differences, asset/liability durationdifferences, and the portion of our receivable portfolio funded by equity. Changes in our credit ratings may alsoadversely affect interest rates on future borrowings, which would impact our profitability.
In some instances, we enter into hedging instruments to mitigate fluctuations in foreign exchange rates andinterest rates. If our hedging instruments are ineffective, these risks may not be adequately mitigated. Our hedgingtransactions rely on assumptions regarding portfolio mix, portfolio duration, and currency exposures. Changes inthe assumptions supporting our hedging strategy may have a significant impact on our profitability, financialcondition, or results of operations.
Unanticipated changes in tax rates or exposure to additional income tax liabilities could affect ourprofitability
We are subject to income taxes in both the U.S. and various foreign jurisdictions, and our domestic andinternational tax liabilities are subject to the allocation of income among these different jurisdictions. Our effectivetax rates could be adversely affected by changes in the mix of earnings in countries with differing statutory tax rates,changes in the valuation of deferred tax assets and liabilities or changes in tax laws, which could affect ourprofitability. In particular, the carrying value of deferred tax assets is dependent on our ability to generate futuretaxable income. In addition, the amount of income taxes we pay is subject to audits in various jurisdictions, and amaterial assessment by a tax authority could affect our profitability.
An interruption of our information technology networks may limit our ability to conduct our regular opera-tions and react to sudden changes in market conditions, both of which could adversely impact our results
We are heavily reliant upon the flow of information across the enterprise to facilitate our normal day-to-dayoperations. This information flow is primarily governed by the continuous and uninterrupted dissemination of dataacross our information technology networks. The operational oversight of these networks is the responsibility of athird-party service provider, and any lapse or interruption in the systems’ operations could restrict the flow ofinformation. These interruptions could potentially result in our inability to adequately conduct our operations,including making necessary funds available to repay maturing debt, funding loan commitments to customers, andswiftly reacting to sudden changes in market conditions.
Changes in the regulatory environment in which we operate could have an adverse affect on our businessand earnings
We operate in the United States and certain other foreign markets, and we are subject to the supervision andregulation by governing bodies in those jurisdictions. Any noncompliance with the laws and regulations in thosejurisdictions could result in the suspension or revocation of any licenses we hold or registrations at issue, as well asthe imposition of civil or criminal penalties. Any inability to remain in compliance with applicable regulatoryrequirements could have a material adverse effect on our operations by limiting our access to capital, as well asnegatively impacting our public standing. Additionally, no assurance can be provided that laws and regulations that
9

are applicable to our current operations will not be amended or interpreted differently, that new laws and regulationswill not be passed which materially change our current business practices or operations, or that we will not beprohibited by state laws or certain other foreign laws from raising interest rates above certain desired levels, any ofwhich could adversely impact our business, financial condition or results of operations.
Item 1B. Unresolved Staff Comments
None.
Item 2. Properties
Textron Financial leases office space from a Textron affiliate for its corporate headquarters at 40 WestminsterStreet, Providence, Rhode Island 02903. The Company leases other offices throughout North America. Foradditional information regarding Textron Financial’s lease obligations, see Note 16 to the Consolidated FinancialStatements in Item 8 of this Form 10-K.
Item 3. Legal Proceedings
There are pending or threatened lawsuits and other proceedings against Textron Financial and its subsidiaries.Some of these suits and proceedings seek compensatory, treble or punitive damages in substantial amounts. Thesesuits and proceedings are being defended by, or contested on behalf of, Textron Financial and its subsidiaries. On thebasis of information presently available, Textron Financial believes any such liability would not have a materialeffect on Textron Financial’s financial position or results of operations.
Item 4. Submission of Matters to a Vote of Security Holders
Omitted per Instruction I of Form 10-K.
PART II.
Item 5. Market for Registrant’s Common Equity and Related Stockholder Matters
The common stock of Textron Financial is owned entirely by Textron and, therefore, there is no trading ofTextron Financial’s stock. Dividends of $144 million, $89 million and $109 million were declared and paid in 2007,2006 and 2005, respectively. For additional information regarding restrictions as to dividend availability, seeNote 10 to the Consolidated Financial Statements in Item 8 of this Form 10-K.
10

Item 6. Selected Financial Data
The following data has been recast to reflect discontinued operations and should be read in conjunction withTextron Financial’s Consolidated Financial Statements in Item 8 of this Form 10-K.
2007 2006 2005 2004 2003For the years ended(1)
(Dollars in millions)
Results of OperationsFinance charges. . . . . . . . . . . . . . . . . . . . . . . . . . . . . . $ 671 $ 652 $ 464 $ 369 $ 404Securitization gains . . . . . . . . . . . . . . . . . . . . . . . . . . . 62 42 49 56 43
Rental revenues on operating leases . . . . . . . . . . . . . . . 34 32 32 29 29
Other income . . . . . . . . . . . . . . . . . . . . . . . . . . . . . . . 108 72 83 91 96
Income from continuing operations before
income taxes . . . . . . . . . . . . . . . . . . . . . . . . . . . . . . 222 210 171 139 116
Net income . . . . . . . . . . . . . . . . . . . . . . . . . . . . . . . . . 145 152 111 94 80
Balance Sheet DataTotal finance receivables . . . . . . . . . . . . . . . . . . . . . . . $8,603 $8,310 $6,763 $5,837 $5,135
Allowance for losses on finance receivables . . . . . . . . . 89 93 96 99 119
Equipment on operating leases — net . . . . . . . . . . . . . . 259 238 231 237 210
Total assets . . . . . . . . . . . . . . . . . . . . . . . . . . . . . . . . . 9,383 9,000 7,441 6,738 6,333
Short-term debt . . . . . . . . . . . . . . . . . . . . . . . . . . . . . . 1,461 1,779 1,200 1,307 520
Long-term debt . . . . . . . . . . . . . . . . . . . . . . . . . . . . . . 5,850 5,083 4,220 3,476 3,887
Deferred income taxes . . . . . . . . . . . . . . . . . . . . . . . . . 472 497 461 453 390
Shareholder’s equity . . . . . . . . . . . . . . . . . . . . . . . . . . 1,138 1,142 1,050 1,035 1,009
Debt to tangible shareholder’s equity(2) . . . . . . . . . . . . 7.76x 7.10x 6.19x 5.53x 5.24x
SELECTED DATA AND RATIOSProfitabilityNet interest margin as a percentage of average net
investment(3) . . . . . . . . . . . . . . . . . . . . . . . . . . . . . . 5.66% 5.81% 6.40% 7.14% 6.92%
Return on average equity(4) . . . . . . . . . . . . . . . . . . . . . 13.28% 14.13% 11.17% 9.49% 7.86%
Return on average assets(5) . . . . . . . . . . . . . . . . . . . . . 1.60% 1.84% 1.58% 1.49% 1.25%
Selling and administrative expenses as a percentage ofaverage managed and serviced financereceivables(6) . . . . . . . . . . . . . . . . . . . . . . . . . . . . . 1.71% 1.84% 2.01% 2.01% 1.98%
Operating efficiency ratio(7) . . . . . . . . . . . . . . . . . . . . 44.6% 45.1% 48.8% 47.1% 46.8%
Credit Quality60+ days contractual delinquency as a percentage of
finance receivables(8) . . . . . . . . . . . . . . . . . . . . . . . 0.43% 0.77% 0.79% 1.47% 2.39%
Nonperforming assets as a percentage of financeassets(9) . . . . . . . . . . . . . . . . . . . . . . . . . . . . . . . . . 1.34% 1.28% 1.53% 2.18% 2.80%
Allowance for losses on finance receivables as apercentage of finance receivables . . . . . . . . . . . . . . . 1.03% 1.11% 1.43% 1.70% 2.32%
Allowance for losses on finance receivables as apercentage of nonaccrual finance receivables . . . . . . 111.7% 123.1% 108.6% 83.7% 78.4%
Net charge-offs as a percentage of average financereceivables. . . . . . . . . . . . . . . . . . . . . . . . . . . . . . . . 0.45% 0.38% 0.51% 1.48% 2.08%
Ratio of allowance for losses on finance receivables tonet charge-offs . . . . . . . . . . . . . . . . . . . . . . . . . . . . . 2.4x 3.2x 3.1x 1.3x 1.0x
11

(1) Textron Financial’s year-end dates conform with Textron’s year-end, which falls on the nearest Saturday toDecember 31.
(2) Tangible shareholder’s equity equals Shareholder’s equity, excluding Accumulated other comprehensiveincome (loss), less Goodwill.
(3) Represents revenues earned less interest expense on borrowings and operating lease depreciation as apercentage of average net investment. Average net investment includes finance receivables plus operatingleases, less deferred taxes on leveraged leases.
(4) Return on average equity excludes the cumulative effect of change in accounting principle.
(5) Return on average assets excludes the cumulative effect of change in accounting principle.
(6) Average managed and serviced finance receivables include owned receivables, receivables serviced undersecuritizations, participations and third-party portfolio servicing agreements.
(7) Operating efficiency ratio is selling and administrative expenses divided by net interest margin.
(8) Delinquency excludes any captive receivables with recourse to Textron. Captive receivables represent third-party finance receivables originated in connection with the sale or lease of Textron manufactured products.Percentages are expressed as a function of total Textron Financial independent and nonrecourse captivereceivables.
(9) Finance assets include: finance receivables; equipment on operating leases, net of accumulated depreciation;repossessed assets and properties; retained interests in securitizations; interest-only securities; investment inequipment residuals; Acquisition, Development and Construction arrangements; and short- and long-terminvestments (some of which are classified in Other assets on Textron Financial’s Consolidated Balance Sheets).Nonperforming assets include independent and nonrecourse captive finance assets.
Item 7. Management’s Discussion and Analysis of Financial Condition and Results of Operations
Overview
Textron Financial is in the business of originating and servicing commercial finance receivables for Textron-related products and other commercial markets. The principal factors that influence our earnings are the quantity,credit quality and mix of finance assets across product lines and industries, and fees earned related to these financeassets and services. For finance receivables, net interest margin equals the difference between revenue earned onfinance receivables, including fee income, and the cost of borrowed funds. For operating leases, net interest marginequals revenue earned on operating leases, less depreciation expense and the cost of borrowed funds. On certaintypes of finance receivables, interest rates earned are fixed at the time the contracts are originated, while other typesare based on floating-rates that are generally tied to changes in the prime rate offered by major banks or the LondonInterbank Offered Rate (“LIBOR”). Rental charges on operating leases may be fixed at the time the contracts areoriginated or based on floating-rates that are generally tied to changes in LIBOR.
Textron Financial borrows funds at various maturities at both fixed interest rates and floating interest rates,based primarily on LIBOR, to match the interest sensitivities and maturities of its finance receivables. Externalmarket conditions and our debt ratings affect these interest rates. We also may, from time to time, enter into interestrate exchange agreements related to new debt issuances in an effort to access the debt markets in the most efficientmanner available at the time of issuance. As an alternative source of funding, Textron Financial sells financereceivables in securitizations, retaining an interest in the sold receivables and continuing to service such receivablesfor a fee.
Our business performance is assessed on an owned, managed and a serviced basis. The owned basis includesonly the finance receivables owned and reported on the Consolidated Balance Sheet. The managed basis includesowned finance receivables and finance receivables sold in securitizations where we have retained credit risk to theextent of our subordinated interest. The serviced basis includes managed receivables and serviced-only receivables,which generally consist of finance receivables of resort developers and other third-party financial institutionswithout retained credit risk.
12
Textron Financial retains subordinated interests in finance receivables sold in securitizations resulting in creditrisk. As a result, we evaluate finance receivables and leverage on a managed as well as an owned basis. In contrast,we do not have a retained financial interest or credit risk in the performance of the serviced portfolio and, therefore,performance of these portfolios is limited to billing and collection activities.
Key Business Initiatives and Trends
During 2007, we generated significant growth in our managed finance receivable portfolio. Managed financereceivables grew by $882 million, or 9% driven primarily by growth in Aviation Finance ($509 million), and ResortFinance ($211 million). We expect continued growth at a moderate pace in 2008.
Portfolio quality statistics remained relatively stable with the previous two years; however, the collectibility ofour finance receivable portfolio remains one of our most significant business risks. Nonperforming assets as apercentage of total finance assets remained stable at 1.34% at December 29, 2007 from 1.28% at December 30,2006, and 60+ day delinquency as a percentage of finance receivables decreased to 0.43% at December 29, 2007from 0.77% at December 30, 2006. The continued strength of these portfolio quality indicators, combined with alow rate of loan losses resulted in an increase in loan loss provision of only $7 million compared with 2006, despitesignificant growth in the managed receivable portfolio. We expect relative stability in these statistics during 2008;however, recent economic trends could have a negative impact on the profitability of our customers and we couldexperience a resulting increase in delinquency and non-performing assets.
Net interest margin as a percentage of average net investment (“net interest margin percentage”) decreased to5.66% at year-end 2007 compared with 5.81% at year-end 2006. The decline is primarily attributable to the impactof competitive pressures on pricing and lower leveraged lease earnings due to an unfavorable cumulative earningsadjustment attributable to the recognition of residual value impairments and the adoption of new leveraged leaseaccounting literature, partially offset by an increase in other income and securitization gains.
The disruption in the credit market during the third and fourth quarters of 2007 had minimal impact on ourability to access the capital markets to refinance our maturing debt obligations and to fund growth in our financereceivable portfolio. However, this disruption in the credit markets did result in an increase in our borrowing costs.The increase in the spread between LIBOR, the primary index against which our variable-rate debt is priced, and theFederal Funds rate had an $11 million negative impact on borrowing spreads. This negative impact was almostcompletely mitigated by the impact of debt issuances during 2006 and the first half of 2007, which replacedmaturing debt issued during periods of relatively higher borrowing spreads. Due to the timing of the re-pricing ofmost of our variable-rate notes and interest rate exchange agreements which convert fixed-rate debt to variable-ratedebt, the increase in the spread between LIBOR and the Federal Funds rate will continue to have an impact on ourborrowing spreads during the first quarter of 2008. Further fluctuations in the spread between LIBOR and theFederal Funds rate could have an impact on our net interest margin.
Financial Condition
Liquidity and Capital Resources
Textron Financial mitigates liquidity risk (i.e., the risk that we will be unable to fund maturing liabilities or theorigination of new finance receivables) by developing and preserving reliable sources of capital. We use a variety offinancial resources to meet these capital needs. Cash is provided from finance receivable collections, sales andsecuritizations, as well as the issuance of commercial paper and term debt in the public and private markets. Thisdiversity of capital resources enhances our funding flexibility, limits dependence on any one source of funds, andresults in cost-effective funding. We also, on occasion, borrow available cash from Textron when it is in theeconomic interest of Textron Financial and Textron, collectively. In making particular funding decisions, man-agement considers market conditions, prevailing interest rates and credit spreads, and the maturity profile of itsassets and liabilities.
We have a policy of maintaining unused committed bank lines of credit in an amount not less than outstandingcommercial paper balances. Since Textron Financial is permitted to borrow under Textron’s multi-year facility,these lines of credit include both Textron Financial’s multi-year facility and Textron’s multi-year facility. These
13

facilities are in support of commercial paper and letters of credit issuances only, and neither of these lines of creditwas drawn at December 29, 2007 or December 30, 2006.
The Company’s committed credit facilities at December 29, 2007 were as follows:
Facility AmountCommercial Paper
Outstanding
Letters of CreditIssued under
Facility
Amount Not Reservedas Support for
Commercial Paperand Letters of
Credit(In millions)
Textron Financial multi-yearfacility expiring in 2012 . . . . . . $1,750 $1,447 $13 $ 290
Textron multi-year facilityexpiring in 2012 . . . . . . . . . . . . 1,250 — 22 1,228
Total . . . . . . . . . . . . . . . . . . . . . . $3,000 $1,447 $35 $1,518
Textron Financial and Textron Financial Canada Funding Corp. have a joint shelf registration statement withthe Securities and Exchange Commission enabling the issuance of an unlimited amount of public debt securities.During 2007, $1.4 billion of term debt and CAD 220 million of term debt were issued under this registrationstatement.
During the first quarter of 2007, Textron Financial also issued $300 million of 6% Fixed-to-Floating RateJunior Subordinated Notes, which are unsecured and rank junior to all of our existing and future senior debt. Thenotes mature in 2067; however, we have the right to redeem the notes at par beginning in 2017, and have aredemption obligation beginning in 2042.
The following table summarizes Textron Financial’s contractual payments and receipts as of December 29,2007, for the specified periods:
Less than1 year
1-2Years
2-3Years
3-4Years
4-5Years
More than5 years Total
Payments / Receipts Due by Period
(In millions)
Contractual payments:Commercial paper and other short-
term debt . . . . . . . . . . . . . . . . . . . . $1,461 $ — $ — $ — $ — $ — $1,461Term debt . . . . . . . . . . . . . . . . . . . . . 1,259 1,551 1,913 592 42 477 5,834Loan commitments . . . . . . . . . . . . . . 49 2 — 3 — — 54Operating lease rental payments . . . . . 6 5 4 4 1 2 22
Total contractual payments . . . . . . . 2,775 1,558 1,917 599 43 479 7,371
Cash and receipts:Finance receivable receipts . . . . . . . . 3,362 1,484 669 645 686 1,757 8,603Operating lease rental receipts . . . . . . 28 23 22 19 15 30 137
Total receipts . . . . . . . . . . . . . . . . . . 3,390 1,507 691 664 701 1,787 8,740Cash . . . . . . . . . . . . . . . . . . . . . . . . . 60 — — — — — 60
Total cash and receipts . . . . . . . . . . 3,450 1,507 691 664 701 1,787 8,800
Net cash and receipts (payments) . . . . $ 675 $ (51) $(1,226) $ 65 $658 $1,308 $1,429
Cumulative net cash and receipts . . . . $ 675 $ 624 $ (602) $(537) $121 $1,429
Finance receivable receipts related to finance leases and term loans are based on contractual cash flows whilereceipts related to revolving loans are based on historical cash flow experience. These amounts could differ due toprepayments, charge-offs and other factors. Receipts and contractual payments exclude finance charges fromreceivables, debt interest payments, proceeds from the sale of equipment on operating leases and other items.
14

At December 29, 2007, Textron Financial had unused commitments to fund new and existing customers under$1.6 billion of committed revolving lines of credit compared with $1.3 billion at December 30, 2006. These loancommitments generally have an original duration of less than three years. Since many of the agreements will not beused to the extent committed or will expire unused, the total commitment amount does not necessarily representfuture cash requirements.
Textron Financial’s credit ratings are as follows: Fitch Ratings (A- long-term, F2 short-term, outlook positive),Moody’s Investors Service (A3 long-term, P2 short-term, outlook stable) and Standard & Poor’s (A- long-term, A2short-term, outlook stable).
Cash provided by operating activities of continuing operations totaled $262 million in 2007, $338 million in2006 and $247 million in 2005. The decrease in the cash provided in 2007 was primarily due to the timing ofpayments of income taxes and accrued interest and other liabilities. The increase in the cash provided in 2006 wasprimarily due to an increase in income from continuing operations, an increase in deferred tax liabilities and thetiming of payments of accrued interest and other liabilities.
Cash used by investing activities of continuing operations totaled $281 million in 2007, $1,680 million in 2006and $950 million in 2005. The decrease in cash flows used in 2007 was largely the result of a $774 million decreasein finance receivable originations, net of collections as compared to 2006, a $481 million increase in proceeds fromreceivable sales and the impact of cash used for an acquisition in 2006. The increase in proceeds from receivablesales is primarily attributable to the sale of $588 million receivables into the Distribution Finance revolvingsecuritization in the first quarter. The increase in cash flows used in 2006 was largely the result of increased growthin the finance receivable portfolio ($655 million), as compared with 2005, partially offset by an increase in proceedsfrom receivable sales ($130 million), which were generated primarily by sales of participating interests in loans theCompany originated and continues to service.
Cash provided by financing activities of continuing operations totaled $29 million in 2007, $1,391 million in2006 and $587 million in 2005. The decrease in cash flows in 2007 primarily reflects a reduction in the rate ofmanaged receivable growth as compared to 2006 and an increase in the use of sales of receivables, includingsecuritizations to fund asset growth. The increase in cash flows during 2006 principally reflects an increase in debtoutstanding to fund asset growth.
Net cash used by discontinued operations in 2006 reflects cash reimbursements related to a loss sharingagreement entered into as part of the small business finance sale in 2003. This agreement was terminated in 2006.
Because the finance business involves the purchase and carrying of receivables, a relatively high ratio ofborrowings to net worth is customary. Debt as a percentage of total capitalization was 86% at both December 29,2007 and December 30, 2006. Our ratio of earnings to fixed charges was 1.56x in 2007, 1.59x in 2006 and 1.77x in2005. Commercial paper and Other short-term debt as a percentage of total debt was 20% at December 29, 2007,compared with 26% at December 30, 2006.
In 2007, Textron Financial declared and paid $144 million of dividends to Textron, compared with $89 millionof dividends declared and paid in 2006. The payment of these dividends represents the distribution of retainedearnings to achieve our targeted leverage ratio. Textron contributed capital of $9 million to Textron Financial in2007 compared with $27 million in 2006. The 2007 contribution consisted of Textron’s dividend on the preferredstock of Textron Funding Corporation. The 2006 contribution consisted of $18 million to support the acquisition ofa company with $164 million of finance receivables in the Distribution Finance segment and $9 million consisted ofTextron’s dividend on the preferred stock of Textron Funding Corporation.
Off-Balance Sheet Arrangements
Textron Financial primarily sells finance receivables utilizing asset-backed securitization structures. As aresult of these transactions, finance receivables are removed from the balance sheet, and the proceeds received areused to reduce recorded debt levels. Despite the reduction in the recorded balance sheet position, we generally retaina subordinated interest in the finance receivables sold through securitizations, which may affect operating resultsthrough periodic fair value adjustments.
15

Textron Financial utilizes off-balance sheet financing arrangements to further diversify funding alternativesand termination of these arrangements would reduce our short-term funding alternatives, which could result inincreased funding costs for our managed finance receivable portfolio. While these arrangements do not containprovisions that require Textron Financial to repurchase significant amounts of receivables previously sold, there arerisks that could reduce the availability of these funding alternatives in the future. Potential barriers to the continueduse of these off-balance sheet arrangements include deterioration in finance receivable portfolio quality, down-grades in our debt credit ratings, and a reduction of new finance receivable originations in the businesses that utilizethese funding arrangements. We do not expect any of these factors to have a material impact on the Company’sliquidity or income from operations and if we were required to consolidate these arrangements, it would have noimpact on the Company’s existing debt covenants.
As of December 29, 2007 we have two significant off-balance sheet financing arrangements. The DistributionFinance revolving securitization trust is a master trust which purchases inventory finance receivables from theCompany and issues asset-backed notes to investors. These receivables typically have short durations, which resultsin significant collections of previously purchased receivables and significant additional purchases of replacementreceivables from the Company on a monthly basis. Proceeds from securitizations in the table below include amountsreceived related to the issuance of additional asset-backed notes to investors, and exclude amounts received relatedto the ongoing replenishment of the outstanding sold balance of these short-duration receivables. As of Decem-ber 29, 2007 the $2.0 billion outstanding notes issued by the trust are comprised of three separate series of one-month LIBOR-based variable-rate notes with a three year term. The Company has retained $132 million of thesenotes. $802 million, $642 million and $588 million of these notes mature in May 2008, 2009 and 2010, respectively.The amount of pre-tax gains recorded upon the ongoing sale of receivables in this arrangement by the Company isimpacted by the pricing of the investor notes issued by the trust. Therefore, an increase in the pricing of investornotes issued upon the maturity of the existing notes could have a negative impact on the gains recognized by theCompany related to future sales of receivables.
Distribution Finance
2007 2006 2005(In millions)
Net pre-tax gains . . . . . . . . . . . . . . . . . . . . . . . . . . . . . . . . . . . . . . . . . . . . . . . . . . . . . $ 58 $42 $40
Proceeds from securitizations . . . . . . . . . . . . . . . . . . . . . . . . . . . . . . . . . . . . . . . . . . . . $549 $50 $80
Cash flows received on retained interests . . . . . . . . . . . . . . . . . . . . . . . . . . . . . . . . . . . . 54 42 40
The Aviation Finance securitization trust purchases finance leases and installment contracts secured by generalaviation aircraft from the Company. The trust is funded through a commercial paper conduit commitment of a$600 million revolving credit facility which expires in December 2008. As of December 31, 2007, $433 million wasoutstanding under this facility. Under the terms of the funding commitment, the trust pays interest based on the dailyaverage commercial paper rate experienced by the conduit. This rate is not directly tied to an interest rate index andfluctuates based on market conditions. The receivables owned by the trust either earn interest based on LIBOR orearn interest based on a fixed-rate and the earnings are converted into a variable-rate based on LIBOR through thetrust’s use of interest rate exchange agreements. Based on this relationship between the earnings on the assets ownedby the trust and the interest paid to the commercial paper conduit, increases in the commercial paper conduit’sborrowing spreads as compared to LIBOR can result in a decrease in the value of the trust’s cash flows. The creditmarket disruption which occurred during the third and fourth quarters of 2007 did not result in any disruption to thecommercial paper conduit’s funding of the trust. However, the trust did experience an increase in borrowingspreads. An additional or continued increase in these borrowing spreads could result in an impairment to ourretained interests in the trust and/or reduce the amount of gain recognized upon future sales of assets to the trust.
16
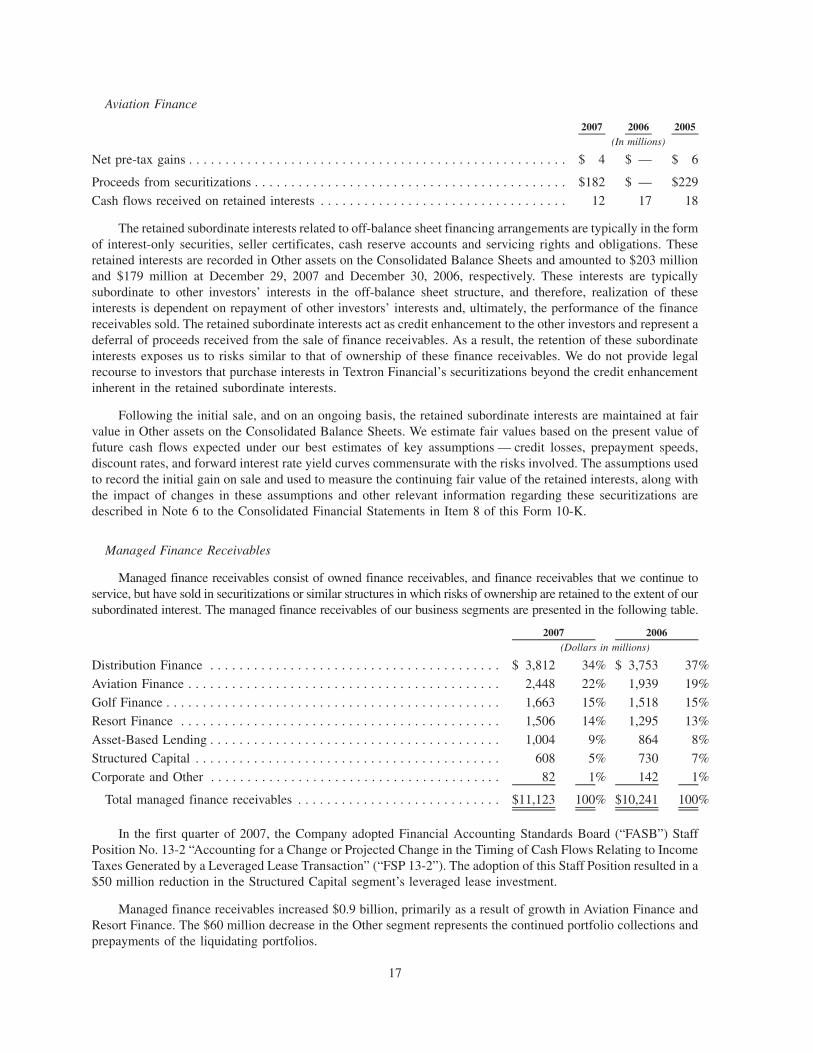
Aviation Finance
2007 2006 2005(In millions)
Net pre-tax gains . . . . . . . . . . . . . . . . . . . . . . . . . . . . . . . . . . . . . . . . . . . . . . . . . . . . $ 4 $ — $ 6
Proceeds from securitizations . . . . . . . . . . . . . . . . . . . . . . . . . . . . . . . . . . . . . . . . . . . $182 $ — $229
Cash flows received on retained interests . . . . . . . . . . . . . . . . . . . . . . . . . . . . . . . . . . 12 17 18
The retained subordinate interests related to off-balance sheet financing arrangements are typically in the formof interest-only securities, seller certificates, cash reserve accounts and servicing rights and obligations. Theseretained interests are recorded in Other assets on the Consolidated Balance Sheets and amounted to $203 millionand $179 million at December 29, 2007 and December 30, 2006, respectively. These interests are typicallysubordinate to other investors’ interests in the off-balance sheet structure, and therefore, realization of theseinterests is dependent on repayment of other investors’ interests and, ultimately, the performance of the financereceivables sold. The retained subordinate interests act as credit enhancement to the other investors and represent adeferral of proceeds received from the sale of finance receivables. As a result, the retention of these subordinateinterests exposes us to risks similar to that of ownership of these finance receivables. We do not provide legalrecourse to investors that purchase interests in Textron Financial’s securitizations beyond the credit enhancementinherent in the retained subordinate interests.
Following the initial sale, and on an ongoing basis, the retained subordinate interests are maintained at fairvalue in Other assets on the Consolidated Balance Sheets. We estimate fair values based on the present value offuture cash flows expected under our best estimates of key assumptions — credit losses, prepayment speeds,discount rates, and forward interest rate yield curves commensurate with the risks involved. The assumptions usedto record the initial gain on sale and used to measure the continuing fair value of the retained interests, along withthe impact of changes in these assumptions and other relevant information regarding these securitizations aredescribed in Note 6 to the Consolidated Financial Statements in Item 8 of this Form 10-K.
Managed Finance Receivables
Managed finance receivables consist of owned finance receivables, and finance receivables that we continue toservice, but have sold in securitizations or similar structures in which risks of ownership are retained to the extent of oursubordinated interest. The managed finance receivables of our business segments are presented in the following table.
2007 2006(Dollars in millions)
Distribution Finance . . . . . . . . . . . . . . . . . . . . . . . . . . . . . . . . . . . . . . . . $ 3,812 34% $ 3,753 37%
Aviation Finance . . . . . . . . . . . . . . . . . . . . . . . . . . . . . . . . . . . . . . . . . . . 2,448 22% 1,939 19%
Golf Finance . . . . . . . . . . . . . . . . . . . . . . . . . . . . . . . . . . . . . . . . . . . . . . 1,663 15% 1,518 15%
Resort Finance . . . . . . . . . . . . . . . . . . . . . . . . . . . . . . . . . . . . . . . . . . . . 1,506 14% 1,295 13%
Asset-Based Lending . . . . . . . . . . . . . . . . . . . . . . . . . . . . . . . . . . . . . . . . 1,004 9% 864 8%
Structured Capital . . . . . . . . . . . . . . . . . . . . . . . . . . . . . . . . . . . . . . . . . . 608 5% 730 7%
Corporate and Other . . . . . . . . . . . . . . . . . . . . . . . . . . . . . . . . . . . . . . . . 82 1% 142 1%
Total managed finance receivables . . . . . . . . . . . . . . . . . . . . . . . . . . . . $11,123 100% $10,241 100%
In the first quarter of 2007, the Company adopted Financial Accounting Standards Board (“FASB”) StaffPosition No. 13-2 “Accounting for a Change or Projected Change in the Timing of Cash Flows Relating to IncomeTaxes Generated by a Leveraged Lease Transaction” (“FSP 13-2”). The adoption of this Staff Position resulted in a$50 million reduction in the Structured Capital segment’s leveraged lease investment.
Managed finance receivables increased $0.9 billion, primarily as a result of growth in Aviation Finance andResort Finance. The $60 million decrease in the Other segment represents the continued portfolio collections andprepayments of the liquidating portfolios.
17

Nonperforming Assets
Nonperforming assets include nonaccrual finance receivables and repossessed assets. We classify receivablesas nonaccrual and suspend the recognition of earnings when accounts are contractually delinquent by more thanthree months, unless collection of principal and interest is not doubtful. In addition, earlier suspension may occur ifwe have significant doubt about the ability of the obligor to meet current contractual terms. Doubt may be created bypayment delinquency, reduction in the obligor’s cash flows, deterioration in the loan to collateral value relationshipor other relevant considerations.
The following table sets forth certain information about nonperforming assets and the related percentages ofeach business segment’s owned finance assets.
2007 2006 2005(Dollars in millions)
Asset-Based Lending . . . . . . . . . . . . . . . . . . . . . . . . . . . . $ 23 2.31% $ 16 1.81% $ 6 0.81%
Distribution Finance . . . . . . . . . . . . . . . . . . . . . . . . . . . . . 23 1.20% 7 0.28% 2 0.11%
Golf Finance. . . . . . . . . . . . . . . . . . . . . . . . . . . . . . . . . . . 21 1.24% 29 1.89% 13 0.99%
Aviation Finance . . . . . . . . . . . . . . . . . . . . . . . . . . . . . . . . 20 0.89% 12 0.70% 14 1.07%
Resort Finance . . . . . . . . . . . . . . . . . . . . . . . . . . . . . . . . . 9 0.57% 16 1.22% 31 2.67%
Corporate and Other . . . . . . . . . . . . . . . . . . . . . . . . . . . . . 27 24.73% 33 19.74% 45 13.64%
Total nonperforming assets . . . . . . . . . . . . . . . . . . . . . . $123 1.34% $113 1.28% $111 1.53%
We believe that nonperforming assets generally will be in the range of 1% to 4% of finance assets depending oneconomic conditions. Nonperforming assets as a percentage of finance assets has remained stable near the low endof this range during the last three years as increases in certain segments have been offset by decreases in othersegments. The increase in nonperforming assets as a percentage of owned finance assets for Asset-Based Lendingand Distribution Finance compared to 2006 relate to weakening U.S. economic conditions, which began to have anegative impact on borrowers in certain industries. The Corporate and Other segment continues to comprise adisproportionate amount of nonperforming assets, accounting for 22% of total nonperforming assets whilecomprising less than 2% of total finance assets at December 29, 2007.
Textron Financial has a performance guarantee from Textron for leases with the U.S. and Canadian subsid-iaries of Collins & Aikman Corporation (“C&A”). In 2005, C&A filed for bankruptcy protection and the lease termsexpired. During the fourth quarter of 2007, C&A ceased making lease payments and under its performanceguarantee, Textron made a $20 million payment to the Company, which was utilized to reduce the outstandingbalance. The outstanding balance on these leases totaled $23 million at the end of 2007 and $61 million at the end of2006. The Company expects to collect the $23 million outstanding balance through sales of both repossessedcollateral and real estate, the appraised value of which approximates the outstanding balance. We have not classifiedthese leases as nonaccrual due to the performance guarantee from Textron.
Interest Rate Sensitivity
Textron Financial’s mix of fixed and floating-rate debt is continuously monitored by management and isadjusted, as necessary, based on evaluations of internal and external factors. Management’s strategy of matchingfloating-rate assets with floating-rate liabilities limits Textron Financial’s risk to changes in interest rates. Thisstrategy includes the use of interest rate exchange agreements. At December 29, 2007, floating-rate liabilities inexcess of floating-rate assets were $51 million, net of $2.3 billion of interest rate exchange agreements, whicheffectively converted fixed-rate debt to a floating-rate equivalent.
We believe that our asset/liability management policy provides adequate protection against interest rate risks.Increases in interest rates, however, could have an adverse effect on our interest margin percentage. Variable-ratefinance receivables are generally tied to changes in the prime rate offered by major U.S. and Canadian banks andvariable-rate debt is generally tied to changes in LIBOR. As a consequence, changes in short-term borrowing costsdo not always coincide with changes in variable-rate receivable yields. We do not hedge this basis risk between
18

different variable-rate indices, as we believe the cost is disproportionately high in comparison to the magnitude ofthe risk over long periods of time.
We assess our exposure to interest rate changes using an analysis that measures the potential loss in net income,over a twelve-month period, resulting from a hypothetical change in interest rates of 100 basis points across allmaturities occurring at the outset of the measurement period (sometimes referred to as a “shock test”). The analysisalso assumes that prospective receivable additions will be match-funded, existing portfolios will not prepay andcontractual maturities of both debt and assets will result in issuances or reductions of commercial paper. This shocktest model, when applied to our asset and liability position at December 29, 2007, indicates that an increase ininterest rates of 100 basis points would not have a significant impact on net income or cash flows for the followingtwelve-month period.
Financial Risk Management
Textron Financial’s results are affected by changes in U.S. and, to a lesser extent, foreign interest rates. As partof managing this risk, we enter into interest rate exchange agreements. The objective of entering into suchagreements is not to speculate for profit, but generally to convert variable-rate debt into fixed-rate debt and viceversa. The overall objective of our interest rate risk management is to achieve match-funding objectives. Theseagreements do not involve a high degree of complexity or risk. The fair values of interest rate exchange agreementsare recorded in either Other assets or Accrued interest and other liabilities on the Consolidated Balance Sheets. Wedo not trade in interest rate exchange agreements or enter into leveraged interest rate exchange agreements. The neteffect of the interest rate exchange agreements designated as hedges of debt increased interest expense by$25 million in 2007 and $27 million in 2006, respectively, and decreased interest expense by $11 million in 2005.
We manage our foreign currency exposure by funding most foreign currency denominated assets withliabilities in the same currency. We may enter into foreign currency exchange agreements to convert foreigncurrency denominated assets, liabilities and cash flows into functional currency denominated assets, liabilities andcash flows. In addition, as part of managing our foreign currency exposure, we may enter into foreign currencyforward exchange contracts. The objective of such agreements is to manage any remaining foreign currencyexposures to changes in currency rates. The fair values of these agreements are recorded in either Other assets orAccrued interest and other liabilities on the Company’s Consolidated Balance Sheets. As we hedge all substantialnon-functional currency exposures within each of our subsidiaries, likely future changes in foreign currency rateswould not have a significant impact on each subsidiary’s functional currency earnings. We do not hedge theearnings of our Canadian subsidiaries as we plan to continue investing these earnings in Canada for the foreseeablefuture. As a result, changes in the currency exchange rate between the Canadian dollar and the U.S. dollar couldimpact our consolidated earnings.
Critical Accounting Policies
Allowance for Losses on Finance Receivables
We evaluate our allowance for losses on finance receivables based on a combination of factors. Forhomogeneous loan pools, we examine current delinquencies, the characteristics of the existing accounts, historicalloss experience, the value of the underlying collateral and general economic conditions and trends. We estimatelosses will range from 0.3% to 6.0% of finance receivables depending on the specific homogeneous loan pool. Forlarger balance commercial loans, we also consider borrower specific information, industry trends and estimateddiscounted cash flows are considered, as well as the factors described above for homogeneous loan pools.
Provision for losses on finance receivables are charged to income, in amounts sufficient to maintain theallowance for losses on finance receivables at a level considered adequate to cover losses inherent in the ownedfinance receivable portfolio, based on management’s evaluation and analysis of this portfolio. While managementbelieves that its consideration of the factors and assumptions referred to above results in an accurate evaluation ofexisting losses in the portfolio based on prior trends and experience, changes in the assumptions or trends withinreasonable historical volatility may have a material impact on our allowance for losses. The allowance for losses onfinance receivables currently represents 1.03% of total finance receivables. During the last five years, net charge-offs as a percentage of finance receivables have ranged from 0.38% to 2.08%.
19

Goodwill
We evaluate the recoverability of goodwill annually in the fourth quarter, or more frequently if events orchanges in circumstances, such as declines in interest margin or cash flows or material adverse changes in thebusiness climate, indicate that the carrying value might be impaired. The annual impairment test was completed inthe fourth quarter of 2007 using the estimates from our long-term strategic plan. No adjustment was required to thecarrying value of goodwill based on the analysis performed.
Goodwill is considered to be impaired when the net book value of a reporting unit exceeds its estimated fairvalue. Fair values are primarily established using a discounted cash flow methodology. The determination ofdiscounted cash flows is based on an extrapolation of the businesses’ multi-year strategic business plans. Theassumptions relative to interest margin, operating expenses and provision for losses included in the plans aremanagement’s best estimates based on current and forecasted market conditions.
A compounded annual growth rate assumption of 5% was used in 2007 to estimate cash flows beyond themulti-year business plan period. Other significant assumptions utilized were an estimated cash flow discount rate of11% and an effective tax rate of 37%. If different assumptions were used in these plans, the related cash flows usedin measuring impairment could be different, potentially resulting in an impairment charge. These assumptionsinvolve significant levels of judgment; however, a 10% adverse change in any one, or a combination of these factorswould not have resulted in an impairment charge. Management believes that while future growth, discount rates andtax rates have the potential to change with evolving market conditions, no significant, imminent changes in theseassumptions are likely.
Securitized Transactions
Securitized transactions involve the sale of finance receivables to qualified special purpose trusts. We mayretain an interest in the assets sold in the form of interest-only securities, seller certificates, cash reserve accountsand servicing rights and obligations. At the time of sale, a gain or loss is recorded based on the difference betweenthe proceeds received and the allocated carrying value of the finance receivables sold. The allocated carrying valueis determined based on the relative fair values of the finance receivables sold and the interests retained. As such, thefair value estimate of the retained interests has a direct impact on the gain or loss recorded. We estimate fair valuebased on the present value of future cash flows expected under management’s best estimates of key assumptions —credit losses, prepayment speeds, discount rates, and forward interest rate yield curves commensurate with the risksinvolved. Retained interests are recorded at fair value as a component of Other assets on the Consolidated BalanceSheets.
We review the fair values of the retained interests quarterly using updated assumptions and compare suchamounts with the carrying value of the retained interests. When the carrying value exceeds the fair value of theretained interests, we determine whether the decline in fair value is other than temporary. When we determine thevalue of the decline is other than temporary, we write down the retained interests to fair value with a correspondingcharge to income. When a change in fair value of the retained interests is deemed temporary, we record acorresponding credit or charge to Other comprehensive income for any unrealized gains or losses. Refer to Note 6 tothe Consolidated Financial Statements in Item 8 of this Form 10-K for a summary of key assumptions used to recordinitial gains related to the sale of finance receivables through securitizations and to measure the current fair value ofthe retained interests, along with the sensitivity of the fair values to adverse changes in these assumptions.
Income Taxes
Deferred tax assets and liabilities are determined based on temporary differences between the financialreporting and tax bases of assets and liabilities, applying enacted tax rates expected to be in effect for the year inwhich we expect the differences will reverse or settle. Based on the evaluation of available evidence, we recognizefuture tax benefits, such as net operating loss carryforwards, to the extent that it is more likely than not that we willrealize these benefits. We periodically assess the likelihood that we will be able to recover our deferred tax assetsand reflect any changes in our estimates in the valuation allowance, with a corresponding adjustment to earnings orother comprehensive income (loss), as appropriate.
20

In assessing the need for a valuation allowance, we look to the future reversal of existing taxable temporarydifferences, taxable income in carryback years, the feasibility of tax planning strategies and estimated future taxableincome. The valuation allowance can be affected by changes to tax laws, changes to statutory tax rates and changesto future taxable income estimates.
The amount of income taxes we pay is subject to ongoing audits by federal, state and foreign tax authorities.We assess our income tax positions and record tax benefits for all years subject to examination based uponmanagement’s evaluation of the facts, circumstances, and information available at the reporting date. For those taxpositions for which it is more likely than not that a tax benefit will be sustained, we record an estimate of the amountof tax benefit that has a greater than 50 percent likelihood of being realized upon settlement with a taxing authoritythat has full knowledge of all relevant information. For those income tax positions for which it is not more likelythan not that a tax benefit will be sustained, no tax benefit has been recognized in the financial statements. Whereapplicable, associated interest has also been recognized. As future results may include favorable or unfavorableadjustments to our estimates due to closure of income tax examinations, new regulatory or judicial pronouncements,or other relevant events, our effective tax rate may fluctuate significantly on a quarterly and annual basis.
Results of Operations
Revenues and Net Interest Margin
A comparison of revenues and net interest margin is set forth in the following table.
2007 2006 2005(Dollars in millions)
Finance charges . . . . . . . . . . . . . . . . . . . . . . . . . . . . . . . . . . . . . . . . . . . . . . . . . . . $ 671 $ 652 $ 464
Securitization gains . . . . . . . . . . . . . . . . . . . . . . . . . . . . . . . . . . . . . . . . . . . . . . . . . 62 42 49
Rental revenues on operating leases . . . . . . . . . . . . . . . . . . . . . . . . . . . . . . . . . . . . . 34 32 32
Other income . . . . . . . . . . . . . . . . . . . . . . . . . . . . . . . . . . . . . . . . . . . . . . . . . . . . . 108 72 83
Total revenues . . . . . . . . . . . . . . . . . . . . . . . . . . . . . . . . . . . . . . . . . . . . . . . . . . . $ 875 $ 798 $ 628
Interest expense . . . . . . . . . . . . . . . . . . . . . . . . . . . . . . . . . . . . . . . . . . . . . . . . . . . 397 351 218
Depreciation of equipment on operating leases . . . . . . . . . . . . . . . . . . . . . . . . . . . . . 18 17 19
Net interest margin . . . . . . . . . . . . . . . . . . . . . . . . . . . . . . . . . . . . . . . . . . . . . . . $ 460 $ 430 $ 391
Portfolio yield . . . . . . . . . . . . . . . . . . . . . . . . . . . . . . . . . . . . . . . . . . . . . . . . . . . . . 8.51% 9.11% 7.91%
Net interest margin as a percentage of average net investment . . . . . . . . . . . . . . . . . 5.66% 5.81% 6.40%
2007 vs. 2006
The increase in finance charges of $19 million compared with 2006 reflects earnings on $722 million of higheraverage finance receivables ($66 million), partially offset by a decrease in portfolio yields related to competitivepricing pressures ($17 million) and lower leveraged lease earnings. The reduction in leveraged lease earnings isprimarily due to an unfavorable cumulative earnings adjustment attributable to the recognition of residual valueimpairments ($13 million), a reduction in leveraged lease earnings resulting from the adoption of FSP 13-2($8 million) and the recognition of earnings associated with the sale of an option related to a leveraged lease asset in2006 ($7 million). The increase in average finance receivables was primarily due to growth in Aviation Finance($512 million) and Resort Finance ($224 million).
Securitization gains increased $20 million compared with 2006, primarily attributable to a $588 millionincremental increase in the level of receivables sold into the Distribution Finance revolving securitization in the firstquarter of 2007. The $36 million increase in other income included a $21 million gain on the sale of a leveragedlease investment and a $7 million increase in servicing fee income associated with an increase in securitized financereceivables.
Net interest margin increased $30 million compared with 2006, but decreased as a percentage of average netinvestment (0.15%). The decrease in net interest margin percentage principally reflects the impact of competitive
21

pressures on pricing and lower leveraged lease earnings, partially offset by the increase in other income andsecuritization gains. The increase in dollars principally reflects the interest margin earned on growth in averagefinance receivables ($30 million).
The Company experienced a disruption in the credit markets during the third and fourth quarters of 2007,which resulted in an increase in the spread between LIBOR, the primary index against which our variable-rate debtis priced, and the Federal Funds rate. This had an $11 million negative effect on borrowing rates as compared to2006. Despite this disruption, we only experienced a $2 million increase in borrowing rates on debt as compared to2006. The negative impact of the credit market disruption was almost completely mitigated by the impact of debtissuances during 2006 and the first half of 2007, which replaced maturing debt issued during periods of relativelyhigher borrowing spreads.
2006 vs. 2005
The increase in finance charges of $188 million compared with 2005 principally reflected earnings on$1,339 million of higher average finance receivables ($103 million) and a higher interest rate environment($90 million). The increase in average finance receivables was largely due to growth in Distribution Finance($736 million), Golf Finance ($308 million), and Aviation Finance ($242 million). The decrease in other incomeprimarily reflects lower residual gains, impairment charges recognized on a leveraged lease residual in StructuredCapital, and lower fee income.
Net interest margin increased $39 million compared with 2005, but decreased as a percentage of average netinvestment (0.59%). The increase in dollars principally reflects growth in average finance receivables ($54 million),partially offset by a decrease in securitization and other income ($18 million). Interest expense increased$133 million reflecting higher average debt levels of $1,092 million to fund receivable growth ($47 million)and a higher interest rate environment ($101 million), partially offset by improved credit spreads resulting from thematurity and replacement of debt issued during periods of relatively lower market liquidity. Net interest marginpercentage decreased primarily due to a lower proportion of other income and securitization gains to total revenue.
Selling and Administrative Expenses
2007 2006 2005(Dollars in millions)
Selling and administrative expenses . . . . . . . . . . . . . . . . . . . . . . . . . . . . . . . . . . . . . $ 205 $ 194 $ 191
Selling and administrative expenses as a percentage of average managed andserviced finance receivables . . . . . . . . . . . . . . . . . . . . . . . . . . . . . . . . . . . . . . . . . 1.71% 1.84% 2.01%
Operating efficiency ratio . . . . . . . . . . . . . . . . . . . . . . . . . . . . . . . . . . . . . . . . . . . . 44.6% 45.1% 48.8%
2007 vs. 2006
Selling and administrative expenses increased $11 million in 2007 compared with 2006 primarily reflectinghigher information technology and telecommunications expense ($5 million) and higher employee compensationand benefits expense ($3 million). The improvements in selling and administrative expenses as a percentage ofaverage managed and serviced finance receivables continue to reflect the use of process improvement initiatives toenable growth in the receivable portfolio without significant growth in staffing levels.
2006 vs. 2005
Selling and administrative expenses increased $3 million in 2006 compared with 2005 primarily reflectinghigher employee compensation and benefits expense ($8 million) as a result of portfolio receivable growth andincreased performance-based compensation tied to the Company’s improved profitability, partially offset by lowerdepreciation expense ($4 million). The improvements in selling and administrative expenses as a percentage ofaverage managed and serviced finance receivables and in the operating efficiency ratio reflected continued processimprovement initiatives, which have enabled growth in the receivable portfolio without significant growth instaffing levels.
22

Provision for Losses
Allowance for losses on finance receivables is presented in the following table.
2007 2006 2005(Dollars in millions)
Allowance for losses on finance receivables beginning of period . . . . . . . . . . . . . $ 93 $ 96 $ 99
Provision for losses . . . . . . . . . . . . . . . . . . . . . . . . . . . . . . . . . . . . . . . . . . . . . . 33 26 29
Less net charge-offs:
Distribution Finance . . . . . . . . . . . . . . . . . . . . . . . . . . . . . . . . . . . . . . . . . . . . 19 6 10
Asset-Based Lending . . . . . . . . . . . . . . . . . . . . . . . . . . . . . . . . . . . . . . . . . . . 7 7 —
Golf Finance . . . . . . . . . . . . . . . . . . . . . . . . . . . . . . . . . . . . . . . . . . . . . . . . . 3 1 3
Aviation Finance . . . . . . . . . . . . . . . . . . . . . . . . . . . . . . . . . . . . . . . . . . . . . . 2 2 2
Resort Finance . . . . . . . . . . . . . . . . . . . . . . . . . . . . . . . . . . . . . . . . . . . . . . . . (2) 7 10
Corporate and Other . . . . . . . . . . . . . . . . . . . . . . . . . . . . . . . . . . . . . . . . . . . . 8 6 7
Total net charge-offs . . . . . . . . . . . . . . . . . . . . . . . . . . . . . . . . . . . . . . . . . . . . . 37 29 32
Allowance for losses on finance receivables end of period . . . . . . . . . . . . . . . . . $ 89 $ 93 $ 96
Net charge-offs as a percentage of average finance receivables . . . . . . . . . . . . . . 0.45% 0.38% 0.51%
Allowance for losses on finance receivables as a percentage of total financereceivables . . . . . . . . . . . . . . . . . . . . . . . . . . . . . . . . . . . . . . . . . . . . . . . . . . . 1.03% 1.11% 1.43%
Allowance for losses on finance receivables as a percentage of nonaccrualfinance receivables . . . . . . . . . . . . . . . . . . . . . . . . . . . . . . . . . . . . . . . . . . . . . 111.7% 123.1% 108.6%
2007 vs. 2006
Provision for losses increased $7 million primarily reflecting an increase in both nonperforming assets and netcharge-offs in the Distribution Finance portfolio. The decrease in the allowance for losses reflects sustainedimprovements in portfolio credit quality statistics and a reduction in reserves established related to specific non-homogeneous loans ($2 million). During 2007, we charged-off $8 million of loans related to which specific reserveshad been established at December 30, 2006. This contributed to the decrease in reserves related to specific loans andthe increase in net charge-offs as compared to 2006.
Although management believes it has made adequate provision for anticipated losses on finance receivables,realization of these amounts remain subject to uncertainties. Subsequent evaluations of portfolio quality, in light offactors then prevailing, including economic conditions, may require additional increases or decreases in theallowance for losses on finance receivables.
2006 vs. 2005
Provision for losses decreased $3 million reflecting sustained improvement in portfolio quality. Thesesustained improvements resulted in a reduction of the rate utilized to establish the allowance for losses in severalof our portfolios. The change in loss rates utilized accounted for a $7 million reduction in provision for losses during2006. The decrease in net charge-offs of $3 million principally reflects improvements in Distribution Finance($4 million), Resort Finance ($3 million) and Golf Finance ($2 million), partially offset by an increase in Asset-Based Lending ($7 million).
23

Income Taxes
A reconciliation of the federal statutory income tax rate to the effective income tax rate is provided below:
2007 2006 2005
Federal statutory income tax rate . . . . . . . . . . . . . . . . . . . . . . . . . . . . . . . . . . . . . . . . . 35.0% 35.0% 35.0%
Increase (decrease) in taxes resulting from:
State income taxes . . . . . . . . . . . . . . . . . . . . . . . . . . . . . . . . . . . . . . . . . . . . . . . . . . 1.9 1.0 1.3
Tax exempt interest . . . . . . . . . . . . . . . . . . . . . . . . . . . . . . . . . . . . . . . . . . . . . . . . . . (0.2) (0.2) (1.1)
Foreign tax rate differential . . . . . . . . . . . . . . . . . . . . . . . . . . . . . . . . . . . . . . . . . . . . (3.3) (4.0) (2.7)Canadian dollar functional currency . . . . . . . . . . . . . . . . . . . . . . . . . . . . . . . . . . . . . . (1.0) (5.5) —
Change in state valuation allowance . . . . . . . . . . . . . . . . . . . . . . . . . . . . . . . . . . . . . 0.3 1.6 1.1
Interest on tax contingencies — leveraged leases . . . . . . . . . . . . . . . . . . . . . . . . . . . . 3.1 2.7 1.1
Tax credits . . . . . . . . . . . . . . . . . . . . . . . . . . . . . . . . . . . . . . . . . . . . . . . . . . . . . . . . (1.1) (2.1) (0.8)
Other, net . . . . . . . . . . . . . . . . . . . . . . . . . . . . . . . . . . . . . . . . . . . . . . . . . . . . . . . . . 0.2 (1.2) (0.3)
Effective income tax rate . . . . . . . . . . . . . . . . . . . . . . . . . . . . . . . . . . . . . . . . . . . . . . . 34.9% 27.3% 33.6%
The effective tax rate increased to 34.9% in 2007 from 27.3% in 2006 and 33.6% in 2005. The increase in 2007is primarily attributable to a benefit derived from the adoption of the Canadian dollar as the functional currency forU.S. tax purposes of one of the Company’s wholly-owned Canadian subsidiaries in 2006 and a decrease in taxcredits in 2007, partially offset by a larger increase in the state valuation allowance in 2006.
The lower tax rate in 2006, as compared to 2005, is primarily attributable to the adoption of the Canadian dollaras the functional currency for U.S. tax purposes of one of the Company’s wholly-owned Canadian subsidiaries in2006 and the effects of events related to cross-border financings, partially offset by an increase in interest on taxcontingencies, the majority of which is associated with leveraged leases, as discussed in Note 17 Contingencies.
Operating Results by Segment
Segment income presented in the tables below represents income from continuing operations before incometaxes.
Distribution Finance
2007 2006 2005(In millions)
Revenues . . . . . . . . . . . . . . . . . . . . . . . . . . . . . . . . . . . . . . . . . . . . . . . . . . . . . . . . . . $290 $268 $178
Net interest margin . . . . . . . . . . . . . . . . . . . . . . . . . . . . . . . . . . . . . . . . . . . . . . . . . . $206 $185 $140
Selling and administrative expenses . . . . . . . . . . . . . . . . . . . . . . . . . . . . . . . . . . . . . . 96 82 68
Provision for losses . . . . . . . . . . . . . . . . . . . . . . . . . . . . . . . . . . . . . . . . . . . . . . . . . . 24 4 2
Segment income. . . . . . . . . . . . . . . . . . . . . . . . . . . . . . . . . . . . . . . . . . . . . . . . . . . $ 86 $ 99 $ 70
Distribution Finance segment income decreased $13 million in 2007 compared with 2006, primarily reflectingan increase in provision for losses ($20 million) and an increase in selling and administrative expenses ($14 million),partially offset by an increase in net interest margin ($21 million). The increase in net interest margin principallyreflects an increase in securitization gains and servicing income ($24 million) as a result of the sale of anincremental $588 million of receivables into the Distribution Finance revolving securitization in the first quarter.Selling and administrative expenses increased largely due to growth in the segment’s managed receivable portfolio.Selling and administrative expenses as a percentage of average managed and serviced finance receivables remainedstable at 2.38% in 2007, as compared to 2.35% in 2006. The increase in provision for losses corresponds with asimilar increase in nonperforming assets as weakening U.S. economic conditions began to have a negative impacton borrowers in certain industries.
24

Distribution Finance segment income increased $29 million in 2006 compared with 2005, primarily reflectinghigher net interest margin ($45 million), partially offset by an increase in selling and administrative expenses($14 million). The increase in net interest margin principally reflects $736 million of higher average financereceivables ($37 million) and higher fee income ($9 million). Selling and administrative expenses increased largelydue to receivable portfolio growth. Selling and administrative expenses as a percentage of average managed andserviced finance receivables decreased to 2.35% in 2006 from 2.64% in 2005.
Aviation Finance
2007 2006 2005(In millions)
Revenues . . . . . . . . . . . . . . . . . . . . . . . . . . . . . . . . . . . . . . . . . . . . . . . . . . . . . . . . . . $176 $133 $107
Net interest margin . . . . . . . . . . . . . . . . . . . . . . . . . . . . . . . . . . . . . . . . . . . . . . . . . . $ 72 $ 52 $ 51
Selling and administrative expenses . . . . . . . . . . . . . . . . . . . . . . . . . . . . . . . . . . . . . . 21 21 16
Provision for losses . . . . . . . . . . . . . . . . . . . . . . . . . . . . . . . . . . . . . . . . . . . . . . . . . . 3 — 3
Segment income. . . . . . . . . . . . . . . . . . . . . . . . . . . . . . . . . . . . . . . . . . . . . . . . . . . $ 48 $ 31 $ 32
Net interest margin in the Aviation Finance segment increased $20 million in 2007 primarily due to a$512 million increase in average finance receivables ($14 million) and an increase in securitization gains($4 million). The increase in securitization gains reflects the sale of an additional $199 million of financereceivables during 2007. The increase in net interest margin was partially offset by an increase in provision forlosses. Nonperforming assets as a percentage of finance receivables remained relatively stable while the dollaramount of nonperforming assets increased, reflecting growth in the portfolio.
Net interest margin in the Aviation Finance segment increased $1 million in 2006 primarily due to a$242 million increase in average finance receivables, partially offset by lower securitization gains. The decrease inAviation Finance segment income in 2006 also reflects higher selling and administrative expenses ($5 million) andlower provision for losses ($3 million). The increase in selling and administrative expenses is largely due toportfolio growth and reorganization expenses incurred to enable additional growth in future periods. The decline inprovision for losses principally reflects continued improvements in portfolio quality.
Golf Finance
2007 2006 2005(In millions)
Revenues . . . . . . . . . . . . . . . . . . . . . . . . . . . . . . . . . . . . . . . . . . . . . . . . . . . . . . . . . . $138 $132 $102
Net interest margin . . . . . . . . . . . . . . . . . . . . . . . . . . . . . . . . . . . . . . . . . . . . . . . . . . $ 62 $ 54 $ 52
Selling and administrative expenses . . . . . . . . . . . . . . . . . . . . . . . . . . . . . . . . . . . . . . 19 19 21
Provision for losses . . . . . . . . . . . . . . . . . . . . . . . . . . . . . . . . . . . . . . . . . . . . . . . . . . 5 3 6
Segment income. . . . . . . . . . . . . . . . . . . . . . . . . . . . . . . . . . . . . . . . . . . . . . . . . . . $ 38 $ 32 $ 25
The increase in Golf Finance segment income of $6 million in 2007 reflects higher net interest margin resultingfrom a $102 million increase in average finance receivables ($3 million) and a significant reduction in borrowingcosts ($8 million) primarily attributable to a change in our interest expense allocation methodology described inNote 18. Financial Information about Operating Segments. The increase in net interest margin was partially offsetby an increase in provision for losses ($2 million) reflecting the establishment of specific reserves for two accountsduring 2007 while overall portfolio quality continued to improve.
The increase in Golf Finance segment income of $7 million in 2006 reflects higher net interest margin resultingfrom a $308 million increase in average finance receivables ($2 million), lower provision for losses ($3 million) andlower selling and administrative expenses ($2 million). The lower provision for losses primarily reflects improve-ments in portfolio quality. The decrease in selling and administrative expenses primarily reflects lower employeecompensation and benefits expense.
25
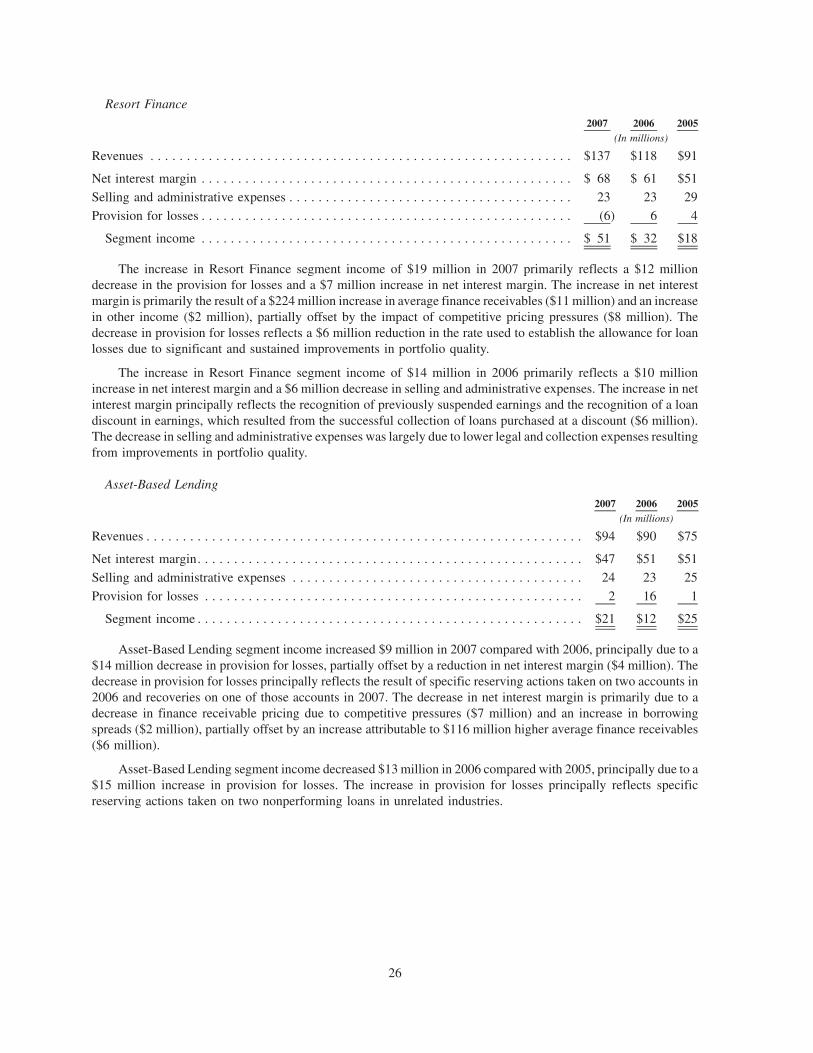
Resort Finance
2007 2006 2005(In millions)
Revenues . . . . . . . . . . . . . . . . . . . . . . . . . . . . . . . . . . . . . . . . . . . . . . . . . . . . . . . . . . $137 $118 $91
Net interest margin . . . . . . . . . . . . . . . . . . . . . . . . . . . . . . . . . . . . . . . . . . . . . . . . . . . $ 68 $ 61 $51
Selling and administrative expenses . . . . . . . . . . . . . . . . . . . . . . . . . . . . . . . . . . . . . . . 23 23 29
Provision for losses . . . . . . . . . . . . . . . . . . . . . . . . . . . . . . . . . . . . . . . . . . . . . . . . . . . (6) 6 4
Segment income . . . . . . . . . . . . . . . . . . . . . . . . . . . . . . . . . . . . . . . . . . . . . . . . . . . $ 51 $ 32 $18
The increase in Resort Finance segment income of $19 million in 2007 primarily reflects a $12 milliondecrease in the provision for losses and a $7 million increase in net interest margin. The increase in net interestmargin is primarily the result of a $224 million increase in average finance receivables ($11 million) and an increasein other income ($2 million), partially offset by the impact of competitive pricing pressures ($8 million). Thedecrease in provision for losses reflects a $6 million reduction in the rate used to establish the allowance for loanlosses due to significant and sustained improvements in portfolio quality.
The increase in Resort Finance segment income of $14 million in 2006 primarily reflects a $10 millionincrease in net interest margin and a $6 million decrease in selling and administrative expenses. The increase in netinterest margin principally reflects the recognition of previously suspended earnings and the recognition of a loandiscount in earnings, which resulted from the successful collection of loans purchased at a discount ($6 million).The decrease in selling and administrative expenses was largely due to lower legal and collection expenses resultingfrom improvements in portfolio quality.
Asset-Based Lending
2007 2006 2005(In millions)
Revenues . . . . . . . . . . . . . . . . . . . . . . . . . . . . . . . . . . . . . . . . . . . . . . . . . . . . . . . . . . . . $94 $90 $75
Net interest margin. . . . . . . . . . . . . . . . . . . . . . . . . . . . . . . . . . . . . . . . . . . . . . . . . . . . . $47 $51 $51
Selling and administrative expenses . . . . . . . . . . . . . . . . . . . . . . . . . . . . . . . . . . . . . . . . 24 23 25
Provision for losses . . . . . . . . . . . . . . . . . . . . . . . . . . . . . . . . . . . . . . . . . . . . . . . . . . . . 2 16 1
Segment income . . . . . . . . . . . . . . . . . . . . . . . . . . . . . . . . . . . . . . . . . . . . . . . . . . . . . $21 $12 $25
Asset-Based Lending segment income increased $9 million in 2007 compared with 2006, principally due to a$14 million decrease in provision for losses, partially offset by a reduction in net interest margin ($4 million). Thedecrease in provision for losses principally reflects the result of specific reserving actions taken on two accounts in2006 and recoveries on one of those accounts in 2007. The decrease in net interest margin is primarily due to adecrease in finance receivable pricing due to competitive pressures ($7 million) and an increase in borrowingspreads ($2 million), partially offset by an increase attributable to $116 million higher average finance receivables($6 million).
Asset-Based Lending segment income decreased $13 million in 2006 compared with 2005, principally due to a$15 million increase in provision for losses. The increase in provision for losses principally reflects specificreserving actions taken on two nonperforming loans in unrelated industries.
26

Structured Capital
2007 2006 2005(In millions)
Revenues . . . . . . . . . . . . . . . . . . . . . . . . . . . . . . . . . . . . . . . . . . . . . . . . . . . . . . . . . . . . $33 $38 $54
Net interest margin. . . . . . . . . . . . . . . . . . . . . . . . . . . . . . . . . . . . . . . . . . . . . . . . . . . . . $20 $21 $38
Selling and administrative expenses . . . . . . . . . . . . . . . . . . . . . . . . . . . . . . . . . . . . . . . . 4 4 4
Segment income . . . . . . . . . . . . . . . . . . . . . . . . . . . . . . . . . . . . . . . . . . . . . . . . . . . . . $16 $17 $34
Structured Capital segment income decreased $1 million as compared to 2006, reflecting a slight decline in netinterest margin. The decrease primarily reflects lower leveraged lease earnings due to an unfavorable earningsadjustment attributable to the recognition of residual value impairments ($13 million), the reduction of leveragedlease earnings from the adoption of FSP 13-2 ($8 million) and the recognition of earnings associated with the sale ofan option related to a leveraged lease asset in 2006 ($7 million), partially offset by a gain from the sale of a leveragedlease investment ($21 million) in the second quarter of 2007.
Structured Capital segment income decreased $17 million as compared to 2005 due to a decrease in net interestmargin. The decrease in net interest margin principally reflects $90 million of lower average finance receivables andlower other income, partially offset by earnings on the sale of an option to purchase cash flows related to an assetsubject to a leveraged lease ($7 million). The lower average finance receivables reflect the sale of a $78 million notereceivable in the fourth quarter of 2005. The lower other income reflects a $7 million gain recognized upon the saleof a note receivable in the fourth quarter of 2005, impairment charges taken on a leveraged lease residual, and lowerinvestment income.
Corporate and Other
2007 2006 2005(In millions)
Revenues. . . . . . . . . . . . . . . . . . . . . . . . . . . . . . . . . . . . . . . . . . . . . . . . . . . . . . . . . . . $ 7 $ 19 $ 21
Net interest margin . . . . . . . . . . . . . . . . . . . . . . . . . . . . . . . . . . . . . . . . . . . . . . . . . . . $(15) $ 6 $ 8
Selling and administrative expenses . . . . . . . . . . . . . . . . . . . . . . . . . . . . . . . . . . . . . . . 18 22 28
Provision for losses . . . . . . . . . . . . . . . . . . . . . . . . . . . . . . . . . . . . . . . . . . . . . . . . . . . 5 (3) 13
Segment loss . . . . . . . . . . . . . . . . . . . . . . . . . . . . . . . . . . . . . . . . . . . . . . . . . . . . . . $(38) $(13) $(33)
The $25 million increase in Corporate and Other segment loss in 2007 principally reflects the negative impacton interest margin resulting from the change in our interest allocation methodology as described in Note 18.Financial Information about Operating Segments ($13 million), higher provision for losses related to specificreserving actions taken on one account in the media finance portfolio and a reduction in selling and administrativeexpense consistent with a $132 million decrease in average finance receivables as compared to 2006.
The $20 million decrease in Corporate and Other segment loss in 2006 principally reflects lower selling andadministrative expenses and lower provision for losses. The decrease in selling and administrative expenses isprimarily the result of an impairment charge recognized in 2005 related to specialized computer software, and anoverall decrease in operating expenses as the portfolio continues to liquidate. The decrease in provision for lossesprimarily reflects the reversal of reserves related to a $43 million franchise portfolio sale in the third quarter of 2006,in addition to relative stability in portfolio quality.
Item 7A. Quantitative and Qualitative Disclosure about Market Risk
For information regarding Textron Financial’s Quantitative and Qualitative Disclosure about Market Risk, see“Risk Management” in Item 1 and “Management’s Discussion and Analysis of Financial Condition and Results ofOperations — Interest Rate Sensitivity,” in Item 7 of this Form 10-K.
27

Item 8. Financial Statements and Supplementary Data
REPORT OF MANAGEMENT
Management is responsible for the integrity and objectivity of the financial data presented in this AnnualReport on Form 10-K. The Consolidated Financial Statements have been prepared in conformity with accountingprinciples generally accepted in the United States and include amounts based on management’s best estimates andjudgments. Management is also responsible for establishing and maintaining adequate internal control overfinancial reporting for Textron Financial Corporation, as such term is defined in Exchange Act Rules 13a-15(f).With the participation of our management, we conducted an evaluation of the effectiveness of our internal controlover financial reporting based on the framework in Internal Control-Integrated Framework issued by the Committeeof Sponsoring Organizations of the Treadway Commission. Based on our evaluation under the framework inInternal Control-Integrated Framework, we have concluded that Textron Financial Corporation maintained, in allmaterial respects, effective internal control over financial reporting as of December 29, 2007.
The independent registered public accounting firm, Ernst & Young LLP, has audited the ConsolidatedFinancial Statements of Textron Financial Corporation and has issued an attestation report on our internal controlover financial reporting as of December 29, 2007, as stated in its reports, which are included herein.
We conduct our business in accordance with the standards outlined in the Textron Business ConductGuidelines, which is communicated to all employees. Honesty, integrity and high ethical standards are the corevalues of how we conduct business. Textron Financial Corporation prepares and carries out an annual CompliancePlan to ensure these values and standards are maintained. Our internal control structure is designed to providereasonable assurance, at appropriate cost, that assets are safeguarded and that transactions are properly executed andrecorded. The internal control structure includes, among other things, established policies and procedures, aninternal audit function, and the selection and training of qualified personnel. Textron Financial Corporation’smanagement is responsible for implementing effective internal control systems and monitoring their effectiveness,as well as developing and executing an annual internal control plan.
/s/ TED R. FRENCH
Ted R. FrenchChairman and Chief Executive Officer
February 13, 2008
/s/ THOMAS J. CULLEN
Thomas J. CullenExecutive Vice President andChief Financial Officer
February 13, 2008
28
REPORT OF INDEPENDENT REGISTERED PUBLIC ACCOUNTING FIRM ONINTERNAL CONTROL OVER FINANCIAL REPORTING
To the Board of DirectorsTextron Financial Corporation
We have audited Textron Financial Corporation’s internal control over financial reporting as of December 29,2007, based on criteria established in Internal Control-Integrated Framework issued by the Committee ofSponsoring Organizations of the Treadway Commission (the COSO criteria). Textron Financial Corporation’smanagement is responsible for maintaining effective internal control over financial reporting, and for its assessmentof the effectiveness of internal control over financial reporting included in the accompanying Report of Manage-ment. Our responsibility is to express an opinion on the company’s internal control over financial reporting based onour audit.
We conducted our audit in accordance with the standards of the Public Company Accounting Oversight Board(United States). Those standards require that we plan and perform the audit to obtain reasonable assurance aboutwhether effective internal control over financial reporting was maintained in all material respects. Our auditincluded obtaining an understanding of internal control over financial reporting, assessing the risk that a materialweakness exists, testing and evaluating the design and operating effectiveness of internal control based on theassessed risk, and performing such other procedures as we considered necessary in the circumstances. We believethat our audit provides a reasonable basis for our opinion.
A company’s internal control over financial reporting is a process designed to provide reasonable assuranceregarding the reliability of financial reporting and the preparation of financial statements for external purposes inaccordance with generally accepted accounting principles. A company’s internal control over financial reportingincludes those policies and procedures that (1) pertain to the maintenance of records that, in reasonable detail,accurately and fairly reflect the transactions and dispositions of the assets of the company; (2) provide reasonableassurance that transactions are recorded as necessary to permit preparation of financial statements in accordancewith generally accepted accounting principles, and that receipts and expenditures of the company are being madeonly in accordance with authorizations of management and directors of the company; and (3) provide reasonableassurance regarding prevention or timely detection of unauthorized acquisition, use, or disposition of the company’sassets that could have a material effect on the financial statements.
Because of its inherent limitations, internal control over financial reporting may not prevent or detectmisstatements. Also, projections of any evaluation of effectiveness to future periods are subject to the risk thatcontrols may become inadequate because of changes in conditions, or that the degree of compliance with thepolicies or procedures may deteriorate.
In our opinion, Textron Financial Corporation maintained, in all material respects, effective internal controlover financial reporting as of December 29, 2007, based on the COSO criteria.
We also have audited, in accordance with the standards of the Public Company Accounting Oversight Board(United States), the Consolidated Balance Sheets of Textron Financial Corporation as of December 29, 2007 andDecember 30, 2006, and the related Consolidated Statement of Income, Cash Flows and Changes in Shareholder’sEquity for each of the three years in the period ended December 29, 2007 of Textron Financial Corporation and ourreport dated February 13, 2008 expressed an unqualified opinion thereon.
Boston, MassachusettsFebruary 13, 2008
29

REPORT OF INDEPENDENT REGISTERED PUBLIC ACCOUNTING FIRM
To the Board of DirectorsTextron Financial Corporation
We have audited the accompanying Consolidated Balance Sheets of Textron Financial Corporation (the“Company”) as of December 29, 2007 and December 30, 2006, and the related Consolidated Statements of Income,Cash Flows and Changes in Shareholder’s Equity for each of the three years in the period ended December 29, 2007.These financial statements are the responsibility of the Company’s management. Our responsibility is to express anopinion on these financial statements based on our audits.
We conducted our audits in accordance with the standards of the Public Company Accounting Oversight Board(United States). Those standards require that we plan and perform the audit to obtain reasonable assurance aboutwhether the financial statements are free of material misstatement. An audit includes examining, on a test basis,evidence supporting the amounts and disclosures in the financial statements. An audit also includes assessing theaccounting principles used and significant estimates made by management, as well as evaluating the overallfinancial statement presentation. We believe that our audits provide a reasonable basis for our opinion.
In our opinion, the Consolidated Financial Statements referred to above present fairly, in all material respects,the consolidated financial position of Textron Financial Corporation at December 29, 2007 and December 30, 2006and the consolidated results of its operations and its cash flows for each of the three years in the period endedDecember 29, 2007, in conformity with U.S. generally accepted accounting principles.
We also have audited, in accordance with the standards of the Public Company Accounting Oversight Board(United States), Textron Financial Corporation’s internal control over financial reporting as of December 29, 2007based on criteria established in Internal Control-Integrated Framework issued by the Committee of SponsoringOrganizations of the Treadway Commission and our report dated February 13, 2008 expressed an unqualifiedopinion thereon.
As discussed in Note 5 to the Consolidated Financial Statements, in 2007 the Company adopted FASB StaffPosition No. 13-2, “Accounting for a Change or Projected Change in the Timing of Cash Flows Relating to IncomeTaxes Generated by a Leveraged Lease Transaction.”
Boston, MassachusettsFebruary 13, 2008
30

CONSOLIDATED STATEMENTS OF INCOME
For each of the three years in the period ended December 29, 2007
2007 2006 2005(In millions)
Finance charges . . . . . . . . . . . . . . . . . . . . . . . . . . . . . . . . . . . . . . . . . . . . . . . . . . . . . $671 $652 $464
Securitization gains . . . . . . . . . . . . . . . . . . . . . . . . . . . . . . . . . . . . . . . . . . . . . . . . . . 62 42 49
Rental revenues on operating leases . . . . . . . . . . . . . . . . . . . . . . . . . . . . . . . . . . . . . . 34 32 32
Other income. . . . . . . . . . . . . . . . . . . . . . . . . . . . . . . . . . . . . . . . . . . . . . . . . . . . . . . 108 72 83
Total revenues . . . . . . . . . . . . . . . . . . . . . . . . . . . . . . . . . . . . . . . . . . . . . . . . . . . . . 875 798 628
Interest expense . . . . . . . . . . . . . . . . . . . . . . . . . . . . . . . . . . . . . . . . . . . . . . . . . . . . . 397 351 218
Depreciation of equipment on operating leases . . . . . . . . . . . . . . . . . . . . . . . . . . . . . . 18 17 19
Net interest margin . . . . . . . . . . . . . . . . . . . . . . . . . . . . . . . . . . . . . . . . . . . . . . . . . 460 430 391
Selling and administrative expenses . . . . . . . . . . . . . . . . . . . . . . . . . . . . . . . . . . . . . . 205 194 191
Provision for losses . . . . . . . . . . . . . . . . . . . . . . . . . . . . . . . . . . . . . . . . . . . . . . . . . . 33 26 29
Income from continuing operations before income taxes . . . . . . . . . . . . . . . . . . . . . 222 210 171
Income taxes . . . . . . . . . . . . . . . . . . . . . . . . . . . . . . . . . . . . . . . . . . . . . . . . . . . . . . . 77 57 57
Income from continuing operations . . . . . . . . . . . . . . . . . . . . . . . . . . . . . . . . . . . . . 145 153 114
Loss from discontinued operations, net of income tax benefit . . . . . . . . . . . . . . . . . . . — (1) (3)
Net income . . . . . . . . . . . . . . . . . . . . . . . . . . . . . . . . . . . . . . . . . . . . . . . . . . . . . . . . $145 $152 $111
See Notes to the Consolidated Financial Statements.
31
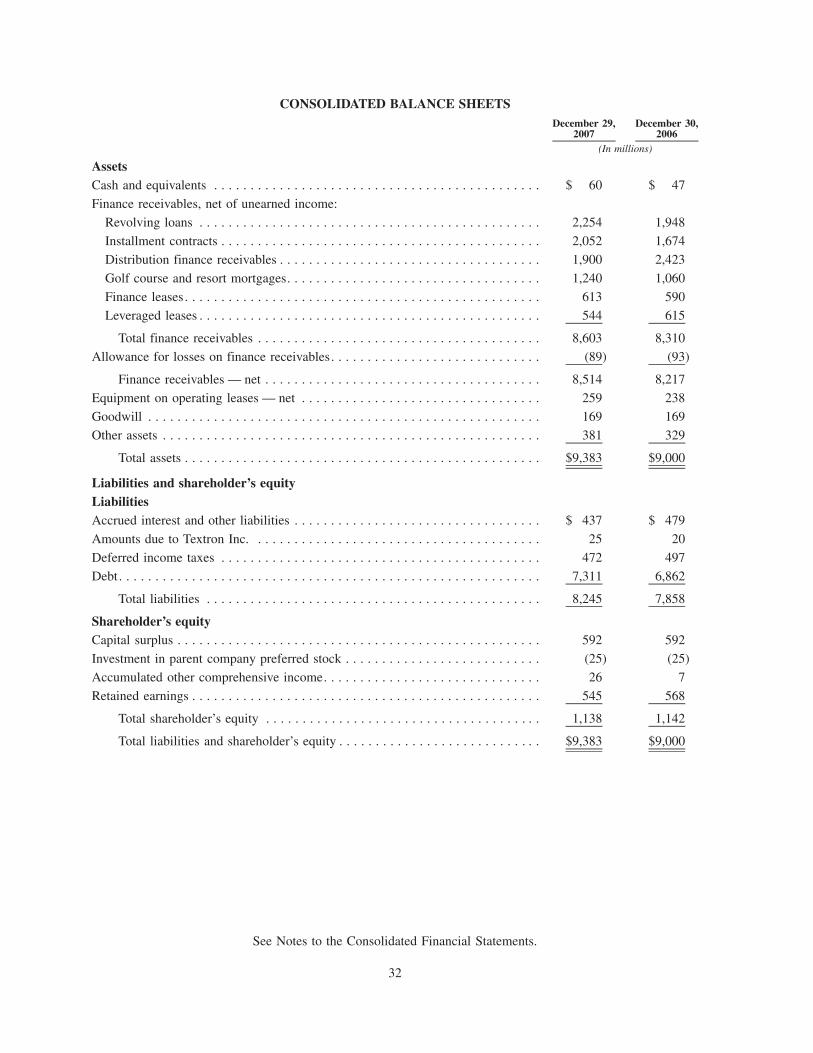
CONSOLIDATED BALANCE SHEETSDecember 29,
2007December 30,
2006(In millions)
AssetsCash and equivalents . . . . . . . . . . . . . . . . . . . . . . . . . . . . . . . . . . . . . . . . . . . . . $ 60 $ 47
Finance receivables, net of unearned income:
Revolving loans . . . . . . . . . . . . . . . . . . . . . . . . . . . . . . . . . . . . . . . . . . . . . . . 2,254 1,948
Installment contracts . . . . . . . . . . . . . . . . . . . . . . . . . . . . . . . . . . . . . . . . . . . . 2,052 1,674
Distribution finance receivables . . . . . . . . . . . . . . . . . . . . . . . . . . . . . . . . . . . . 1,900 2,423
Golf course and resort mortgages. . . . . . . . . . . . . . . . . . . . . . . . . . . . . . . . . . . 1,240 1,060
Finance leases . . . . . . . . . . . . . . . . . . . . . . . . . . . . . . . . . . . . . . . . . . . . . . . . . 613 590
Leveraged leases . . . . . . . . . . . . . . . . . . . . . . . . . . . . . . . . . . . . . . . . . . . . . . . 544 615
Total finance receivables . . . . . . . . . . . . . . . . . . . . . . . . . . . . . . . . . . . . . . . 8,603 8,310
Allowance for losses on finance receivables. . . . . . . . . . . . . . . . . . . . . . . . . . . . . (89) (93)
Finance receivables — net . . . . . . . . . . . . . . . . . . . . . . . . . . . . . . . . . . . . . . 8,514 8,217
Equipment on operating leases — net . . . . . . . . . . . . . . . . . . . . . . . . . . . . . . . . . 259 238
Goodwill . . . . . . . . . . . . . . . . . . . . . . . . . . . . . . . . . . . . . . . . . . . . . . . . . . . . . . 169 169
Other assets . . . . . . . . . . . . . . . . . . . . . . . . . . . . . . . . . . . . . . . . . . . . . . . . . . . . 381 329
Total assets . . . . . . . . . . . . . . . . . . . . . . . . . . . . . . . . . . . . . . . . . . . . . . . . . $9,383 $9,000
Liabilities and shareholder’s equityLiabilitiesAccrued interest and other liabilities . . . . . . . . . . . . . . . . . . . . . . . . . . . . . . . . . . $ 437 $ 479
Amounts due to Textron Inc. . . . . . . . . . . . . . . . . . . . . . . . . . . . . . . . . . . . . . . . 25 20
Deferred income taxes . . . . . . . . . . . . . . . . . . . . . . . . . . . . . . . . . . . . . . . . . . . . 472 497
Debt. . . . . . . . . . . . . . . . . . . . . . . . . . . . . . . . . . . . . . . . . . . . . . . . . . . . . . . . . . 7,311 6,862
Total liabilities . . . . . . . . . . . . . . . . . . . . . . . . . . . . . . . . . . . . . . . . . . . . . . 8,245 7,858
Shareholder’s equityCapital surplus . . . . . . . . . . . . . . . . . . . . . . . . . . . . . . . . . . . . . . . . . . . . . . . . . . 592 592
Investment in parent company preferred stock . . . . . . . . . . . . . . . . . . . . . . . . . . . (25) (25)
Accumulated other comprehensive income. . . . . . . . . . . . . . . . . . . . . . . . . . . . . . 26 7
Retained earnings . . . . . . . . . . . . . . . . . . . . . . . . . . . . . . . . . . . . . . . . . . . . . . . . 545 568
Total shareholder’s equity . . . . . . . . . . . . . . . . . . . . . . . . . . . . . . . . . . . . . . 1,138 1,142
Total liabilities and shareholder’s equity . . . . . . . . . . . . . . . . . . . . . . . . . . . . $9,383 $9,000
See Notes to the Consolidated Financial Statements.
32

CONSOLIDATED STATEMENTS OF CASH FLOWS
For each of the three years in the period ended December 29, 2007
2007 2006 2005(In millions)
Cash flows from operating activities:Net income . . . . . . . . . . . . . . . . . . . . . . . . . . . . . . . . . . . . . . . . . . . . . . . $ 145 $ 152 $ 111Loss from discontinued operations . . . . . . . . . . . . . . . . . . . . . . . . . . . . . . — 1 3
Income from continuing operations . . . . . . . . . . . . . . . . . . . . . . . . . . . 145 153 114Adjustments to reconcile income from continuing operations to net cash
provided by operating activities:Provision for losses . . . . . . . . . . . . . . . . . . . . . . . . . . . . . . . . . . . . . . . 33 26 29Increase in accrued interest and other liabilities . . . . . . . . . . . . . . . . . . 36 66 35Depreciation . . . . . . . . . . . . . . . . . . . . . . . . . . . . . . . . . . . . . . . . . . . . 28 28 34Amortization . . . . . . . . . . . . . . . . . . . . . . . . . . . . . . . . . . . . . . . . . . . . 12 11 12Noncash gains in excess of collections on securitizations and
syndications . . . . . . . . . . . . . . . . . . . . . . . . . . . . . . . . . . . . . . . . . . (4) 8 2Deferred income tax provision . . . . . . . . . . . . . . . . . . . . . . . . . . . . . . . (7) 38 7Other — net . . . . . . . . . . . . . . . . . . . . . . . . . . . . . . . . . . . . . . . . . . . . 19 8 14
Net cash provided by operating activities of continuing operations . . 262 338 247Net cash used by operating activities of discontinued operations . . . . — (13) (3)
Net cash provided by operating activities . . . . . . . . . . . . . . . . . . . . . . . 262 325 244Cash flows from investing activities:Finance receivables originated or purchased . . . . . . . . . . . . . . . . . . . . . . . (13,124) (12,240) (10,940)Finance receivables repaid. . . . . . . . . . . . . . . . . . . . . . . . . . . . . . . . . . . . 11,863 10,205 9,560Proceeds from receivable sales, including securitizations . . . . . . . . . . . . . 994 513 383Net cash used in acquisitions. . . . . . . . . . . . . . . . . . . . . . . . . . . . . . . . . . — (164) —Other investments . . . . . . . . . . . . . . . . . . . . . . . . . . . . . . . . . . . . . . . . . . (10) 18 26Proceeds from disposition of operating leases and other assets . . . . . . . . . 55 66 93Other capital expenditures . . . . . . . . . . . . . . . . . . . . . . . . . . . . . . . . . . . . (10) (12) (9)Purchase of assets for operating leases . . . . . . . . . . . . . . . . . . . . . . . . . . . (49) (66) (63)
Net cash used by investing activities of continuing operations . . . . . . . (281) (1,680) (950)Cash flows from financing activities:Principal payments on long-term debt . . . . . . . . . . . . . . . . . . . . . . . . . . . (1,248) (1,049) (677)Proceeds from issuance of long-term debt . . . . . . . . . . . . . . . . . . . . . . . . 1,878 1,853 1,482Net (decrease) increase in commercial paper . . . . . . . . . . . . . . . . . . . . . . (315) 532 (102)Net (decrease) increase in other short-term debt . . . . . . . . . . . . . . . . . . . . (55) 47 (4)Proceeds from issuance of nonrecourse debt . . . . . . . . . . . . . . . . . . . . . . — 142 72Principal payments on nonrecourse debt . . . . . . . . . . . . . . . . . . . . . . . . . (96) (72) (84)Capital contributions from Textron Inc. . . . . . . . . . . . . . . . . . . . . . . . . . . 9 27 9Dividends paid to Textron Inc. . . . . . . . . . . . . . . . . . . . . . . . . . . . . . . . . (144) (89) (109)
Net cash provided by financing activities of continuing operations . . . 29 1,391 587Effect of exchange rate changes on cash . . . . . . . . . . . . . . . . . . . . . . . . . 3 1 2
Net cash provided (used) by continuing operations. . . . . . . . . . . . . . . . 13 50 (114)Net cash used by discontinued operations . . . . . . . . . . . . . . . . . . . . . . . — (13) (3)
Net increase (decrease) in cash and equivalents . . . . . . . . . . . . . . . . . . . . 13 37 (117)Cash and equivalents at beginning of year . . . . . . . . . . . . . . . . . . . . . . . . 47 10 127
Cash and equivalents at end of year . . . . . . . . . . . . . . . . . . . . . . . . . . . . . $ 60 $ 47 $ 10
See Notes to the Consolidated Financial Statements.
33
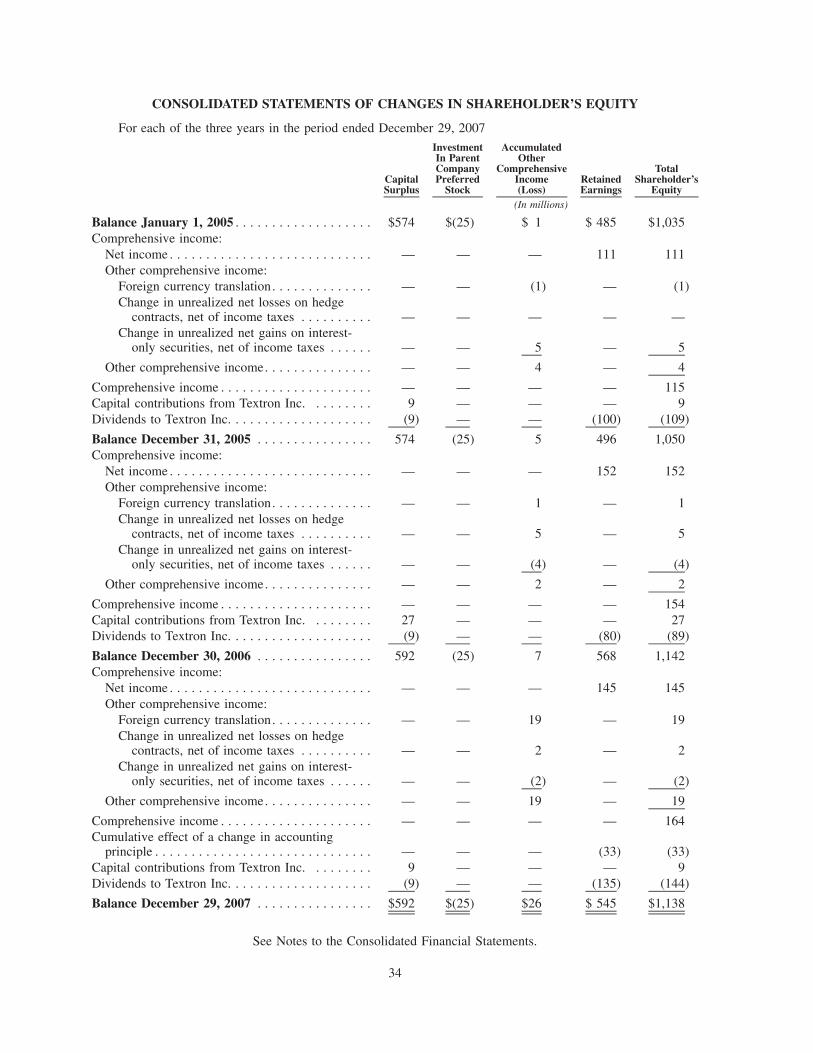
CONSOLIDATED STATEMENTS OF CHANGES IN SHAREHOLDER’S EQUITY
For each of the three years in the period ended December 29, 2007
CapitalSurplus
InvestmentIn ParentCompanyPreferred
Stock
AccumulatedOther
ComprehensiveIncome(Loss)
RetainedEarnings
TotalShareholder’s
Equity(In millions)
Balance January 1, 2005 . . . . . . . . . . . . . . . . . . . $574 $(25) $ 1 $ 485 $1,035Comprehensive income:
Net income . . . . . . . . . . . . . . . . . . . . . . . . . . . . — — — 111 111Other comprehensive income:
Foreign currency translation. . . . . . . . . . . . . . — — (1) — (1)Change in unrealized net losses on hedge
contracts, net of income taxes . . . . . . . . . . — — — — —Change in unrealized net gains on interest-
only securities, net of income taxes . . . . . . — — 5 — 5
Other comprehensive income. . . . . . . . . . . . . . . — — 4 — 4
Comprehensive income . . . . . . . . . . . . . . . . . . . . . — — — — 115Capital contributions from Textron Inc. . . . . . . . . 9 — — — 9Dividends to Textron Inc. . . . . . . . . . . . . . . . . . . . (9) — — (100) (109)
Balance December 31, 2005 . . . . . . . . . . . . . . . . 574 (25) 5 496 1,050Comprehensive income:
Net income . . . . . . . . . . . . . . . . . . . . . . . . . . . . — — — 152 152Other comprehensive income:
Foreign currency translation. . . . . . . . . . . . . . — — 1 — 1Change in unrealized net losses on hedge
contracts, net of income taxes . . . . . . . . . . — — 5 — 5Change in unrealized net gains on interest-
only securities, net of income taxes . . . . . . — — (4) — (4)
Other comprehensive income. . . . . . . . . . . . . . . — — 2 — 2
Comprehensive income . . . . . . . . . . . . . . . . . . . . . — — — — 154Capital contributions from Textron Inc. . . . . . . . . 27 — — — 27Dividends to Textron Inc. . . . . . . . . . . . . . . . . . . . (9) — — (80) (89)
Balance December 30, 2006 . . . . . . . . . . . . . . . . 592 (25) 7 568 1,142Comprehensive income:
Net income . . . . . . . . . . . . . . . . . . . . . . . . . . . . — — — 145 145Other comprehensive income:
Foreign currency translation. . . . . . . . . . . . . . — — 19 — 19Change in unrealized net losses on hedge
contracts, net of income taxes . . . . . . . . . . — — 2 — 2Change in unrealized net gains on interest-
only securities, net of income taxes . . . . . . — — (2) — (2)
Other comprehensive income. . . . . . . . . . . . . . . — — 19 — 19
Comprehensive income . . . . . . . . . . . . . . . . . . . . . — — — — 164Cumulative effect of a change in accounting
principle . . . . . . . . . . . . . . . . . . . . . . . . . . . . . . — — — (33) (33)Capital contributions from Textron Inc. . . . . . . . . 9 — — — 9Dividends to Textron Inc. . . . . . . . . . . . . . . . . . . . (9) — — (135) (144)
Balance December 29, 2007 . . . . . . . . . . . . . . . . $592 $(25) $26 $ 545 $1,138
See Notes to the Consolidated Financial Statements.
34

NOTES TO THE CONSOLIDATED FINANCIAL STATEMENTS
NOTE 1 Summary of Significant Accounting Policies
Nature of Operations
Textron Financial Corporation (“Textron Financial” or the “Company”) is a diversified commercial financecompany with operations in six segments: Asset-Based Lending, Aviation Finance, Distribution Finance, GolfFinance, Resort Finance and Structured Capital. Asset-Based Lending provides revolving credit facilities securedby receivables and inventory, related equipment and real estate term loans, and factoring programs across a broadrange of manufacturing and service industries. Aviation Finance provides financing for new and used Cessnabusiness jets, single engine turboprops, piston-engine airplanes, Bell helicopters and other general aviation aircraft.Distribution Finance primarily offers inventory finance programs for dealers of Textron manufactured products andfor dealers of a variety of other household, housing, leisure, agricultural and technology products. Golf Financeprimarily makes mortgage loans for the acquisition and refinancing of golf courses, and provides term financing forE-Z-GO golf cars and Jacobsen turf-care equipment. Resort Finance principally extends loans to developers ofvacation interval resorts, secured primarily by notes receivable and interval inventory. Structured Capital primarilyengages in long-term leases of large-ticket equipment and real estate, primarily with investment grade lessees.
Textron Financial’s financing activities are confined almost exclusively to secured lending and leasing tocommercial markets. Textron Financial’s services are offered primarily in North America. However, TextronFinancial finances products worldwide, principally Bell helicopters and Cessna aircraft.
Textron Financial is a wholly-owned subsidiary of Textron Inc. (“Textron”), a global multi-industry companywith operations in four business segments: Bell, Cessna, Industrial and Finance. At December 29, 2007 andDecember 30, 2006, 19% and 18% of Textron Financial’s total managed finance receivables were related to thefinancing of Textron manufactured products, respectively. Textron Financial’s year-end dates conform withTextron’s year-end, which falls on the nearest Saturday to December 31.
Principles of Consolidation
The accompanying Consolidated Financial Statements include the accounts of Textron Financial and itssubsidiaries, all of which are wholly-owned. All significant intercompany transactions have been eliminated.
Use of Estimates
The preparation of financial statements in conformity with generally accepted accounting principles requiresmanagement to make estimates and assumptions that affect the amounts reported in those statements andaccompanying notes. Actual results may differ from such estimates.
Finance Charges
Finance charges include interest on loans, capital lease earnings, leveraged lease earnings and discounts oncertain revolving credit and factoring arrangements. Finance charges are recognized in revenues using the interestmethod to provide a constant rate of return over the terms of the finance assets. Accrual of interest income issuspended for accounts that are contractually delinquent by more than three months, unless collection is notdoubtful. In addition, detailed reviews of loans may result in earlier suspension if collection is doubtful. Cashpayments on nonaccrual accounts, including finance charges, generally are applied to reduce loan principal.Accrual of interest is resumed when the loan becomes contractually current, and suspended interest income isrecognized at that time.
Finance Receivable Origination Fees and Costs
Fees received and direct loan origination costs are deferred and amortized to finance charge revenues over thecontractual lives of the respective receivables using the interest method. Unamortized amounts are recognized inrevenues when receivables are sold or paid in full.
35

Other Income
Other income includes syndication gains on the sale of loans and leases, late charges, prepayment gains,servicing fees, residual gains, investment income and other miscellaneous fees, which are primarily recognized asincome when received. It also includes earnings on retained interests in securitizations including interest on sellercertificates and cash reserve accounts as well as the accretable yield on interest-only securities. Impairment chargesrelated to assets and investments acquired through repossession of collateral are also recorded in the Othercomponent of Other income.
Allowance for Losses on Finance Receivables
Management evaluates its allowance for losses on finance receivables based on a combination of factors. Forits homogeneous loan pools, Textron Financial examines current delinquencies, characteristics of the existingaccounts, historical loss experience, underlying collateral value and general economic conditions and trends. Forlarger balance commercial loans, Textron Financial considers borrower specific information, industry trends andestimated discounted cash flows, as well as the factors described above for homogeneous loan pools.
Provision for losses on finance receivables are charged to income in amounts sufficient to maintain theallowance for losses on finance receivables at a level considered adequate to cover inherent losses in the ownedfinance receivable portfolio, based on management’s evaluation and analysis of this portfolio.
Finance receivables are written down to the fair value (less estimated costs to sell) of the related collateral atthe earlier of the date the collateral is repossessed or when no payment has been received for six months, unlessmanagement deems the receivable collectible. Finance receivables are charged off when they are deemed to beuncollectible.
Loan Impairment
Textron Financial periodically evaluates finance receivables, excluding homogeneous loan portfolios andfinance leases, for impairment. A loan is considered impaired when it is probable that the Company will be unableto collect all amounts due according to the contractual terms of the loan agreement. In addition, the Companyidentifies loans that are considered impaired due to the significant modification of the original loan terms to reflectdeferred principal payments generally at market interest rates, but which continue to accrue finance charges sincecollection of principal and interest is not doubtful. Nonaccrual finance receivables include impaired nonaccrualfinance receivables and accounts in homogeneous portfolios that are contractually delinquent by more than threemonths.
Impairment is measured by comparing the fair value of a loan to its carrying amount. Fair value is based on thepresent value of expected future cash flows discounted at the loan’s effective interest rate, the loan’s observablemarket price or, if the loan is collateral dependent, at the fair value of the collateral, less selling costs. If the fairvalue of the loan is less than its carrying amount, the Company establishes a reserve based on this difference. Thisevaluation is inherently subjective, as it requires estimates, including the amount and timing of future cash flowsexpected to be received on impaired loans, which may differ from actual results.
Fixed Assets
The cost of fixed assets is depreciated using the straight-line method based on the estimated useful lives of theassets.
Equipment on Operating Leases
Income from operating leases is recognized in equal amounts over the lease terms. The costs of such assets arecapitalized and depreciated to estimated residual values using the straight-line method over the estimated useful lifeof the asset or the lease term.
36

Goodwill
Management evaluates the recoverability of goodwill annually, or more frequently if events or changes incircumstances, such as declines in interest margin, earnings or cash flows or material adverse changes in thebusiness climate, indicate that the carrying value might be impaired. Goodwill is considered to be impaired whenthe net book value of a reporting unit exceeds its estimated fair value. Fair values are primarily established using adiscounted cash flow methodology. The determination of discounted cash flow is based on the businesses’ strategicplans and long-range planning forecasts.
Pension Benefits and Postretirement Benefits Other than Pensions
Textron Financial participates in Textron’s defined contribution and defined benefit pension plans. The cost ofthe defined contribution plan amounted to approximately $5.0 million, $2.4 million and $1.9 million in 2007, 2006and 2005, respectively. The cost of the defined benefit pension plan amounted to approximately $10.2 million,$10.7 million and $9.5 million in 2007, 2006 and 2005, respectively. Defined benefits under salaried plans are basedon salary and years of service. Textron’s funding policy is consistent with federal law and regulations. Pension planassets consist principally of corporate and government bonds and common stocks. Accrued pension expense isincluded in Accrued interest and other liabilities on Textron Financial’s Consolidated Balance Sheets.
Income Taxes
Textron Financial’s revenues and expenses are included in Textron’s consolidated tax return. TextronFinancial’s current tax expense reflects statutory U.S. tax rates applied to taxable income or loss included inTextron’s consolidated returns. Deferred tax assets and liabilities are determined based on temporary differencesbetween the financial reporting and tax bases of assets and liabilities, applying enacted tax rates expected to be ineffect for the year in which we expect the differences will reverse or settle. Based on the evaluation of availableevidence, we recognize future tax benefits, such as net operating loss carryforwards, to the extent that it is morelikely than not that we will realize these benefits. We recognize interest and penalties related to unrecognized taxbenefits in income tax expense in our Consolidated Statements of Operations.
We periodically assess the likelihood that we will be able to recover our deferred tax assets and reflect anychanges in our estimates in the valuation allowance, with a corresponding adjustment to earnings or othercomprehensive income (loss), as appropriate. In assessing the need for a valuation allowance, we look to thefuture reversal of existing taxable temporary differences, taxable income in carryback years, the feasibility of taxplanning strategies and estimated future taxable income.
Securitized Transactions
Securitized transactions involve the sale of finance receivables to qualified special purpose trusts. TextronFinancial may retain an interest in the assets sold in the form of interest-only securities, seller certificates, cashreserve accounts and servicing rights and obligations. The Company’s retained interests are subordinate to otherinvestors’ interests in the securitizations. Gain or loss on the sale of the loans or leases depends, in part, on theprevious carrying amount of the financial assets involved in the transfer, which is allocated between the assets soldand the retained interests based on their relative fair values at the date of transfer. Retained interests are recorded atfair value in Other assets. The Company estimates fair values based on the present value of expected future cashflows using management’s best estimates of key assumptions — credit losses, prepayment speeds and discountrates commensurate with the risks involved.
Textron Financial reviews the fair values of the retained interests quarterly using updated assumptions andcompares such amounts with the carrying value of the retained interests. When the carrying value exceeds the fairvalue of the retained interests, the Company determines whether the decline in fair value is other than temporary.When the Company determines the value of the decline is other than temporary, it writes down the retained intereststo fair value with a corresponding charge to income. When a change in fair value of retained interests is deemedtemporary, the Company records a corresponding credit or charge to Other comprehensive income for anyunrealized gains or losses.
37

Textron Financial does not provide legal recourse to third-party investors that purchase interests in TextronFinancial’s securitizations beyond the credit enhancement inherent in the retained interest-only securities, sellercertificates and cash reserve accounts.
Derivative Financial Instruments
Textron Financial has entered into various interest rate and foreign exchange agreements to mitigate itsexposure to changes in interest and foreign exchange rates. The Company records all derivative financialinstruments on its balance sheet at fair value and recognizes changes in fair values in current earnings unlessthe derivatives qualify as hedges of future cash flows. For derivatives qualifying as hedges of future cash flows, theCompany records the effective portion of the change in fair value as a component of Other comprehensive income inthe periods the hedged transaction affects earnings.
Textron Financial recognizes the net interest differential on interest rate exchange agreements as adjustmentsto finance charges or interest expense to correspond with the hedged positions. In the event of an early terminationof a derivative financial instrument, the Company defers the gain or loss in Other comprehensive income until itrecognizes the hedged transaction in earnings.
While these exchange agreements expose Textron Financial to credit losses in the event of nonperformance bythe counterparties to the agreements, the Company does not expect any such nonperformance. The Companyminimizes the risk of nonperformance by entering into contracts with financially sound counterparties having long-term bond ratings of generally no less than single A, by continuously monitoring such credit ratings and by limitingits exposure with any one financial institution. At December 29, 2007, the Company’s largest single counterpartycredit exposure was $3 million.
Fair Value of Financial Instruments
Fair values of financial instruments are based upon estimates at a specific point in time using available marketinformation and appropriate valuation methodologies. These estimates are subjective in nature and involveuncertainties and significant judgment in the interpretation of current market data. Therefore, the fair valuespresented may differ from amounts Textron Financial could realize or settle currently.
Cash and Equivalents
Cash and equivalents consist of cash in banks and overnight interest-bearing deposits in banks.
Recent Accounting Pronouncements
In September 2006, the Financial Accounting Standards Board (“FASB”) issued Statement of FinancialAccounting Standards (“SFAS”) No. 157 “Fair Value Measurements”. SFAS 157 replaces multiple existingdefinitions of fair value with a single definition, establishes a consistent framework for measuring fair value, andexpands financial statement disclosures regarding fair value measurements. This Statement applies only to fairvalue measurements that are already required or permitted by other accounting standards and does not require anynew fair value measurements. SFAS 157 is effective in the first quarter of 2008, and the Company currently does notexpect the adoption will have a material impact on its financial position or results of operations.
In February 2007, the FASB issued SFAS No. 159, “The Fair Value Option for Financial Assets and FinancialLiabilities — Including an amendment to FASB Statement No. 115”. SFAS 159 allows companies to choose tomeasure eligible assets and liabilities at fair value with changes in value recognized in earnings. Fair value treatmentfor eligible assets and liabilities may be elected either prospectively upon initial recognition, or if an event triggers anew basis of accounting for an existing asset or liability. SFAS 159 is effective in the first quarter of 2008, and theCompany does not expect it will elect to re-measure any of its existing financial assets or liabilities under theprovisions of SFAS 159.
38
NOTE 2 Other Income
2007 2006 2005(In millions)
Servicing fees . . . . . . . . . . . . . . . . . . . . . . . . . . . . . . . . . . . . . . . . . . . . . . . . . . . . . . . . $ 36 $29 $32
Investment income . . . . . . . . . . . . . . . . . . . . . . . . . . . . . . . . . . . . . . . . . . . . . . . . . . . . 14 15 12
Prepayment gains . . . . . . . . . . . . . . . . . . . . . . . . . . . . . . . . . . . . . . . . . . . . . . . . . . . . . 7 6 6
Syndication income . . . . . . . . . . . . . . . . . . . . . . . . . . . . . . . . . . . . . . . . . . . . . . . . . . . 4 2 2
Late charges . . . . . . . . . . . . . . . . . . . . . . . . . . . . . . . . . . . . . . . . . . . . . . . . . . . . . . . . . 3 3 5
Other . . . . . . . . . . . . . . . . . . . . . . . . . . . . . . . . . . . . . . . . . . . . . . . . . . . . . . . . . . . . . . 44 17 26
Total other income . . . . . . . . . . . . . . . . . . . . . . . . . . . . . . . . . . . . . . . . . . . . . . . . . . $108 $72 $83
The Other component of Other income includes commitment fees, residual gains, gains from asset sales(excluding syndications), insurance fees and other miscellaneous fees, which are primarily recognized as incomewhen received. Impairment charges related to assets and investments acquired through repossession of collateral arealso recorded in the Other component of Other income.
In the second quarter of 2007 we recorded a $21 million gain on the sale of a leveraged lease investment whichis included in the Other component of Other income.
NOTE 3 Discontinued Operations
On December 19, 2003, the small business direct portfolio (small business finance) was sold for $421 millionin cash and, based upon the terms of the transaction, no gain or loss was recorded. We entered into a loss sharingagreement related to the sale, which required us to reimburse the purchaser for 50% of losses incurred on theportfolio above a 4% annual level. A liability of $14 million was originally recorded representing the estimated fairvalue of the guarantee. During the fourth quarter of 2006, we entered into a settlement agreement with thepurchaser, which terminated our obligation to reimburse the purchaser for future losses. The settlement resulted in a$1 million loss, net of tax from discontinued operations.
NOTE 4 Relationship with Textron Inc.
Textron Financial is a wholly-owned subsidiary of Textron and derives a portion of its business from financingthe sale and lease of products manufactured and sold by Textron. Textron Financial recognized finance chargerevenues from Textron affiliates (net of payments or reimbursements for interest charged at more or less than marketrates on Textron manufactured products) of $4 million in 2007, $10 million in 2006 and $7 million in 2005, andoperating lease revenues of $27 million in 2007 and $26 million in both 2006 and 2005. Textron Financial paidTextron $1.2 billion in 2007, $1.0 billion in 2006 and $0.8 billion in 2005 relating to the sale of manufacturedproducts to third parties that were financed by the Company. In addition, the Company paid Textron $27 million,$63 million and $41 million, respectively, for the purchase of equipment on operating leases. Textron Financial andTextron are parties to several agreements, collectively referred to as operating agreements, which govern manyareas of the Textron Financial-Textron relationship. It is the intention of these parties to execute transactions atmarket terms. Under operating agreements with Textron, Textron Financial has recourse to Textron with respect tocertain finance receivables and operating leases. Finance receivables of $87 million at December 29, 2007 and$152 million at December 30, 2006, and operating leases of $167 million and $183 million at December 29, 2007and December 30, 2006, were subject to recourse to Textron or due from Textron.
Under the operating agreements between Textron and Textron Financial, Textron has agreed to lend TextronFinancial, interest-free, an amount not to exceed the deferred income tax liability of Textron attributable to themanufacturing profit deferred for tax purposes on products manufactured by Textron and financed by TextronFinancial. The Company had borrowings from Textron of $23 million at December 29, 2007 and $20 million atDecember 30, 2006 under this arrangement. These borrowings are reflected in Amounts due to Textron Inc. onTextron Financial’s Consolidated Balance Sheets. In addition, in 2005 Textron amended its credit facility to permitTextron Financial to borrow under the facility. Textron Financial had not utilized this facility at December 29, 2007.
39

Textron has also agreed to cause Textron Financial’s pre-tax income available for fixed charges to be no lessthan 125% of its fixed charges and its consolidated Shareholder’s equity to be no less than $200 million. No relatedpayments were required for 2007, 2006 or 2005.
The Company had income taxes payable of $42 million and $38 million at December 29, 2007 andDecember 30, 2006, respectively. These accounts are settled with Textron as Textron manages its consolidatedfederal and state tax position.
NOTE 5 Finance Receivables
Portfolio Maturities
Portfolio maturities of finance receivables outstanding at December 29, 2007, were as follows:
2008 2009 2010 2011 2012 Thereafter Total(In millions)
Revolving loans . . . . . . . . . . . . . . . . . . . . $1,631 $ 315 $156 $ 77 $ 38 $ 37 $2,254
Installment contracts . . . . . . . . . . . . . . . . . 257 234 209 248 290 814 2,052
Distribution finance receivables . . . . . . . . . 1,190 506 62 42 63 37 1,900
Golf course and resort mortgages . . . . . . . 66 253 121 193 277 330 1,240
Finance leases . . . . . . . . . . . . . . . . . . . . . 160 133 127 70 28 95 613
Leveraged leases . . . . . . . . . . . . . . . . . . . 58 43 (6) 15 (10) 444 544
Total finance receivables . . . . . . . . . . . . $3,362 $1,484 $669 $645 $686 $1,757 $8,603
Finance receivables often are repaid or refinanced prior to maturity. Accordingly, the above tabulation shouldnot be regarded as a forecast of future cash collections. Finance receivable receipts related to distribution financereceivables and revolving loans are based on historical cash flow experience. Finance receivable receipts related toleases and term loans are based on contractual cash flows.
Distribution finance receivables generally mature within one year. Distribution finance receivables are securedby the inventory of the financed distributor or dealer and, in some programs, by recourse arrangements with theoriginating manufacturer. Revolving loans and distribution finance receivables are cyclical and result in cashturnover that exceeds contractual maturities. In 2007, such cash turnover was two times contractual maturities.
Revolving loans generally have terms of one to five years, and at times convert to term loans that contractuallyamortize over an average term of four years. Revolving loans consist of loans secured by trade receivables,inventory, plant and equipment, pools of vacation interval resort notes receivables, finance receivable portfolios,pools of residential and recreational land loans and the underlying real property.
Installment contracts and Finance leases have initial terms ranging from two to twenty years. Installmentcontracts and finance leases are secured by the financed equipment and, in some instances, by the personalguarantee of the principals or recourse arrangements with the originating vendor. Contractual maturities of financeleases include residual values expected to be realized at contractual maturity. Leases with no significant residualvalue at the end of the contractual term are classified as installment contracts, as their legal and economic substanceis more equivalent to a secured borrowing than a finance lease with a significant residual value. Accordingly,contractual maturities of these contracts presented above represent the minimum lease payments, net of theunearned income to be recognized over the life of the lease. Total minimum lease payments and unearned incomerelated to these contracts were $1.0 billion and $315 million, respectively, at December 29, 2007, and $719 millionand $222 million, respectively, at December 30, 2006. Minimum lease payments due under these contracts for eachof the next five years and the aggregate amounts due thereafter are as follows: $173 million in 2008, $149 million in2009, $132 million in 2010, $141 million in 2011, $106 million in 2012 and $312 million thereafter.
Golf course mortgages have initial terms ranging from five to ten years with amortization periods from 15 to25 years. Resort mortgages generally represent construction and inventory loans with terms up to five years. Golfcourse and resort mortgages are secured by real property and are generally limited to 75% or less of the property’sappraised market value at loan origination. Golf course mortgages, totaling $1.1 billion, consist of loans with an
40

average balance of $5 million and a weighted-average remaining contractual maturity of five years. Resortmortgages, totaling $147 million, consist of loans with an average balance of $6 million and a weighted-averageremaining contractual maturity of three years.
Leveraged leases are secured by the ownership of the leased equipment and real property, and have initial termsup to approximately 30 years. Leveraged leases reflect contractual maturities net of contractual nonrecourse debtpayments and include residual values expected to be realized at contractual maturity.
Concentrations
Textron Financial’s finance receivables are diversified across geographic region, borrower industry and type ofcollateral. The Company does not track revenues by geographic region, as we believe managed finance receivablesby geographic location is a more meaningful concentration measurement. Textron Financial’s geographic con-centrations (as measured by managed finance receivables) were as follows:
2007 2006(Dollars in millions)
United States:
Southeast . . . . . . . . . . . . . . . . . . . . . . . . . . . . . . . . . . . . . . . . . . . . . . . $ 2,782 25% $ 2,582 25%
West . . . . . . . . . . . . . . . . . . . . . . . . . . . . . . . . . . . . . . . . . . . . . . . . . . 1,823 16% 1,776 17%
Southwest . . . . . . . . . . . . . . . . . . . . . . . . . . . . . . . . . . . . . . . . . . . . . . 1,546 14% 1,295 13%
Midwest . . . . . . . . . . . . . . . . . . . . . . . . . . . . . . . . . . . . . . . . . . . . . . . 1,306 12% 1,493 15%
Mideast . . . . . . . . . . . . . . . . . . . . . . . . . . . . . . . . . . . . . . . . . . . . . . . . 974 9% 1,010 10%
Northeast . . . . . . . . . . . . . . . . . . . . . . . . . . . . . . . . . . . . . . . . . . . . . . . 289 2% 312 3%
Total United States . . . . . . . . . . . . . . . . . . . . . . . . . . . . . . . . . . . . . . $ 8,720 78% $ 8,468 83%
Canada . . . . . . . . . . . . . . . . . . . . . . . . . . . . . . . . . . . . . . . . . . . . . . . . . . 1,062 10% 719 7%
Mexico . . . . . . . . . . . . . . . . . . . . . . . . . . . . . . . . . . . . . . . . . . . . . . . . . . 383 3% 324 3%
South America . . . . . . . . . . . . . . . . . . . . . . . . . . . . . . . . . . . . . . . . . . . . 342 3% 337 3%
Other international . . . . . . . . . . . . . . . . . . . . . . . . . . . . . . . . . . . . . . . . . . 616 6% 393 4%
Total managed finance receivables . . . . . . . . . . . . . . . . . . . . . . . . . . $11,123 100% $10,241 100%
Textron Financial’s industry concentrations (as measured by managed finance receivables) were as follows:
2007 2006(Dollars in millions)
General aviation . . . . . . . . . . . . . . . . . . . . . . . . . . . . . . . . . . . . . . . . . . . $ 2,475 22% $ 1,966 19%
Golf . . . . . . . . . . . . . . . . . . . . . . . . . . . . . . . . . . . . . . . . . . . . . . . . . . . . 1,680 15% 1,567 16%
Resort . . . . . . . . . . . . . . . . . . . . . . . . . . . . . . . . . . . . . . . . . . . . . . . . . . . 1,506 13% 1,295 13%
Recreational vehicles . . . . . . . . . . . . . . . . . . . . . . . . . . . . . . . . . . . . . . . . 1,116 10% 960 9%
Marine . . . . . . . . . . . . . . . . . . . . . . . . . . . . . . . . . . . . . . . . . . . . . . . . . . 783 7% 552 5%
Manufactured housing . . . . . . . . . . . . . . . . . . . . . . . . . . . . . . . . . . . . . . . 487 4% 527 5%
Transportation . . . . . . . . . . . . . . . . . . . . . . . . . . . . . . . . . . . . . . . . . . . . . 437 4% 441 4%
Finance company services . . . . . . . . . . . . . . . . . . . . . . . . . . . . . . . . . . . . 318 3% 235 2%
Outdoor power equipment . . . . . . . . . . . . . . . . . . . . . . . . . . . . . . . . . . . . 301 3% 304 3%
Information technology equipment . . . . . . . . . . . . . . . . . . . . . . . . . . . . . . 220 2% 209 2%
Real estate . . . . . . . . . . . . . . . . . . . . . . . . . . . . . . . . . . . . . . . . . . . . . . . 170 2% 178 2%
Other. . . . . . . . . . . . . . . . . . . . . . . . . . . . . . . . . . . . . . . . . . . . . . . . . . . . 1,630 15% 2,007 20%
Total managed finance receivables . . . . . . . . . . . . . . . . . . . . . . . . . . . . $11,123 100% $10,241 100%
41

Leveraged Leases
2007 2006(In millions)
Rental receivable . . . . . . . . . . . . . . . . . . . . . . . . . . . . . . . . . . . . . . . . . . . . . . . . . . . . . . $ 1,561 $ 1,838
Nonrecourse debt . . . . . . . . . . . . . . . . . . . . . . . . . . . . . . . . . . . . . . . . . . . . . . . . . . . . . . (1,030) (1,292)
Estimated residual values of leased assets . . . . . . . . . . . . . . . . . . . . . . . . . . . . . . . . . . . . 297 329
828 875
Less unearned income. . . . . . . . . . . . . . . . . . . . . . . . . . . . . . . . . . . . . . . . . . . . . . . . . . . (284) (260)
Investment in leveraged leases. . . . . . . . . . . . . . . . . . . . . . . . . . . . . . . . . . . . . . . . . . . . . 544 615
Deferred income taxes . . . . . . . . . . . . . . . . . . . . . . . . . . . . . . . . . . . . . . . . . . . . . . . . . . (408) (410)
Net investment in leveraged leases . . . . . . . . . . . . . . . . . . . . . . . . . . . . . . . . . . . . . . . . . $ 136 $ 205
At December 29, 2007 and December 30, 2006, approximately 25% and 23% of Textron Financial’sinvestment in leveraged leases was collateralized by real estate, respectively.
The components of income from leveraged leases were as follows:
2007 2006 2005(In millions)
Income recognized . . . . . . . . . . . . . . . . . . . . . . . . . . . . . . . . . . . . . . . . . . . . . . . . . . . . $11 $ 39 $ 33
Income tax expense . . . . . . . . . . . . . . . . . . . . . . . . . . . . . . . . . . . . . . . . . . . . . . . . . . . (4) (11) (11)
Income from leveraged leases . . . . . . . . . . . . . . . . . . . . . . . . . . . . . . . . . . . . . . . . . . . . $ 7 $ 28 $ 22
In the first quarter of 2007, the Company adopted FASB Staff Position No. 13-2 “Accounting for a Change orProjected Change in the Timing of Cash Flows Relating to Income Taxes Generated by a Leveraged LeaseTransaction” (“FSP 13-2”). FSP 13-2 requires a recalculation of returns on leveraged leases if there is a change orprojected change in the timing of cash flows related to income taxes generated by the leveraged leases. Uponadoption, the impact of the estimated change in projected cash flows must be reported as an adjustment to theCompany’s net leveraged lease investment and retained earnings. We have leveraged leases with an initialinvestment balance of $209 million which could be impacted by changes in the timing of cash flows related toincome taxes as discussed in Note 17 Contingencies. The adoption of FSP 13-2 resulted in a $50 million reductionin Leveraged leases, a $17 million reduction in liabilities recorded within Deferred income taxes and a $33 millionCumulative effect of a change in accounting principle that reduced Retained earnings.
The recalculation of leveraged lease earnings in connection with the adoption of FSP 13-2 also reduced theCompany’s ongoing yield on the leveraged lease investment, which resulted in an $8 million decrease in leveragedlease earnings for the year ended December 29, 2007. The impact of any future projected changes in the timing ofcash flows related to income taxes will be recognized in Finance charges in the Company’s Consolidated Statementsof Income.
Finance Leases
2007 2006(In millions)
Total minimum lease payments receivable . . . . . . . . . . . . . . . . . . . . . . . . . . . . . . . . . . . . . . . $ 568 $ 517
Estimated residual values of leased equipment . . . . . . . . . . . . . . . . . . . . . . . . . . . . . . . . . . . 267 267
835 784
Less unearned income . . . . . . . . . . . . . . . . . . . . . . . . . . . . . . . . . . . . . . . . . . . . . . . . . . . . . (222) (194)
Net investment in finance leases . . . . . . . . . . . . . . . . . . . . . . . . . . . . . . . . . . . . . . . . . . . . . . $ 613 $ 590
42

Minimum lease payments due under finance leases for each of the next five years and the aggregate amountsdue thereafter are as follows: $156 million in 2008, $113 million in 2009, $75 million in 2010, $46 million in 2011,$8 million in 2012 and $170 million thereafter.
Loan Impairment
Textron Financial periodically evaluates finance receivables, excluding homogeneous loan portfolios andfinance leases, for impairment. A loan is considered impaired when it is probable that the Company will be unableto collect all amounts due according to the contractual terms of the loan agreement. In addition, the Companyidentifies loans that are considered impaired due to the significant modification of the original loan terms to reflectdeferred principal payments generally at market interest rates, but which continue to accrue finance charges sincefull collection of principal and interest is not doubtful. Nonaccrual finance receivables include impaired nonaccrualfinance receivables and accounts in homogeneous portfolios that are contractually delinquent by more than threemonths.
2007 2006(In millions)
Impaired nonaccrual finance receivables . . . . . . . . . . . . . . . . . . . . . . . . . . . . . . . . . . . . . . . . . $ 59 $ 60
Impaired accrual finance receivables . . . . . . . . . . . . . . . . . . . . . . . . . . . . . . . . . . . . . . . . . . . . 143 101
Total impaired finance receivables. . . . . . . . . . . . . . . . . . . . . . . . . . . . . . . . . . . . . . . . . . . . . . $202 $161
Impaired nonaccrual finance receivables with identified reserve requirements . . . . . . . . . . . . . . $ 40 $ 36
Allowance for losses on impaired nonaccrual finance receivables . . . . . . . . . . . . . . . . . . . . . . . $ 15 $ 17
Nonperforming assets include nonaccrual finance receivables and repossessed assets and properties, which arerecorded in Other assets.
2007 2006(In millions)
Impaired nonaccrual finance receivables . . . . . . . . . . . . . . . . . . . . . . . . . . . . . . . . . . . . . . . . . $ 59 $ 60
Nonaccrual homogeneous finance receivables . . . . . . . . . . . . . . . . . . . . . . . . . . . . . . . . . . . . . 20 15
Total nonaccrual finance receivables . . . . . . . . . . . . . . . . . . . . . . . . . . . . . . . . . . . . . . . . . . . . 79 75
Repossessed assets and properties . . . . . . . . . . . . . . . . . . . . . . . . . . . . . . . . . . . . . . . . . . . . . . 44 38
Total nonperforming assets . . . . . . . . . . . . . . . . . . . . . . . . . . . . . . . . . . . . . . . . . . . . . . . . . . . $123 $113
The average recorded investment in impaired nonaccrual finance receivables was $53 million in 2007,$74 million in 2006 and $77 million in 2005. The average recorded investment in impaired accrual financereceivables amounted to $31 million in 2007, $68 million in 2006 and $29 million in 2005. The increase in impairedaccrual finance receivables in 2007 primarily reflects one restructured loan in Asset-Based Lending.
Nonaccrual finance receivables resulted in Textron Financial’s finance charges being reduced by $7 million,$13 million and $11 million for 2007, 2006 and 2005, respectively. No finance charges were recognized using thecash basis method.
Textron Financial has a performance guarantee from Textron for leases with the U.S. and Canadian subsid-iaries of Collins & Aikman Corporation (“C&A”). In 2005, C&A filed for bankruptcy protection and the lease termsexpired. During the fourth quarter of 2007, C&A ceased making lease payments and under its performanceguarantee, Textron made a $20 million payment to the Company, which was utilized to reduce the outstandingbalance. The outstanding balance on these leases totaled $23 million at the end of 2007 and $61 million at the end of2006. The Company expects to collect the $23 million outstanding balance through sales of both repossessedcollateral and real estate, the appraised value of which approximates the outstanding balance. We have not classifiedthese leases as nonaccrual due to the performance guarantee from Textron.
43

Allowance for Losses on Finance Receivables
The following table presents changes in the Allowance for losses on finance receivables.
2007 2006 2005(In millions)
Balance at beginning of year . . . . . . . . . . . . . . . . . . . . . . . . . . . . . . . . . . . . . . . . . . . . $ 93 $ 96 $ 99
Provision for losses . . . . . . . . . . . . . . . . . . . . . . . . . . . . . . . . . . . . . . . . . . . . . . . . . . . 33 26 29
Charge-offs . . . . . . . . . . . . . . . . . . . . . . . . . . . . . . . . . . . . . . . . . . . . . . . . . . . . . . . . . (49) (40) (49)
Recoveries. . . . . . . . . . . . . . . . . . . . . . . . . . . . . . . . . . . . . . . . . . . . . . . . . . . . . . . . . . 12 11 17
Balance at end of year . . . . . . . . . . . . . . . . . . . . . . . . . . . . . . . . . . . . . . . . . . . . . . . . . $ 89 $ 93 $ 96
Managed and Serviced Finance Receivables
Textron Financial manages and services finance receivables for a variety of investors, participants and third-party portfolio owners. Managed and serviced finance receivables are summarized as follows:
2007 2006(In millions)
Total managed and serviced finance receivables . . . . . . . . . . . . . . . . . . . . . . . . . . . . . . . $12,478 $11,536
Nonrecourse participations . . . . . . . . . . . . . . . . . . . . . . . . . . . . . . . . . . . . . . . . . . . . . . . (760) (695)
Third-party portfolio servicing . . . . . . . . . . . . . . . . . . . . . . . . . . . . . . . . . . . . . . . . . . . . (592) (581)
Small business administration sales agreements . . . . . . . . . . . . . . . . . . . . . . . . . . . . . . . (3) (19)
Total managed finance receivables . . . . . . . . . . . . . . . . . . . . . . . . . . . . . . . . . . . . . . . . . 11,123 10,241
Securitized receivables. . . . . . . . . . . . . . . . . . . . . . . . . . . . . . . . . . . . . . . . . . . . . . . . . . (2,520) (1,931)
Owned receivables. . . . . . . . . . . . . . . . . . . . . . . . . . . . . . . . . . . . . . . . . . . . . . . . . . . . . $ 8,603 $ 8,310
Third-party portfolio servicing largely relates to finance receivable portfolios of resort developers and loanportfolio servicing for third-party financial institutions.
Nonrecourse participations consist of undivided interests in loans originated by Textron Financial, primarily inResort Finance, Distribution Finance and Golf Finance, which are sold to independent investors.
In connection with the sale of a note receivable in 2005, the Company indemnified the purchaser againstpotential losses in limited circumstances. The maximum potential exposure of the indemnity is estimated to be$29 million, but due to the extremely low probability of occurrence and several other mitigating factors, including aspecific indemnification from the original note issuer, no significant fair value has been attributed to the indemnity.
Owned receivables include approximately $119 million and $144 million of finance receivables that wereunfunded at December 29, 2007 and December 30, 2006, respectively, primarily as a result of holdback arrange-ments and payables to manufacturers for inventory financed by dealers. The corresponding liability is included inAccrued interest and other liabilities on Textron Financial’s Consolidated Balance Sheets.
NOTE 6 Receivable Securitizations
During 2007, the Company securitized distribution finance receivables (dealer financing arrangements) andgeneral aviation loans. The Company recognized pre-tax gains as a result of these transactions. These gainsrepresent estimates of the cash flows to be received from the Company’s retained interests in the loans sold. Theretained interests are recorded in Other assets and are in the form of interest-only strips, subordinate sellercertificates and rights to receive servicing fees, which range from 75 to 150 basis points. These interests aretypically subordinate to the interests of third-party investors and therefore realization of the Company’s cash flowsis subject to the performance of the receivables sold as compared with the estimates utilized to measure the initialgain. The investors and the securitization trusts have no recourse to the Company’s assets for failure of debtors topay when due.
44

The table below summarizes net pre-tax gains recognized and certain cash flows received from and paid tosecuritization trusts during the years ended December 29, 2007, December 30, 2006 and December 31, 2005,respectively. Proceeds from securitizations includes proceeds received related to incremental increases in the levelof Distribution finance receivables sold and excludes amounts received related to the ongoing replenishment of theoutstanding sold balance of these receivables with short durations.
2007 2006 2005(In millions)
Net pre-tax gains . . . . . . . . . . . . . . . . . . . . . . . . . . . . . . . . . . . . . . . . . . . . . . . . . . . . . $ 62 $42 $ 49
Proceeds from securitizations . . . . . . . . . . . . . . . . . . . . . . . . . . . . . . . . . . . . . . . . . . . . $731 $50 $361
Cash flows received on retained interests . . . . . . . . . . . . . . . . . . . . . . . . . . . . . . . . . . . 71 63 64
Servicing fees received . . . . . . . . . . . . . . . . . . . . . . . . . . . . . . . . . . . . . . . . . . . . . . . . 32 27 28
Cash paid for loan repurchases . . . . . . . . . . . . . . . . . . . . . . . . . . . . . . . . . . . . . . . . . . 17 15 26
Included in net pre-tax gains above are impairment losses of $3 million and $1 million for the years 2007 and2006, respectively. There were no impairment charges incurred during 2005.
Distribution Finance
The Company had $152 million and $111 million of retained interests associated with $2.0 billion and$1.4 billion of receivables in the Distribution Finance securitization as of December 29, 2007 and December 30,2006, respectively. These receivables represent loans secured by dealer inventories that are typically collected uponthe sale of the underlying product. The proceeds from collection of the principal balance of these loans are used bythe securitization trust to purchase additional receivables from the Company each month. Gains recognized on thesecuritization of Distribution Finance receivables were $58 million, $42 million and $40 million during the years2007, 2006, and 2005, respectively. For 2007, the key economic assumptions used in measuring the retainedinterests related to the Distribution Finance receivable securitizations and the sensitivities to these assumptions arepresented as follows:
Assumptions atDate of Sale
Assumptions atYear-End
10%AdverseChange
20%AdverseChange
Weighted-average life (in years). . . . . . . . . . . . . . . . . . . . 0.4 0.4 — —
Expected credit losses (annual rate) . . . . . . . . . . . . . . . . . 1.0% 0.9% (2) (4)
Residual cash flows discount rate. . . . . . . . . . . . . . . . . . . 9.9% 9.4% — —
Monthly payment rate . . . . . . . . . . . . . . . . . . . . . . . . . . . 19.1% 19.6% (2) (3)
Aviation Finance
The Company had $41 million and $56 million of retained interests associated with $450 million and$444 million receivables sold in the Aviation Finance securitization as of December 29, 2007 and December 30,2006, respectively. Gains recognized on the securitization of Aviation Finance receivables were $4 million and$6 million during the years 2007 and 2005, respectively. For 2007, the key economic assumptions used in measuringthe retained interests related to the Aviation Finance receivable securitizations and the sensitivities to theseassumptions are presented as follows:
Assumptions atDate of Sale
Assumptions atYear-End
10%AdverseChange
20%AdverseChange
Weighted-average life (in years). . . . . . . . . . . . . . . . . . . . 2.2 2.0 — —
Expected credit losses (annual rate) . . . . . . . . . . . . . . . . . 0.5% 0.2% — (1)
Residual cash flows discount rate. . . . . . . . . . . . . . . . . . . 7.7% 9.6% (1) (1)
Prepayment rate . . . . . . . . . . . . . . . . . . . . . . . . . . . . . . . 27.0% 27.0% (1) (2)
The sensitivities presented in the tables above are hypothetical and should be used with caution. As the figuresindicate, changes in fair value based on a 10% variation in assumptions generally cannot be extrapolated because
45

the relationship of the change in assumption to the change in fair value may not be linear. Also, in this table, theeffect of a variation in a particular assumption on the fair value of the retained interest is calculated withoutchanging any other assumption, when in reality, changes in one factor may result in another that may magnify orcounteract the analysis’ losses, such as increases in market interest rates may result in lower prepayments andincreased credit losses.
Historical loss and delinquency amounts for Textron Financial’s securitized portfolio and all similarlymanaged owned receivables for the year ended December 29, 2007, were as follows:
Type of Finance Receivable
TotalPrincipalAmountof Loans
and Leases
AggregateContractValue 60
Days or MorePast Due
60+ DayDelinquencyPercentage
AverageBalances
Net CreditLosses
CreditLossesAnnual
PercentageAt December 29, 2007 Year Ended December 29, 2007
(Dollars in millions)
Distribution finance receivables . . . . . . $3,812 $ 8 0.2% $3,821 $19 0.5%
Aviation finance receivables. . . . . . . . . 2,448 24 1.0% 2,140 1 0.1%
Total loans held and securitized . . . . $6,260 $32 $5,961 $20
Consisting of:Loans held in portfolio . . . . . . . . . . . . $3,781 $15
Loans securitized. . . . . . . . . . . . . . . . . 2,479 17
Total loans held and securitized . . . . $6,260 $32
Static pool losses are not calculated by the Company for revolving period securitizations, which encompassnearly 100% of the securitized portfolio outstanding, as receivables are added to the portfolio on a continual basisand are not tracked as discrete pools. Therefore, loss rates for the entire portfolio as presented in the table above aremore relevant as a measure of the performance of retained interests related to revolving period securitizations.
NOTE 7 Equipment on Operating Leases
2007 2006(In millions)
Equipment on operating leases, at cost:
Aircraft . . . . . . . . . . . . . . . . . . . . . . . . . . . . . . . . . . . . . . . . . . . . . . . . . . . . . . . . . . . . . . . $279 $253
Golf cars . . . . . . . . . . . . . . . . . . . . . . . . . . . . . . . . . . . . . . . . . . . . . . . . . . . . . . . . . . . . . . 28 24
Accumulated depreciation:
Aircraft . . . . . . . . . . . . . . . . . . . . . . . . . . . . . . . . . . . . . . . . . . . . . . . . . . . . . . . . . . . . . . . (43) (34)
Golf cars . . . . . . . . . . . . . . . . . . . . . . . . . . . . . . . . . . . . . . . . . . . . . . . . . . . . . . . . . . . . . . (5) (5)
Equipment on operating leases — net . . . . . . . . . . . . . . . . . . . . . . . . . . . . . . . . . . . . . . . . . . . $259 $238
Initial lease terms of equipment on operating leases range from one year to ten years. Future minimum rentalsat December 29, 2007 are $28 million in 2008, $23 million in 2009, $22 million in 2010, $19 million in 2011,$15 million in 2012 and $30 million thereafter.
NOTE 8 Goodwill
2007 2006(In millions)
Resort Finance . . . . . . . . . . . . . . . . . . . . . . . . . . . . . . . . . . . . . . . . . . . . . . . . . . . . . . . . . . . . $110 $110
Asset-Based Lending . . . . . . . . . . . . . . . . . . . . . . . . . . . . . . . . . . . . . . . . . . . . . . . . . . . . . . . 43 43
Aviation Finance . . . . . . . . . . . . . . . . . . . . . . . . . . . . . . . . . . . . . . . . . . . . . . . . . . . . . . . . . . 16 16
$169 $169
46

NOTE 9 Other Assets2007 2006
(In millions)
Retained interests in securitizations . . . . . . . . . . . . . . . . . . . . . . . . . . . . . . . . . . . . . . . . . . . . . $203 $179
Other long-term investments . . . . . . . . . . . . . . . . . . . . . . . . . . . . . . . . . . . . . . . . . . . . . . . . . . 52 40
Repossessed assets and properties . . . . . . . . . . . . . . . . . . . . . . . . . . . . . . . . . . . . . . . . . . . . . . 44 38
Fixed assets — net . . . . . . . . . . . . . . . . . . . . . . . . . . . . . . . . . . . . . . . . . . . . . . . . . . . . . . . . . 33 34
Investment in equipment residuals . . . . . . . . . . . . . . . . . . . . . . . . . . . . . . . . . . . . . . . . . . . . . . — 3
Other . . . . . . . . . . . . . . . . . . . . . . . . . . . . . . . . . . . . . . . . . . . . . . . . . . . . . . . . . . . . . . . . . . . 49 35
Total other assets . . . . . . . . . . . . . . . . . . . . . . . . . . . . . . . . . . . . . . . . . . . . . . . . . . . . . . . . $381 $329
Interest-only securities within retained interest in securitizations were $43 million and $51 million atDecember 29, 2007 and December 30, 2006, respectively.
Other long-term investments and Repossessed assets and properties include assets received in satisfaction oftroubled loans. Declines in the value of these assets subsequent to receipt are recorded as impairment charges in theOther component of Other income.
The Investment in equipment residuals represents the remaining equipment residual values associated withequipment lease payments that were sold.
The Other category primarily represents the fair value of derivative instruments, debt acquisition costs, and anintangible asset, which is being amortized over its contractual term of five years.
47
NOTE 10 Debt and Credit Facilities
2007 2006(In millions)
Short-term debt:Commercial paper . . . . . . . . . . . . . . . . . . . . . . . . . . . . . . . . . . . . . . . . . . . . . . . . . . . . . $1,447 $1,719Other short-term debt . . . . . . . . . . . . . . . . . . . . . . . . . . . . . . . . . . . . . . . . . . . . . . . . . . 14 60
Total short-term debt . . . . . . . . . . . . . . . . . . . . . . . . . . . . . . . . . . . . . . . . . . . . . . . . . 1,461 1,779Long-term debt:
Fixed-rate notesDue 2007 (weighted-average rate of 5.50%) . . . . . . . . . . . . . . . . . . . . . . . . . . . . . . . . — 843Due 2008 (weighted-average rates of 4.15% and 4.12%, respectively) . . . . . . . . . . . . . 654 611Due 2009 (weighted-average rates of 5.60% and 5.67%, respectively) . . . . . . . . . . . . . 726 649Due 2010 (weighted-average rates of 4.83% and 4.58%, respectively) . . . . . . . . . . . . . 1,007 557Due 2011 (weighted-average rates of 5.05% and 5.05%, respectively) . . . . . . . . . . . . . 442 442Due 2012 and thereafter (weighted-average rates of 5.03% and 4.98%, respectively) . . 219 209
Total fixed-rate notes . . . . . . . . . . . . . . . . . . . . . . . . . . . . . . . . . . . . . . . . . . . . . . . 3,048 3,311Variable-rate notes
Due 2007 (weighted-average rate of 5.80%) . . . . . . . . . . . . . . . . . . . . . . . . . . . . . . . . — 275Due 2008 (weighted-average rates of 5.05% and 5.45%, respectively) . . . . . . . . . . . . . 605 355Due 2009 (weighted-average rates of 5.09% and 5.47%, respectively) . . . . . . . . . . . . . 825 913Due 2010 (weighted-average rates of 5.06% and 5.49%, respectively) . . . . . . . . . . . . . 906 276Due 2011 (weighted-average rate of 5.02%) . . . . . . . . . . . . . . . . . . . . . . . . . . . . . . . . 150 —
Total variable-rate notes . . . . . . . . . . . . . . . . . . . . . . . . . . . . . . . . . . . . . . . . . . . . . 2,486 1,819Subordinated debt:
Due 2017 and thereafter (6.00%) . . . . . . . . . . . . . . . . . . . . . . . . . . . . . . . . . . . . . . . . 300 —
Unamortized discount . . . . . . . . . . . . . . . . . . . . . . . . . . . . . . . . . . . . . . . . . . . . . . . . (4) (3)Fair value adjustments . . . . . . . . . . . . . . . . . . . . . . . . . . . . . . . . . . . . . . . . . . . . . . . . 20 (44)
Total long-term debt and subordinated debt . . . . . . . . . . . . . . . . . . . . . . . . . . . . . . . 5,850 5,083
Total debt . . . . . . . . . . . . . . . . . . . . . . . . . . . . . . . . . . . . . . . . . . . . . . . . . . . . . . $7,311 $6,862
We have a policy of maintaining unused committed bank lines of credit in an amount not less than outstandingcommercial paper balances. Since Textron Financial is permitted to borrow under Textron’s multi-year facility,these lines of credit include both Textron Financial’s multi-year facility and Textron’s multi-year facility. Thesefacilities are in support of commercial paper and letter of credit issuances only, and neither of these lines of creditwas drawn at December 29, 2007 or December 30, 2006.
The Company’s committed credit facilities at December 29, 2007 were as follows:
Facility Amount
CommercialPaper
Outstanding
Letters of CreditIssued Under
Facility
Amount NotReserved asSupport for
Commercial Paperand Letters of
Credit(In millions)
Textron Financial multi-year facilityexpiring in 2012 . . . . . . . . . . . . . . . . . . $1,750 $1,447 $13 $ 290
Textron multi-year facility expiring in2012 . . . . . . . . . . . . . . . . . . . . . . . . . . . 1,250 — 22 1,228
Total . . . . . . . . . . . . . . . . . . . . . . . . . . . $3,000 $1,447 $35 $1,518
48

The weighted-average interest rates on short-term borrowings at year-end were as follows:
2007 2006 2005
Commercial paper:
U.S. . . . . . . . . . . . . . . . . . . . . . . . . . . . . . . . . . . . . . . . . . . . . . . . . . . . . . . . . . . . . . 5.20% 5.39% 4.38%
Canadian . . . . . . . . . . . . . . . . . . . . . . . . . . . . . . . . . . . . . . . . . . . . . . . . . . . . . . . . . 4.59% 4.34% —
Other short-term debt . . . . . . . . . . . . . . . . . . . . . . . . . . . . . . . . . . . . . . . . . . . . . . . . . . 4.92% 4.46% 4.31%
The combined weighted-average interest rates on these borrowings during the last three years were 5.16% in2007, 5.02% in 2006 and 3.32% in 2005. The weighted-average interest rates on short-term borrowings have beendetermined by relating the annualized interest cost to the daily average dollar amounts outstanding.
During the first quarter of 2007, we issued $300 million of 6% Fixed-to-Floating Rate Junior SubordinatedNotes, which are unsecured and rank junior to all of our existing and future senior debt. The notes mature onFebruary 15, 2067; however, we have the right to redeem the notes at par on or after February 15, 2017, and areobligated to redeem the notes beginning on February 15, 2042. Pursuant to the terms of the notes or the replacementcapital covenant described below, any redemption of the notes must be made from the sale of certain replacementcapital securities or a capital contribution from Textron. Interest on the notes is fixed at 6% until February 15, 2017,and floats at three-month LIBOR + 1.735% thereafter. We may defer payment of interest on one or more occasions,in each case, for a period of up to 10 years.
We agreed, in a replacement capital covenant for the benefit of the holders of a specified class of covered debt,that we will not redeem the notes on or before February 15, 2047, unless we have received a capital contributionfrom Textron and/or net proceeds from the sale of certain replacement capital securities in certain specifiedamounts. The initial class of covered debtholders are the holders of the Company’s 5.125% Medium Term Notes,Series E, due August 15, 2014, in the principal amount of $100 million.
The Company had interest rate exchange agreements related to the conversion of fixed-rate debt to variable-rate debt of $2.3 billion and $3.0 billion at December 29, 2007 and December 30, 2006, respectively, whereby theCompany makes periodic floating-rate payments in exchange for periodic fixed-rate receipts. The weighted-average rate of these interest rate exchange agreements was 6.09% and 5.79% for the years ended December 29,2007 and December 30, 2006, respectively. The weighted-average rate on remaining fixed-rate notes not subject tointerest rate exchange agreements was 5.60% and 5.47% for the years ended December 29, 2007 and December 30,2006, respectively.
Interest on Textron Financial’s variable-rate notes is predominantly tied to the three-month LIBOR forU.S. dollar deposits. The weighted-average interest rates on these notes before consideration of the effect of interestrate exchange agreements were 5.59% and 5.52% during 2007 and 2006, respectively.
Securitizations are an important source of liquidity for Textron Financial and involve the periodic transfer offinance receivables to qualified special purpose trusts. The outstanding amount of debt issued by these qualifiedspecial purpose trusts was $2.3 billion and $1.8 billion at December 29, 2007 and December 30, 2006, respectively.
Through its subsidiary, Textron Financial Canada Funding Corp. (“Textron Canada Funding”), the Companyperiodically issues debt securities. Textron Financial owns 100% of the common stock of Textron Canada Funding.Textron Canada Funding is a financing subsidiary of Textron Financial with operations, revenues and cash flowsrelated to the issuance, administration and repayment of debt securities that are fully and unconditionallyguaranteed by Textron Financial.
The amount of net assets available for dividends and other payments to Textron is restricted by the terms of theCompany’s lending agreements. At December 29, 2007, $249 million of net assets were available to be transferredto Textron under the most restrictive covenant. The lending agreements contain various restrictive provisionsregarding additional debt (not to exceed nine times consolidated net worth and qualifying subordinated obliga-tions), minimum net worth ($200 million), the creation of liens and the maintenance of a fixed charges coverageratio (no less than 125%). For the years ended December 29, 2007 and December 30, 2006, the Company declaredand paid dividends to Textron of $144 million and $89 million, respectively.
49

Cash payments made by Textron Financial for interest were $388 million in 2007, $341 million in 2006 and$204 million in 2005.
NOTE 11 Derivative Financial Instruments
Textron Financial utilizes derivative instruments to mitigate its exposure to fluctuations in interest rates andforeign currencies. These instruments include interest rate exchange agreements, foreign currency exchangeagreements and interest rate cap and floor agreements. The Company does not hold or issue derivative financialinstruments for trading or speculative purposes. The Company did not experience a significant net gain or loss inearnings as a result of the ineffectiveness, or the exclusion of any component from its assessment of hedgeeffectiveness, of its derivative financial instruments in 2007 and 2006.
The following table summarizes the Company’s derivative activities relating to interest rate risk:
Hedged Item Hedge Classification Description 2007 2006 2007 2006Notional Amount
Fair ValueAmount
(In millions)
Interest RateExchange Agreements
Fixed-rate debt Fair Value Converts fixed-rateinterest expense tofloating-rate interestexpense
$2,293 $3,162 $19 $(44)
Firm commitments Fair Value Mitigates changes in fairvalue of receivablesubsequent to loancommitment
37 31 (1) (1)
Fixed-rate receivables Fair Value Converts fixed-rateinterest earnings tofloating-rate interestearnings
— 15 — —
Retained interests insecuritizations
Cash Flow Converts net residualfloating-rate cash flowsto fixed-rate cash flows
26 71 — —
Variable-rate debt Cash Flow Converts floating-rateinterest expense tofixed-rate interestexpense
— 100 — 1
Receivable cap Cash Flow Mitigates changes in fairvalue of receivablecontaining embeddedoption
— 7 — —
$2,356 $3,386 $18 $(44)
The Company manages its foreign currency exposure by funding most foreign currency denominated assetswith liabilities in the same currency. The Company may enter into foreign currency exchange agreements to convertforeign currency denominated assets, liabilities and cash flows into functional currency denominated assets,liabilities and cash flows. In addition, as part of managing our foreign currency exposure, the Company may enterinto foreign currency forward exchange contracts. The objective of such agreements is to manage any remainingforeign currency exposures to changes in currency rates. The notional amounts outstanding for these agreementswere $21 million at December 29, 2007, and $87 million at December 30, 2006. These agreements had aninsignificant value at December 29, 2007. At December 30, 2006, these agreements had a fair value of $(9) million.
In relation to one of the Company’s asset-backed securitizations, Textron Financial enters into back-to-backinterest rate exchange agreements with both third-party financial institutions and commercial customers of the
50

Resort Finance Segment. These instruments are designed to have an equal and offsetting impact to the Companyand transfer the risk of differences between actual and scheduled cash flows related to the receivables sold from thefinancial institution to the commercial customers who originated the loan contracts sold. Since these instruments areutilized by Textron Financial to facilitate the securitization transaction rather than mitigate interest rate risk to theCompany, they are not designated in hedging relationships. These instruments had no significant impact to theCompany’s earnings in 2007, as gains and losses on these back-to-back interest rate exchange agreements offset.
NOTE 12 Investment in Parent Company Preferred Stock
On April 12, 2000, Textron made a $25 million noncash capital contribution to Textron Financial consisting ofall of the outstanding shares of Textron Funding Corporation (Textron Funding), a related corporate holdingcompany. Textron Funding’s only asset is 1,522 shares of Textron Inc. Series D cumulative preferred stock, bearingan annual dividend yield of 5.92%. The preferred stock, which has a face value of $152 million, is carried at itsoriginal cost of $25 million and is presented in a manner similar to treasury stock for financial reporting purposes.Dividends on the preferred stock are treated as additional capital contributions from Textron.
NOTE 13 Accumulated Other Comprehensive Income (Loss)
Accumulated other comprehensive income (loss) is summarized as follows:
ForeignCurrency
TranslationAdjustment
Deferred(Losses)Gains on
HedgeContracts
DeferredGains
(Losses) onSecurities Total
(In millions)
Balance January 1, 2005 . . . . . . . . . . . . . . . . . . . . . . . . . . . . . . $ 8 $ (9) $ 2 $ 1
Foreign currency translation . . . . . . . . . . . . . . . . . . . . . . . . . . (1) — — (1)
Amortization of deferred loss on terminated hedge contracts,net of income taxes of $3 million . . . . . . . . . . . . . . . . . . . . . — 5 — 5
Net deferred loss on hedge contracts, net of income tax benefitof $2 million . . . . . . . . . . . . . . . . . . . . . . . . . . . . . . . . . . . . — (5) — (5)
Net deferred gain on interest-only securities, net of incometaxes of $2 million . . . . . . . . . . . . . . . . . . . . . . . . . . . . . . . — — 5 5
Balance December 31, 2005 . . . . . . . . . . . . . . . . . . . . . . . . . . . 7 (9) 7 5
Foreign currency translation . . . . . . . . . . . . . . . . . . . . . . . . . . 1 — — 1
Amortization of deferred loss on terminated hedge contracts,net of income taxes of $2 million . . . . . . . . . . . . . . . . . . . . . — 4 — 4
Net deferred gain on hedge contracts, net of income taxes of$1 million . . . . . . . . . . . . . . . . . . . . . . . . . . . . . . . . . . . . . . — 1 — 1
Net deferred loss on interest-only securities, net of income taxbenefit of $2 million . . . . . . . . . . . . . . . . . . . . . . . . . . . . . . — — (4) (4)
Balance December 30, 2006 . . . . . . . . . . . . . . . . . . . . . . . . . . . 8 (4) 3 7
Foreign currency translation . . . . . . . . . . . . . . . . . . . . . . . . . . 19 — — 19
Amortization of deferred loss on terminated hedge contracts,net of income taxes of $3 million . . . . . . . . . . . . . . . . . . . . . — 5 — 5
Net deferred loss on hedge contracts, net of income tax benefitof $2 million . . . . . . . . . . . . . . . . . . . . . . . . . . . . . . . . . . . . — (3) — (3)
Net deferred loss on interest-only securities, net of income taxbenefit of $1 million . . . . . . . . . . . . . . . . . . . . . . . . . . . . . . — — (2) (2)
Balance December 29, 2007 . . . . . . . . . . . . . . . . . . . . . . . . . . . $27 $ (2) $ 1 $26
51

NOTE 14 Income Taxes
Income from continuing operations before income taxes:
2007 2006 2005(In millions)
United States . . . . . . . . . . . . . . . . . . . . . . . . . . . . . . . . . . . . . . . . . . . . . . . . . . . . . . . $206 $198 $168
Foreign . . . . . . . . . . . . . . . . . . . . . . . . . . . . . . . . . . . . . . . . . . . . . . . . . . . . . . . . . . . 16 12 3
Total . . . . . . . . . . . . . . . . . . . . . . . . . . . . . . . . . . . . . . . . . . . . . . . . . . . . . . . . . . . $222 $210 $171
The components of income taxes were as follows:
2007 2006 2005(In millions)
Current:Federal . . . . . . . . . . . . . . . . . . . . . . . . . . . . . . . . . . . . . . . . . . . . . . . . . . . . . . . . . . . $ 55 $ 7 $39
State . . . . . . . . . . . . . . . . . . . . . . . . . . . . . . . . . . . . . . . . . . . . . . . . . . . . . . . . . . . . . 14 6 5
Foreign . . . . . . . . . . . . . . . . . . . . . . . . . . . . . . . . . . . . . . . . . . . . . . . . . . . . . . . . . . . 15 6 6
Total current income taxes . . . . . . . . . . . . . . . . . . . . . . . . . . . . . . . . . . . . . . . . . . . $ 84 $19 $50
Deferred:
Federal . . . . . . . . . . . . . . . . . . . . . . . . . . . . . . . . . . . . . . . . . . . . . . . . . . . . . . . . . . . $ 14 $36 $ 9
State . . . . . . . . . . . . . . . . . . . . . . . . . . . . . . . . . . . . . . . . . . . . . . . . . . . . . . . . . . . . . (10) 3 (2)
Foreign . . . . . . . . . . . . . . . . . . . . . . . . . . . . . . . . . . . . . . . . . . . . . . . . . . . . . . . . . . . (11) (1) —
Total deferred income taxes . . . . . . . . . . . . . . . . . . . . . . . . . . . . . . . . . . . . . . . . . . (7) 38 7
Total income taxes . . . . . . . . . . . . . . . . . . . . . . . . . . . . . . . . . . . . . . . . . . . . . . . $ 77 $57 $57
Cash paid for income taxes was $48 million in 2007, $2 million in 2006 and $22 million in 2005.
A reconciliation of the federal statutory income tax rate to the effective income tax rate is provided below:
2007 2006 2005
Federal statutory income tax rate . . . . . . . . . . . . . . . . . . . . . . . . . . . . . . . . . . . . . . . . . 35.0% 35.0% 35.0%
Increase (decrease) in taxes resulting from:
State income taxes . . . . . . . . . . . . . . . . . . . . . . . . . . . . . . . . . . . . . . . . . . . . . . . . . . 1.9 1.0 1.3
Tax exempt interest . . . . . . . . . . . . . . . . . . . . . . . . . . . . . . . . . . . . . . . . . . . . . . . . . . (0.2) (0.2) (1.1)
Foreign tax rate differential . . . . . . . . . . . . . . . . . . . . . . . . . . . . . . . . . . . . . . . . . . . . (3.3) (4.0) (2.7)
Canadian dollar functional currency . . . . . . . . . . . . . . . . . . . . . . . . . . . . . . . . . . . . . . (1.0) (5.5) —
Change in state valuation allowance . . . . . . . . . . . . . . . . . . . . . . . . . . . . . . . . . . . . . 0.3 1.6 1.1
Interest on tax contingencies — leveraged leases . . . . . . . . . . . . . . . . . . . . . . . . . . . . 3.1 2.7 1.1
Tax credits . . . . . . . . . . . . . . . . . . . . . . . . . . . . . . . . . . . . . . . . . . . . . . . . . . . . . . . . (1.1) (2.1) (0.8)
Other, net . . . . . . . . . . . . . . . . . . . . . . . . . . . . . . . . . . . . . . . . . . . . . . . . . . . . . . . . . 0.2 (1.2) (0.3)
Effective income tax rate . . . . . . . . . . . . . . . . . . . . . . . . . . . . . . . . . . . . . . . . . . . . 34.9% 27.3% 33.6%
The effective tax rate increased to 34.9% in 2007 from 27.3% in 2006 and 33.6% in 2005. The increase in 2007is primarily attributable to a benefit derived from the adoption of the Canadian dollar as the functional currency forU.S. tax purposes of one of the Company’s wholly-owned Canadian subsidiaries in 2006 and a decrease in taxcredits in 2007, partially offset by a larger increase in the state valuation allowance in 2006.
The lower tax rate in 2006, as compared to 2005, is primarily attributable to the adoption of the Canadian dollaras the functional currency for U.S. tax purposes of one of the Company’s wholly-owned Canadian subsidiaries in
52
2006 and the effects of events related to cross-border financings, partially offset by an increase in interest on taxcontingencies, the majority of which is associated with leveraged leases, as discussed in Note 17 Contingencies.
The amount of income taxes we pay is subject to ongoing audits by federal, state and foreign tax authorities.We assess our income tax positions and record tax benefits for all years subject to examination based uponmanagement’s evaluation of the facts, circumstances, and information available at the reporting date. For those taxpositions for which it is more likely than not that a tax benefit will be sustained, we record an estimate of the amountof tax benefit that has a greater than 50 percent likelihood of being realized upon settlement with a taxing authoritythat has full knowledge of all relevant information. For those income tax positions for which it is not more likelythan not that a tax benefit will be sustained, no tax benefit has been recognized in the financial statements. Whereapplicable, associated interest has also been recognized.
As future results may include favorable or unfavorable adjustments to our estimates due to closure of incometax examinations, new regulatory or judicial pronouncements, or other relevant events, our effective tax rate mayfluctuate significantly on a quarterly and annual basis.
We adopted the provisions of FASB Interpretation No. 48, “Accounting for Uncertainty in Income Taxes —An Interpretation of FASB Statement No. 109” (“FIN 48”) at the beginning of fiscal 2007. Upon adoption of FIN 48,no adjustment to the Consolidated Financial Statements was required. FIN 48 provides a comprehensive model forthe financial statement recognition, measurement, presentation and disclosure of uncertain tax positions taken orexpected to be taken in income tax returns. Unrecognized tax benefits represent tax positions for which reserveshave been established. Unrecognized state tax benefits and interest related to unrecognized tax benefits are reflectednet of applicable tax benefits.
A reconciliation of the beginning and ending amount of unrecognized tax benefits, excluding accrued interest,is as follows:
2007(In millions)
Balance — Beginning of year . . . . . . . . . . . . . . . . . . . . . . . . . . . . . . . . . . . . . . . . . . . . . . . . . . . $ 9
Additions for tax positions of the current year . . . . . . . . . . . . . . . . . . . . . . . . . . . . . . . . . . . . . . 2
Additions for tax positions of prior years . . . . . . . . . . . . . . . . . . . . . . . . . . . . . . . . . . . . . . . . . —
Reductions for tax positions of prior years . . . . . . . . . . . . . . . . . . . . . . . . . . . . . . . . . . . . . . . . (2)
Settlements . . . . . . . . . . . . . . . . . . . . . . . . . . . . . . . . . . . . . . . . . . . . . . . . . . . . . . . . . . . . . . . —
Balance — End of year . . . . . . . . . . . . . . . . . . . . . . . . . . . . . . . . . . . . . . . . . . . . . . . . . . . . . . . . $ 9
At December 29, 2007, approximately $9 million of these unrecognized benefits, if recognized, wouldfavorably affect the Company’s effective tax rate in any future period. The Company does not believe that it isreasonably possible that the estimates of unrecognized tax benefits will change significantly in the next 12 months.
The Company recognizes interest and penalties related to unrecognized tax benefits in income tax expense inits Consolidated Statements of Operations. During 2007, 2006 and 2005, the Company recognized approximately$7 million, $7 million and $2 million, respectively, of interest. At December 29, 2007 and December 30, 2006,$22 million and $15 million of accrued interest in connection with uncertain tax positions was included in Accruedinterest and other liabilities in the Company’s Consolidated Balance Sheets, respectively.
In the normal course of business, we are subject to examination by taxing authorities throughout the world,including such major jurisdictions as Canada and the U.S. With few exceptions, we are no longer subject toU.S. federal, state and local, or non-U.S. income tax examinations for years before 1997 in these major jurisdictions.
53

The components of Textron Financial’s deferred tax assets and liabilities were as follows:
2007 2006(In millions)
Deferred tax assets:Allowance for losses . . . . . . . . . . . . . . . . . . . . . . . . . . . . . . . . . . . . . . . . . . . . . . . . . . . . . . $ 31 $ 34
State net operating losses . . . . . . . . . . . . . . . . . . . . . . . . . . . . . . . . . . . . . . . . . . . . . . . . . . 15 13
Deferred origination fees . . . . . . . . . . . . . . . . . . . . . . . . . . . . . . . . . . . . . . . . . . . . . . . . . . . 10 9
Nonaccrual finance receivables . . . . . . . . . . . . . . . . . . . . . . . . . . . . . . . . . . . . . . . . . . . . . . 5 8
Other . . . . . . . . . . . . . . . . . . . . . . . . . . . . . . . . . . . . . . . . . . . . . . . . . . . . . . . . . . . . . . . . . 56 35
Total deferred tax assets . . . . . . . . . . . . . . . . . . . . . . . . . . . . . . . . . . . . . . . . . . . . . . . . . . . . . 117 99
Valuation allowance . . . . . . . . . . . . . . . . . . . . . . . . . . . . . . . . . . . . . . . . . . . . . . . . . . . . . . (11) (10)
Net deferred tax assets . . . . . . . . . . . . . . . . . . . . . . . . . . . . . . . . . . . . . . . . . . . . . . . . . . . . . . 106 89
Deferred tax liabilities:Leveraged leases . . . . . . . . . . . . . . . . . . . . . . . . . . . . . . . . . . . . . . . . . . . . . . . . . . . . . . . . . 408 410
Finance leases. . . . . . . . . . . . . . . . . . . . . . . . . . . . . . . . . . . . . . . . . . . . . . . . . . . . . . . . . . . 66 77
Equipment on operating leases . . . . . . . . . . . . . . . . . . . . . . . . . . . . . . . . . . . . . . . . . . . . . . 55 57
Other . . . . . . . . . . . . . . . . . . . . . . . . . . . . . . . . . . . . . . . . . . . . . . . . . . . . . . . . . . . . . . . . . 49 42
Total deferred tax liabilities . . . . . . . . . . . . . . . . . . . . . . . . . . . . . . . . . . . . . . . . . . . . . . . . . . 578 586
Net deferred tax liabilities. . . . . . . . . . . . . . . . . . . . . . . . . . . . . . . . . . . . . . . . . . . . . . . . . . . . $472 $497
At December 29, 2007, Textron Financial had state net operating loss carryforwards of approximately$665 million available to offset future state taxable income. The state net operating loss carryforwards will expire inyears 2008 through 2027. The valuation allowance reported above represents the tax effect of certain state netoperating loss carryforwards for which Textron Financial is unable to conclude that, more likely than not, thebenefit from such carryforwards will be realized.
Income taxes have not been provided on the undistributed earnings of foreign subsidiaries not previouslyrecognized, as management intends to reinvest those earnings for an indefinite period. If those earnings, whichapproximated $107 million at the end of 2007, were distributed, 2007 taxes, net of foreign tax credits, would beincreased by approximately $41 million.
NOTE 15 Fair Value of Financial Instruments
The following methods and assumptions were used in estimating the fair value of Textron Financial’s financialinstruments:
Finance Receivables
The estimated fair values of fixed-rate installment contracts, revolving loans, golf course and resort mortgagesand distribution finance receivables were estimated based on discounted cash flow analyses using interest ratescurrently being offered for similar loans to borrowers of similar credit quality. The estimated fair values of allvariable-rate receivables approximated the net carrying value of such receivables. The estimated fair values ofindividually large balance nonperforming loans were based on discounted cash flow analyses using risk adjustedinterest rates or Textron Financial valuations based on the fair value of the related collateral. Included in theportfolios are the allowance for losses on finance receivables, which represents the credit risk adjustment required toreflect the loan portfolios’ carrying value. The fair values, net of carrying amounts of Textron Financial’s financeleases, leveraged leases and operating leases ($613 million, $544 million and $259 million, respectively, atDecember 29, 2007, and $590 million, $615 million and $238 million, respectively, at December 30, 2006), arespecifically excluded from this disclosure under generally accepted accounting principles. As a result, a significantportion of the assets that are included in the Company’s asset and liability management strategy are excluded fromthis fair value disclosure.
54

Debt, Interest Rate Exchange Agreements, Foreign Currency Forward Exchange Contracts and ForeignCurrency Exchange Agreements
The estimated fair value of fixed-rate debt and variable-rate long-term notes was determined by eitherindependent investment bankers or discounted cash flow analyses using interest rates for similar debt withmaturities similar to the remaining terms of the existing debt. The fair values of short-term borrowing supported bycredit facilities approximated their carrying values. The estimated fair values of interest rate exchange agreements,foreign currency forward exchange contracts and foreign currency exchange agreements, were determined byindependent investment bankers and represent the estimated amounts that Textron Financial would be required topay to (or collect from) a third-party to assume Textron Financial’s obligations under the agreements.
The carrying values and estimated fair values of Textron Financial’s financial instruments for which it ispracticable to calculate a fair value are as follows:
2007Carrying
Value
2007EstimatedFair Value
2006Carrying
Value
2006EstimatedFair Value
(In millions)
Assets:Revolving loans . . . . . . . . . . . . . . . . . . . . . . . . . . . . . . . . . . . . $2,232 $2,235 $1,924 $1,912
Installment contracts . . . . . . . . . . . . . . . . . . . . . . . . . . . . . . . . . 2,023 2,025 1,637 1,618
Distribution finance receivables . . . . . . . . . . . . . . . . . . . . . . . . . 1,883 1,883 2,411 2,409
Golf course and resort mortgages . . . . . . . . . . . . . . . . . . . . . . . 1,225 1,235 1,047 1,043
Retained interests in securitizations . . . . . . . . . . . . . . . . . . . . . . 203 203 179 179
Derivative financial instruments . . . . . . . . . . . . . . . . . . . . . . . . 22 22 3 3
Marketable debt security . . . . . . . . . . . . . . . . . . . . . . . . . . . . . . 20 20 — —
$7,608 $7,623 $7,201 $7,164
Liabilities:Fixed rate long-term debt . . . . . . . . . . . . . . . . . . . . . . . . . . . . . $3,363 $3,369 $3,264 $3,269
Variable rate long-term notes . . . . . . . . . . . . . . . . . . . . . . . . . . 2,487 2,458 1,819 1,820
Total short-term debt . . . . . . . . . . . . . . . . . . . . . . . . . . . . . . . . 1,461 1,461 1,779 1,779
Amounts due to Textron Inc . . . . . . . . . . . . . . . . . . . . . . . . . . . 25 21 20 17
Retained interests in securitizations . . . . . . . . . . . . . . . . . . . . . . — — 1 1
Derivative financial instruments . . . . . . . . . . . . . . . . . . . . . . . . 2 2 54 54
$7,338 $7,311 $6,937 $6,940
NOTE 16 Commitments
Textron Financial generally enters into various revolving lines of credit, letters of credit and loan commitmentsin response to the financing needs of its customers. At December 29, 2007, the Company had outstandingcommitted facilities totaling $1.7 billion. Funding under these facilities is dependent on both compliance withcustomary financial covenants and the availability of eligible collateral. Letters of credit are conditional com-mitments issued by the Company to guarantee the performance of a borrower or an affiliate to a third-party. Loancommitments represent agreements to fund eligible costs of assets generally within one year. Generally, interestrates on all of these commitments are either floating-rate loans based on a market index or are not set until amountsare funded. Therefore, Textron Financial is not exposed to interest rate changes.
These financial instruments generate fees and involve, to varying degrees, elements of credit risk in excess ofamounts recognized in the Consolidated Balance Sheets. Since many of the agreements are expected to expireunused, the total commitment amount does not necessarily represent future cash requirements. The credit riskinvolved in issuing these instruments is essentially the same as that involved in extending loans to borrowers and the
55

credit quality and collateral policies for controlling this risk are similar to those involved in the Company’s normallending transactions.
The contractual amounts of the Company’s outstanding commitments to extend credit at December 29, 2007,are shown below:
(In millions)
Commitments to extend credit:
Committed revolving lines of credit . . . . . . . . . . . . . . . . . . . . . . . . . . . . . . . . . . . . . . . . . . . . . . . $1,577
Standby letters of credit . . . . . . . . . . . . . . . . . . . . . . . . . . . . . . . . . . . . . . . . . . . . . . . . . . . . . . . . 51
Loans . . . . . . . . . . . . . . . . . . . . . . . . . . . . . . . . . . . . . . . . . . . . . . . . . . . . . . . . . . . . . . . . . . . . . 54
Textron Financial’s offices are occupied under noncancelable operating leases expiring on various datesthrough 2015. Rental expense was $8 million in 2007, $7 million in 2006 and $7 million in 2005. Future minimumrental commitments for all noncancelable operating leases in effect at December 29, 2007 approximated $6 millionfor 2008, $5 million for 2009, $4 million for 2010, $4 million for 2011, $1 million for 2012 and $2 millionthereafter. Of these amounts, $1 million is payable to Textron in 2008.
NOTE 17 Contingencies
Textron Financial is subject to challenges from tax authorities regarding amounts of tax due. These challengesmay alter the timing or amount of taxable income or deductions, or the allocation of income among tax jurisdictions.Textron Financial is currently under examination by the Internal Revenue Service (“IRS”) for the years 1998through 2003. The IRS has issued Notices of Proposed Adjustment that may affect certain leveraged leasetransactions with a total initial investment of approximately $168 million related to the 1998 through 2003 tax years.The Company entered into additional transactions with similar characteristics and a total initial investment ofapproximately $41 million related to the 2004 tax year. Resolution of these issues may result in an adjustment to thetiming of taxable income and deductions that reduce the effective yield of the leveraged lease transactions. Inaddition, resolution of these issues could result in the acceleration of cash payments to the IRS. At December 29,2007, $180 million of deferred tax liabilities were recorded on our Consolidated Balance Sheets related to theseleases. We believe the proposed IRS adjustments are inconsistent with the tax law in existence at the time the leaseswere originated and intend to vigorously defend our position.
There are other pending or threatened lawsuits and other proceedings against Textron Financial and itssubsidiaries. Some of these suits and proceedings seek compensatory, treble or punitive damages in substantialamounts. These suits and proceedings are being defended by, or contested on behalf of, Textron Financial and itssubsidiaries. On the basis of information presently available, Textron Financial believes any such liability would nothave a material effect on Textron Financial’s financial position or results of operations.
56

NOTE 18 Financial Information about Operating Segments
The Company aligns its business units into six operating segments based on the markets serviced and theproducts offered: Asset-Based Lending, Aviation Finance, Distribution Finance, Golf Finance, Resort Finance andStructured Capital. In addition, the Company maintains a Corporate and Other segment that includes non-corefranchise finance, media finance and liquidating portfolios related to a strategic realignment of the Company’sbusiness and product lines into core and non-core businesses, and unallocated Corporate expenses.
2007 2006 2005
(Dollars in millions)
Revenues:
Distribution Finance . . . . . . . . . . . . . . . . . . . . . . . . . . . $ 290 33% $ 268 34% $ 178 28%
Aviation Finance . . . . . . . . . . . . . . . . . . . . . . . . . . . . . . 176 20% 133 17% 107 17%
Golf Finance . . . . . . . . . . . . . . . . . . . . . . . . . . . . . . . . . 138 16% 132 16% 102 16%
Resort Finance . . . . . . . . . . . . . . . . . . . . . . . . . . . . . . . 137 15% 118 15% 91 15%
Asset-Based Lending . . . . . . . . . . . . . . . . . . . . . . . . . . . 94 11% 90 11% 75 12%
Structured Capital . . . . . . . . . . . . . . . . . . . . . . . . . . . . . 33 4% 38 5% 54 9%
Corporate and Other . . . . . . . . . . . . . . . . . . . . . . . . . . . 7 1% 19 2% 21 3%
Total revenues . . . . . . . . . . . . . . . . . . . . . . . . . . . . . . . . . $ 875 100% $ 798 100% $ 628 100%
Income from continuing operations before incometaxes:(1)(2)
Distribution Finance . . . . . . . . . . . . . . . . . . . . . . . . . . . $ 86 $ 99 $ 70
Aviation Finance . . . . . . . . . . . . . . . . . . . . . . . . . . . . . . 48 31 32
Golf Finance . . . . . . . . . . . . . . . . . . . . . . . . . . . . . . . . . 38 32 25
Resort Finance . . . . . . . . . . . . . . . . . . . . . . . . . . . . . . . 51 32 18
Asset-Based Lending . . . . . . . . . . . . . . . . . . . . . . . . . . . 21 12 25Structured Capital . . . . . . . . . . . . . . . . . . . . . . . . . . . . . 16 17 34
Corporate and Other . . . . . . . . . . . . . . . . . . . . . . . . . . . (38) (13) (33)
Income from continuing operations before incometaxes . . . . . . . . . . . . . . . . . . . . . . . . . . . . . . . . . . . . . . $ 222 $ 210 $ 171
Finance assets:(3)
Aviation Finance . . . . . . . . . . . . . . . . . . . . . . . . . . . . . . $2,279 $1,776 $1,278
Distribution Finance . . . . . . . . . . . . . . . . . . . . . . . . . . . 1,936 2,422 1,710Golf Finance . . . . . . . . . . . . . . . . . . . . . . . . . . . . . . . . . 1,680 1,524 1,344
Resort Finance . . . . . . . . . . . . . . . . . . . . . . . . . . . . . . . 1,521 1,296 1,155
Asset-Based Lending . . . . . . . . . . . . . . . . . . . . . . . . . . . 1,004 864 764
Structured Capital . . . . . . . . . . . . . . . . . . . . . . . . . . . . . 631 756 704
Corporate and Other . . . . . . . . . . . . . . . . . . . . . . . . . . . 109 170 332
Total finance assets . . . . . . . . . . . . . . . . . . . . . . . . . . . . . $9,160 $8,808 $7,287
(1) Interest expense is allocated to each segment in proportion to its net investment in finance assets. Netinvestment in finance assets includes finance assets less deferred income taxes, security deposits and otherspecifically identified liabilities. The interest allocated matches all variable-rate finance assets with variable-rate debt costs and all fixed-rate finance assets with fixed-rate debt costs and includes only debt issued duringhistorical periods with credit spreads consistent with those in existence during the periods in which the currentreceivable portfolio was originated. If this allocation results in greater or less interest expense than was actuallyincurred by the Company, the remaining balance is included in the Corporate and Other segment’s interestexpense.
57

Prior to 2007, we allocated 100% of the interest expense recognized to the Company’s operating segmentswithout adjustment. In addition, the allocation was determined, to the extent possible, based on matchingvariable-rate debt with variable-rate finance assets and fixed-rate debt with fixed-rate finance assets. Anyexcess floating-rate debt was allocated to fixed-rate finance assets. A change in the allocation methodology wasmade in 2007 to measure the results of each segment more consistently with the economic characteristics of itsexisting portfolio, which coincided with a change in how management internally evaluates segment operatingperformance. The 2006 and 2005 results have not been restated under the new methodology. This change had a$13 million positive effect on the collective results of the six core portfolio segments for the twelve monthsended December 29, 2007.
(2) Indirect expenses are allocated to each segment based on the use of such resources. Most allocations are basedon the segment’s proportion of net investment in finance assets, headcount, number of transactions, computerresources and senior management time.
(3) Finance assets include: finance receivables; equipment on operating leases, net of accumulated depreciation;repossessed assets and properties; retained interests in securitizations; investment in equipment residuals;Acquisition, Development and Construction arrangements; and other short- and long-term investments (someof which are classified in Other assets on Textron Financial’s Consolidated Balance Sheets).
NOTE 19 Quarterly Financial Data (Unaudited)
2007 2006 2007 2006 2007 2006 2007 2006
FirstQuarter
SecondQuarter
ThirdQuarter
FourthQuarter
(In millions)
Revenues . . . . . . . . . . . . . . . . . . . . . . . . . . $210 $182 $239 $192 $214 $212 $212 $212
Net interest margin. . . . . . . . . . . . . . . . . . . $106 $105 $133 $103 $113 $113 $108 $109
Selling and administrative expenses . . . . . . 49 47 54 48 53 50 49 49
Provision for losses . . . . . . . . . . . . . . . . . . 5 9 11 (1) 6 10 11 8
Income from continuing operationsbefore income taxes . . . . . . . . . . . . . . . 52 49 68 56 54 53 48 52
Income taxes . . . . . . . . . . . . . . . . . . . . . . . 17 18 27 20 22 7 11 12
Income from continuing operations . . . . . 35 31 41 36 32 46 37 40
Loss from discontinued operations, net ofincome tax benefit . . . . . . . . . . . . . . . . . — — — — — — — (1)
Net income . . . . . . . . . . . . . . . . . . . . . . . . $ 35 $ 31 $ 41 $ 36 $ 32 $ 46 $ 37 $ 39
Item 9. Changes in and Disagreements with Accountants on Accounting and Financial Disclosure
Not applicable.
Item 9A. Controls and Procedures
We have carried out an evaluation, under the supervision and the participation of our management, includingour Chairman and Chief Executive Officer (our “CEO”) and our Executive Vice President and Chief FinancialOfficer (our “CFO”), of the effectiveness of the design and operation of our disclosure controls and procedures (asdefined in Rule 13a-15(e) and 15d-15(e)) under the Securities Exchange Act of 1934, as amended (the “Act”) as ofthe end of the fiscal year covered by this report. Based upon that evaluation, our CEO and CFO concluded that ourdisclosure controls and procedures are effective in providing reasonable assurance that (a) the information requiredto be disclosed by us in the reports that we file or submit under the Act is recorded, processed, summarized andreported within the time periods specified in the Securities and Exchange Commission’s rules and forms, and(b) such information is accumulated and communicated to our management, including our CEO and CFO, asappropriate to allow timely decisions regarding required disclosure.
a) See Report of Management in Item 8 of this Form 10-K.
58

b) See the Reports of Independent Registered Public Accounting Firm in Item 8 of this Form 10-K.
c) Changes in Internal Controls — There has been no change in our internal control over financialreporting during the fourth fiscal quarter of the fiscal year covered by this report that has materiallyaffected, or is reasonably likely to materially affect, our internal control over financial reporting.
Item 9B. Other Information
Not applicable.
PART III.
Item 10. Directors and Executive Officers of the Registrant
Omitted per Instruction I of Form 10-K.
Item 11. Executive Compensation
Omitted per Instruction I of Form 10-K.
Item 12. Security Ownership of Certain Beneficial Owners and Management
Omitted per Instruction I of Form 10-K.
Item 13. Certain Relationships and Related Transactions
Omitted per Instruction I of Form 10-K.
Item 14. Principal Accounting Fees and Services
The aggregate fees for professional services rendered by Ernst & Young LLP during 2007 and 2006 were asfollows:
Audit Fees — Fees for the audit of Textron Financial’s annual financial statements, the reviews of the financialstatements in Textron Financial’s Forms 10-Q, and other services in connection with statutory and regulatory filingsand engagements were $1.5 million in 2007 and $1.4 million in 2006.
Audit Related Fees — Audit related services include agreed upon procedures relating to securitizations offinance receivables, attest services not required by statute or regulation, and consultations concerning financialaccounting and reporting matters not classified as audit. Fees were $115 thousand in 2007 and $90 thousand in2006.
Tax Fees — Fees for tax services relating to consultations and compliance were $40 thousand in 2007 and $10thousand in 2006.
All Other Fees — No other products or services were provided by Ernst & Young LLP during either of the lasttwo fiscal years.
PART IV.
Item 15. Exhibits, Financial Statement Schedules
(1) List of Financial Statements and Financial Statement Schedules
The following Consolidated Financial Statements of Textron Financial and subsidiaries are included in Item 8:
1. Consolidated Statements of Income for each of the years in the three-year period ended December 29, 2007.
2. Consolidated Balance Sheets at December 29, 2007 and December 30, 2006.
59

3. Consolidated Statements of Cash Flows for each of the years in the three-year period ended December 29,2007.
4. Consolidated Statements of Changes in Shareholder’s Equity for each of the years in the three-year periodended December 29, 2007.
5. Notes to the Consolidated Financial Statements.
All other schedules for which provision is made in the applicable accounting regulation of the Securities andExchange Commission are not required under the related instructions or are inapplicable and therefore have beenomitted.
(2) Exhibits
The following is an Index of Exhibits required by Item 601 of Regulation S-K filed with the Securities andExchange Commission as part of this report:
ExhibitNo.
3.1 Restated Certificate of Incorporation of Textron Financial, dated July 19, 1993. Incorporated byreference to Exhibit 3.1 to Textron Financial Corporation’s Registration Statement on Form 10 (FileNo. 0-27559).
3.2 By-Laws of Textron Financial Corporation as of May 2, 2000. Incorporated by reference to Exhibit 3.1to Textron Financial Corporation’s Quarterly Report on Form 10-Q filed August 11, 2000.
4.1A Indenture dated as of December 9, 1999, between Textron Financial Corporation and SunTrust Bank(formerly known as Sun Trust Bank, Atlanta) (including form of debt securities). Incorporated byreference to Exhibit 4.1 to Amendment No. 2 to Textron Financial Corporation’s RegistrationStatement on Form S-3 (No. 333-88509).
4.1B First Supplemental Indenture dated November 16, 2006 between Textron Financial Corporation andU.S. Bank National Association (successor to SunTrust Bank) to Indenture dated as of December 9,1999. Incorporated by reference to Exhibit 4.3 to Textron Financial Corporation’s RegistrationStatement on Form S-3 (File No. 333-138755).
4.1C Form of Medium-Term Note of Textron Financial Corporation. Incorporated by reference toExhibit 4.3 to Textron Financial Corporation’s Current Report on Form 8-K filed November 17, 2006.
4.2A Indenture dated as of November 30, 2001, between Textron Financial Canada Funding Corp. andSunTrust Bank, guaranteed by Textron Financial Corporation. Incorporated by reference to Exhibit 4.2to Amendment No. 1 to Textron Financial Corporation’s Registration Statement on Form S-3(No. 333-108464).
4.2B First Supplemental Indenture dated November 16, 2006 between Textron Financial Canada FundingCorp., Textron Financial Corporation and U.S. Bank National Association (successor trustee toSunTrust Bank) to Indenture dated November 30, 2001. Incorporated by reference to Exhibit 4.4 toTextron Financial Corporation’s Registration Statement on Form S-3 (File No. 333-138755).
4.2C Form of Medium-Term Note of Textron Financial Canada Funding Corp., including the form of theGuaranty by Textron Financial Corporation. Incorporated by reference to Exhibit 4.4 to TextronFinancial Corporation’s Current Report on Form 8-K filed November 17, 2006.
4.3A Amended and Restated Indenture, dated as of May 26, 2005, by and between Textron FinancialFloorplan Master Note Trust and The Bank of New York, as indenture trustee. Incorporated herein byreference to Exhibit 4.1 to Textron Financial Corporation’s Current Report on Form 8-K filed June 1,2005.
4.3B Amended and Restated Series 2001-1 Supplement, dated as of May 26, 2005, to the Amended andRestated Indenture, dated as of May 26, 2005, by and among Textron Financial Floorplan MasterNote Trust, The Bank of New York, as indenture trustee, and Textron Financial, as servicer,incorporated herein by reference to Exhibit 4.2 to Textron Financial Corporation’s Current Report onForm 8-K filed June 1, 2005.
4.3C Series 2005-A Supplement, dated as of May 26, 2005, to the Amended and Restated Indenture, datedas of May 26, 2005, by and among Textron Financial Floorplan Master Note Trust, The Bank of NewYork, as indenture trustee, and Textron Financial, as servicer, incorporated herein by reference toExhibit 4.3 to Textron Financial Corporation’s Current Report on Form 8-K filed June 1, 2005.
60

ExhibitNo.
4.3D Series 2006-A Supplement, dated as of April 19, 2006, to the Amended and Restated Indenture, datedas of May 26, 2005, by and among Textron Financial Floorplan Master Note Trust, The Bank of NewYork, as indenture trustee, and Textron Financial, as servicer, incorporated herein by reference toExhibit 4.1 to Textron Financial Corporation’s Current Report on Form 8-K filed April 24, 2006.
4.3E Series 2007-A Supplement, dated as of March 29, 2007, to the Amended and Restated Indenture,dated as of May 26, 2005, by and among Textron Financial Floorplan Master Note Trust, The Bankof New York, as indenture trustee, and Textron Financial, as servicer, incorporated herein by referenceto Exhibit 4.1 to Textron Financial Corporation’s Current Report on Form 8-K filed March 30, 2007.
4.3F Amended and Restated Trust Agreement, dated as of May 26, 2005, among Textron Financial,Textron Receivables Corporation III and SunTrust Delaware Trust Company, as owner trustee,incorporated herein by reference to Exhibit 99.1 of Textron Financial Corporation’s Current Report onForm 8-K filed June 1, 2005.
4.4A Indenture, dated as of February 8, 2007, between Textron Financial Corporation and Deutsche BankTrust Company Americas, as trustee, incorporated herein by reference to Exhibit 99.1 of TextronFinancial Corporation’s Current Report on Form 8-K filed February 13, 2007.
4.4B Contribution Agreement, dated February 8, 2007, between Textron Financial Corporation and TextronInc, incorporated herein by reference to Exhibit 99.2 of Textron Financial Corporation’s CurrentReport on Form 8-K filed February 13, 2007.
4.4C Replacement Capital Covenant, dated February 8, 2007, incorporated herein by reference toExhibit 99.3 of Textron Financial Corporation’s Current Report on Form 8-K filed February 13, 2007.
10.1 Support Agreement dated as of May 25, 1994, between Textron Financial Corporation and TextronInc. Incorporated by reference to Exhibit 10.1 to Textron Financial Corporation’s Statement onForm 10 (File No. 0-27559).
10.2 Receivables Purchase Agreement between Textron Financial and Textron dated as of January 1, 1986.Incorporated by reference to Exhibit 10.2 to Textron Financial Corporation’s Statement on Form 10(File No. 0-27559).
10.3 Tax Sharing Agreement between Textron Financial and Textron dated as of December 29, 1990.Incorporated by reference to Exhibit 10.3 to Textron Financial Corporation’s Statement on Form 10(File No. 0-27559).
10.4A 5-Year Credit Agreement, dated as of March 28, 2005, among Textron, the Banks listed therein,JPMorgan Chase Bank, N.A., as Administrative Agent, and Citibank, N.A., as Syndication Agent.Incorporated by reference to Exhibit 10.1 to Textron’s Current Report on Form 8-K filed March 31,2005.
10.4B Amendment No. 1, dated as of April 21, 2006, to the 5-Year Credit Agreement, dated as of March 28,2005, among Textron, the Banks listed therein, JPMorgan Chase Bank, N.A., as Administrative Agent,and Citibank, N.A., as Syndication Agent. Incorporated by reference to Exhibit 10.1 to Textron’sCurrent Report on Form 8-K filed April 25, 2006.
10.4C Amendment No. 2, dated as of April 20, 2007, to the 5-Year Credit Agreement, dated as of March 28,2005, as amended on April 21, 2006, among Textron the Banks listed therein, JPMorgan Chase Bank,N.A., as Administrative Agent, and Citibank, N.A., as Syndication Agent, incorporated herein byreference to Exhibit 10.1 of Textron Inc.’s Current Report on Form 8-K filed April 25, 2007.
10.5A 364-Day Credit Agreement dated March 31, 2003 among Textron Inc., the Banks listed therein, andJPMorgan Chase Bank, as Administrative Agent. Incorporated by reference to Exhibit 10.3 to TextronInc.’s Quarterly Report on Form 10-Q for the fiscal quarter ended March 29, 2003.
10.5B Amendment, dated as of July 28, 2003, to the 364-Day Credit Agreement among Textron Inc., theBanks listed therein, and JPMorgan Chase Bank, as Administrative Agent. Incorporated by referenceto Exhibit 10.5 to Textron Financial Corporation’s Quarterly Report on Form 10-Q for the fiscalquarter ended September 30, 2003.
10.5C Amendment No. 2, dated as of March 29, 2004, to the 364-day Credit Agreement among TextronInc., the Banks listed therein, and JPMorgan Chase Bank, as Administrative Agent. Incorporated byreference to Exhibit 10.1 to Textron’s Quarterly Report on Form 10-Q for the fiscal quarter endedApril 3, 2004.
61

ExhibitNo.
10.6A 364-Day Credit Agreement dated July 28, 2003 among Textron Financial Corporation, the Bankslisted therein, and JPMorgan Chase Bank, as Administrative Agent. Incorporated by reference toExhibit 10.1 to Textron Financial Corporation’s Current Report on Form 8-K filed August 26, 2003.
10.6B Amendment, dated as of July 26, 2004, to the 364-day Credit Agreement dated as of July 28, 2003,among Textron Financial Corporation, the Banks listed therein, and JPMorgan Chase Bank, asAdministrative Agent. Incorporated by reference to Exhibit 10.1 to Textron Financial Corporation’sQuarterly Report on Form 10-Q for the fiscal quarter ended September 30, 2004.
10.6C Amendment No. 2, dated as of July 25, 2005, to the 364-Day Credit Agreement dated as of July 28,2003, among Textron Financial, the Banks listed therein, and JPMorgan Chase Bank N.A., asAdministrative Agent. Incorporated by reference to Exhibit 10.2 to Textron Financial Corporation’sCurrent Report on Form 8-K filed July 27, 2005.
10.7A Five-Year Credit Agreement dated July 28, 2003 among Textron Financial Corporation, the Bankslisted therein, and JPMorgan Chase Bank, as Administrative Agent. Incorporated by reference toExhibit 10.2 to Textron Financial Corporation’s Current Report on Form 8-K filed August 26, 2003.
10.7B Amendment No. 1, dated as of July 25, 2005, to the Five-Year Credit Agreement dated as of July 28,2003 among Textron Financial, the Banks listed therein, and JPMorgan Chase Bank N.A., asAdministrative Agent. Incorporated by reference to Exhibit 10.1 to Textron Financial Corporation’sCurrent Report on Form 8-K filed July 27, 2005.
10.7C Amendment No. 2, dated as of April 28, 2006, to the Five-Year Credit Agreement, dated as of July 28,2003, among Textron Financial Corporation, the Banks listed therein and JPMorgan Chase BankN.A., as Administrative Agent. Incorporated by reference to Exhibit 10.1 to Textron FinancialCorporation’s Current Report on Form 8-K filed May 1, 2006.
10.7D Amendment No. 3, dated as of April 27, 2007, to the Five-Year Credit Agreement, dated as of July 28,2003, as amended on March 28, 2005 and April 28, 2006, among Textron Financial Corporation, theBanks listed therein and JPMorgan Chase Bank N.A., as Administrative Agent. Incorporated byreference to Exhibit 10.1 to Textron Financial Corporation’s Current Report on Form 8-K filedApril 27, 2007.
12 Computation of Ratio of Earnings to Fixed Charges.21 List of significant subsidiaries.23 Consent of Independent Registered Public Accounting Firm.24 Power of Attorney dated as of February 20, 2008.31.1 Certification of Chief Executive Officer Pursuant to Rule 13a-14(a).31.2 Certification of Chief Financial Officer Pursuant to Rule 13a-14(a).32.1 Certification of Chief Executive Officer Pursuant to 18 U.S.C. Section 1350.32.2 Certification of Chief Financial Officer Pursuant to 18 U.S.C. Section 1350.
Note: Instruments defining the rights of holders of certain issues of long-term debt of Textron Financial have notbeen filed as exhibits to this Report because the authorized principal amount of any one of such issues doesnot exceed 10% of the total assets of Textron Financial and its subsidiaries on a consolidated basis. TextronFinancial agrees to furnish a copy of each such instrument to the Commission upon request.
Textron Financial, Textron, Bell Helicopter, Cessna, Cessna Finance Corporation, Textron Business Services, Inc., AssetControl, a division of Textron Business Services, Inc., Textron Golf, Turf and Specialty Products, E-Z-GO, Jacobsen
turf-care and their related trademark designs and logotypes (and variations of the foregoing) are trademarks,trade names or service marks of Textron Inc., its subsidiaries, affiliates or joint ventures.
62

SIGNATURES
Pursuant to the requirements of Section 13 or 15(d) of the Securities Exchange Act of 1934, the registrant hasduly caused this Annual Report on Form 10-K to be signed on its behalf by the undersigned, thereunto dulyauthorized on this 20 day of February 2008.
Textron Financial CorporationRegistrant
By: *
Ted R. FrenchChairman and Chief Executive Officer
Pursuant to the requirements of the Securities Exchange Act of 1934, this Report has been signed below on this20 day of February 2008, by the following persons on behalf of the registrant and in the capacities indicated:
By: *
Ted R. FrenchChairman and Chief Executive Officer,Director (Principal Executive Officer)
By: *
Buell J. Carter, Jr.President and Chief Operating Officer,Director
By: *
Mary F. LovejoyDirector
By: /s/ THOMAS J. CULLEN
Thomas J. CullenExecutive Vice President and Chief Financial Officer(Principal Financial Officer)
By: /s/ THOMAS N. NICHIPOR
Thomas N. NichiporSenior Vice President and Corporate Controller(Principal Accounting Officer)
*By: /s/ ELIZABETH C. PERKINS
Elizabeth C. PerkinsAttorney-in-fact
63

