2007 paul vanraden animal improvement programs laboratory, usda agricultural research service,...
TRANSCRIPT
2007
Paul VanRadenPaul VanRaden
Animal Improvement Programs Laboratory, USDAAgricultural Research Service, Beltsville, MD, [email protected]
2007
Selection for Fertility in Dairy Selection for Fertility in Dairy CattleCattle

Uberlandia, Brazil 2007 (2) P.M. VanRaden200
7
Factors Affecting FertilityFactors Affecting Fertility
Environment and management• Season, region, herd, age, milk yield• Calving difficulty, twins, mastitis, health • Estrus detection and / or synchronization• Voluntary waiting period
Genes of cow (Daughter Pregnancy Rate)
Fertility of bull (ERCR) Interaction of bull’s and cow’s genes

Uberlandia, Brazil 2007 (3) P.M. VanRaden200
7
Genetic InteractionsGenetic Interactions
Lethal recessive genes• CVM aborts pregnancy 30-280 days• DUMPS aborts embryo at ~45 days• New defect causes loss at ~5 days
Inbreeding reduces fertility
Crossbreeding improves fertility• 1.8% increase in pregnancy rate

Uberlandia, Brazil 2007 (4) P.M. VanRaden200
7
USA Bull Fertility EvaluationUSA Bull Fertility Evaluation
Measure of current semen fertility Based on 1.6 million inseminations
in last 3 years Estimated Relative Conception
Rate (ERCR) ranges +5% to –6%
Uberlandia, Brazil 2007 (5) P.M. VanRaden200
7
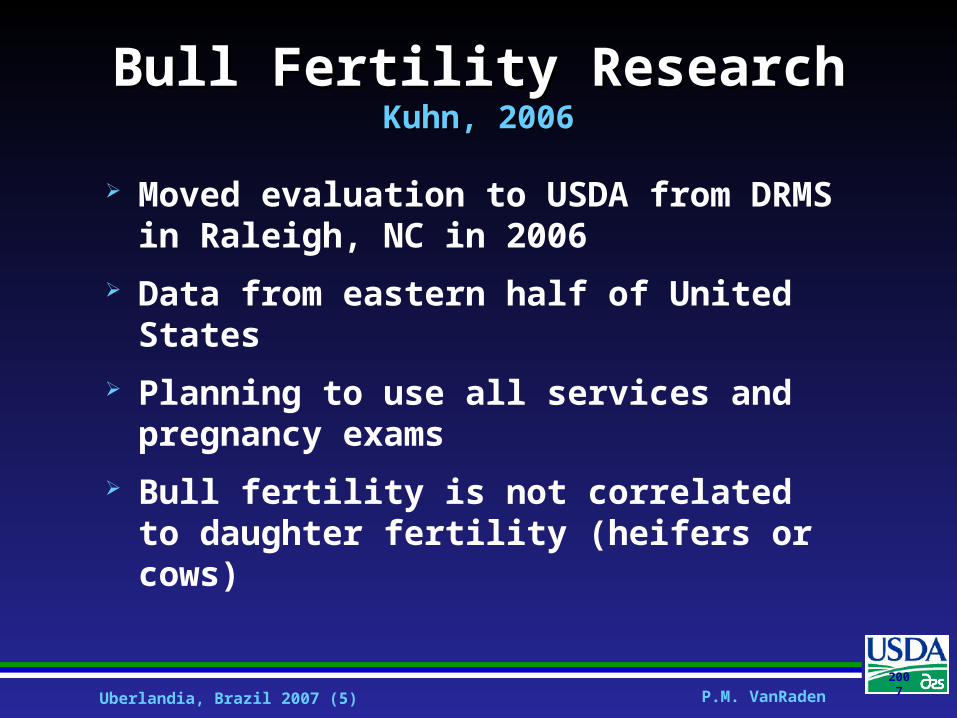
Bull Fertility ResearchBull Fertility ResearchKuhn, 2006Kuhn, 2006
Moved evaluation to USDA from DRMS in Raleigh, NC in 2006
Data from eastern half of United States
Planning to use all services and pregnancy exams
Bull fertility is not correlated to daughter fertility (heifers or cows)

Uberlandia, Brazil 2007 (6) P.M. VanRaden200
7
Why Does Fertility Differ?Why Does Fertility Differ?
Male fertility includes• Ability of sperm to fertilize egg• Bull’s environmental conditions
Female fertility includes• Ability to cycle and show estrus• Ability of egg to conceive• Maternal support of embryo• Milk production stress (cows only)

Uberlandia, Brazil 2007 (7) P.M. VanRaden200
7
Heifer Fertility ResearchHeifer Fertility ResearchKuhn et al, 2006 J Dairy Sci 89:4907Kuhn et al, 2006 J Dairy Sci 89:4907
Insemination records for 537,938 heifers in years 2003-2005
Average conception rate = 57%
Heritability = .5% (linear model), 1% (logistic model)
Genetic correlation = .39 with cow conception rate, -.19 with milk yield

Uberlandia, Brazil 2007 (8) P.M. VanRaden200
7
Heifer Fertility is GoodHeifer Fertility is Good
Paul VanRaden, 1995
Uberlandia, Brazil 2007 (9) P.M. VanRaden200
7
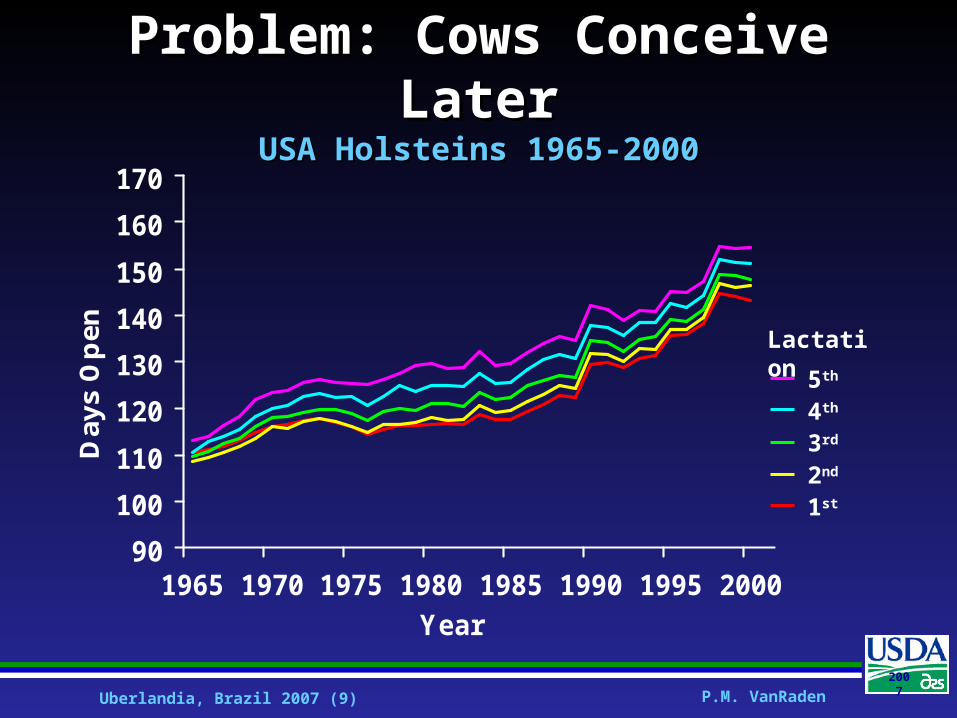
Problem: Cows Conceive LaterProblem: Cows Conceive LaterUSA Holsteins 1965-2000USA Holsteins 1965-2000
90
100
110
120
130
140
150
160
170
1965 1970 1975 1980 1985 1990 1995 2000
Year
Day
s O
pen
5th
4th
3rd
2nd
1st
Lactation

Uberlandia, Brazil 2007 (10) P.M. VanRaden200
7
Pregnancy RatePregnancy Rate
The percentage of nonpregnant cows that become pregnant during each 21-day time period
Pregnancy rate < conception rate• Cows that are not cycling • Estrus not expressed or detected
Typical pregnancy rates• 20% if calving interval is 14.3 months• 25% if calving interval is 13.6 months

Uberlandia, Brazil 2007 (11) P.M. VanRaden200
7
Pregnancy Rate and Days OpenPregnancy Rate and Days Open
0
10
20
30
40
50
60
70
80
90
100
60 81 102 123 144 165 186 207 228 249
Number of Chances
Pre
gn
ancy
Rat
e
987654321
Days Open

Uberlandia, Brazil 2007 (12) P.M. VanRaden200
7
Breeding date: BSW HOL
Verified by next calving date 54 57
Disagrees with calving date 8 5
Breeding date but no next calf 15 19
No breeding reported, only next calf
9 6
Cow sold for infertility 5 5
No information for fertility 9 8
Sources of Fertility Data Sources of Fertility Data Percentages from 1998-1999 recordsPercentages from 1998-1999 records

Uberlandia, Brazil 2007 (13) P.M. VanRaden200
7
0
500
1000
1500
2000
2500
3000
51 -
70
71 -
90
91 -
110
111
- 130
131
- 150
151
- 170
171
- 190
191
- 210
211
- 230
231
- 249
Days Open
Lac
tati
on
s (t
ho
usa
nd
s)
≤
50≥ 250
Distribution of Days to ConceiveDistribution of Days to ConceiveHolstein Calvings 1990 - 2001Holstein Calvings 1990 - 2001
Cows culled for reproductive reasons

Uberlandia, Brazil 2007 (14) P.M. VanRaden200
7
Seasonal Effects on FertilitySeasonal Effects on FertilityHolsteins calving since 1997 in each USA regionHolsteins calving since 1997 in each USA region
-30
-20
-10
0
10
20
30
1 2 3 4 5 6 7 8 9 10 11 12
Month
Day
s O
pen
Midwest
Northeast
Northwest
Southeast
Southwest

Uberlandia, Brazil 2007 (15) P.M. VanRaden200
7
USA Cow Fertility EvaluationUSA Cow Fertility Evaluation
Holstein data in evaluation• 44 million lactation records since 1960• 17 million cows• Lactations 1-5 are included
Reliability for recently proven bulls • 59% REL for Daughter Pregnancy Rate• 61% REL for Productive Life• 69% REL for Somatic Cell Score• 85% REL for Milk Yield

Uberlandia, Brazil 2007 (16) P.M. VanRaden200
7
USA Evaluation MethodsUSA Evaluation Methods
Animal model, introduced in 2003• Use same programs as other USDA traits• Compare cows within herd, season, and
age• Convert to pregnancy rate (4 more days to
conceive = 1% lower pregnancy rate)
Fertility parameter estimates used:• Heritability = 4%• Repeatability = 11%• Sire-by-herd interaction = 4%

Uberlandia, Brazil 2007 (17) P.M. VanRaden200
7
Recent USA ChangesRecent USA ChangesNovember 2003 and November 2004November 2003 and November 2004
Earlier evaluation of cow fertility• Records in progress used at 130
instead of 250 days in milk• Pregnancy exams used in prediction• 6% gain in reliability of DPR for new
bulls
Fertility used to predict longevity• 4% gain in REL of PL for recent bulls

Uberlandia, Brazil 2007 (18) P.M. VanRaden200
7
All-Breed Animal ModelAll-Breed Animal Model
Combined analysis of all breeds
Data from crossbreds included
Genetic differences among breeds are estimated
Planning to implement in May 2007

Uberlandia, Brazil 2007 (19) P.M. VanRaden200
7
Genetic Trends for Each BreedGenetic Trends for Each Breed Daughter Pregnancy Rate, 1960-2000Daughter Pregnancy Rate, 1960-2000
-1012345678
1960 1970 1980 1990 2000
Birth Year
Bre
ed
ing
Va
lue Ayrshire
Brwn Sws
Guernsey
Holstein
Jersey
Mlk Shrtn
+1.8% Heterosis

Uberlandia, Brazil 2007 (20) P.M. VanRaden200
7
Correlation of Yield and Fertility Correlation of Yield and Fertility r = - .35r = - .35
-2000
-1500
-1000
-500
0
500
1000
1500
-6 -4 -2 0 2 4 6
PTA DPR
PT
A M
ilk (
kg
)

Uberlandia, Brazil 2007 (21) P.M. VanRaden200
7
Coefficients of Variation (CV)Coefficients of Variation (CV)Standard deviation divided by meanStandard deviation divided by mean
TraitHerit-ability
CV (%)Pheno- typic Genetic
Stature .42 3 2
Protein yield .30 13 7Longevity .08 54 16Fertility .04 65 13

Uberlandia, Brazil 2007 (22) P.M. VanRaden200
7
Value of Cow FertilityValue of Cow Fertility
Fertility expenses per day open• Heat detection ($20 / lact .005) = $.10• Semen ($15 / unit + $5 labor) *.025 = $.50• Pregnancy exam ($10 / exam)*.012 = $.12• Lactations too long or short = $.75
Value of DPR as % of total economic value• 9% in Lifetime Net Merit• 5% in TPI, also• -2% for dairy form in TPI

Uberlandia, Brazil 2007 (23) P.M. VanRaden200
7
Cow Fertility Trait Cow Fertility Trait HeritabilitiesHeritabilities and Genetic Correlations and Genetic Correlations
Trait Days Conc.
Days 1st
Cow CR
Heifer CR
Days to Conceive .04 .85 -.21
Days to 1st Service .07 .24
Cow Conc. Rate .01 .39
Heifer Conc. Rate .005
Heritabilities on diagonal

Uberlandia, Brazil 2007 (24) P.M. VanRaden200
7
InterbullInterbull
Provides international evaluations using data from 26 countries• Europe, North America, Australia,
New Zealand, S. Africa, Israel, Japan• No South American countries yet
Office located in Sweden
Many traits are evaluated

Uberlandia, Brazil 2007 (25) P.M. VanRaden200
7
Countries with Most HolsteinsCountries with Most Holsteinsand Interbull abbreviationsand Interbull abbreviations
Country Name
USA United States
DEU Germany
FRA France
NZL New Zealand
NLD Netherlands
CAN Canada
GBR Great Britain (U. Kingdom)

Uberlandia, Brazil 2007 (26) P.M. VanRaden200
7
Fertility Traits and EmphasisFertility Traits and Emphasis In Largest Holstein PopulationsIn Largest Holstein Populations
Trait Country USA DEU FRA NZL NLD CAN GBR
Emphasis (%) 9 1 13 7 10 5 7
Days to Conceive
Yes Yes Yes Yes
Days to first AI Yes Yes Yes Yes
Conception rate
Yes Yes Yes Yes Yes
Heifer conception
Yes Yes

Uberlandia, Brazil 2007 (27) P.M. VanRaden200
7
Fertility Trait IndexesFertility Trait Indexes% of fertility emphasis% of fertility emphasis
Trait NLD ITA ESP CAN DNK1 USA2
Days to 1st service 54 56 52 25 15 69
Conception Rate 46 44 48 65 70 31
Heifer fertility 10 15
1Time from first to last insemination replaces non−return rate2Countries that evaluate days to conception or calving interval

Uberlandia, Brazil 2007 (28) P.M. VanRaden200
7
Countries with Days to ConceptionCountries with Days to Conceptionand Interbull abbreviationsand Interbull abbreviations
Country Name
BEL Belgium
DFS Denmark-Finland-Sweden
ESP Spain
GBR Great Britain (U. Kingdom)
IRL Ireland
ITA Italy
NLD Netherlands
USA United States

Uberlandia, Brazil 2007 (29) P.M. VanRaden200
7
Fertility Genetic Correlations Fertility Genetic Correlations Interbull test run, Sept. 2006Interbull test run, Sept. 2006
BEL DFS ESP GBR IRL ITA NLD USA
BEL .85 .94 .89 .86 .78 .86 .88
DFS .85 .84 .89 .73 .86 .91 .85
ESP .94 .84 .88 .81 .87 .86 .93
GBR .89 .89 .88 .82 .85 .86 .82
IRL .86 .73 .81 .82 .76 .75 .72
ITA .78 .86 .87 .85 .76 .84 .86
NLD .86 .91 .86 .86 .75 .84 .83
USA .88 .85 .93 .82 .72 .86 .83

Uberlandia, Brazil 2007 (30) P.M. VanRaden200
7
Correlation of NLD and USA Fertility Correlation of NLD and USA Fertility r = .91r = .91
-5
-4
-3
-2
-1
0
1
2
3
4
80 85 90 95 100 105 110 115
PTA DPR (NLD)
PT
A D
PR
(U
SA
)

Uberlandia, Brazil 2007 (31) P.M. VanRaden200
7
Genetic Correlations of Traits Genetic Correlations of Traits Mark, 2003 EAAP meetingMark, 2003 EAAP meeting
Trait Coun-tries
Average corr.
Protein 27 .87
Stature 21 .89
Fore Udder 21 .75
Somatic Cell Score 20 .85
Longevity 14 .59
Direct Calving Ease 10 .83
Maternal Calving Ease 10 .58

Uberlandia, Brazil 2007 (32) P.M. VanRaden200
7
Reporting of Daughter FertilityReporting of Daughter FertilityNational evaluation scalesNational evaluation scales
Scale Mean SD Scale Mean SD
BEL 0 4 GBR 0 3
CAN 66 3 ISR 0 2.5
CZE 0 3 IRL 0 2.5
DEU 100 12 ITA 100 5
DFS 100 10 NLD 100 4
ESP 100 10 NZL -8 4
FRA 0 1 USA 0 1.4

Uberlandia, Brazil 2007 (33) P.M. VanRaden200
7
Days to ConceptionDays to ConceptionCorrelations with other traitsCorrelations with other traits
MilkDairy Form SCS
Long-evity
DNK .31 .18 -.34
ESP .38 .36 .16 -.38
GBR .36 .40 .13 -.30
IRL .40 -.49
NLD .52 .43 .13 -.06
USA .21 .31 .12 -.48

Uberlandia, Brazil 2007 (34) P.M. VanRaden200
7
SkewnessSkewness
0
10
20
30
40
50
-4 -3.5 -3 -2.5 -2 -1.5 -1 -0.5 0 0.5 1 1.5 2 2.5 3
Standard Deviation
Perc
enta
ge
Normal
Skew (0.5)
Uberlandia, Brazil 2007 (35) P.M. VanRaden200
7
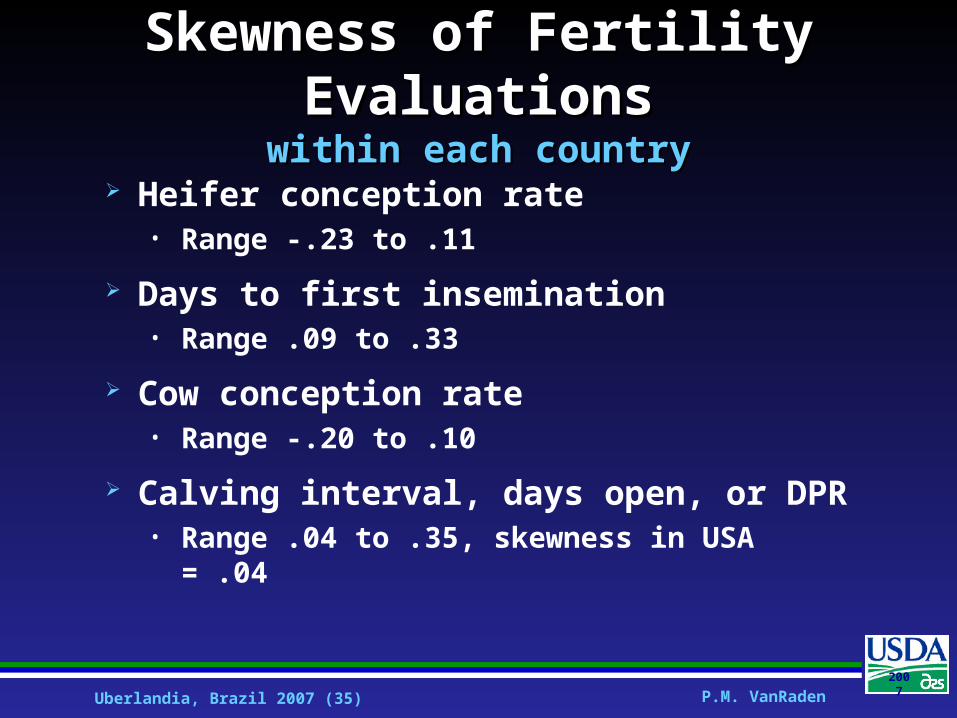
Skewness of Fertility EvaluationsSkewness of Fertility Evaluationswithin each countrywithin each country
Heifer conception rate• Range -.23 to .11
Days to first insemination• Range .09 to .33
Cow conception rate• Range -.20 to .10
Calving interval, days open, or DPR• Range .04 to .35, skewness in USA = .04

Uberlandia, Brazil 2007 (36) P.M. VanRaden200
7
Skewness of FertilitySkewness of Fertility
Fertility trait data often have unusual distributions
Genetic evaluations are close to normally distributed
Standard linear models work well for large data sets

Uberlandia, Brazil 2007 (37) P.M. VanRaden200
7
Effects of SynchronizationEffects of Synchronization
Days to first insemination has less variation if herds synchronize heat
Sire rank for days to conception is similar in herds with heat detection or synchronization (Goodling et al, 2005 JDS)
DPR is adjusted for differences in herd variation

Uberlandia, Brazil 2007 (38) P.M. VanRaden200
7
Are Fertility Proofs Stable?Are Fertility Proofs Stable?
Bulls have about 100 daughters in first crop
Bulls later have thousands of daughters in second crop
How accurate are predictions?
Examined Select Sires bulls

Uberlandia, Brazil 2007 (39) P.M. VanRaden200
7
Top DPR Proof StabilityTop DPR Proof StabilitySelect Sires bulls born 1995-96, high reliability in 2006Select Sires bulls born 1995-96, high reliability in 2006
Bull 2003 2004 2006
Mozer +.5 +.8 +.6
Geno +.3 +.6 +.5
Beach +.2 +1.6 +1.4
Brass +.2 -.3 -.9
Alloy +.0 -.1 +1.2
Reliability 67% 82% 96%DPR adjusted to 2005 base
Uberlandia, Brazil 2007 (40) P.M. VanRaden200
7
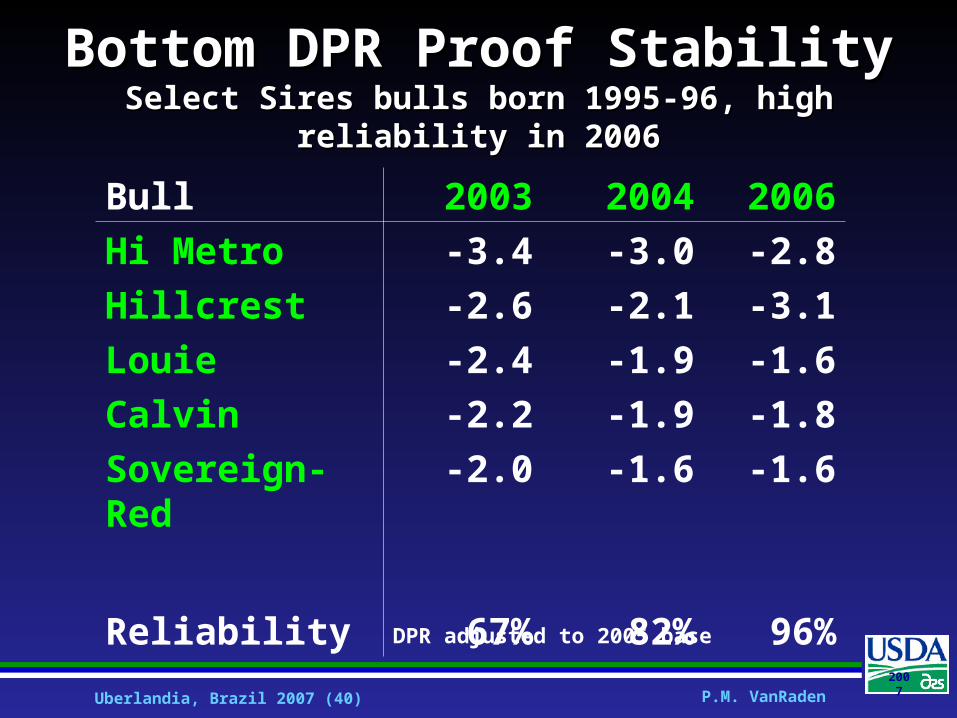
Bottom DPR Proof StabilityBottom DPR Proof StabilitySelect Sires bulls born 1995-96, high reliability in 2006Select Sires bulls born 1995-96, high reliability in 2006
Bull 2003 2004 2006
Hi Metro -3.4 -3.0 -2.8
Hillcrest -2.6 -2.1 -3.1
Louie -2.4 -1.9 -1.6
Calvin -2.2 -1.9 -1.8
Sovereign-Red -2.0 -1.6 -1.6
Reliability 67% 82% 96%DPR adjusted to 2005 base

Uberlandia, Brazil 2007 (41) P.M. VanRaden200
7
Daughter Fertility of Active BullsDaughter Fertility of Active Bulls
+1.8% DPR average for top 10% –2.1% DPR average, bottom 10% Difference = 16 days to conception Reliability for bulls averages 63%

Uberlandia, Brazil 2007 (42) P.M. VanRaden200
7
Daughter Fertility of Famous BullsDaughter Fertility of Famous BullsNovember 2006 USA scaleNovember 2006 USA scale
Coun-tries
Daughters DPR
Total USA REL PTA
Die-Hard 11 25,256 15,160 99% 2.7
Duster 8 32,399 27,602 99% 2.2
Manfred 15 19,292 8,011 99% 2.0
Morty 13 20,481 4,177 97% -2.5
Demand 14 38,388 17,972 99% -2.2
Emerson 18 50,811 31,245 99% -2.2

Uberlandia, Brazil 2007 (43) P.M. VanRaden200
7
ConclusionsConclusions
Bulls with good fertility and daughter fertility are available
Cow fertility traits receive 1% to 13% of total selection in many countries
Select for fertility using an index Fertility traits have lower heritability but
more variation than yield and type Management and genetics affect fertility

Uberlandia, Brazil 2007 (44) P.M. VanRaden200
7
Questions?Questions?