2007-03-15 eng presentazione (senza speech) · microsoft powerpoint - 2007-03-15 eng presentazione...
TRANSCRIPT

UNIPOL GROUP
2006 RESULTS PRESENTATION

2
Disclaimer
This presentation contains information relating to forecasts
of figures, results and events which reflect the current
management outlook, but these could differ from what
actually happens owing to events, risks and market factors
that it is presently impossible either to know or to predict.

3
Agenda
Insurance Business3
2 Summary of Consolidated Results
Banking Business4
5 Conclusions
11 2006 -2007 Key Events2006 -2007 Key Events

4
2006/2007 Key events
January 2006: Appointment of Mr. P. Stefanini as Chairman and
Mr. V. Galanti as Vice-Chairman
February 2006: Agreement with BNP Paribas to sell the BNL Stake
and 5-year exclusive agreement to distribute
bancassurance products through the BNL Network
April 2006: Sold BNL stake
June 2006: Appointment of Mr. C. Salvatori as new CEO
September 2006: 2006 – 2009 Industrial Plan
December 2006: Start of the Reorganization Plan to set-up the new
group Unipol Gruppo Finanziario
March 2007: Conclusion of the PTO launched on Aurora: 87.47%
shares, subject to the Offer were tendered for a final
657 EUR/m expenditure. As of today, Unipol owns
95.8% of Aurora Assicurazioni share capital.

5
Agenda
Insurance Business3
22 Summary of Consolidated ResultsSummary of Consolidated Results
Banking Business4
5 Conclusions
1 2006-2007 Key Events

6
2004 2005 2006
INSURANCE BUSINESS (Direct Premium Income - local GAAP) INSURANCE BUSINESS MARKET SHARES
BANKING INCOME – UNIPOL BANCA LOANS TO CUSTOMERS - UNIPOL BANCA
10,77710,730EUR/m
Life
Non.Life
+0.4%
Life
Non-Life
2005 2006
Funds
Deposits
EUR/m
+12%
+14%
2005 2006
5,2616,251 +19%
EUR/m
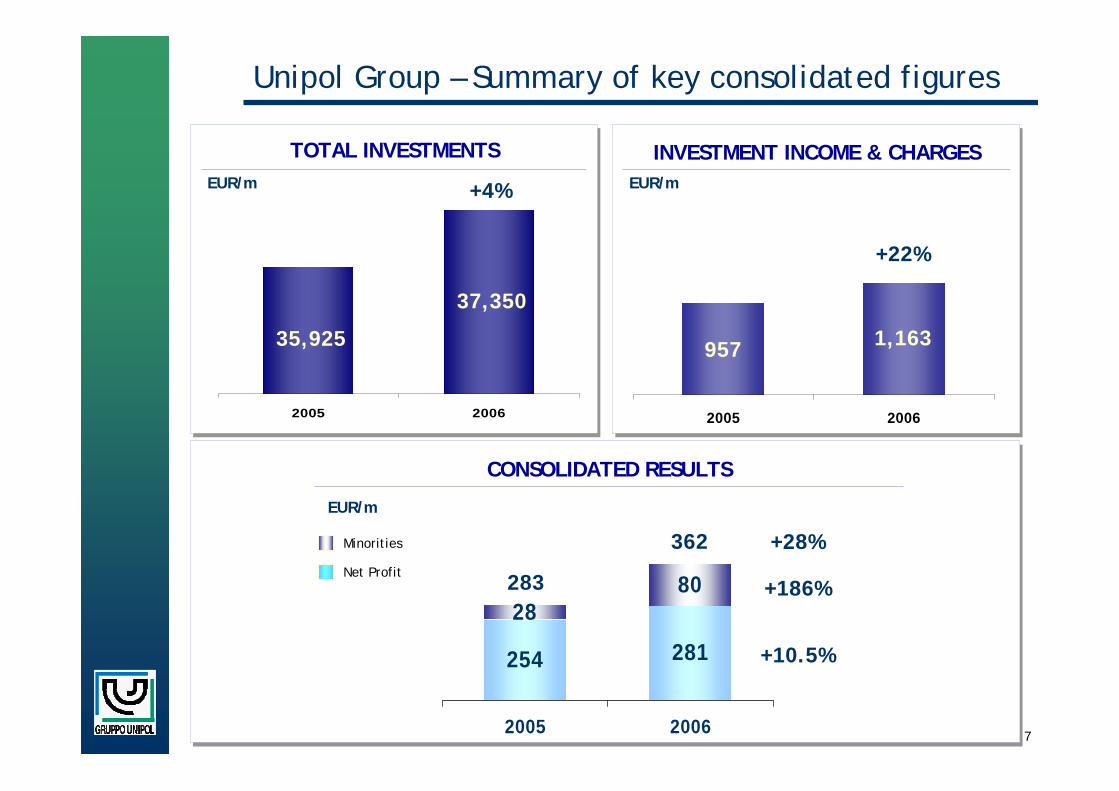
Unipol Group – Summary of key consolidated figures
4,06
1
3,94
8 6,71
6
6,78
2
2005 2006
10.9% 10.9% 10.9%E
8.7%
9.2% 9.4%E
23,6
45
26,3
54
6,95
1
7,91
2
-1%
+2.9%
+18.6%
+2.1%
7
EUR/m
254 281
2880
2005 2006
283
362
2005 2006
EUR/m
TOTAL INVESTMENTS
CONSOLIDATED RESULTS
2005 2006
EUR/m
INVESTMENT INCOME & CHARGES
+4%
+22%
+28%Net Profit
Minorities
Unipol Group – Summary of key consolidated figures
957 1,16335,925
37,350
+186%
+10.5%
8
Agenda
Insurance BusinessInsurance Business33
2 Summary of Consolidated Results
Banking Business4
5 Conclusions
1 2006-2007 Key Events

9
Life Premium Income
Insurance Income and Life Premiums
Income by channel
Pension Funds 1% (3% in 2005)
Traditional 35%(37% in 2005)
Index/Unit Linked 33%(21% in 2005)
Capital redemption
31%(38% in 2005)
Multi business companies 2,730 -10.0%
Bancassurance 3,986 +6.3%
Income by Company
EUR/m EUR/m
Agencies 1,231 +17.5% 18%
BankingOutlets 4,396 +7.5% 65%
FinancialAdvisers 115 +79.7% 2%
% on total
Head OfficeBroker 15%974 -38.4%
6,78
2
6,71
6
4,69
5
4,23
8
2005 2006
Local Gaap IFRS4 premiums
-1.0%
+10.8%
EUR/m

10
Embedded Value
IN-FORCE VALUE430
In Force 31.12.2005
Var.
(23)
Change inBNL Vita
agreement
In Force 31.12.2006(same rates)
(6)
424389
In Force 31.12.2006
(BNL Vitanew agreement)
In Force 31.12.2006
366
Discount rate: 6.0% Yield rate: 4.25%
(35)
Change in rates
EUR/m
Discount rate: 6.5%Yield rate: 4.25%
HYPOTHESIS ADOPTED
Figures relating to New Business Value and Life Embedded Value are net of taxes, policyholders’ benefits, cost of capital and minorities.
HYPOTHESIS ADOPTED 2005:
- Discount rate: 6.00% - Yield rate: 4.25% - Tax-rate: 35%
HYPOTHESIS ADOPTED 2006:
- Discount rate: 6.50% - Yield rate: 4.25% - Tax-rate: 35%
LIFE EMBEDDED VALUE
20062005
EUR/m
430
1,609
Adj. shareholders’ equity and reserves In Force Value
2,039
366
1,849
1,483
-9%
of whichchanges in
AFS reservesfor 130 EUR/m

11
New Business Value and A.P.E.
NEW BUSINESS VALUE
97.3
EUR/m
61.2
100
68.3
2005 2006 2006 2006
A.P.E.EUR/m
20062005
470437 -7.0%
Old rates and previous
agreement with BNL
New agreement with BNL
Change in rates and new
agreement with BNL

12
2005 2006
Unipol 1,476 +3.3%
Othercompanies of
the Group
2,585 +2.6%
62%
15%
10%
4%EUR/m
EUR/m
+2.0%
+4.2%
+2.9%
Non-Life Premium Income
NON-LIFE DIRECT PREMIUMS
INCOME BY COMPANY INCOME BY CHANNEL
Accident/Health
Motor
Fire/Other damage to property
General T.P.L.
Other
3,948 4,061
2,454 2,503
1,494 1,558
Agencies 3,527 +2.5%
Head Office/Brokers 357 +3.3%
DirectChannel +8.7%
86.8%
8.8%
4.4%
% on total
177
3,527
EUR/m
Motor Non - Motor
9%

13
Non-Life business: Figures
COMBINED RATIOnet of reinsurance
94.6%
73.1%
21.5%
20062005
93.8%
22.6%
71.2%
Expense Ratio
Loss Ratio
RESERVES AND RESERVE RATIO (*)
7.1 7.4
181%180%
2005 2006
+3%
EUR/bn
* Non-Life Technical Provisions / Non-Life Gross Written Premiums
MOTOR T.P.L. SETTLEMENT SPEED
64.5%65.4% +90 b.p.
(current year)
20062005
MOTOR T.P.L. AVG. CLAIMS COST
2006
7,570 +1.6%*
EUR
2005
7,450
*vs 2.1% 2006 inflation rate (ISTAT)
14
Agenda
Insurance Business3
2 Summary of Consolidated Results
Banking BusinessBanking Business44
5 Conclusions
1 2006-2007 Key Events

15
Unipol Banca – Key Financials
DEPOSITS AND LOANS CUSTOMER FUNDS
+19%
EUR/M
2005 2006
+12%
EUR/M
4,96
8
5,26
1 5,29
5
6,25
1
LendingCustomer Deposits
2005 2006
21,5
91
24,2
04
2,0552,15123,64526,354
Funds Under Custody
+11%
+14%Assets Under Management
NON-PERFORMING LOANS
2005 2006
Cover Ratio 58.3% 62.5%
0.64% 0.66%
Net Non-Performing Loans 34 41
EUR/M
Lending 5,261 6,251
Net bad and doubtful loans/Net loans
6,95
1
7,91
2

16
Unipol Banca – Key Financials
GROSS OPERATING INCOME COST / INCOME RATIO
187241
+29% 84.3%69.5% -148 b.p.
EUR/M
2005 2006 2005 2006
NET PROFITEUR/M
2005 2006
30.2
-4.0
DISTRIBUTION NETWORK
2005
440
250
45
Branches
FinancialAdvisers
Fin. Countes 418
39
mar 2007
268
o/w 146 integratedwith ins. agencies
o/w 129 integratedwith ins. agencies

17
Agenda
Insurance Business3
2 Summary of Consolidated Results
Banking Business44
5 ConclusionsConclusions
1 2006-2007 Key Events

18
2005 2006
+28%
283
362
Consolidated Profit and R.O.E.
R.O.E.
7.7%
2005 2006
CONSOLIDATED PROFIT (EUR/M)
9.1%*
* Excess Capital excluded
6.3%

19
Proposed dividend
Ordinary 88.4 %
Total Dividends (ord.+pref.) 20062005
97.1%
20062005
Preference shares
2006
0.1252DPS
Dividend Yield
0.1252
5.45%
2005
4.90% Dividend Yield 4.51% 4.26%
Payout*
0.12000.1200
20062005
Extraord.
Ordinary 193.5
94.4
287.9
181.7
106.2
287.9
-6.1%
+12.5%
Ordinary shares
DPS
EUR/m
Dividend yield as calculated on the Board Directors’ Meeting previous date.
Share Price Share Price2.299 2.6632.554 2.814
Number of shares 1,460,524,546899,619,864 Number of shares
* On Parent Company result

20
2.7 -0.3
2.5 -0.7
1.8
EUR/bn
Unipol Group Excess Capital rolled-forward
2.8Ord: 0.182 Extr.: 0.106
Preliminary figures
ExcessCapital
as at31/12/2005
Dividendpayment
Unipol Ass.
PTO on Aurora
ExcessCapitalas at
15/3/2007(pro-forma)
ExcessCapital
as at31/12/2006
(before dividendPayment)
ExcessCapital
as at31/12/2006
(after dividendPayment)

21
Up-date of 2006-2009 Strategic Plan *
Confirmation of 2006-2009 Strategic Targets
Ecom
onic
s
2006 2007 2008 2009
14% ROE
• New Strategic Plan
• Group Restructuring and product innovation
• Focus on Insurance-Bankingintegrated model
•Hit strategictargets
* The current strategic plan does not include any M&A operation
• New Total Compensation forManagement

22
Contacts
Adriano Donati
Francesco Fronzoni
Investor Relations
Unipol Assicurazioni - Via Stalingrado 45 Bologna
Tel. +39.051.507.6166
Tel. +39.051.507.6563