2004 utam annual report - university of torontoindividual.utoronto.ca/goel/utam_2004_report.pdf ·...
TRANSCRIPT

UNIVERSITY OF TORONTO ASSET MANAGEMENT CORPORATION
2004
2004
AAN
NU
AL
NN
UA
LRR
EP
OR
TE
PO
RT

pp aa gg ee
I N T R O D U C T I O N 1A S S E T S U N D E R M A N A G E M E N T 1C H A I R ' S R E P O R T 2P R E S I D E N T ' S R E P O R T 3
I N V E S T M E N T O B J E C T I V E S 4A S S E T M I X 5INVESTMENT P E R F O R M A N C E 8
F I N A N C I A L S TA T E M E N T S
AUDITORS’ REPORT 13BALANCE SHEET 14STATEMENT OF EXPENSES AND RECOVERIES 15NOTES TO FINANCIAL STATEMENTS 16
U TA M B O A R D O F D I R E C T O R S 1 8U TA M C O R P O R A T I O N 1 9
U TA M A n n u a l R e p o r t 2 0 0 4
All market values and returns mentioned in this report are in Canadian dollar terms, unless otherwise stated.
TT A B L EA B L E O FO F CC O N T E N T SO N T E N T S
M I S S I O N
The University of Toronto Asset Management Corporation strives to create added value by providing both current and future financial resources for the University and its pension funds that willcontribute to globally recognized education and research.
We will strive to provide state of the art investment management with diligence, competence andthe highest of professional conduct, and continually seek out and formulate the best investment ideas into prudently managed portfolios that optimally balance risk and return.
U TA M A n n u a l R e p o r t 2 0 0 4

U T A M
II N T R O D U C T I O NN T R O D U C T I O N
The University of Toronto AssetManagement Corporation (UTAM) was established by the University in April 2000.UTAM is an investment management subsidiary wholly owned by the Universityand governed by its own Board of Directors.The UTAM Board is responsible for the oversight and direction of UTAM and reportson the investments under management to theBusiness Board of the University of Toronto.
The audited financial statements for theoperations of UTAM for the year endedDecember 31, 2004 are presented at the end ofthis report. The assets invested by UTAM, discussed below, are held by the University ofToronto and are reported, as applicable, in theUniversity's financial statements, and in theUniversity of Toronto Pension Plan and OISEPension Plan financial statements.
U N I V E R S I T Y O F T O R O N T O A S S E T M A N A G E M E N T C O R P O R A T I O N
A N N U A L R E P O R T 2 0 0 4
UTAM oversees the University ofToronto's three pools of assets, which in totalwere valued at $4.25 billion at December 31,2004 ($3.98 billion at December 31, 2003), anincrease of 6.9%.
The Pension Master Trust (Pension) investment fund combines the assets of theUniversity of Toronto Pension Plan and OISEPension Plan. The market value of these assetsat December 31, 2004 was $2.31 billion, anincrease of $190 million (9.0%) over the previous year-end.
The Long Term Capital Appreciation Pool
(LTCAP) essentially represents the endowment fund of the University. The market value at December 31, 2004 was $1.51billion, an increase of $158 million (11.7%)over the previous year-end.
The Expendable Funds Investment Pool(EFIP) consists of expendable funds that arepooled for investment for the medium term.The nature of the use of these assets meansthat the total can fluctuate significantly overtime. The market value at December 31, 2004was $430 million, a decrease of $75 millionfrom the previous year-end.
Exhibit 1
AA S S E T SS S E T S UU N D E RN D E R MM A N A G E M E N TA N A G E M E N T
Assets Under Managementas at December 31
410
1,126
1,908
3,444
505
1,355
2,117
3,976
430
1,513
2,307
4,250
$0
$1,000
$2,000
$3,000
$4,000
$5,000
EFIP LTCAP Pension Total
$ M
illio
ns
2002 2003 2004
U TU T A MA M2
I am pleased to reportthat 2004 was a successfulyear for the University ofToronto Asset ManagementCorporation. UTAM wasestablished in April 2000,which we now know was
the top of the equity marketworldwide. Markets have gradually recoveredfrom the two-year decline that followed, andboth 2003 and 2004 have provided good gainsfor the University's endowment and pensionfunds.
2004 was the first year that our President,Felix Chee, was able to devote himself to UTAMon a full-time basis, and he has been very active.There have been some personnel changes,which are never easy and not surprising, but theUTAM team appears to be stronger than ever.Felix is doing a great job managing our assets.
Our Board of Directors has been expandedand bolstered by the addition of four new people. Mr. William Hewitt and Mr. RobertMorrison joined our Board in May. These twogentlemen held very senior financial roles in theCanadian life insurance industry and both areeminently well equipped to contribute to theBoard's decision-making. Both have joined theAudit and Compliance Committee and are providing strong support to its Chair, ProfessorEric Kirzner.
UTAM's Board was further strengthened bythe addition of the Honourable Frank Iacobucci,Interim President of the University of Toronto,who is ably filling the seat held by the formerPresident Robert Birgeneau. ProfessorBirgeneau played an active role at UTAM during his tenure, and I wish him every success
in his new role as Chancellor of the Universityof California at Berkley.
Finally, in December, Mr. W. David Wilson,Vice-Chair of the Bank of Nova Scotia and CEOof Scotia Capital, joined the Board as the cross-appointment between the Board and the University's Governing Council. This outstanding appointment will add even furtherstrength to an extraordinary group of directors.
I would like to thank Ms. Andrea Rosen forher very valuable service on the Board and onits Audit and Compliance Committee. Uponthe birth of her second daughter, Andrea decided, regrettably, not to continue on the Board for 2004, as she decided to take leave from her very senior role at the TD Financial Group.
UTAM is well situated in our unpredictableworld with an asset mix of stocks, bonds, private equity funds, real-asset funds, hedgefunds and a diverse currency mix. The fund is managed with a view to long-term performance.
I would like to thank the staff of UTAM fortheir very hard work, and I would like to thankmy colleagues on the Board of Directors for thecontribution of their extraordinary expertiseand seasoned wisdom, for many stimulating discussions, and for the support they so graciously give to their Chair. My specialthanks to Vice-Chair Joseph Rotman, Audit andCompliance Committee Chair Eric Kirzner, andCompensation Committee Chair Tom Simpson.
Ira GluskinChairman
C H A I R ’ S R E P O R T

U TU T A MA M3
Amidst choppy financialmarkets and geopoliticalturmoil, UTAM had another successful year in2004. Both LTCAP andPension returns were betterthan their benchmark.
From a peer universe comparison basis, both funds were again in the1st quartile.
2004 also saw some significant strategychanges. First, we unwound our investments invirtually all of our direct hedge funds andmoved into absolute return hedge fund-of-funds. This change reflected prudence to leverage the necessary knowledge and infrastructure critical in this area. An extensivesearch was conducted and to date four fund-of-funds have been selected.
In 2004, an overall strategy for PrivateEquities and Real Assets was approved byUTAM's Board and subsequently six new commitments totalling some $89 million havebeen made. The strategy provides a roadmapfor our activities over this wide and diversespace of alternative investments.
2004 was also a year of organizationalchanges, both in terms of personnel and ourmanagement process. John Lyon joined UTAMin May 2004 as Managing Director ofInvestment Strategy, and has contributed significantly to enhancing our investmentprocess and management reporting. Our focus
has moved from one that primarily dealt withexternal manager selection to one that focuseson portfolio strategy, both at the overall portfolio level and for each asset class.
Looking forward to 2005, UTAM will continue to innovate in order to generate competitive returns in increasingly volatile anduncertain markets. Specifically, we will be initiating a program to separate market returnsfrom value added by active management. Thisprogram will enhance our performance as wellas creating greater portfolio management flexibility. As always, our mantra is to be nimble, smart and cost effective.
We continue to enjoy and are highly appreciative of the support from our Board ofDirectors and also the University. I would liketo take this opportunity to welcome all the newBoard members and to express our appreciationto all Board members for the wise counsel thatthey openly and generously provide.
The success that UTAM has enjoyed in thepast two years is in no small part the result ofthe dedication and effort of the staff. I thankthem for their contribution and now look forward to 2005 with momentum and confidence.
Felix P. CheePresident and CEO
P R E S I D E N T ’ S R E P O R T

U TU T A MA M4
I N V E S T M E N T O B J E C T I V E S
The investment objectives, in terms of risk and return, of the portfolios overseen byUTAM are reviewed on an annual basis by the University, which establishes these parameters.
Pension LTCAP
2004
Return Target 7% nominal return plus fees and levies
4% real return plus fees and levies
Risk Tolerance 10% annual standard deviation of nominal returns
10% annual standard deviation of nominal returns
2005
Return Target 4% real return plus fees and levies
same as 2004
Risk Tolerance same as 2004 same as 2004
For EFIP, the return requirements werepreviously set as an absolute return levelfor the year. However, a comprehensivereview and asset modeling of EFIP, andthe investment objectives for that
portfolio, was completed in 2004. As a result, the return requirement was
changed from an absolute level to 1-yearTreasury Bills plus 50 basis points, with amoderate tolerance for risk.

U TU T A MA M5
A S S E T M I X
PP O L I C YO L I C Y AA S S E TS S E T MM I XI X
UTAM develops and executes appropriate investment strategies, including the policy asset mix, based onthe risk and return parameters established by the University. The policyasset mix of the portfolios is periodicallysubjected to a comprehensive review, in conjunction with the liability requirements of the portfolios. In 2004, itwas only considered necessary to undertake a full review of EFIP, whichresulted in a number of changes to thepolicy asset mix for that portfolio for2005. For Pension and LTCAP, the policyasset mix remains the same for 2004 and 2005.
The return requirements and risk tolerance for Pension and LTCAP are
essentially the same. Therefore, the policy asset mix of these two portfolios isvery similar, the key difference arisingbecause the Pension portfolio was subjectto foreign content restrictions. As a result,the policy asset mix weights for USEquities and International Equities in thePension portfolio are each 5% less than inLTCAP, with the 10% difference allocatedto Fixed Income (5% for nominal bondsand 5% for real return bonds).
For both Pension and LTCAP, the portfolios can be viewed as essentially"balanced funds", which would traditionally have about a 60% allocationto equities and 40% to fixed income. Theresulting 3:2 ratio (i.e. 60:40) is approximated in the policy asset mix for
Asset Mixas at December 31, 2004
0%
10%
20%
30%
40%
Canadian Equities US Equities InternationalEquities
Fixed Income Absolute Return Real Assets Private Equities
Wei
ght
Pension Actual LTCAP Actual Policy Asset Mix
Exhibit 2

U TU T A MA M6
thesea s s e tc lasses .T h ei n t r o -
duction of a 30% target weight inAlternative Assets (Absolute Return, RealAssets and Private Equities allocations of
10% each) provides the opportunity to benefit from diversification, through lower correlations, and enhanced return potential. In addition, the AbsoluteReturn allocation provides the opportunity for lower volatility and theReal Assets allocation provides a hedgeagainst inflation.
For EFIP, the change in return target to1-year Treasury Bills plus 50 basis pointshas resulted in a more fundamentalchange to the policy asset mix. There isnow a larger allocation to the AbsoluteReturn category, with an average targetweight of about 25-30%, which wouldpotentially rise to about 40% at theexpected annual low-point in total EFIPassets. The Fixed Income portion of EFIPwill be more heavily oriented towardsshorter term holdings than was previously the case, but still targeted at investment grade holdings. The netresult is expected to be lower volatility.
AA C T U A LC T U A L AA S S E TS S E T MM I XI X
There are two key sources of divergence between the policy asset mix,or target weight, and the actual asset mix.
Firstly, UTAM management has thediscretion to diverge from the policy assetmix to a pre-determined modest limit,which depends on the size of the targetweight (i.e. more latitude for larger target
A S S E T M I X
Exhibit 2: The pie charts illustrate the assetmix policy of the LTCAP and the Pension
fund as of December 31, 2003
U TU T A MA M7
weights).Secondly, participation in certain asset
classes (e.g. Private Equities) requires significant time and effort to source andfund investments, compared to publicmarket securities. As a result, holdingsaccumulate slowly over time such that theactual asset mix builds gradually towardsthe policy asset mix. This situationapplies to UTAM's Private Equities andReal Assets categories, which are eachcomprised of private market investments.In the interim while holdings are built upin these asset classes, UTAM allocates theshortfall from the target weight, on a prorata basis, to the public market equitiesand public fixed income asset classes.This reallocation process creates near-term target weights (not shown inExhibit 2) that provide the flexibility for adisciplined build-up in the PrivateEquities and Real Assets holdings overtime, towards the policy asset mix shownin Exhibit 2.
Absolute Return holdings can be builtup to target levels more quickly thanPrivate Equities and Real Assets holdings.The shortfall from policy asset mix atyear-end simply reflects the temporaryimpact of a partially completed transitionfrom hedge funds to hedge fund-of-fundsholdings in this category.
FF O R E I G NO R E I G N EE X C H A N G EX C H A N G E EE X P O S U R EX P O S U R E
The underlying philosophy at UTAMis to exploit global opportunities. Thisfocus results in foreign exchange exposure. To control the volatility fromforeign currency fluctuations impactingoverall returns, a hedging policy withvarying hedge ratios for different assetclasses was established in 2003.
The hedge ratios for the applicable benchmarks are:
i) 50% for Equities and Real Assets;ii) 100% for Non-Canadian Fixed
Income; and iii) 75% for Absolute Return.
The 50% hedge ratio for Equities andReal Assets reflects a "minimum regret"outcome on hedging. For Fixed Income,where stable returns are desired, the100% hedge ratio insulates the asset classfrom foreign exchange fluctuations butexpands the opportunity set for bonds tothe global bond markets. The 75% hedgeratio for the Absolute Return categoryrecognizes that the strategies employedreflect both bonds and equities. An active overlay strategy, within operatinglimits, is employed in managing the foreign exchange exposure. The results of this active overlay strategy are provided in Exhibit 5.
A S S E T M I X

U TU T A MA M8
UTAM evaluates investment performancein two key ways:
i) versus passive index returns(benchmarks) at the portfolio and asset class levels; and
ii) versus peers on overall portfolio level performance.
PP E R F O R M A N C EE R F O R M A N C E VV E R S U SE R S U S BB E N C H M A R K SE N C H M A R K S
All three portfolios (EFIP, LTCAP andPension) outperformed their benchmarksin 2004 at the total portfolio level, net ofall fees and expenses (see Exhibits 3 and 4). This was achieved against a backdrop of choppy markets, significantrestructuring of our portfolios and anoverall defensive posture in the underlying holdings.
At the individual asset class level, all outperformed their respective benchmarks except US Equities, NominalBonds and Absolute Return (see Exhibit 5).
Within equities, Canadian Equities performance was exceptional, given solidresults from certain active managers. The reverse was exhibited in the US Equities market, where active managers broadly underperformed. In International Equities markets, theresults were mixed among our activemanagers. A number of manager changeswere made in 2004 and an in-depthreview of our active manager line-up will
be undertaken in 2005.Part of our Equities program is
invested synthetically using indexfutures. Given the uncertain markets, oursynthetics program was oriented towardsa defensive posture in large capitalizationindexes. Overall, the synthetic programmet the benchmark.
For Fixed Income, we achieved outperformance on our allocation to RealReturn Bonds. This partially offset our deliberate defensive posture on NominalBonds, where we kept duration short andcredit quality high.
2004 was not a banner year forAbsolute Return Hedge Funds. Low equity market volatility, tight creditspreads and low interest rates were notconducive to hedge fund performancegenerally. The most significant change in 2004, however, was our transition toAbsolute Return hedge fund-of-fundsfrom direct hedge funds. This changediversified our exposure considerably,made the portfolio less directional relative to equity markets and willimprove the management of the AbsoluteReturn program in various ways. Thebenefit of this change is reflected in a current portfolio that has significantlylower volatility.
Currency was once again a significantissue in 2004. Our active currency manager contributed positively for theyear, as shown in Exhibit 5.
I N V E S T M E N T P E R F O R M A N C E

U TU T A MA M
9
Exhibit 4
Total Fund Net Rate of Returnfor Years Ended December 31
-2.6%
1.9%3.7%
-9.8%
16.0%
11.4%
-7.1%
15.7%11.4%
-15%
-5%
5%
15%
25%
2002 2003 2004
Rat
e of
Ret
urn
EFIP LTCAP Pension
Value Added*for Years Ended December 31
-2.6%
0.3%
5.1%
0.7% 0.4%1.8% 2.0%
0.6%
-7.1%-9%
-3%
3%
9%
2002 2003 2004
Rat
e of
Ret
urn
EFIP LTCAP Pension
Exhibit 3
* Value Added refers to the actual return, net of fees, less the benchmark return.
I N V E S T M E N T P E R F O R M A N C E

U TU T A MA M10
1-Year 3-Year 1-Year 3-Year
16.0 11.7 1.5 3.411.7 5.6 -0.2 0.812.0 2.5 0.1 0.411.3 9.5 -0.3 -0.17.8 8.2 -0.9 -0.6
17.6 - 0.1 -5.7 6.5 -0.5 0.49.6 4.4 - -1.8 1.8 0.5 -
11.5 6.2 0.6 1.5
18.0 13.4 3.5 5.111.2 7.2 -0.7 2.412.0 3.5 0.1 1.412.5 10.3 -0.6 0.27.2 8.1 -1.5 -0.7
18.0 - 0.5 -11.9 - 1.1 -
3.6 4.5 -2.6 -1.611.9 7.7 6.3 2.1
8.4 2.4 - -3.1 2.8 0.6 -
11.5 5.2 0.3 2.4
Asset Class Benchmark
Canadian Equities S&P/TSX Composite Index 14.5 8.3US Equities (USD) Russell 3000 11.9 4.8International Equities MSCI EAFE 11.9 2.1Nominal Bonds 50% SC Universe + 50% SC Long 8.7 8.8Real Return Bonds SC Real Return Bonds 17.5 -High Yield Bonds (USD) Merill Lynch High Yield Bond Index 10.8 -Absolute Return (USD) LIBOR (3-month) + 450 basis points 6.2 6.1Real Assets 50% NCREIF + 50% GSCI 5.6 5.6
* Refers to the actual return, net of fees, less the benchmark return.
PENSIONCanadian Equities
Rates of Return and Comparison to Benchmarksfor Periods Ended December 31, 2004
Rate of Return (%) Value Added* (%)
US Equities (in USD)International EquitiesFixed Income - Total
Absolute Return (in USD)
Nominal Bonds Real Return Bonds
Total Fund UnhedgedCurrency OverlayTotal Fund Including Hedging
LTCAPCanadian EquitiesUS Equities (in USD)International EquitiesFixed Income - Total
Absolute Return (in USD)Real Assets
Nominal Bonds
High Yield Bonds (in USD)Real Return Bonds
Total Fund UnhedgedCurrency OverlayTotal Fund Including Hedging
Exhibit 5
I N V E S T M E N T P E R F O R M A N C E
U TU T A MA M11
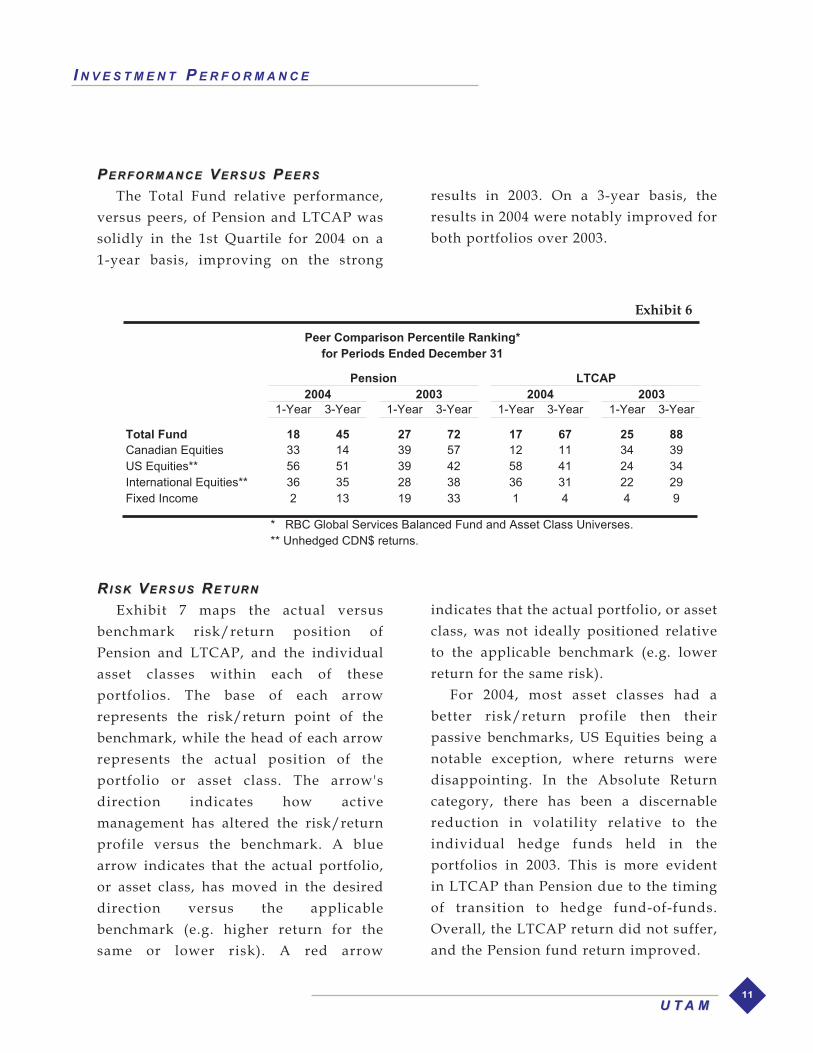
PP E R F O R M A N C EE R F O R M A N C E VV E R S U SE R S U S PP E E R SE E R S
The Total Fund relative performance, versus peers, of Pension and LTCAP wassolidly in the 1st Quartile for 2004 on a 1-year basis, improving on the strong
results in 2003. On a 3-year basis, theresults in 2004 were notably improved forboth portfolios over 2003.
1-Year 3-Year 1-Year 3-Year 1-Year 3-Year 1-Year 3-Year
Total Fund 18 45 27 72 17 67 25 88Canadian Equities 33 14 39 57 12 11 34 39US Equities** 56 51 39 42 58 41 24 34International Equities** 36 35 28 38 36 31 22 29Fixed Income 2 13 19 33 1 4 4 9
* RBC Global Services Balanced Fund and Asset Class Universes.** Unhedged CDN$ returns.
2004 2003 2004 2003
Peer Comparison Percentile Ranking*for Periods Ended December 31
Pension LTCAP
Exhibit 6
RR I S KI S K VV E R S U SE R S U S RR E T U R NE T U R N
Exhibit 7 maps the actual versus benchmark risk/return position ofPension and LTCAP, and the individualasset classes within each of these portfolios. The base of each arrow represents the risk/return point of thebenchmark, while the head of each arrowrepresents the actual position of the portfolio or asset class. The arrow's direction indicates how active management has altered the risk/returnprofile versus the benchmark. A bluearrow indicates that the actual portfolio,or asset class, has moved in the desireddirection versus the applicable benchmark (e.g. higher return for the same or lower risk). A red arrow
indicates that the actual portfolio, or assetclass, was not ideally positioned relativeto the applicable benchmark (e.g. lowerreturn for the same risk).
For 2004, most asset classes had a better risk/return profile then their passive benchmarks, US Equities being anotable exception, where returns weredisappointing. In the Absolute Returncategory, there has been a discernablereduction in volatility relative to the individual hedge funds held in the portfolios in 2003. This is more evident in LTCAP than Pension due to the timingof transition to hedge fund-of-funds.Overall, the LTCAP return did not suffer,and the Pension fund return improved.
I N V E S T M E N T P E R F O R M A N C E

U TU T A MA M12
LTCAP Risk and Return Relative to Benchmark - 12 Months
Absolute Return
Fixed Income
Total LTCAP
Canadian Equities
US Equities
International Equities
%
4%
8%
12%
16%
20%
% 5% 10% 15%Risk (Standard Deviation)
Ret
urn
Pension Risk and Return Relative to Benchmark - 12 Months
Absolute Return
Fixed Income
Total Pension
Canadian Equities
US Equities
International Equities
%
4%
8%
12%
16%
20%
% 5% 10% 15%
Risk (Standard Deviation)
Ret
urn
Exhibit 7
I N V E S T M E N T P E R F O R M A N C E

To the Board of Directors ofUniversity of Toronto Asset Management Corporation
We have audited the balance sheet of the University of Toronto Asset Management Corporationas at December 31, 2004 and the statement of expenses and recoveries for the year then ended. Thesefinancial statements are the responsibility of the Corporation’smanagement. Our responsibility is toexpress an opinion on these financial statements based on our audit.
We conducted our audit in accordance with Canadian generally accepted auditing standards. Those standards require that we plan and perform an audit to obtain reasonable assurancewhether the financial statements are free of material misstatement. An audit includes examining, on a testbasis, evidence supporting the amounts and disclosures in the financial statements. An audit also includesassessing the accounting principles used and significant estimates made by management, as well as evaluating the overall financial statement presentation.
In our opinion, these financial statements present fairly, in all material respects, the financial position of the Corporation as at December 31, 2004 and the results of its operations for theyear then ended in accordance with Canadian generally accepted accounting principles. As required by theCorporations Act (Ontario), we report that, in our opinion, these principles have been applied on a basisconsistent with that of the preceding year.
Toronto, CanadaJanuary 21, 2005
Chartered Accountants
A U D I T O R S ’ R E P O R T
U TU T A MA M13

U TU T A MA M14
See accompanying notes
On behalf of the Board of Directors
Ira GluskinChairman
B A L A N C E S H E E T
747,285
-
7,799
63,193
818,277
257,726
187,972
372,579
818,277
ASSETS
Cur rent
Cash
Due from the University of Toronto [note 4]
Accounts Receivable
Prepaid Expenses
LIABILITIES
Cur rent
Accounts Payable
Deferred Compensation Plan Payable [note 5]
Due to the University of Toronto [note 4]
As at December 31
1,602
443,816
8,059
70,094
523,571
383,541
140,030
-
523,571
2004$
2003$

U TU T A MA M15
S T A T E M E N T O F E X P E N S E S A N D R E C O V E R I E S
2,784,676
977,618
141,697
137,993
113,345
121,873
403,827
85,372
4,766,401
31,564
-
4,734,837
4,766,401
-
EXPENSES
Salaries and Benefits
Reorganization Charges [note 6]
Occupancy
Consulting Fees
Office Supplies and Services
Professional Fees
Telecommunications and Technology
Travel and Accommodation
RECOVERIES
Other Income
Recovery of Realty Taxes
Recovery from the University of Toronto [note 4]
NET INCOME FOR THE YEAR
Year ended December 31
See accompanying notes
2,756,270
-
130,600
118,389
74,414
154,512
462,727
53,065
3,749,977
26,239
100,066
3,623,672
3,749,977
-
2004$
2003$

U TU T A MA M16
N O T E S T O F I N A N C I A L S T A T E M E N T S
1. RELATIONSHIP WITH THE UNIVERSITY OF TORONTO
University of Toronto Asset Management Corporation ["UTAM"] is a corporation without share capital incorporated on April 25, 2000 by the Governing Council of the University of Toronto [the "Governing Council"] under the Corporations Act (Ontario). UTAM is a non-profit organizationunder the Income Tax Act (Canada) and, as such, is exempt from income taxes.
The principal objectives of UTAM are to create added value by providing both current and futurefinancial resources for the University of Toronto ["U of T"] and its pension funds that will contribute toglobally recognized education and research.
2. BASIS OF PRESENTATION
These financial statements present the financial position and operations of UTAM as a separate legalentity. The securities representing the investments of the funds of U of T are held on behalf of U of Tin the names of such trustees or nominees as may be directed by UTAM, but not in the name of UTAM.
3. SUMMARY OF SIGNIFICANT ACCOUNTING POLICIES
The financial statements of UTAM have been prepared in accordance with Canadian generally accepted accounting principles. The significant accounting policies are summarized as follows:
Financial instruments
The carrying values of UTAM's financial instruments approximate their fair values.
Use of estimates
The preparation of financial statements in conformity with Canadian generally accepted accountingprinciples requires management to make estimates and assumptions that affect the reported amounts ofassets and liabilities and the disclosure of contingent assets and liabilities at the date of the financial statements and the reported amount of recoveries and expenses during the reporting period. Actual resultscould differ from those estimates.
DECEMBER 31, 2004

U TU T A MA M17
4. RELATED PARTY TRANSACTIONS
In accordance with the amended and restated Service and UTAM Personnel Agreement dated May 14, 2003 between the Governing Council of U of T and UTAM, U of T will reimburse UTAM forits services an amount which will enable it to recover the appropriate costs of operations. The U of Treimburses UTAM on a quarterly basis based on the approved budget. As at December 31, 2004,$443,816 is due from U of T (2003 due to U of T $372,579) as a result of the actual costs of operationsexceeding the reimbursement. Amounts due to/from U of T are non-interest bearing and due on demand.
5. DEFERRED COMPENSATION PLAN
UTAM has entered into a revised incentive compensation plan with its employees, which is based onthe achievement of specific benchmarks and approved objectives by its Board of Directors. On approvalof the Board of Directors after year-end, the full amount is payable immediately and included in the current year financial statements.
The previous compensation agreement contained a deferral component whereby 50% of the amountpayable was paid out immediately and the balance was deferred, to be expensed over the vesting periodwhich did not exceed three years. At December 31, 2004, deferred compensation awarded but not yet vested included approximately $57,000 to be expensed in 2005. The payment of the deferred compensation is subject to the employees meeting certain conditions of employment.
6. REORGANIZATION CHARGES
During 2004, UTAM undertook a number of staff reorganization initiatives. The one-time staff costsassociated with these initiatives are presented as reorganization charges.
7. STATEMENT OF CASH FLOWS
A separate statement of cash flows has not been presented, since, in the opinion of management, theinformation it would contain is readily apparent from the other financial statements.
N O T E S T O F I N A N C I A L S T A T E M E N T S

U TU T A MA M18
U TA M B O A R D O F D I R E C T O R S
JOSEPH L. ROTMAN, Vice ChairRoy-L Capital Corporation, Chairman and CEO
ERIC F. KIRZNER, Chair of the Audit and Compliance CommitteeRotman School of Management, Professor of Finance
THOMAS H. SIMPSON, Chair of the Compensation Committee
FELIX P. CHEEUniversity of Toronto Asset Management Corporation, President and CEO
WILLIAM E. HEWITT
THE HONOURABLE FRANK IACOBUCCIUniversity of Toronto, President
ANTHONY R. MELMANOnex Corporation, Managing Director
ROBERT W. MORRISON
JAMES J. MOSSMANRetired Senior Managing Director and CIO of the Blackstone Group
CATHERINE J. RIGGALLUniversity of Toronto, VP Business Affairs
W. DAVID WILSONBank of Nova Scotia, Vice Chair
NEIL H. DOBBS, Secretary University of Toronto, Deputy Secretary to the Governing Council
MMASTER CCUSTODIAN
State Street Trust Company CanadaState Street Financial CentreToronto, Ontario M5C 3G6
AAUDITORS
Ernst & YoungErnst & Young Tower
Toronto, Ontario M5K 1J7
IRA GLUSKINCHAIR OF THE BOARD OF DIRECTORS
Ira Gluskin and Gerry Sheff founded Gluskin Sheff + Associates in 1984. Ira continues to be President andChief Investment Officer. Prior to 1984 Ira worked for a prominent life insurance company, a prominent researchbrokerage firm and a prominent mutual fund manager. All three have disappeared in the financial services consolidation that has occurred. Ira is active in a variety of business, community and cultural organizations. Heis chairman of the University of Toronto Asset Management Corporation. Ira is Chair of the InvestmentAdvisory Committee for the Jewish Foundation of Greater Toronto and a member of the Foundation Board. Heis also a member of the Mount Sinai Hospital investment and Budget Committees, as well as being a member ofits Foundation. Ira is noted for his outspoken and provocative views on all aspects of business and on the incometrust and real estate sectors in particular.
U TU T A MA M19
U TA M C O R P O R A T I O N
( S t a f f a s a t M a r c h 3 1 , 2 0 0 5 )
JOHN L. W. LYON, CFA, CAManaging Director, Investment Strategy
JEFFREY D. SUTCLIFFE, CFA, FCSIDirector, Fixed Income
LISA CHUNGManager, Operations
RABINDER GREWALInvestment Analyst
TANYA LAI, CFAInvestment Analyst
VERA LAU, CCMInvestment Operations Coordinator
JILLIAN MIRANDAAdministrative Assistant
MICHAEL NOTTOInvestment Analyst
TIFFANY PALMERManager, Compliance
MARIA WUS, CFAInvestment Analyst
ROSLYN ZHANG, CFAPerformance Measurement Analyst
CCORPORATE AADDRESS
480 University Avenue, Suite 210Toronto, Ontario, Canada M5G 1V2
Tel: 416.978.2042Fax: 416.971.2356
http://www.utam.utoronto.ca
FELIX P. CHEEPRESIDENT AND CHIEF EXECUTIVE OFFICER
President and CEO of University of Toronto Asset Management Corporation. He was previously VicePresident of Business Affairs at the University of Toronto. Prior to joining the University of Toronto he held thepositions of Executive Vice President and Chief Investment Officer at Manulife Financial; Senior Vice-Presidentof Corporate Finance at Ontario Hydro Corporation; and Senior Investment Officer of the International FinanceCorporation at the World Bank Group. He currently serves as director of The University of Toronto InnovationFoundation, MaRS, CenterPlate and also UTAM. Felix holds a Bachelor of Technology (Honours) fromLoughborough University of Technology; a Masters of Science from the Imperial College of Science andTechnology; and a Masters of Business Administration from York University.

© University of Toronto Asset Management CorporationAnnual Report for the year ended December 31, 2004.

Univers i ty o f Toronto Asset Management Corporat ion480 Univers i ty Avenue, Sui te 210
Toronto, Ontar io , Canada M5G 1V2
ht tp : / /www.utam.utoronto.ca