study of airflow distribution in fabric area of ... · in this model, each efip has 4 electrostatic...
TRANSCRIPT
I. INTRODUCTION
Currently, the rules for the control of soot particle produced by power plant are becoming more and more severe in China [1]. In order to reduce the volume of gas, many managers choose the Electrostatic-Fabric Integrated Precipitator (EFIP) to removal ash in the flue gas because of its good performance. As we know, EFIP is a kind of new type Precipitator which combines the advantage of Electrostatic Precipitator (ESP) with the Fabric Filter (FF). In the past, many researchers had made a lot of achievements on the study of ESP or FF. In the contrary, the number of papers about EFIP was less than those. However, the mechanism of ESP is different from the theory of FF [2-4] and the airflow is also different from each other. The airflow direction of ESP is horizontal while that of FF is vertical. People are lack of knowledge about airflow distribution due to the less research on the EFIP, especially the research on the airflow uniformity of Fabric area of EFIP. According to the theory of EFIP, about eighty percent of particle in the dust would be removal in the Electrostatic area, and twenty percent of particles in the flue gas would be intercepted. In other words, most of particles whose diameter were between 10 μm and 1 μm could be intercepted because of the function of fabric [5-8]. In this way, the pressure of operation and cost of equipment would decrease. In order to gain one kind of uniform airflow, many measures have been taken. Now three flow deflectors were placed in the inbox of EFIP in the purpose of uniform airflow distribution. Therefore, influence on the fabric area nearly has not been researched. So this paper puts much more attention to the airflow distribution in the fabric area.
If the airflow distribution in the Fabric area was not
uniform, the bags would be damaged easily, and the efficiency of Fabric area would decrease, which would affect the operation of EFIP.
II. METHODOLOGY
A. Numerical Model
In the numerical simulation, the boundary of bags was defined as the porous-jump [9-11]. In the CFD, the porous medium model is used in the simulation of models with many holes in one face or body. In this model, we could set permeability as the percentage of opening. As we know, the momentum equation of porous medium model has a momentum source in the numerical model. The momentum source is consisted of two parts, one is viscosity losses (Darcy), and another is internal losses [12-14].
3 3
i ij j j jj=1 1
1= μυ + |υ |υ
2ijj
S D C
ρ (1)
where,Si -i direction momentum source; D and C are matrix. In each porous medium model, the momentum losses is contribution to the pressure gradient, the pressure drop and fluid speed (or speed gradient) are in proportion [15-17]. For the simple uniform porous medium
i 2 j j
μ 1υ +C ρ|υ |υ
α 2iS (2)
where, α - permeability; C2 - internal resistance factor; others are 0. When the airflow was laminar flow, the pressure drop and velocity are in proportion. In the equation (2), C2 could be set as 0, ignoring the convection acceleration
Study of Airflow Distribution in Fabric Area of Electrostatic-Fabric Integrated Precipitator
C. Sun1, X. Long2, B. Lou2, and X. Yu1, 2
1Electric Power Research Institute of Guangdong Power Grid Corporation, China 2South China University of Technology, China
Abstract—Numerical simulation method was used to calculate the airflow distribution in the fabric area. We established the 3-D structure for Electrostatic-Fabric Integrated Precipitator (EFIP) of 600 MW unit by the Pro/Engineering software and dealt with the data collecting from the simulation with the Tecplot 360. Data about airflow distribution in the filter area were obtained by comparing different operation conditions. In the filter area, the biggest pressure is 530 Pa and the speed in the bags was changing from 1 m/s to 4 m/s. Bags located at the front of fabric area are tend to be damaged due to the fast flue gas and those bags in the second filter area would be used for more time because of the smaller flux than the first one. The numerical simulation results are reasonable and could be used as the reference to the designing of EFIP.
Keywords—Numerical simulation, filter bag, airflow distribution, electrostatic-fabric integrated precipitator
Corresponding author: Chaofan Sun e-mail address: [email protected] Presented at the 9th International Symposium on Non-Thermal/Thermal Plasma Pollution Control Technology &Sustainable Energy, in June 2014
Sun et al. 103

and spread. We could simple the porous-jump as the Darcy rule:
μ
αυ△P=- (3)
When the speed of flow in the porous medium was high, the C2 in the equation (2) could adjust the internal losses. This constant could be regard as the loss coefficient in each unit length whose direction is along with the flow direction. So we could regard the pressure drop as the function of pressure [18-20]. Therefore, we could call the porous medium with one dimensional model as porous jump, which is used in the simulation of film whose pressure drop and speed have been known. This method is much more reliable than porous medium. As the thickness of film is limited, we could define the connection between Darcy rule and internal losses by the change of pressure.
22
μ 1P=( υ+C ρυ ) m
α 2△ △ (4)
where, ∆p - pressure losses, Pa; μ - fluid dynamic viscosity coefficient, Pas; α - permeability, m2, which is used as the coefficient to define the permeability strength of porous medium; C2 - resistance coefficient; υ - velocity, m/s, which is perpendicular to the filter medium surface; ∆m - the porous medium thickness, m. B. 3-D Structure Model of EFIP This paper is focus on the airflow distribution in the fabric area of large scale EFIP, which is designed for the 600 MW power plant. Every unit has two EFIPs, and we use one of them as the model to calculate in the purpose of gaining the results quickly. In this model, each EFIP has 4 electrostatic fields and 2 fabric areas. The 3-D structure model of EFIP has been established with the software called Pro/Engineering. The inlet was 4.2 m wide and 4.1 m long. In the electrostatic field, the height is 14.6 m, the width is 15.4 m and the length is 9.8 m. While the fabric area is 15.4 m wide and 6.3 m long, but the height is different from each other, one is 13.3m and the other is 11.1 m. Also, 250 bags have been placed in the fabric area, and the number in total is 500. Each bag is 8 m long and the diameter of bag is 300 mm.
C. Meshing and Setting of Boundary In order to get a better simulation, the inlet box was meshed by the hexahedron in consideration of the symmetry of inlet velocity, and some tetrahedrons were also used to mesh the flow deflectors. In the meanwhile, the electrostatic field was meshed with asymmetric grid in order to control the density of local grid. In the fabric area, every bag has been meshed with 770 tetrahedron grids, and the total number of grid in the fabric area is 5,100,000. The grid test result shows that the grid meshing is satisfy the computational accuracy. In the setting of boundary condition, we define the inlet as the velocity-inlet, and outlet was defined as the pressure-outlet. In the meanwhile, we define the flow deflector as wall, bags as the porous-jump. According to the data collected from the power plant, the speed in the inlet was 14.38 m/s, the operation temperature was 20°C, hydraulic diameter is 4.149 m, and the turbulence intensity is 3.3%. Also we have chosen the K-ε equation as the computing method. And the permeability of bag is 1.5×10⁻¹⁰, the thickness of bag is 1mm. We supposed that the fluid in the EFIP is steady and the time has nothing to do with the motion parameters. And the fluid cannot be compressed in consideration of its low speed. Also the whole simulation process is isothermal. D. Verification of Numerical Simulation One test model of EFIP is established in order to verify the numerical simulation. A/B/C/D/E is the position of measuring points. In this model, the quantity of flow is 230 m3/h. As we see in the Table I, the biggest error is 9.79% and the smallest one is only 0.64%. These are the types of errors caused by human error or fraud. Also, more information could be gained in Fig. 2. The velocity of inlet and outlet are uniform, the average velocity is 0.5 m/s and 13 m/s. It meets conservation law in value. In the airflow area, the velocity changes but its distribution is symmetrical. In electrostatic area, the smallest velocity located at the middle, which is only
Fig. 1. Position of measuring points.
TABLE I VELOCITY AND ERROR
Items Vinlet VA VB VC VF VG VI Voutlet
Test (m/s) 5.42 0.20 0.70 0.82 0.55 0.60 0.55 12.72
Simulate (m/s) 5.50 0.2586 0.776 0.776 0.5465 0.5834 0.5465 13.00
absolute error 0.08 0.0586 0.076 -0.044 -0.0035 -0.0166 -0.0035 0.28
relative tolerance 0.0145 0.2266 0.0979 -0.0567 -0.0064 -0.0284 -0.0064 0.0215
104 International Journal of Plasma Environmental Science & Technology, Vol.8, No.2, SEPTEMBER 2014

0.2586 m/s. At the same time, the biggest one is 0.7760 m/s, which is located at the bottom. As we know, when flue gas crosses the airflow area, it tends to flow along the border. The pressure changes when flue gas flows in the EFIP. As we see in Fig. 3, the pressure of EFIP is subpressure. It is -1000 Pa in the outlet and the ash bucket is 0. The results of numerical simulation match up with the date of test model. So, we could make a conclusion that the numerical simulation could calculate the velocity distribution of EFIP.
III. RESULTS
This paper focus on different operation conditions on the purpose of airflow distribution in various places. This data include the impaction to the bags. A. Pressure Contour
Data about the pressure in different positions were
calculated in the computer. We draw several plots about pressure contour when it was X = 10, 13, 19. By comparing these plots, we could make a conclusion that when airflow went to the faces of bags, the biggest pressure was produced in the middle of filter area, while a small pressure existed in the left and right side of the filter area, which was mainly caused by the flow deflector located at the middle of EFIP. The biggest one is about 530 Pa. And a bigger pressure would lead into the damage of bags. In the vertical direction, pressure in the gas-collecting chamber was only 350 Pa and the airflow in the bags were uniform. However, the pressure
in the below of bags are smaller than it in the face of bags. We can explain this phenomenon by the theory of resistance.
Comparison of pressure in the horizontal direction was made. We chose 3 figures shown in the follow pictures which were located at Y = 0.1, 0.3, 7. Conclusion is made by comparing data, pressure in the filter area becoming small as well as the position of airflow.
Fig. 2. Y = 0 Velocity contour of EFIP test model.
Fig. 3. Pressure contour of EFIP test model.
Fig. 4. The pressure in the X = 10 and X = 13.
Fig. 5. The pressure in the X = 19.
Fig. 6. The pressure of Y = 0.1.
Fig. 7. The pressure in Y = 0.3.
Fig. 8. The pressure in the Y = 7.
Sun et al. 105
Especially when it is in the middle of fabric area, the pressure become bigger because of the flow deflector located in the front of the second filter area.
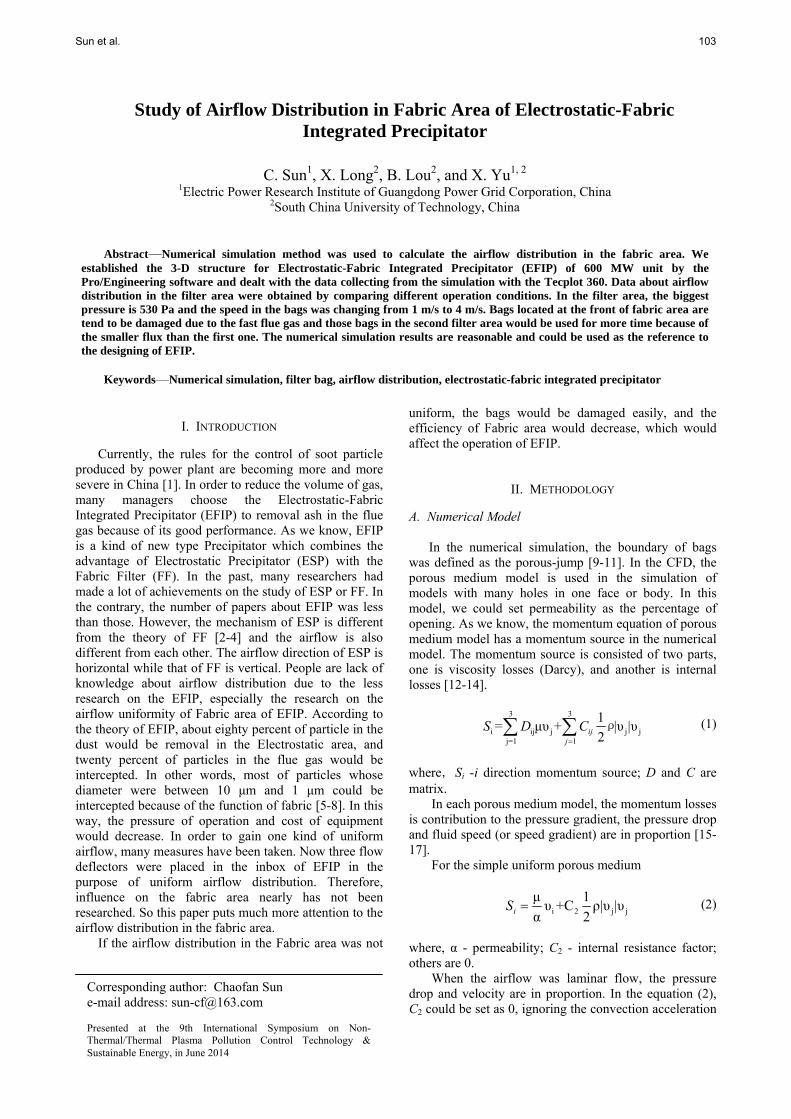
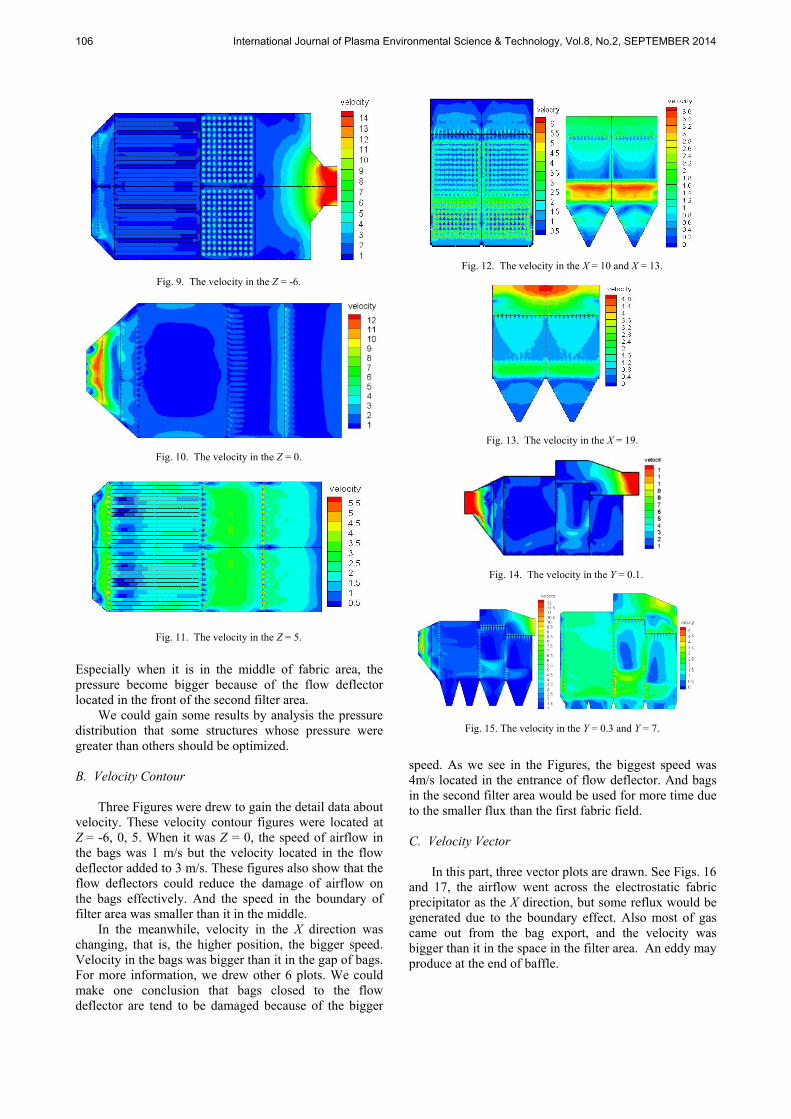
We could gain some results by analysis the pressure distribution that some structures whose pressure were greater than others should be optimized. B. Velocity Contour Three Figures were drew to gain the detail data about velocity. These velocity contour figures were located at Z = -6, 0, 5. When it was Z = 0, the speed of airflow in the bags was 1 m/s but the velocity located in the flow deflector added to 3 m/s. These figures also show that the flow deflectors could reduce the damage of airflow on the bags effectively. And the speed in the boundary of filter area was smaller than it in the middle. In the meanwhile, velocity in the X direction was changing, that is, the higher position, the bigger speed. Velocity in the bags was bigger than it in the gap of bags. For more information, we drew other 6 plots. We could make one conclusion that bags closed to the flow deflector are tend to be damaged because of the bigger
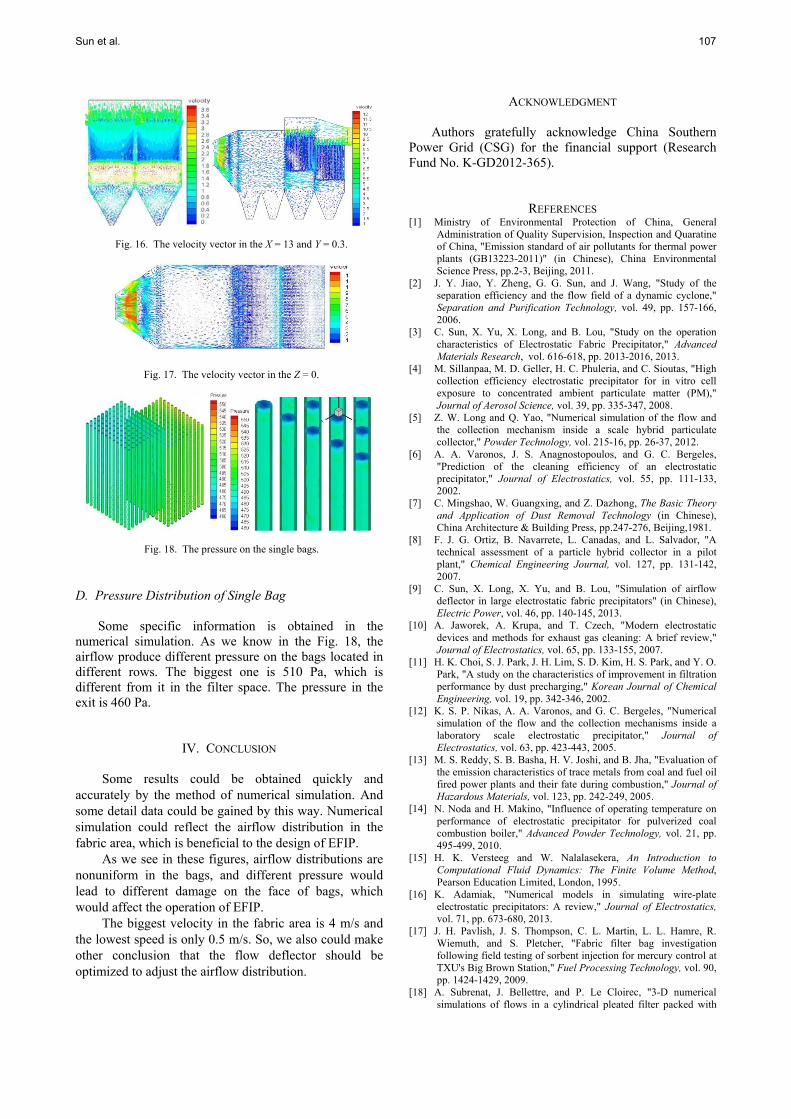
speed. As we see in the Figures, the biggest speed was 4m/s located in the entrance of flow deflector. And bags in the second filter area would be used for more time due to the smaller flux than the first fabric field. C. Velocity Vector In this part, three vector plots are drawn. See Figs. 16 and 17, the airflow went across the electrostatic fabric precipitator as the X direction, but some reflux would be generated due to the boundary effect. Also most of gas came out from the bag export, and the velocity was bigger than it in the space in the filter area. An eddy may produce at the end of baffle.
Fig. 9. The velocity in the Z = -6.
Fig. 10. The velocity in the Z = 0.
Fig. 11. The velocity in the Z = 5.
Fig. 12. The velocity in the X = 10 and X = 13.
Fig. 13. The velocity in the X = 19.
Fig. 14. The velocity in the Y = 0.1.
Fig. 15. The velocity in the Y = 0.3 and Y = 7.
106 International Journal of Plasma Environmental Science & Technology, Vol.8, No.2, SEPTEMBER 2014
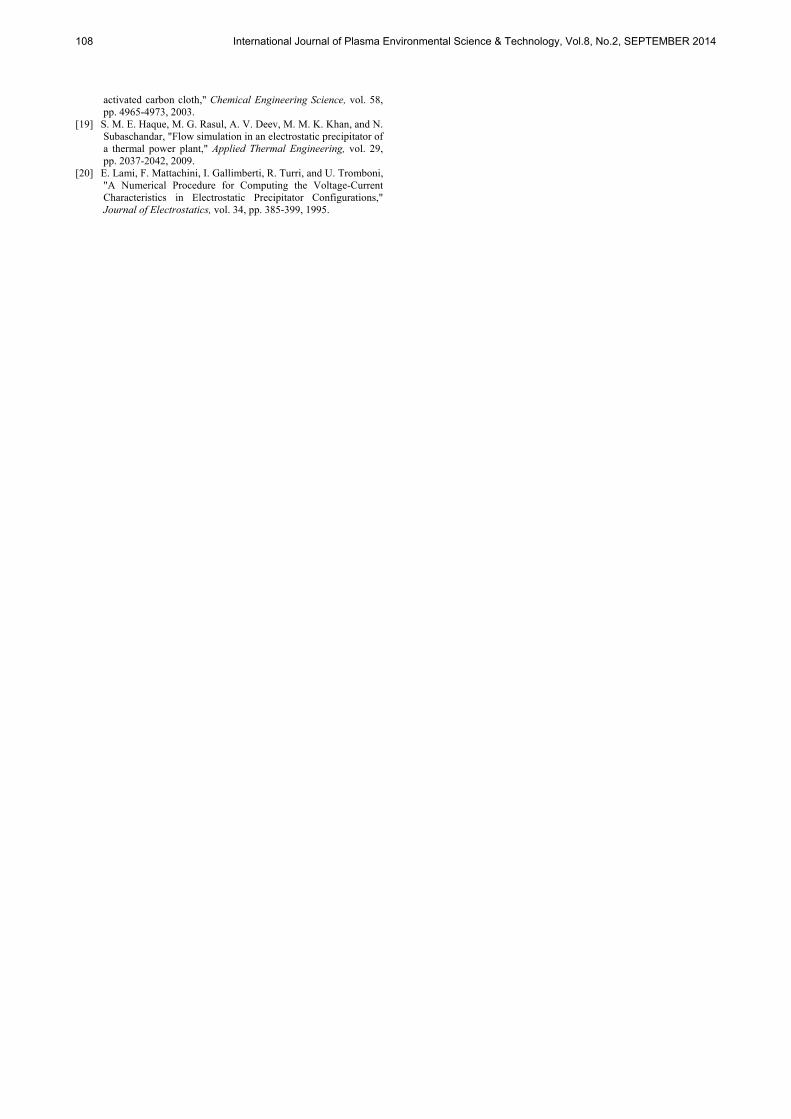
D. Pressure Distribution of Single Bag Some specific information is obtained in the numerical simulation. As we know in the Fig. 18, the airflow produce different pressure on the bags located in different rows. The biggest one is 510 Pa, which is different from it in the filter space. The pressure in the exit is 460 Pa.
IV. CONCLUSION
Some results could be obtained quickly and
accurately by the method of numerical simulation. And some detail data could be gained by this way. Numerical simulation could reflect the airflow distribution in the fabric area, which is beneficial to the design of EFIP.
As we see in these figures, airflow distributions are nonuniform in the bags, and different pressure would lead to different damage on the face of bags, which would affect the operation of EFIP.
The biggest velocity in the fabric area is 4 m/s and the lowest speed is only 0.5 m/s. So, we also could make other conclusion that the flow deflector should be optimized to adjust the airflow distribution.
ACKNOWLEDGMENT
Authors gratefully acknowledge China Southern Power Grid (CSG) for the financial support (Research Fund No. K-GD2012-365).
REFERENCES [1] Ministry of Environmental Protection of China, General
Administration of Quality Supervision, Inspection and Quaratine of China, "Emission standard of air pollutants for thermal power plants (GB13223-2011)" (in Chinese), China Environmental Science Press, pp.2-3, Beijing, 2011.
[2] J. Y. Jiao, Y. Zheng, G. G. Sun, and J. Wang, "Study of the separation efficiency and the flow field of a dynamic cyclone," Separation and Purification Technology, vol. 49, pp. 157-166, 2006.
[3] C. Sun, X. Yu, X. Long, and B. Lou, "Study on the operation characteristics of Electrostatic Fabric Precipitator," Advanced Materials Research, vol. 616-618, pp. 2013-2016, 2013.
[4] M. Sillanpaa, M. D. Geller, H. C. Phuleria, and C. Sioutas, "High collection efficiency electrostatic precipitator for in vitro cell exposure to concentrated ambient particulate matter (PM)," Journal of Aerosol Science, vol. 39, pp. 335-347, 2008.
[5] Z. W. Long and Q. Yao, "Numerical simulation of the flow and the collection mechanism inside a scale hybrid particulate collector," Powder Technology, vol. 215-16, pp. 26-37, 2012.
[6] A. A. Varonos, J. S. Anagnostopoulos, and G. C. Bergeles, "Prediction of the cleaning efficiency of an electrostatic precipitator," Journal of Electrostatics, vol. 55, pp. 111-133, 2002.
[7] C. Mingshao, W. Guangxing, and Z. Dazhong, The Basic Theory and Application of Dust Removal Technology (in Chinese), China Architecture & Building Press, pp.247-276, Beijing,1981.
[8] F. J. G. Ortiz, B. Navarrete, L. Canadas, and L. Salvador, "A technical assessment of a particle hybrid collector in a pilot plant," Chemical Engineering Journal, vol. 127, pp. 131-142, 2007.
[9] C. Sun, X. Long, X. Yu, and B. Lou, "Simulation of airflow deflector in large electrostatic fabric precipitators" (in Chinese), Electric Power, vol. 46, pp. 140-145, 2013.
[10] A. Jaworek, A. Krupa, and T. Czech, "Modern electrostatic devices and methods for exhaust gas cleaning: A brief review," Journal of Electrostatics, vol. 65, pp. 133-155, 2007.
[11] H. K. Choi, S. J. Park, J. H. Lim, S. D. Kim, H. S. Park, and Y. O. Park, "A study on the characteristics of improvement in filtration performance by dust precharging," Korean Journal of Chemical Engineering, vol. 19, pp. 342-346, 2002.
[12] K. S. P. Nikas, A. A. Varonos, and G. C. Bergeles, "Numerical simulation of the flow and the collection mechanisms inside a laboratory scale electrostatic precipitator," Journal of Electrostatics, vol. 63, pp. 423-443, 2005.
[13] M. S. Reddy, S. B. Basha, H. V. Joshi, and B. Jha, "Evaluation of the emission characteristics of trace metals from coal and fuel oil fired power plants and their fate during combustion," Journal of Hazardous Materials, vol. 123, pp. 242-249, 2005.
[14] N. Noda and H. Makino, "Influence of operating temperature on performance of electrostatic precipitator for pulverized coal combustion boiler," Advanced Powder Technology, vol. 21, pp. 495-499, 2010.
[15] H. K. Versteeg and W. Nalalasekera, An Introduction to Computational Fluid Dynamics: The Finite Volume Method, Pearson Education Limited, London, 1995.
[16] K. Adamiak, "Numerical models in simulating wire-plate electrostatic precipitators: A review," Journal of Electrostatics, vol. 71, pp. 673-680, 2013.
[17] J. H. Pavlish, J. S. Thompson, C. L. Martin, L. L. Hamre, R. Wiemuth, and S. Pletcher, "Fabric filter bag investigation following field testing of sorbent injection for mercury control at TXU's Big Brown Station," Fuel Processing Technology, vol. 90, pp. 1424-1429, 2009.
[18] A. Subrenat, J. Bellettre, and P. Le Cloirec, "3-D numerical simulations of flows in a cylindrical pleated filter packed with
Fig. 16. The velocity vector in the X = 13 and Y = 0.3.
Fig. 17. The velocity vector in the Z = 0.
Fig. 18. The pressure on the single bags.
Sun et al. 107
activated carbon cloth," Chemical Engineering Science, vol. 58, pp. 4965-4973, 2003.
[19] S. M. E. Haque, M. G. Rasul, A. V. Deev, M. M. K. Khan, and N. Subaschandar, "Flow simulation in an electrostatic precipitator of a thermal power plant," Applied Thermal Engineering, vol. 29, pp. 2037-2042, 2009.
[20] E. Lami, F. Mattachini, I. Gallimberti, R. Turri, and U. Tromboni, "A Numerical Procedure for Computing the Voltage-Current Characteristics in Electrostatic Precipitator Configurations," Journal of Electrostatics, vol. 34, pp. 385-399, 1995.
108 International Journal of Plasma Environmental Science & Technology, Vol.8, No.2, SEPTEMBER 2014