2003 roadshow presentation - anz · 2003 roadshow presentation australia and new zealand banking...
TRANSCRIPT

2003 Roadshow Presentation
Australia and New Zealand Banking Group Limited
November 2003

2
Table of contents
1. ANZ 2003 Result overview Page 3
2. NBNZ Acquisition Page 4
3. Strategy Page 13
4. Results Review Page 22
5. Portfolio Performance Page 36
6. Credit Quality Page 46
Important Notice: USA
Nothing in this document constitutes an offer of shares.
A Prospectus in respect of the entitlements offer dated 24 October 2003 was lodged with the Australian Securities & Investments Commission on that date.
Offers of shares will only be made in a copy of the Prospectus which is available to residents of Australia and New Zealand only.
The offering of shares made in the prospectus has not been, and will not be, registered under the U.S. Securities Act of 1933, as amended, and is not being made in the United States or to persons resident in the United States.
Important Notice: UK
"This presentation is directed only at persons who (i) are persons falling within Article 49(2)(a) to (d) ("high net worth companies, unincorporated associations etc.") of The Financial Services and Markets Act 2000 (Financial Promotion) Order 2001 (as amended) or (ii) have professional experience in matters relating to investments. This presentation must not be acted on or relied on by persons who are not such relevant persons. Any investment or investment activity to which this communication relates is available only to such relevant persons and will be engaged in only with such relevant persons."
Important Notice: Singapore"This presentation is directed only at persons who are persons falling within Section 274, or are sophisticated investors falling within Section 275, of the Securities and Futures Act of Singapore. This presentation must not be acted on or relied on my persons who are not such persons. Any investment or investment activity to which this communication relates is available only to such relevant persons and will be engaged in only with such relevant persons."

SECTION 1SECTION 1
Another Solid Result for ANZ, up 8.3%
3
v Sep 02
• NPAT $2,348m 8.3%
• EPS 148.3 cents 8.2%
• EPS (Excluding goodwill) 152.4 cents 9.2%
• Dividend 95 cents 11.8%
• Net Specific Provisions $527m (27.6% )
• NPAT $2,348m 1.1%
• EPS 148.3 cents 0.7%
Before Significant Items

SECTION 2SECTION 2
4
NBNZ AcquisitionNBNZ Acquisition

SECTION 2SECTION 2
NBNZ acquisition creates the leading bank in New Zealand
5
Purchase price equivalent to A$4.915 billion (at exchange rates on 23 October 2003)
ANZ and NBNZ, when combined, will create:
• The leading bank in New Zealand
• One of New Zealand’s top three companies
• Market leadership in all major market segments
A very different acquisition:
• Based on customers and growth - leveraging the best of both banks
• NBNZ CEO Sir John Anderson invited to head the combined company
• The ANZ and NBNZ brands and branch networks to be maintained
• No change intended in the total number of branches
• Built on the foundation of the oldest bank and company in New Zealand
Head office in Wellington with major office presence in Auckland and other cities
ANZ may consider a partial minority listing on the NZ Stock Exchange post integration

SECTION 2SECTION 2
NBNZ acquisition is transforming for ANZ
6
Acquisition an important step in a broader strategy. ANZ is now:
• The leading bank in New Zealand
• The leading bank in the South Pacific
• The leading Australian bank in Asia
• Leading positions in Australia:
–Institutional
–Corporate
–Cards
–Esanda
• With renewed focus on traditional areas of potential:
–Small to medium business
–Mortgages
–Personal Banking
–Wealth management
SECTION 2SECTION 2
Key financial highlights
7
Purchase price equivalent to A$4.915 billion (at exchange rates on 23 October 2003)
Excludes a NZ$575 million dividend to be paid to Lloyds TSB prior to completion from NBNZ’s retained earnings
Total funding by means of:
• 2 for 11 renounceable rights issue at A$13 per share raising A$3.570 billion
• A$1.370 billion of various debt/hybrid funding
Purchase price equates to 11.2x NBNZ adjusted cash earnings for the year to June 2003
ANZ’s current 2003 price/cash earnings multiple around 12x
ANZ’s strong capital and AA-/Aa3 credit rating preserved
NBNZ’s credit rating should be brought up to ANZ’s rating upon completion of acquisition

SECTION 2SECTION 2
Estimated operating cost synergies and integration costs
8
• Expected cost synergies represent around 20% of NBNZ’s cost base
Cost synergies to be fully phased in by end 2006
• Key areas of cost synergies:
Technology
Back office functions
Head office integration
• Synergies reflect no net branch closures in New Zealand
• Minimal impact in 2004
Operating Cost Synergies
Estimated at ~A$110m pa (before tax) within 3 years
• Key integration cost components:
Core and subsidiary IT systems integration
Non-branch premises integration
• NBNZ senior management team has a strong track record in managing banking integrations
Integration Costs
Estimated at ~A$230m (before tax)over 3 years

SECTION 2SECTION 2
Managing key integration risks
9
Consideration Mitigant
Minimise Impact on Customers
• Maintain both brands and both branch networks• New Zealand centric retail business model leveraging NBNZ
“client-facing” systems for retail, rural and SME• Manageable concentration issues in corporate and institutional
People• Retain the best people from both organisations• Maintain headcount in “client-facing” roles
Technology• Two year integration period for core systems conversion to a
common core technology platform • Leverage expertise in IT integration

SECTION 2SECTION 2
NBNZ Group strong track record
10
30
35
40
45
50
Dec-01 Dec-02 Jun-03 (LTM)
0
3
6
9
12
15
Dec-01 Dec-02 Jun-03 (LTM)
0
200
400
600
Dec-01 Dec-02 Jun-03 (LTM)
NZ$b
Declining cost-to-income ratio Consistent growth in NPATNZ$m
%
bps
Source: NBNZ Group Financial Reports
High asset quality – Provisioning charge as % of loans and advances
Strong growth in loans and advances
20
25
30
35
40
Dec-01 Dec-02 Jun-03 (LTM)Jun-03

SECTION 2SECTION 2
NBNZ purchased at attractive multiple
11
Price# / LTM cash earnings multiples
16.114.6
13.311.9 11.2
0
4
8
12
16
20
Australian RegionalBanks
Past DomesticAcquisitions*
Major AustralianBanks (excl ANZ)
ANZ Standalone ANZ / NBNZ
* - Average of 10 past Australian and New Zealand transactions
# - Price used in calculating LTM cash earnings multiples and NTA multiples for the major Australian banks and the Australian regional banks are 30-day volume weighted average prices as at 23 October 2003
3.0 3.0 2.9
2.42.2
1.0
1.5
2.0
2.5
3.0
3.5
Major AustralianBanks (excl ANZ)
ANZ / NBNZ Australian RegionalBanks
ANZ Standalone Past DomesticAcquisitions*
Price# / Net tangible assets multiples

SECTION 2SECTION 2
Funding the NBNZ acquisition
12
Source of FundsA$m
Rights issue net proceeds 3,570
Debt/Hybrid 1,370
Total 4,940
Use of Funds
A$m
Proceeds to Lloyds TSB 4,915
Transaction costs 25
Total 4,940
Goodwill on AcquisitionA$m
Purchase consideration 4,915
LESS NTA on acquisition (1,657)
Goodwill on acquisition 3,258*
Target ACE/RWAs ratio range lowered to 4.75-5.25%
The transaction is to be funded via the following sources:
Net proceeds of A$3.570 billion from a 2 for 11 deeply discounted rights issue at $13
A$1.370 billion in Hybrid, subordinated and wholesale funding
The size of the equity raising is a function of the goodwill arising on acquisition*
Upon completion:
ACE ratio of approximately 5.0%
Tier 1 ratio of approximately 6.7%
Total capital ratio of approximately 10.2%
* - Goodwill will be amortised in line with Australian Accounting Standards based on 30 June 2003 pro-forma financial statements and will be finalised based on 30 November 2003 net assets

SECTION 3SECTION 3
13
StrategyStrategy

SECTION 3SECTION 3
Australian banks: A decade of efficiency gains and credit expansion
14
40%
45%
50%
55%
60%
65%
1998 1999 2000 2001 2002 2003
NABCBAWBCANZ
ANZ Target
Annual Growth Australian Credit Growth#
Forecast*
Sources: #RBA, *Economics@ANZ, ^Citigroup Analyst Forecasts, CBA 2003 Results
Cost to Income^
• The Australian banking sector has enjoyed a decade of efficiency gains which has seen material reductions in Cost to Income ratios.
• ANZ has outstripped its competitors and has achieved world class efficiency.
• A study of the world’s top 100 banks by Boston Consulting Group earlier this year found that ANZ was in the top five banks in the world in terms of efficiency, total shareholder return and risk-adjusted relative shareholder return over the previous five years.
• Solid credit growth during the past decade has also contributed to the out performance of Australian banks.
• A significant driver of recent credit growth has been the consumer sector, in particular via home lending.
• Our forecast is for a weakening in housing growth, which in part is forecast to be offset by increasing demand for business credit. Overall system credit growth is forecast to weaken but to remain at positive levels.
-5%
0%
5%
10%
15%
20%
Sep-89 Sep-91 Sep-93 Sep-95 Sep-97 Sep-99 Sep-01 Sep-03 Sep-05
Banking industry profit growth will be more challenging
15
SECTION 3SECTION 3
Forecast*
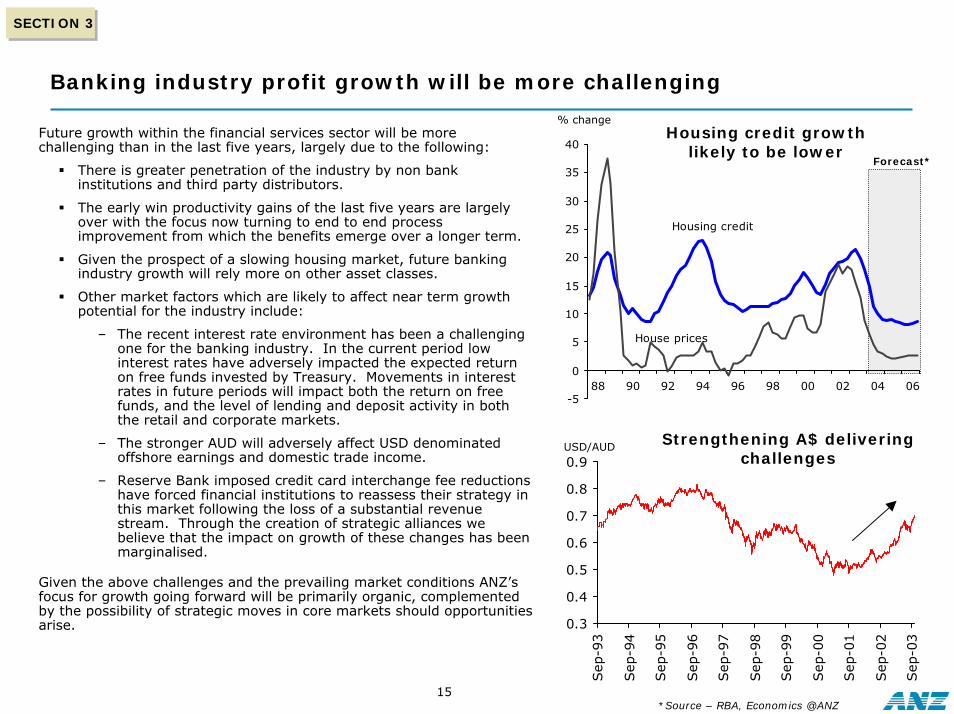
Housing credit growth likely to be lower
% changeFuture growth within the financial services sector will be more challenging than in the last five years, largely due to the following:
There is greater penetration of the industry by non bank institutions and third party distributors.
The early win productivity gains of the last five years are largely over with the focus now turning to end to end process improvement from which the benefits emerge over a longer term.
Given the prospect of a slowing housing market, future banking industry growth will rely more on other asset classes.
Other market factors which are likely to affect near term growthpotential for the industry include:
– The recent interest rate environment has been a challenging one for the banking industry. In the current period low interest rates have adversely impacted the expected return on free funds invested by Treasury. Movements in interest rates in future periods will impact both the return on free funds, and the level of lending and deposit activity in both the retail and corporate markets.
– The stronger AUD will adversely affect USD denominated offshore earnings and domestic trade income.
– Reserve Bank imposed credit card interchange fee reductions have forced financial institutions to reassess their strategy inthis market following the loss of a substantial revenue stream. Through the creation of strategic alliances we believe that the impact on growth of these changes has been marginalised.
Given the above challenges and the prevailing market conditions ANZ’s focus for growth going forward will be primarily organic, complemented by the possibility of strategic moves in core markets should opportunities arise.
-5
0
5
10
15
20
25
30
35
40
88 90 92 94 96 98 00 02 04 06
Housing credit
House prices
0.3
0.4
0.5
0.6
0.7
0.8
0.9
Sep-9
3
Sep-9
4
Sep-9
5
Sep-9
6
Sep-9
7
Sep-9
8
Sep-9
9
Sep-0
0
Sep-0
1
Sep-0
2
Sep-0
3
Strengthening A$ delivering challenges
USD/AUD
*Source – RBA, Economics @ANZ

SECTION 3SECTION 3
ANZ has positioned itself to meet market challenges
16
ANZ has developed a strong, balanced platform for sound organic growth which positions us well to meet market challenges.
Our model of a portfolio of specialist businesses is distinctively different from our competitors. Its insight is that speed, focus and flexibility will out-compete scale and size advantage.
Our first mover advantage in ongoing cultural transformation is fundamental to our strategy given that:
a well led and inspired team makes ANZ an employer of choice.
the largest service improvements will arise from front line expertise and attitude.
in order to derive maximum benefit from our portfolio model a culture that promotes accountability, autonomy and a breakoutmentality is essential
The stability and competence of ANZ’s management is critical in continuing to deliver value to stakeholders.
ANZ prides itself as being one of the top five most efficient banks in the world.
By reducing our exposure to higher risk asset classes and non core markets we are positioning ANZ for solid growth in asset classes and markets that we know and understand; a cornerstone of our future strategy.
Reducing exposure to
higher risk asset classes and non
core markets
Stable and well regarded
management team
World leading efficiency
Unique portfolio of specialist businesses
First mover advantage on
cultural transformation

SECTION 3SECTION 3
Monolines win, but returns more volatile –diversification reduces risk
17
15.7
20.8
0
5
1015
20
25
Generalists Specialists
27.6
18.1
7.6
2.8
0
5
10
15
20
25
30
Card
s
Mort
gages
Corp
ora
te
AN
ZG
rou
p
Independent analysis* has found that monoline specialists create greater returns than generalists.
ANZ’s response has been to create a portfolio of specialist businesses. Whilst the returns from individual business units within the portfolio have exhibited the volatility typical of monoline specialists, volatility is reduced for the portfolio as a whole.
A portfolio of specialist businesses reduces volatility and brings:
Responsiveness – we believe that speed, flexibility and expert knowledge will prevail over large scale generalists
An Entrepreneurial approach, which encourages innovation yet brings with it accountability and ownership from business management.
The portfolio model is strengthened by ensuring that governance, risk management and group oversight are centrally controlled.
World leading efficiency
10.6
23.6
05
1015
2025
30
Generalists Specialists
%%
Average ROE1998-2002
Average Volatility(standard deviation in TSR)
1998-2002
Standard Deviation in NPAT Growth# Sep 00 to Sep 03
*Source – Boston Consulting Group

SECTION 3SECTION 3
We have rebalanced the bank’s lending portfolio
18
Corporate versus Retail Lines of Business
Composition of ANZ Loan Book by Key Lending Region
ANZ has refocused the loan book towards lower risk retail lines of business through:
1. Corporate to retail lines of businesses
• In 2003, Gross Lending Assets are split approx. 66/34% across retail and corporate lines of business (compared with an approx. 43/57% split in 1996)
• ANZ’s retail lending franchise has been underpinned by robust residential mortgage growth
• Sustained market share gains in the SME segment and a leadership position in asset finance have also contributed to the re-weighting of the loan portfolio towards retail lines of business
70%77% 81%
15%12%
13%15% 11% 6%
Sep-96 Sep-00 Sep-03
Australia NZ International
Americas24%
Asia32%
Pacific9% United
Kingdom & Europe32%
Middle East3%
International Lending Assets Distribution
57%
34%
43%
66%
Sep-96 Sep-03
RetailBusinesses
CorporateBusinesses
2. Non-core to core markets
• Further, ANZ has re-orientated its loan book towards domestic lending opportunities and to improving the quality of its international diversification
• International exposure, outside our core domestic markets of Australia and NZ, within the loan book has been reduced from approx. 15% of Gross Lending Assets in 1996 to approx. 6% in 2003.

SECTION 3SECTION 3
This provides us with a well balanced portfolio for organic growth
19
Notwithstanding our relative re-weighting of the asset portfolio towards Retail lines of business and the lowering of the risk profile within the corporate portfolio, ANZ has retained its strong tradition in corporate banking. 40% of the Group’s profits are still derived from these sectors which positions us relatively favourably as system growth returns to a more traditional balance.
The Retail business is characterised by:
Strong niche leadership - ANZ enjoys market leading niche positions in both Credit Cards and Auto and Equipment Finance
Punching above weight - Restoring Customer Faith program is starting to show positive results, particularly in Rural Banking. Mortgages is improving sales through its branch network, whilst at the same time it is outperforming in third party originated growth.
Foundation laid for improved performance -significant investment is being made in NZ and Personal Banking to deliver growth in future years. There are early signs of progress emerging.
Corporate
60% of profit*
40% of profit*
Retail
The Corporate segment is characterised by:
Strong tradition in Institutional and Corporate Banking which places ANZ well for expected pick up in business credit growth.
Institutional and Corporate customers continue to provide significant cross selling opportunities
Focus creates a key growth opportunity -SME Banking is already experiencing solid market share growth leading to strong profit growth.
66% of assets# 34% of assets#
*Business segment profit, #Lending assets

20
Clear international strategy
ANZ’s international focus is twofold and remains clear
1. US and Europe – REDUCE
Involving:
Focusing on core products and relationships
Reallocating capital to fund growth options
Returning excess capital, primarily to domestic markets
2. East Asia/Pacific – GROW LONG TERM
Involving seeking reward whilst carefully managing the risk through:
Individual investments that are modest in value and low risk
Adopting a portfolio approach
Ensuring the potential for significant long term upside
Investments must leverage ANZ’s skills and capabilities
whilst avoiding investments that are:
Corporate focused
Require large capital investment
Only require ANZ’s financial resources rather than management skills
Unduly distracting for group management
East Asia/Pacific
Australia/NZ
Modest capital reallocation if growth options are identified
Majority of capital reallocation to core
markets
US and EuropeCapital reduction
500
1000
1500
2000
2500
1999 2000 2001 2002 2003
Aust. NZ Asia/Pacific UK/Europe Middle East/SE Asia North America
NPAT mix by region – shift to domestic markets
$

SECTION 3SECTION 3
ANZ’s forward looking agenda
21
To become Australia and New Zealand’s most respected company
The bank with a human face, easy to do business with, building enduring customer relationships Our Customers
A great company, with great people, great values, great opportunities
Our People
One of the most efficient, best managed, and most successful banks in the world
Our Shareholders
Trusted. Making a sustainable contribution to society
Our Community
Breakout. Bold, different, investing, partnering, growing
Our Future

SECTION 4SECTION 4
22
Results ReviewResults Review
23
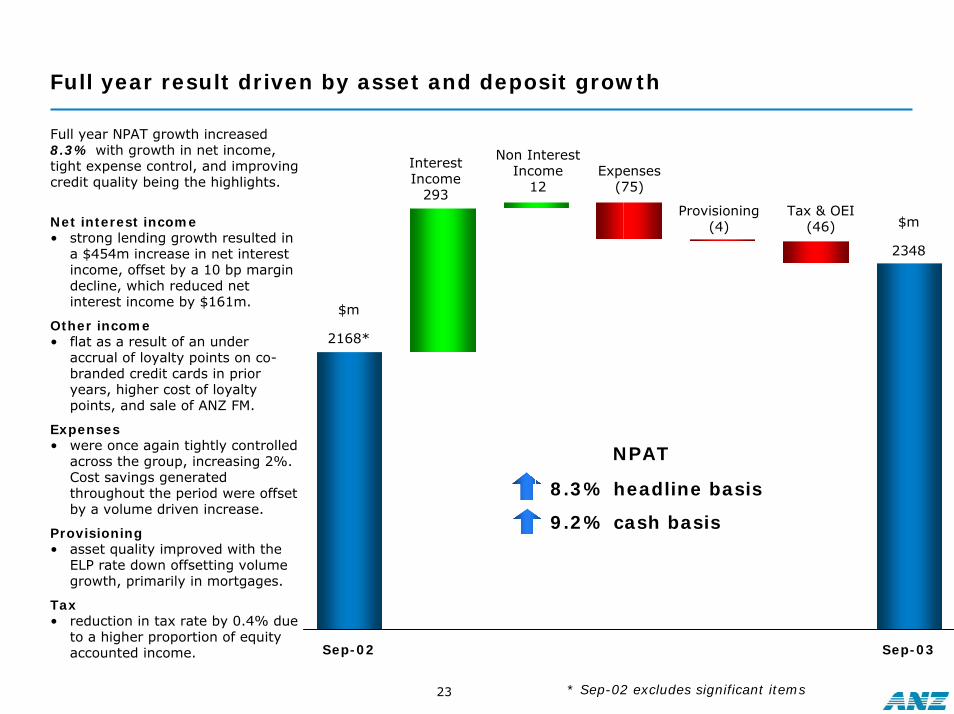
Full year result driven by asset and deposit growth
2168*
Sep-02
Interest Income
293Provisioning
(4)
Non Interest Income
12Expenses
(75)
Tax & OEI(46)
2348
Sep-03
Net interest income • strong lending growth resulted in
a $454m increase in net interest income, offset by a 10 bp margin decline, which reduced net interest income by $161m.
Other income• flat as a result of an under
accrual of loyalty points on co-branded credit cards in prior years, higher cost of loyalty points, and sale of ANZ FM.
Expenses• were once again tightly controlled
across the group, increasing 2%. Cost savings generated throughout the period were offset by a volume driven increase.
Provisioning• asset quality improved with the
ELP rate down offsetting volume growth, primarily in mortgages.
Tax• reduction in tax rate by 0.4% due
to a higher proportion of equity accounted income.
8.3% headline basis
9.2% cash basis
NPAT
Full year NPAT growth increased 8.3% with growth in net income, tight expense control, and improving credit quality being the highlights.
$m
$m
* Sep-02 excludes significant items

SECTION 4SECTION 4
Higher interest income, driven by strong mortgage and deposit growth
24
-40% -30% -20% -10% 0% 10% 20%
Local Currency AUD
12%
14%
-9%-23%
-30% -20% -10% 0% 10% 20%
73.5
58.1
99.7
59.2
86.4
57.256.2
61.8
89.2
58.2
67.3
97.3
20
40
60
80
100
Mortgages Business* Deposits*
Mar-02 Sep-02 Mar-03 Sep-03
Average Lending & Deposit Volumes
*Business Lending includes Corporate & Small Business, and Institutional Segments. Deposits includes Esanda retail debentures
$b
Lending Asset Growth for the year to September 2003
• Average net lending assets grew by $13.6b (10.0%) in 2003, with growth of $10.8b (18%) in Mortgages, $1.6b in Corporate and $0.8b in Asset Finance.
• Average deposits and other borrowings grew $13.5b, principally in Personal Banking Australia ($4.2b), Treasury ($3.2b), IFS ($2.7b) and Corporate ($1.6b). The deposit growth was encouraged by uncertainty in global equity markets.
• End of period net lending asset volumes reduced 23% in overseas markets as a result of the strategy to reduce higher risk exposures in the UK and US and the exchange rate impact of a strengthening Australian dollar.
Trends in international exposure
Asia
Pacific
Americas
UK & Europe
Total-9%-23%
-25%-34%
-11%-29%
-14% 6%
5% 12%
ANZ Group
Australia & NZ
International

SECTION 4SECTION 4
Margins down, primarily due to yield curve and mix effect
25
1.25 1.3 1.28 1.30
1.22 1.19 1.10
2.83 2.78
3.87
2.84
4.22 4.183.93 3.82
4.79
3.82
1.331.36
1.101.25
1.10
2.822.86
2.71
2.96 2.993.14
2.78
3.84
2.78 2.75 2.792.71 2.642.76
-
0.50
1.00
1.50
2.00
2.50
3.00
3.50
4.00
4.50
5.00
Mar-01 Sep-01 Mar-02 Sep-02 Mar-03 Sep-03
Corp & Small Bus IB
Mortgages Asset Fin
Personal Group
Interest Margins
(half on half)
Margin Drivers
Net interest margin contracted by 10bp yoy:
• Net interest income in Treasury fell by $45 million as a result of run off of the existing portfolio and flat yield curves. This represented 3bp.
• The interest benefit from low interest savings accounts and non-interest bearing balances reduced as the rate at which they were invested reduced, representing 3bp.
• The funding cost associated with unrealised trading gains resulting from the appreciating AUD represented 3bp, although this was offset in trading income
• Funding and changed asset mix contributed 5bp
2.77
2.67
(3)
(3)
(5)
Funding & asset
mix
Funding derivative cash flows
Lower mismatch income in Treasury
2002 2003
(3)
Lower earnings on low &
zero interest deposits Lower
interest foregone
1
FX revenue hedges
3

SECTION 4SECTION 4
Treasury – adversely impacted by a tough interest rate environment
26
Australian & New Zealand Mismatch
-20
-10
-
10
20
30
40
50
60
70
80
-50
-
50
100
150
200
Total Income (LHS)
$mAUD pts
Avg Income
Aus Yield Spread: Rolling 3
year avg rate Vs Rolling 90
day avg rate (RHS)
• Over the last three halves Group Treasury’s earnings have been in decline, with further decreases expected in 2004.
• Group Treasury mismatch income is a function of the steepness of the yield curve (ie. rolling avg 3yr assets funded at rolling 90 days), which has been declining.
• The current interest rate environment is not one for building risk.
• The benign global interest rate environment, with term rates falling to historical lows and flattening yield curves, has limited investment opportunities.
• As such net ageing has occurred within the mismatch portfolio over recent periods.
• The Australian & New Zealand mismatch portfolios remain well placed to benefit from a tightening interest rate cycle. 1H00 2H00 1H01 2H01 1H02 2H02 1H03 2H03 1H04 2H04

SECTION 4SECTION 4
Non interest income impacted by Cards under-accrual and loyalty costs, underlying growth strong
27
Sep-02*
2796
* Sep-02 excludes significant items# excludes volume impact and benefits from repricing^ refer also Margin Drivers (p8)
Cards under-accrual
(38)
2002 cards under-accrual
(20)
JV Impact
(71)
Higher loyalty costs#
(37) Panin bond sales
20
Underlying growth
146 2808
Lower SFI
income
(33)
• Lending fees increased $57 million due to strong volume growth in Corporate, Asset Finance and Institutional Banking in Australasia
• Non lending fees reduced by $81 million principally from a $38 million under accrual of loyalty points on co-branded credit cards in prior years, higher cost of loyalty points and reduced fee revenue from US and UK structured finance operations.
• Structured Finance International income reduced as a result of the re-weighting of the Group’s portfolio in both risk and geographic terms, foreign exchange rate movements and subdued market conditions.
• Trading securities income growth included $45m from cash flow mismatches on swaps which had an opposite impact on net interest income
Sep-03
Cashflowimpact on trading
securities income^
45
$m$m

SECTION 4SECTION 4
Expense growth well controlled
28
Expense growth was relatively flat, with discretionary cost growth minimised due to lower revenue growth.
• Personnel costs up 2%, reflecting growth in staff numbers of 3% (increase occurred largely towards the end of the period).
• Overall FX impact on expenses immaterial at $1m, with fall in USD denominated expenses netting off against a rise in NZD denominated expenses.
• Higher software amortisation charges are coming through as further projects reach implementation stage.
• Cost management will continue to be a core discipline at ANZ. We will seek to maintain cost growth below income growth and increase re-investment in the business
Sep-02 Sep-03
3153
JV impact
(42)
Underlying growth
74 3228
$m
Higher software
amortisation
43
$m

SECTION 4SECTION 4
Doubtful Debts Provision reflects improved underlying portfolio
29
28
30
32
34
36
38
40
42
44
46bps Normalised ELP ELP Top-Up
• “Standard” ELP (as a % of NLAs) has decreased significantly from 46 bps to 32 bps across the period 1998 through 2003. This is consistent with mortgage growth in key lending markets of Australia and NZ and reduced Group risk profile
ANZ has adopted a conservative view on the level of offshore expected default frequencies post Sep 2001 by recognising an approximately 7bp average incremental ELP adjustment charge
ELP adjustment expected to be progressively wound back over the next two years, predicated on continued risk reduction and stabilisation in the offshore book.
4136 47
5052
311303309301
290
241246256252258
250237
3940434241
35
36
4042
454746
3233
363938
0
50
100
150
200
250
300
350
Mar-98
Sep-98
Mar-99
Sep-99
Mar-00
Sep-00
Mar-01
Sep-01
Mar-02
Sep-02
Mar-03
Sep-03
0
10
20
30
40
50
60
70
80ELP AdjustmentELP ChargeStandard ELP (bps)Headline ELP (bps)
ELP Charge$m bp’s
ELP Rate Drivers
Sep
-02
Hea
dlin
e
IFS r
educt
ion
in N
LA’s
Corp
ora
te
incr
ease
in
NLA
’s
Gro
wth
in
mort
gag
es
Sep
-03
Hea
dlin
e
43
(1) 1
(4)
39

SECTION 4SECTION 4
Cumulative ELP balance is well above the specific provision balance
30
0
500
1000
1500
2000
2500
3000
3500
4000
1997 1998 1999 2000 2001 2002 20030
100
200
300
400
500
600
700
ELP (LHS) SP (LHS) Cumulative difference (RHS) Cum + $250m top up
$m$m
• The cumulative ELP balance continues to comfortably exceed the specific provision balance.
• In 2003 an additional $100 million was provided in ELP as precaution against continued above expected levels of default on the offshore lending portfolio.
• The reduced 2003 specific provisioning charge reflected a 56% decrease in overseas market charges. This is reflective of the de-risking strategy in the Institutional Financial Services segment, resulting in the winding down of offshore exposures.

SECTION 4SECTION 4
Healthy dividend growth
31
50%
52%
54%
56%
58%
60%
62%
64%
66%
68%
70%
72%
1998 1999 2000 2001 2002 2003
0.28 0.300.35
0.40
0.460.51
0.440.390.330.290.260.24
$0.00
$0.10
$0.20
$0.30
$0.40
$0.50
$0.60
$0.70
$0.80
$0.90
$1.00
1998 1999 2000 2001 2002 2003
Interim Final
Dividends
Dividend Payout Ratio
• The full year dividend of 95 cents per ordinary share represents a 12% increase on 2002.
• The final dividend is 100% franked.
• For year ending 30 Sep 2004, the directors expect to at least maintain a fully franked dividend per share at the same level as for the year ended 30 Sep 2003 on the expanded issued capital.

SECTION 4SECTION 4
Capital targets reduced, reflecting lower risk
32
4.50
4.75
5.00
5.25
5.50
5.75
6.00
6.25
6.50
6.75
7.00
7.25
7.50
Sep-02 Sep-03 NBNZ ProForma
Drivers of ACE ratio
Target range
5.71
Earnings
1.59
Dividend
(1.02)
RWA growth
(0.43)
5.70
%
Other (0.12)
Net impact of FX rate movements on ACE capital was approximately -$235 million.
FX impact on RWA was approx -$3.2bn down due to FX rate movements, again principally the US$ depreciation (US$ accounted for -$3.3bn of the movement).
Net impact on ACE ratio due to FX movement was +2bpts.
Our target ACE capital range has been lowered to 4.75% to 5.25% to recognise:
Continued reduction in risk as evidenced by growth in the proportion of residential mortgage lending and reduction in offshore lending
Acquisition of NBNZ which further diversifies our income and has a lower risk lending book ~5%

SECTION 4SECTION 4
Restructuring our hybrid funding will impact the relationship between PAT & EPS in 2004
33
Background Approximate 2004 impact (indicative)*
NPAT -40
Dividend -44
“EPS” contribution +4
TrUEPrS StEPS
Issued Sept/Nov 1998 27 Sep 2003
Amount USD 0.775 bn AUD 1bn
Cost of Dividend 8% Fixed BBSW Floating
To be called 1H 2004 ------
Net Cost Floating rate + margin
BBSW + margin
Profit & Loss
Income Fixed to Floating Swap nil
TaxTax on Swap
Deduction for dividendDeduction for
dividend
NPAT
EPS
Preference Dividend 8% Fixed BBSW + Margin
Significant transactions in 2004 (indicative)
Close out of swap +76
Other + 6
NPAT +82
Final “cash” dividend1 - 31+51
A swap effectively converts TrUEPrS 8% fixed cost to floating plus a margin 1 – includes impact of delaying TrUEPrS for NBNZ acquisition
* Refer following page for further details
SECTION 4SECTION 4
Illustrative Impact of TrUEPrS redemption and replacement on 2004
34
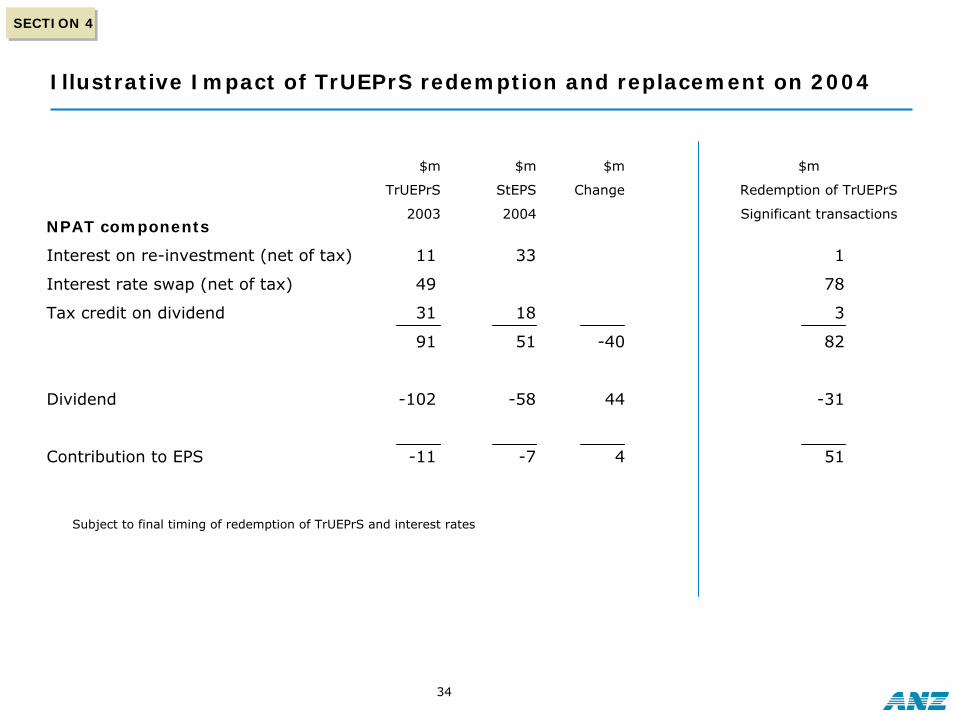
NPAT components
Interest on re-investment (net of tax) 11 33 1
Interest rate swap (net of tax) 49 78
Tax credit on dividend 31 18 3
91 51 -40 82
Dividend -102 -58 44 -31
Contribution to EPS -11 -7 4 51
$m
TrUEPrS
2003
$m
StEPS
2004
$m
Change
$m
Redemption of TrUEPrS
Significant transactions
Subject to final timing of redemption of TrUEPrS and interest rates

SECTION 4SECTION 4
Outlook
35
• We expect ANZ will continue to perform well in a tougher industry environment in 2004
• Expected NPAT growth in 2004 for existing businesses on a stand alone, individual basis:• Growth in net profit after tax for ANZ and NBNZ on an individual/stand alone basis expected to be
moderately lower than ANZ’s growth in 2003 (excluding significant transactions) based on current economic conditions. The growth rate in 2003, excluding significant transactions, was 8.3%.
• Expected integration costs, cost synergies, and revenue attrition associated with the NBNZ acquisition in the 10 months to 30 September 2004:
• Slightly less than half of estimated $230m integration costs expected to be incurred in 2004• Only a small amount of the estimated cost synergies expected to be realised in 2004• Revenue losses expected to exceed cost synergies in 2004
• Adjustment to EPS from bonus element of rights issue of approximately 4%:• 2003 restated EPS will be 142.1c (Basic), and 146.1c (adjusted for goodwill amortisation)
• After adjusting for the bonus element of the rights issue, we expect modest growth in EPS in 2004 (excluding goodwill amortisation and significant transactions but including integration costs).
• After including the amortisation of goodwill on acquisition of NBNZ, we expect similar EPS in 2004 compared to 2003 adjusted for the bonus element of the rights issue.
• ANZ expects to maintain a dividend of at least 95 cents per share in 2004, fully franked

SECTION 5SECTION 5
36
Portfolio PerformancePortfolio Performance

37
43%9%
13%
25%
10%
A specialised portfolio - efficient allocation of resources to deliver results
SECTION 5SECTION 5
8%
12%6%
12%
6%5%
18%
33%
NPAT by business segment
IFS
Mortgages
Personal & INGA
Other
Corporate
Consumer FinanceAsset Finance
Risk Weighted Assets by business segment
Mortgages
IFSCorporate
Asset Finance
OtherA specialised portfolio allows us to efficiently allocate resources to those businesses experiencing, or with the potential for growth and to reduce resources away from those businesses with lower growth prospects and/or higher risk profiles.
0 200 400 600 800
NPAT increase
NPAT decrease
Prior period NPAT
Full Year NPAT $mSep 03 Sep 02 Change
Institutional Financial Services 772 715 8%
Personal Banking & Wealth 422 403 5%
Corporate 270 242 12%
New Zealand Banking 141 131 8%
Mortgages 270 247 9%
Consumer Finance 144 150 -4%
Asset Finance 127 103 23%
Asia Pacific 131 98 34%
Treasury 95 125 -24%
New Zealand

SECTION 5SECTION 5
IFS – a strong domestic franchise, continued risk reduction offshore
38
20%17%
7%
1%
-19%
-1%
Insi
tutional
Capital
Mark
ets
Tra
nsa
ctio
nServ
ices
Fore
ign
Exch
ange
CFA
SFI
71% 69%63%
60%57%
53% 54%49%
38%32%
64% 61%
54% 52%47% 45% 46%
39%
28% 23%37% 42% 31%
27% 23%21%
21%18% 15% 13%
0%
20%
40%
60%
80%
'02
'03
'02
'03
'02
'03
'02
'03
'02
'03
Total CustomersSignificant Customers*Lead Customers*
• ANZ has a strong tradition and leading position in the domestic institutional banking market.
• Our core domestic Institutional Bankingbusiness once again performed well in 2003, as we pursued our strategy to reduce non strategic exposures in the US and European markets, whilst placing emphasis on domestic activities.
• Our Capital Markets business also produced a robust result, with increased client penetration and higher trading volumes notwithstanding an environment of low interest rate volatility and consequently reduced client hedging activity.
• Transaction Services produced a respectable result in a difficult external environment as a result of SARS and Australia’s extended drought.
• Foreign Exchange earnings were flat for the year as a whole, with range bound currencies and a difficult international environment contributing to slow market conditions.
• Corporate Financing and Advisory services were flat in a slow external environment with limited transaction flow in the corporate advisory and project finance markets. This downturn was offset by a more robust performance in areas including private equity, infrastructure fund management and structured asset financing.
• Structured Finance International produced lower profits as a result of our re-weighting of the portfolio in both risk and geographic terms, and due to subdued market conditions.
ANZ Peer 1 Peer 2 Peer 3 Peer 4
A very strong domestic franchise*
*Source – Greenwich and Associates
Domestic profit growth has absorbed offshore reductions for 2003
SECTION 5SECTION 5
We continue to strengthen our position in the Corporate and SME markets
39
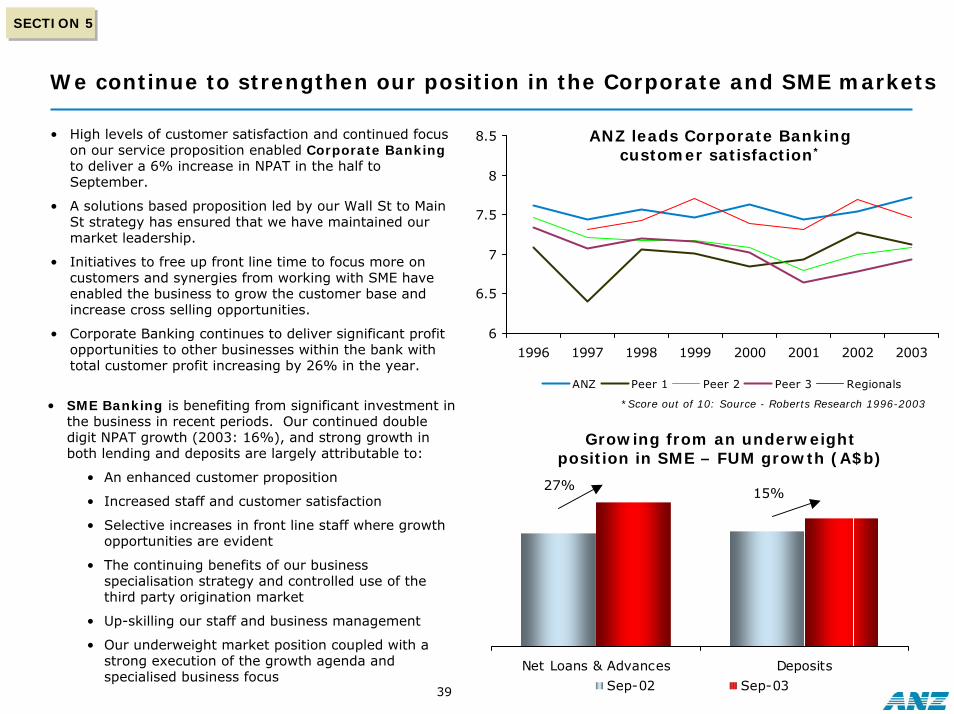
• High levels of customer satisfaction and continued focus on our service proposition enabled Corporate Bankingto deliver a 6% increase in NPAT in the half to September.
• A solutions based proposition led by our Wall St to Main St strategy has ensured that we have maintained our market leadership.
• Initiatives to free up front line time to focus more on customers and synergies from working with SME have enabled the business to grow the customer base and increase cross selling opportunities.
• Corporate Banking continues to deliver significant profit opportunities to other businesses within the bank with total customer profit increasing by 26% in the year.
Net Loans & Advances Deposits
Sep-02 Sep-03
*Score out of 10: Source - Roberts Research 1996-2003
Growing from an underweight position in SME – FUM growth (A$b)
6
6.5
7
7.5
8
8.5
1996 1997 1998 1999 2000 2001 2002 2003
ANZ Peer 1 Peer 2 Peer 3 Regionals
ANZ leads Corporate Banking customer satisfaction*
• SME Banking is benefiting from significant investment in the business in recent periods. Our continued double digit NPAT growth (2003: 16%), and strong growth in both lending and deposits are largely attributable to:
• An enhanced customer proposition
• Increased staff and customer satisfaction
• Selective increases in front line staff where growth opportunities are evident
• The continuing benefits of our business specialisation strategy and controlled use of the third party origination market
• Up-skilling our staff and business management
• Our underweight market position coupled with a strong execution of the growth agenda and specialised business focus
27% 15%

SECTION 5SECTION 5
Market leader: Asset Finance continues to prosper growing 23% in 2003
40-15
-10
-5
0
5
10
15
Feb-9
9
Aug-9
9
Feb-0
0
Aug-0
0
Feb-0
1
Aug-0
1
Feb-0
2
Aug-0
2
Feb-0
3
0
2
4
6
8
10
12
14
99 00 01 02 03
Asset Finance has continued its momentum, with NPAT growth of 23% in 2003. This strong performance is largely attributable to three key factors:
• Cultural transformation and a continued commitment to increasing staff satisfaction, which has lead to an improvement in partner satisfaction (79%) and customer satisfaction (80%).
• Process re-design leading to improved efficiency within the group. The cost to income ratio has fallen from 43.5% to 42% since March 2002, and average processing cost per contract has fallen 25%.
• Motor vehicle sales are at a 5 year high creating a favorable environment for new business writings. Likewise SMB financing (mostly equipment) has been growing strongly as businesses re-equip providing excellent support for extending our market leading position.
Asset Finance’s strong market position is emphasised by its growth in motor vehicle and equipment finance of 18% and 26% respectively against estimated system growth of 10% and 15%-20% respectively for the 2003 year.
% yearly change
Australian motor vehicle sales
0
20
40
60
80
100
120
1H02 1H02 1H03 2H03
Delivering the benefits of re-designGreater efficiency - cost per contract decreased
25% over 2 yearsIndex
SMB annual lending growth
% yearly change
50%
60%
70%
80%
90%
1999 2000 2001 2002 2003
A significant cultural transformation
Staff Advocacy

SECTION 5SECTION 5
Consumer Finance: profitable market leadership
41
Issuing Acquiring Personal Loans
1H03
2H03
Good underlying momentum in the Australian business
NPAT#
18% 16%
28%
19%21%
# ofAccounts
CashAdvances
Purchases Outstandings Limits
Strong market share in all aspects of cards market*
# - NPAT for Australian businesses only
*Source – RBA July 2003
44%
13%9%
• ANZ is the Australian market leader in the credit card business, with approximately 20% market share driven by the scale and variety of our product offerings.
• The Consumer Finance business enjoyed strong underlying business growth during the year including:
• An increase in net interest income of 15%, largely driven by an increase in credit card outstandings.
• Merchant turnover grew 18%, driven by the ongoing shift to card-based payments and growth in market share. Since 2000 we have increased the number of merchant outlets by 85% and annual turnover has increased in excess of 90%.
• Other operating income was impacted by a first half charge of $38m pre tax, relating to an under accrual of loyalty points dating back to 1999. After adjusting for the under accrual write back, NPAT grew 28% half on half and 26% for the year.
• The Reserve Bank interchange fee reduction has resulted in a decrease in interchange revenue of between 40-50%. We have endeavored to reduce the net impact to the business through the restructuring of our rewards program and the strategic alliance formed with Diners Card International.
• A comprehensive communications and retention program has been established following the program restructuring announcement. To date, customer retention levels have been significantly better than expected.

SECTION 5SECTION 5
Mortgages –strong growth drives performance
42
• The momentum in ANZ’s mortgages business in Australia and New Zealand continued during the year delivering a 9% increase in NPAT, with FUM increasing 19.9% on prior year. The cost of increased staffing required to maintain service levels in light of volume growth and the record level of internal commissions paid to the Network, as result of improved sales, slightly subdued the result.
• Strong growth was recorded in the Australian network and broker channels with 25% FUM increase on prior year. The New Zealand business has also delivered improved growth in the September 2003 quarter, following a period of flat or reducing volumes in 2002.
• Further development of the ANZ mortgage sales force capability is a priority for the 2004 year. Focus will continue to be on improving the capability of our mortgage specialists through sales, product and credit training, along with new sales tools. Additional specialist roles are being created in the branch network, and a significant increase in mobile managers is underway.
• A customer retention program also remains a key priority with dedicated Mortgage Customer Service and Retention teams. The teams proactively follow-up retention “triggers” and new sales opportunities. In conjunction with the network, a 25% increase in renewal activity has also been delivered during the year.
• A number of Business Improvement initiatives are well advanced and will continue to be a key focus in 2004. Specific initiatives include streamlining and automating business processes, the full rollout of the electronic lodgment of broker applications and enhanced behavioural credit scoring for existing customers.
Australian Network & Broker sales
0
300
600
900
1,200
1,500
Sep-01 Mar-02 Sep-02 Mar-03 Sep-03
Network
Broker
$m
Renewed momentum in the branch network
0.0%
0.5%
1.0%
1.5%
2.0%
2.5%
Sep-01 Mar-02 Sep-02 Mar-03 Sep-03
Residential Investment Owner Occupied
Prepayment Rate – Owner Occupied and Investment Loans*
Mo
nth
ly %
* Australia (excluding Origin)

SECTION 5SECTION 5
Personal Banking – underlying health of the business improving…
43
35%
65%
81%
0%
20%
40%
60%
80%
100%
Jul-01 Jul-02 Jul-03
75%
85%
50%
60%
70%
80%
90%
Mar-03 Sep-03
Mystery Shopping (% of branches with >75%
score)
6.57.4 7.5 7.57.6 8.2 8.3 8.3
02468
10
Mar-02 Sep-02 Mar-03 Sep-03Personal Rural
Staff advocacy –substantial improvement
Customer satisfaction with branch increasing
Significant reduction in queue complaints*
0
30
60
90
120
Mar-02 Sep-02 Mar-03 Sep-03
The personal banking business has continued to invest in its Restoring Customer Faith (“RCF”) program.
This program aims to improve the “health” of the business. Significant improvements have been achieved:
• Customer satisfaction scores for both Rural and Personal banking continue to improve, whilst complaints levels are falling.
• Mystery shopping results, which measure service at the branch level through unannounced monthly visits, continue to improve. Branches can act on detailed recommendations for improvement.
• Branch refurbishments continue. Over 100 branches have been upgraded, making the total more than 160 since the start of the program. A new telling platform is in pilot stage.
• Staff advocacy, being the % of staff that would recommend ANZ as a place to work has more than doubled since 2001.
• Staff skills have improved, with more than 4,200 staff trained in sales skills in the second half. New merchandising has been rolled out to support the sales process.
*- average number of complaints per month

SECTION 5SECTION 5
… and we are starting to see improved sales momentum…
44
3,000
4,000
5,000
6,000
7,000
8,000
Mar-02 Sep-02 Mar-03 Sep-03
Increasing mortgage sales FUM
8%8%
16%
A$b
Mar-02 Sep-02 Mar-03 Sep-03
Embracing insurance cross sell opportunities
200%
40%
500
550
600
650
700
750
Mar-02 Sep-02 Mar-03 Sep-03
000’s Total sales events increasing
20
22
24
26
28
30
32
34
Mar-02 Sep-02 Mar-03 Sep-03
Increase in total deposit FUM
A$b
The investments in the branch network are showing promising early results. Particularly in the second half, sales momentum has picked up across all main drivers of revenue:
• Total sales activity improved 8% in the second half, assisted by seasonality
• Deposit balances, for which the business earn the full interest margin, continue to grow strongly, increasing 9.7% in 2003
• Mortgages sales, the largest source of sales commissions, increased strongly on the back of market demand and investment in mortgage skills
• Managed Investment sales remained flat as investors continued to favour conservative investments and property
• Cross sell of insurance products improved from a low base, allowing us to deepen the customer relationship.

SECTION 5SECTION 5
… and continued growth in our core transaction products
45
0
20
40
60
80
100
> 5 years 2-5 years < 2 years
Monthly Transactions
0
20
40
60
80
100
> 5 years 2-5 years < 2 years
Average Balance Average Income
1,500
1,550
1,600
1,650
1,700
1,750
1,800
Jan-01
Jul-01
Jan-02
Jul-02
Jan-03
Jul-03
0
60
120
180
1H02 2H02 1H03 2H03
Opened Closed Net
New transaction accounts have not led to lower average balances
Index
Positive momentum in access account openings since relaunch
000’s
New transaction accounts have not led to higher transactions
‘000
Momentum maintained in net new account openings
Index
Our core transaction product suite is performing as we expected:
• Product leadership was confirmed with ANZ winning the industry award for the best transaction account
• Account growthcontinued to be positive during 2003 with net growth of 118,000 accounts
• Account behaviour is not materially different from accounts acquired before the launch of the new products
• New customers are joining ANZ. 60% of new accounts represent new customers, and 40% have at least one other product relationship
• Breakeven – we have now achieved breakeven on the new accounts
Relaunch

SECTION 6SECTION 6
46
Credit QualityCredit Quality
SECTION 6SECTION 6
Consumer & SME portfolios in good shape
47
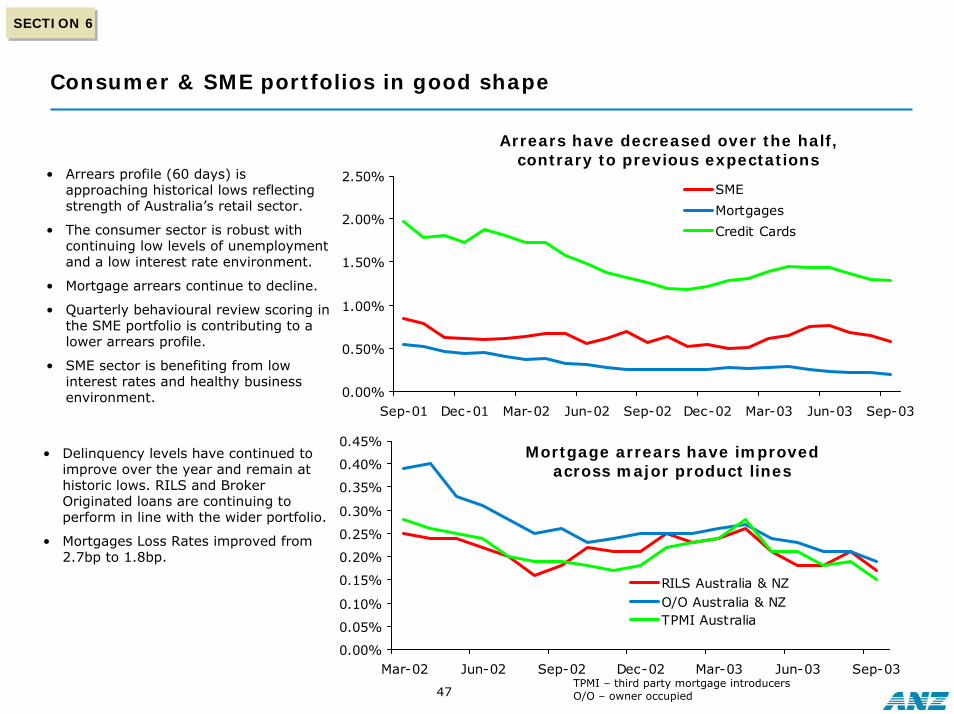
Arrears have decreased over the half, contrary to previous expectations
• Arrears profile (60 days) is approaching historical lows reflecting strength of Australia’s retail sector.
• The consumer sector is robust with continuing low levels of unemployment and a low interest rate environment.
• Mortgage arrears continue to decline.
• Quarterly behavioural review scoring in the SME portfolio is contributing to a lower arrears profile.
• SME sector is benefiting from low interest rates and healthy business environment. 0.00%
0.50%
1.00%
1.50%
2.00%
2.50%
Sep-01 Dec-01 Mar-02 Jun-02 Sep-02 Dec-02 Mar-03 Jun-03 Sep-03
SME
Mortgages
Credit Cards
0.00%
0.05%
0.10%
0.15%
0.20%
0.25%
0.30%
0.35%
0.40%
0.45%
Mar-02 Jun-02 Sep-02 Dec-02 Mar-03 Jun-03 Sep-03
RILS Australia & NZO/O Australia & NZTPMI Australia
Mortgage arrears have improved across major product lines
• Delinquency levels have continued to improve over the year and remain at historic lows. RILS and Broker Originated loans are continuing to perform in line with the wider portfolio.
• Mortgages Loss Rates improved from 2.7bp to 1.8bp.
TPMI – third party mortgage introducersO/O – owner occupied
SECTION 6SECTION 6
Mortgages portfolio sound
48
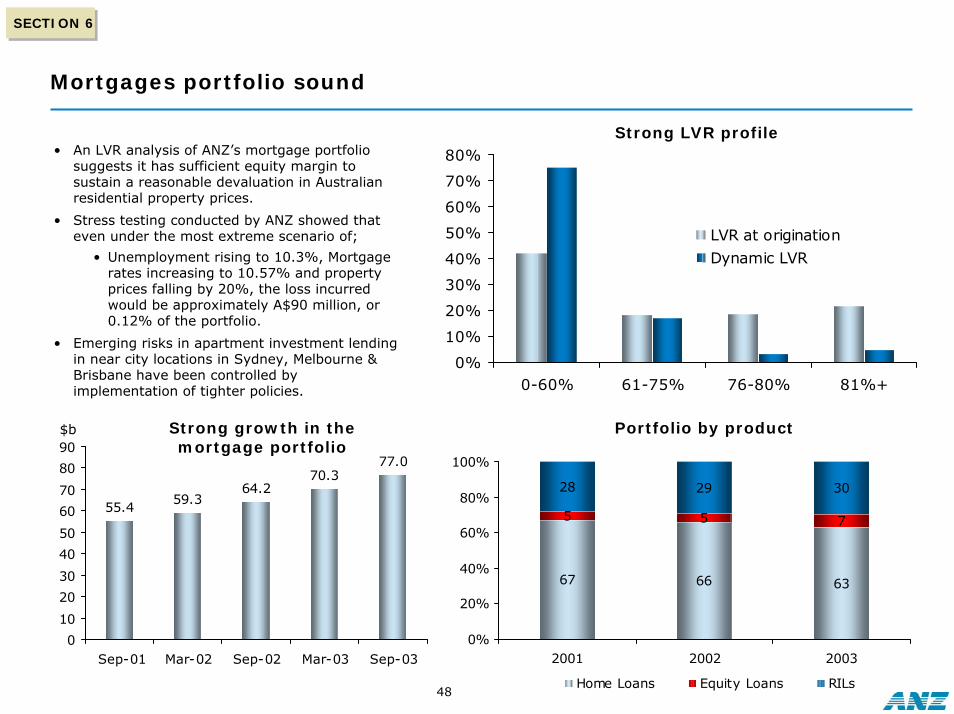
Strong LVR profile• An LVR analysis of ANZ’s mortgage portfolio
suggests it has sufficient equity margin to sustain a reasonable devaluation in Australian residential property prices.
• Stress testing conducted by ANZ showed that even under the most extreme scenario of;
• Unemployment rising to 10.3%, Mortgage rates increasing to 10.57% and property prices falling by 20%, the loss incurred would be approximately A$90 million, or 0.12% of the portfolio.
• Emerging risks in apartment investment lending in near city locations in Sydney, Melbourne & Brisbane have been controlled by implementation of tighter policies.
67 66 63
5 5 7
28 29 30
0%
20%
40%
60%
80%
100%
2001 2002 2003
Home Loans Equity Loans RILs
0%
10%
20%
30%
40%
50%
60%
70%
80%
0-60% 61-75% 76-80% 81%+
LVR at origination
Dynamic LVR
Portfolio by product
55.459.3
64.270.3
77.0
0
10
20
30
40
50
60
70
80
90
Sep-01 Mar-02 Sep-02 Mar-03 Sep-03
Strong growth in the mortgage portfolio
$b

SECTION 6SECTION 6
Domestic portfolio remains in good shape
49
Australia & New Zealand Risk Grade Profile
Asset Quality Sept 2003 v Sept 2001
(Australia & New Zealand)
3.5% 2.7% 2.4%
15.0% 14.7% 14.2%
14.9% 14.2% 15.0%
55.2% 57.1% 58.4%
11.4% 11.3% 10.0%
Sep-01 Sep-02 Sep-03
$155bn$136bn$126bn
• Net Non Accruals down 50%
• Net Specific Provisions down 32%
• Economic Loss Provision rate down 5bps
• Lending Growth 23%
(over 70% due to mortgages)
• B or lower ratings continue to decrease
AAA to BBB
BBB-
>BB-
BB+ to BB
BB-

SECTION 6SECTION 6
50
US Energy Portfolio – issues remain, but exposure continues to reduce
• Management has been proactive in addressing Group exposure to the global energy sector
• Concentration risk associated with exposure to energy lending as a proportion of the aggregate loan book has been mitigated by management initiatives to exit or restructure a number of key corporate lending positions in the US
• A number of high risk exposures remain, and are being actively managed (including sell down in secondary markets).
• We expect further specific provisions but at a reducing rate and that these can be absorbed within ELP
Note:
1. Includes utilised guarantees and market related products
2. Includes US domiciled exposures only (Excludes Mexico)
9% 11% 15%
14% 24%12%
27% 23% 18%
16% 22%
15%
36% 30%
28%
$1.8bn$1.7bn
$1.3bn
Sep-02 Mar-03 Sep-03No of Cust
(Total 20)Investment Grade 51.6% 51.5% 43.0% 9Non Accrual 9.2% 10.8% 14.8% 4Specific Provisions (AUD) 9.7m 9.1m 46.1m n/a(six months)
AAA to BBB
BBB-
B+ to CCC
BB+ to BB-
Non Accrual
• Outstandings$0.9bn (65%)
• Other Committed$0.4bn (30%)
• Uncommitted<$0.1bn (5%)
Total Limits(Excl Settlement)

SECTION 6SECTION 6
Quality of Group Telco lending book has also improved
51
7% 10% 12%
10% 8% 5%
22%15%
14%
9%
4%
5%
52%
63%
64%
$5.3bn
$4.8bn
$3.8bn
Sep-02 Mar-03 Sep-03
• ANZ Group has been proactive in addressing the telcoconcentration risk of its global lending asset portfolio
−ANZ continues to manage down its exposure to the industry, particularly offshore. Offshore assets now represent 42% of the Telco portfolio, down from 52% in Mar-03 and 57% in Sep-02.
−The risk profile of the telco industry is improving with increased financial flexibility stemming from strong free cash generation and debt reduction
• During the Full Year, Group “Top 6” committed telcoexposures declined (as a % of ACE) from 38% to 25%.
No of Cust(Total 39)
Investment Grade 83.1% 81.7% 82.8% 19Non Accrual 5.0% 3.4% 2.1% 3
AAA to A
BBB-
BB+ to BB-
BBB+ to BBB
B+ and below
• Outstandings$2.1bn (56%)
• Other Committed$1.2bn (30%)
• Uncommitted$0.5bn (14%)
Total Limits(Excl Settlement)

SECTION 6SECTION 6
Group risk grade profile
52
3.9% 3.7% 3.3% 3.2% 2.9%
14.2% 14.2% 13.9% 14.0% 13.7%
14.9% 14.7% 14.3% 14.9% 15.3%
51.4% 53.9% 54.0% 55.3%
15.6% 13.5% 14.5% 14.1% 12.8%
53.8%
Sep-01 Mar-02 Sep-02 Mar-03 Sep-03
ANZ Group - Outstandings
$143bn $149bn$142bn $158bn
B+ to CCC 3.0% 2.8% 2.5% 2.5% 2.3%Non Accrual 0.9% 0.9% 0.8% 0.7% 0.6%
Total investment grade as at Sep 03:$112.7bn or 68.1% of the portfolio
AAA to BBB
BBB-
BB+ to BB
BB-
>BB-
$165bn
SECTION 6SECTION 6
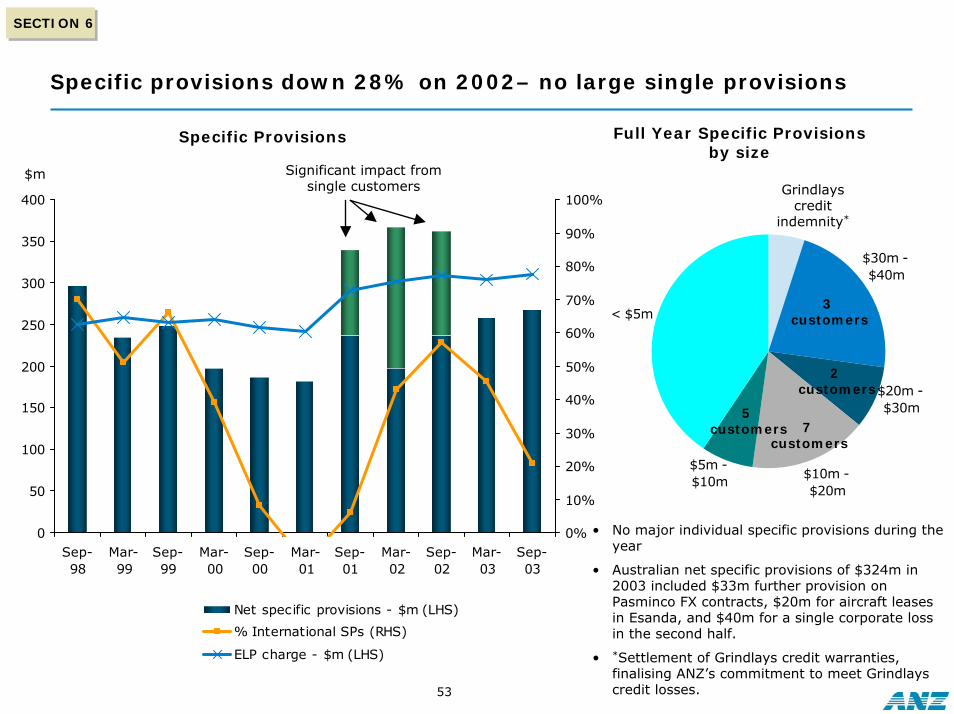
Specific provisions down 28% on 2002– no large single provisions
53
Specific Provisions
0
50
100
150
200
250
300
350
400
Sep-98
Mar-99
Sep-99
Mar-00
Sep-00
Mar-01
Sep-01
Mar-02
Sep-02
Mar-03
Sep-03
0%
10%
20%
30%
40%
50%
60%
70%
80%
90%
100%
Net specific provisions - $m (LHS)
% International SPs (RHS)
ELP charge - $m (LHS)
$m Significant impact from single customers
Full Year Specific Provisions by size
• No major individual specific provisions during the year
• Australian net specific provisions of $324m in 2003 included $33m further provision onPasminco FX contracts, $20m for aircraft leases in Esanda, and $40m for a single corporate loss in the second half.
• *Settlement of Grindlays credit warranties, finalising ANZ’s commitment to meet Grindlayscredit losses.
< $5m
$5m - $10m
$30m - $40m
$20m - $30m
$10m - $20m
3customers
Grindlays credit
indemnity*
7customers
2customers
5customers
SECTION 6SECTION 6
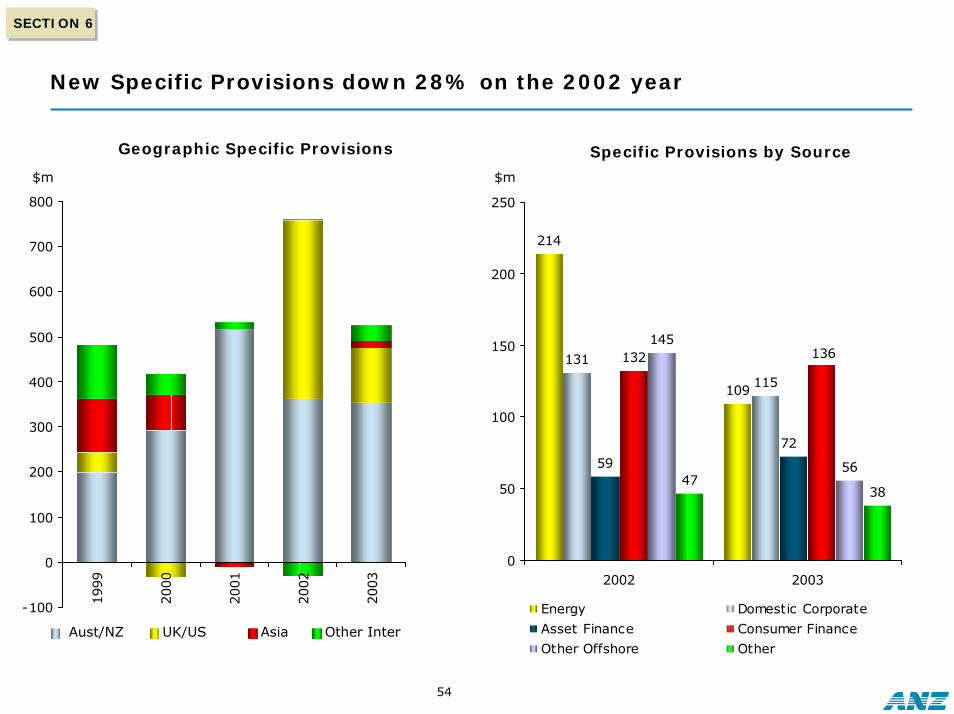
New Specific Provisions down 28% on the 2002 year
54
Geographic Specific Provisions
$m
-100
0
100
200
300
400
500
600
700
800
1999
2000
2001
2002
2003
Aust/NZ UK/US Asia Other Inter
214
109
131
115
59
132145
5647
38
72
136
0
50
100
150
200
250
2002 2003
Energy Domestic Corporate
Asset Finance Consumer Finance
Other Offshore Other
Specific Provisions by Source
$m

SECTION 6SECTION 6
Non-accrual loans continue to fall
55
5922
463
651 681
388
80
792
523
37
643
522
0
200
400
600
800
1000
2000 2001
2002 2003
1543
1391
12601203
1007
1662
525
628
770699
657
900
0
300
600
900
1200
1500
1800
1998 1999 2000 2001 2002 Sep-030.00%
0.25%
0.50%
0.75%
1.00%
1.25%
1.50%
1.75%
Gross Non-Accrual Loans (LHS)
Net Non-Accrual Loans (LHS)
$m
Non-Accrual Loans/ Loans & advances (RHS)
Historic
Aust InterNZ
GeographicGross Non-Accrual Loans
$m

SECTION 6SECTION 6
New non-accruals reduced 23% on 2002
56
Geographic New Non-Accrual Loans
331
253
186168
190
150
274
88
154
120
200
159
0
50
100
150
200
250
300
350
2002 2003
Energy Domestic Corporate
Asset Finance Consumer Finance
Other Offshore Other
New Non-Accrual Loans by source
$m
0
200
400
600
800
1000
1200
1400
1600
1999
2000
2001
2002
2003
$m
Aust/NZ UK/US Asia Other Inter
1028
930
13561285
988

SECTION 6SECTION 6
Existing and future problem loans are well provided for
57
48%
31% 30%
43%
0%
10%
20%
30%
40%
50%
60%
ANZ Sep 03 CBAJun 03 NAB Mar 03 WBC Mar 03
General Provision/RWAs
Specific Provision/Non-Accrual Loans
• The period 1998 through 2003 has seen Group GP trend down 16% to 101 bps, consistent with the sustained de-risking of the Group lending book.
• As at September 2003, gross non-accrual loans were 61 bps of GLAs (or A$1.0bn). Of this, 48% was covered by specific provisioning.
• Group levels of general and specific provisioning compare favorably with Australian banking peer group.
%
0.90
0.75
0.951.01
0.00
0.20
0.40
0.60
0.80
1.00
1.20
ANZ Sep 03 CBA Jun 03 NAB Mar 03 WBC Mar 03Note:
1. As per most recent company financial reports for CBA, NAB and WBC

58
40%
50%
60%
70%
80%
90%
100%
110%
120%
130%
140%
0 250 500 750 1000 1250
Funded Unfunded
Top 10 Lending Exposures as % of ACE(2)
Sep-2001 Sep-2002 Sep-2003
Position of top 10 exposures as at Sep
02
SECTION 6
Proactive reduction in volume of “top 10” client committed exposures
SECTION 6
Top 10 Committed Exposures(1)
• ANZ has implemented credit management policies to diversify loan book exposure by reducing the volume of “top 10” client committed lending. This has led to a reduction in client concentration risk
• Sustained management of client exposures has reduced the sensitivity of the capital base of “top 10” clients (to ~75% of ACE in 2003 from ~135% of ACE in 2001)
S & P Rating
A-
AA-
A+
AAA
A
AAA
BBB+
A-
BBB+
A
AUDm
Note:
1. Limits represent total 7 month limits excluding uncommitted and non-recourse, net of credit derivatives
2. Excludes non-recourse and uncommitted facilities

SECTION 6SECTION 6
Basel II will provide some benefits, but adjustments expected for local market
59
Corporate (incl SMEs) Residential Mortgages Other
Current StandardisedFoundation Advanced
ANZ Regulatory Capital under Basel II by key asset class
(calculated at 8% of risk weighted assets)
Note:
1. The reduction in RWAs using Advanced IRB outcomes (excluding operational risk) when compared with current accord capital requirements can be used as an indicator of the relative riskiness of a bank’s assets.
2. RWA calculations were performed using the capital functions used in QIS 3.0 These may change upon the finalisation of Basel II
3. These results exclude any impact from NBNZ
-49-43
-13
-60
-50
-40
-30
-20
-10
0
ANZ Advanced IRB Aust Majors Average G10 major bank average
Change in RWA under Basel II1
QIS 3 results
%
• QIS 3 results reflect the underlying quality of ANZ’s assets, and supportANZ’s move to a lower ACE target range
• Corporate portfolio in particular produces a RWA reduction consistent with lower levels of risk
• We do not expect that APRA or Ratings Agencies will allow Australian Major banks the full benefit of the potential capital relief available under Basel II
• Results reinforce why Australian banks have lower Tier 1 and ACE ratios

60
The material in this presentation is general background information about the Bank’s activities current at the date of the presentation. It is information given in summary
form and does not purport to be complete. It is not intended to be relied upon as advice to investors or potential investors and does not take into account the
investment objectives, financial situation or needs of any particular investor. These should be considered, with or without professional advice when deciding if an
investment is appropriate.
For further information visit
www.anz.comor contact
Simon FraserHead of Investor Relations
ph: (613) 9273 4185 fax: (613) 9273 4091 e-mail: [email protected]

61
Copy of presentation available on
www.anz.com