2003 annual report and can shipments report annual report and can shipments report can manufacturers...
TRANSCRIPT
2003 Annual Report and Can Shipments Report
Can Manufacturers Institute

Top Right: Jeff DeLiberty, Silgan Containers Corporation,
and Sean Reilly, Can Manufacturers Institute.
Center: Frank Mechura, 2002-2004 CMI Chairman, Crown
Cork & Seal Company (USA), Inc., and Leon Midgett, Ball
Corporation.
Center Right: Frank Mechura, 2002-2004 CMI Chairman,
Crown Cork & Seal Company (USA), Inc., addresses the
membership at the 2003 CMI Annual Meeting breakfast.
Center Left: Lars Emilson, Rexam Beverage Can Americas,
and Bill Mansfield, The Valspar Corporation.
Bottom Left: Tom Hale, Ball Corporation, addresses the
membership at the General Session of the CMI Annual Meeting.
2003 Annual Report & Can Shipments Report
Table of Contents1-12
1
2
3-4
4
5-9
8
10
11-12
13-1913
14
14
14
14
15
16
17
18
18
19
19
19
19
19
2003 Annual ReportCMI Missions and Goals
Letter from the President
Government Relations
Deposit Bill Highlights
Food Can Marketing Committee
Food Can Business-to-Business Promotion Program
Market Data Committee
Beverage Can Public Relations Committee/Aluminum Can Council
Can Shipments ReportSubscription Information
About This Report
CMI Market Data Committee
Acknowledgments
Participants
Definitions
Metal Can Shipments: 2001-2003
Food Can Shipments: 1998-2003
Metal Can Shipments by Material/Technology: 2003
General Line Can Shipments: 1999-2003
Beverage Can Shipments by Size: 2003
Aluminum Can Shipments, Exports: 2002-2003
Aluminum Can Shipments, Imports: 2002-2003
Steel Can Shipments, Exports: 2002-2003
Steel Can Shipments, Imports: 2002-2003

PAGE 1 l 2003 Annual Report
The Can Manufacturers Institute’s mission is to represent its members’ interests before state and federal
legislative and regulatory bodies. Additionally, CMI provides members with market development programs
within the parameters of anti-trust law. To fulfill this task, in 2003, CMI maintained and strengthened its
commitment to the following CMI goals:
To provide the industry with effective representation in Congressional and Administrative policy-making on
those issues with specific impact on or important to the overall success of the can making industry.
To collect and disseminate industry statistics to provide an accurate assessment of the industry’s production
and to collect and analyze consumer market information to promote the growth and economic welfare of
CMI’s members.
To promote the industry with trade, local and national media and within state and local governments by
publicizing overall can benefits and industry achievements.
To serve, on an as-needed basis, as a facilitation resource for the discussion and resolution of joint industry
technical, operational or regulatory challenges.
CMI’s dedication to these goals is evident in all that has been accomplished this year. This Annual Report
provides a summary of the past year’s accomplishments, as well as a look at our strategy to fulfill these goals
in the coming year.
CMI Missions and Goals
•
•
•
•

2003 Annual Report l PAGE 2
The old Washington, DC adage “there are no permanent friends or enemies, just permanent interests” has proven
true in the past four years. A nation polarized by ideology, we were split on national security issues, and then
fiercely united in fighting terrorism. Now, as the presidential election draws near, we again are a country divided.
The vagaries of national politics often are mirrored in the corporate world, particularly from the trade association
perspective. Rivals become allies, and friends are at times adversaries. This past year, however, CMI recognized
the many challenges facing can makers and forged strong alliances with customer and supplier groups to protect
and to grow the industry.
Today, our partnerships and alliances are many and varied. The Aluminum Can Council continues to work to
grow beverage can sales and promote recycling. The CMI’s participation in the Canned Food Alliance is now
in its seventh year and great strides have been made in creating greater consumer acceptability for canned foods.
For the first time, can makers, along with steel and aluminum suppliers are funding a food can business-to-
business communications program. Our close relationship with the Beer Institute continues and a new endeavor
with The National Soft Drink Association joins can makers with CSD customers to advertise the importance
of recycling. We are also aligned in our regulatory and legislative work with the chemical, automobile, steel,
food, and paper industries.
These alliances bring CMI’s member companies many benefits. In addition to sharing the cost burden of many
vital industry programs, they allow for increased communication to address jointly issues of concern. They
create a united front when promoting our industry, and offer an atmosphere of comity when facing common
concerns. In these challenging times, our industry partnerships are invaluable in CMI’s efforts to address the
many interests of the can making industry.
Best Regards,
Robert R. BudwayPresident
Letter from the President

DelistingThe Regulatory Committee continued to seek an
exemption for the two-piece beverage can making
subcategory from the Metal Can MACT via formal
delisting. The Committee and EPA are working to
resolve the remaining technical delisting issues needed
for this subcategory, including revision of EPA’s
formaldehyde risk assessment. If successful, this
exemption will prevent the need for costly and
unwarranted pollution controls. The Committee is
encouraging EPA to propose this delisting by the end
of 2004.
MACTIn November 2003, EPA published the final National
Emission Standards for Hazardous Air Pollutants
(NESHAP or MACT) for the Surface Coating of Metal
Can operations in the United States. The complex
rule applies to approximately 140 existing facilities
and is expected to reduce hazardous air pollutants
(HAPs) by 70 percent from current metal can coating
operations. The final negotiated requirements will
save CMI members potentially 25-50% of the cost
of originally drafted compliance costs. Industry
compliance is required by November 2006, three years
after final promulgation of the Can MACT, unless an
extension is granted due to pending delisting petitions.
The Regulatory Committee and Health and Safety Subcommittee continued to work with the
Environmental Protection Agency (EPA), Food and Drug Administration (FDA) and Occupational
Safety and Health Administration (OSHA) to advance the interests of the can making industry.
Government Relations
PAGE 3 l 2003 Annual Report
FDA Bioterrorism RegulationsCMI, along with other packaging groups, successfully
lobbied the Congress and administrative agencies
to exempt can makers from potentially onerous bio-
terrorism security requirements. In February 2003,
the FDA proposed new registration, recordkeeping
and prior import notification requirements for food
and food packaging facilities to comply with mandates
from Congress under the Bioterrorism Preparedness
and Response Act of 2002. Industry was concerned
about the significant costs and burdens that FDA’s
proposed rules would impose on the industries without
increasing the security of our nation’s food supply.
In October, the FDA released “interim final” bio-
terrorism regulations which now exclude can makers
from requirements.
OSHA Metalworking FluidsThe Health and Safety Subcommittee remains con-
cerned that OSHA may regulate industrial metalworking
fluids (MWF) in the workplace. An OSHA standard
would address union concerns that workers need
better protection from potential health risks due
to MWF workplace exposure. Implementation of
suggested OSHA metalworking fluids requirements
may result in costly additional engineering controls
and administrative changes for facilities that fail to
meet the revised exposure limitations. In October
2003, two labor unions filed suit against the U.S.
Department of Labor, Occupational Safety and Health
Administration (OSHA) in the U.S. Court of Appeals,
3rd Circuit, to force agency action in promulgating a
stringent health standard to regulate worker exposure
to MWFs. In December, CMI worked with the National
Association of Manufacturers and the Chamber of
Commerce to file a joint amicus brief with the court
supporting OSHA’s decision not to regulate MWFs.
On March 22, 2004, the U.S. Court of Appeals for the
3rd Circuit denied the unions’ request to regulate
MWFs. The Court indicated that it was sympathetic
to the union pleas that exposing workers to MWFs
may cause adverse health effects, but determined that
OSHA was justified in focusing agency resources on
other substances.
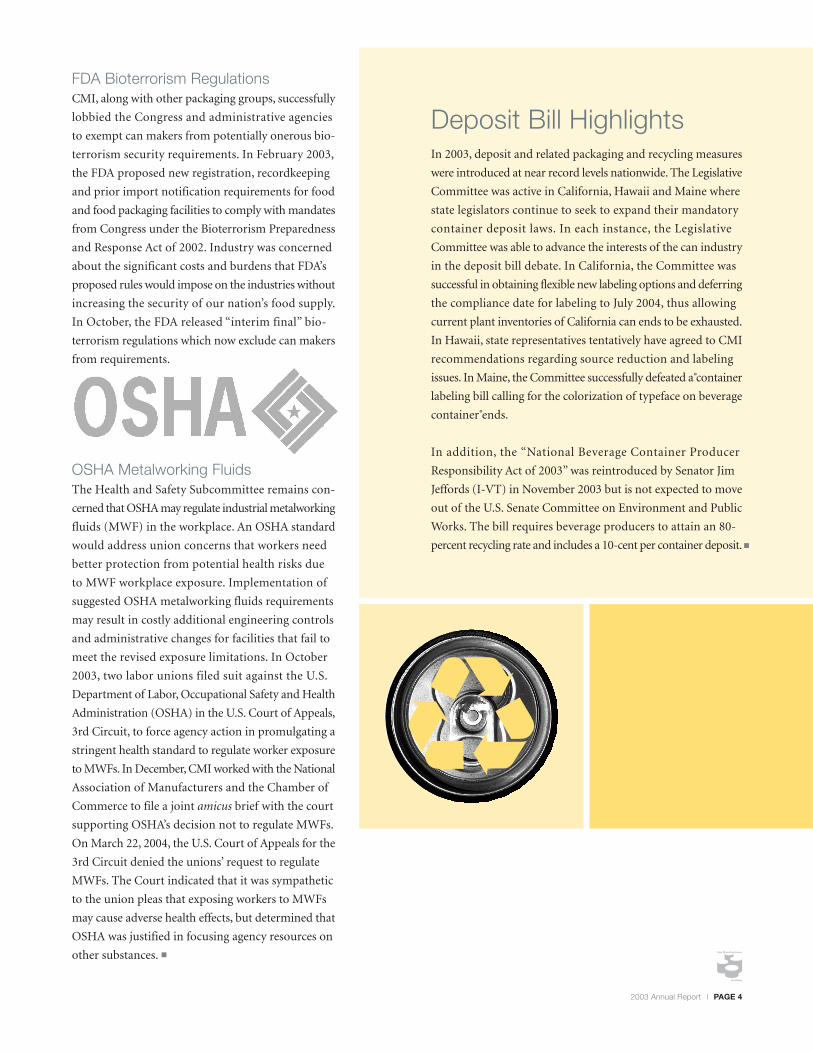
Deposit Bill HighlightsIn 2003, deposit and related packaging and recycling measures
were introduced at near record levels nationwide. The Legislative
Committee was active in California, Hawaii and Maine where
state legislators continue to seek to expand their mandatory
container deposit laws. In each instance, the Legislative
Committee was able to advance the interests of the can industry
in the deposit bill debate. In California, the Committee was
successful in obtaining flexible new labeling options and deferring
the compliance date for labeling to July 2004, thus allowing
current plant inventories of California can ends to be exhausted.
In Hawaii, state representatives tentatively have agreed to CMI
recommendations regarding source reduction and labeling
issues. In Maine, the Committee successfully defeated a container
labeling bill calling for the colorization of typeface on beverage
container ends.
In addition, the “National Beverage Container Producer
Responsibility Act of 2003” was reintroduced by Senator Jim
Jeffords (I-VT) in November 2003 but is not expected to move
out of the U.S. Senate Committee on Environment and Public
Works. The bill requires beverage producers to attain an 80-
percent recycling rate and includes a 10-cent per container deposit.
2003 Annual Report l PAGE 4
In 2003, the Canned Food Alliance (CFA), a partner-
ship of the American Iron and Steel Institute’s Steel
Packaging Council, select food processors, and CMI
food can manufacturing members, continued to
increase consumer awareness of the benefits of canned
food and successfully changed perceptions about the
nutritional value of canned food. The CFA campaign
entered into a number of new valuable partnerships
which culminated in new media campaigns and
outreach programs, and continued to build on its
previous successes as well.
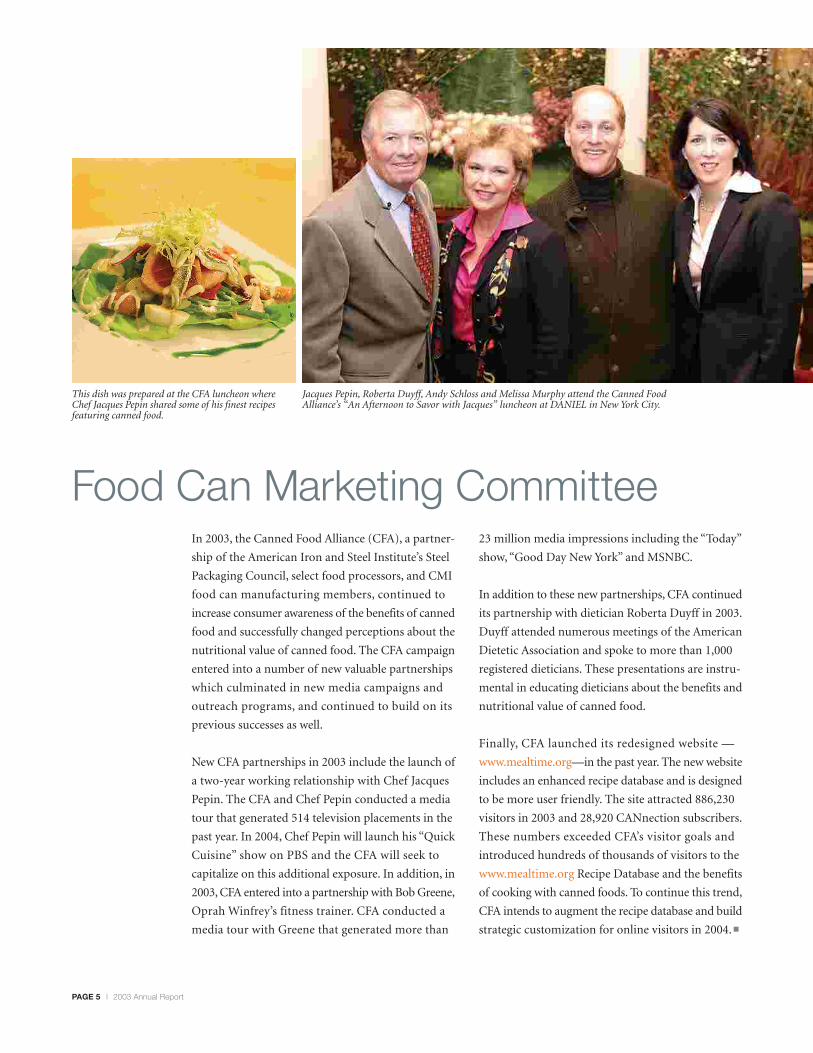
New CFA partnerships in 2003 include the launch of
a two-year working relationship with Chef Jacques
Pepin. The CFA and Chef Pepin conducted a media
tour that generated 514 television placements in the
past year. In 2004, Chef Pepin will launch his “Quick
Cuisine” show on PBS and the CFA will seek to
capitalize on this additional exposure. In addition, in
2003, CFA entered into a partnership with Bob Greene,
Oprah Winfrey’s fitness trainer. CFA conducted a
media tour with Greene that generated more than
23 million media impressions including the “Today”
show, “Good Day New York” and MSNBC.
In addition to these new partnerships, CFA continued
its partnership with dietician Roberta Duyff in 2003.
Duyff attended numerous meetings of the American
Dietetic Association and spoke to more than 1,000
registered dieticians. These presentations are instru-
mental in educating dieticians about the benefits and
nutritional value of canned food.
Finally, CFA launched its redesigned website —
www.mealtime.org—in the past year. The new website
includes an enhanced recipe database and is designed
to be more user friendly. The site attracted 886,230
visitors in 2003 and 28,920 CANnection subscribers.
These numbers exceeded CFA’s visitor goals and
introduced hundreds of thousands of visitors to the
www.mealtime.org Recipe Database and the benefits
of cooking with canned foods. To continue this trend,
CFA intends to augment the recipe database and build
strategic customization for online visitors in 2004.
Food Can Marketing Committee
Jacques Pepin, Roberta Duyff, Andy Schloss and Melissa Murphy attend the Canned Food Alliance’s “An Afternoon to Savor with Jacques” luncheon at DANIEL in New York City.
This dish was prepared at the CFA luncheon where Chef Jacques Pepin shared some of his finest recipes featuring canned food.
PAGE 5 l 2003 Annual Report

Benchmark Results: NutritionCanned vs. Fresh 2005 Goal: 41.7% of primary grocery shoppers perceive canned food as “more
or equally” nutritious as fresh.
Benchmark Results: NutritionCanned vs. Frozen 2005 Goal: 57.3% of primary grocery shoppers perceive canned food as “more
or equally” nutritious as frozen.
2003 Annual Report l PAGE 6
When compared to its fresh counterparts, do you feel that canned food is more, less or equally nutritious
when prepared for the table?
40
38
36
34
32
301997 1998 2000 2001 2003
31.7
37.238 38
39
When compared to its frozen counterparts, do you feel that canned food is more, less or equally nutritious
when prepared for the table?
58
54
50
46
42
38
34
301997 1998 2000 2001 2003
54 53.555.9 56.6
54

Today’s high-tech can is the ultimate innovation for busy lifestyles. Now with easy-open endsfor maximum convenience, it’s the packaging solution of choice for the modern consumer. Plus, it’s shelf-stable so you can stock up without worrying about spoilage and multiple tripsto the supermarket. Unlike pouched and plastic packaging, cans are the most tamper and punctureresistant, which is critical in today’s society. And when it comes to your return on investment,no packaging technology compares to the low-cost design and efficiency of the can.So rediscover the can. Because modern packaging doesn’t get any more advanced.
www.cancentral.com
Can Manufacturers Institute

Food Can Business-to-Business Promotion Program In 2003, CMI executed a business-to-business marketing program to convey the positive qualities of the metal
food can, as well as to stem the growth of alternative, non-metal packaging materials that could replace metal
food cans. Before the program launch, qualitative research indicated that packaging decisions are made within
a “buying committee” in most companies, with the primary individuals driving packaging choices being brand
managers, packaging engineers and research & development professionals. Based on these findings, a business-
to-business program was developed and executed. It focused on trade media advertising in publications read
by the target audience. Advertisements were published in BrandPackaging, Food & Drug Packaging, Packaging
Digest, and Food Processing. In addition, members of the CMI Food Can Marketing Committee gave a
presentation titled “Food Can Innovations and Trends” at the recent Pack Expo in Las Vegas, Nevada. The CMI
business-to-business seminar was the second highest attended session at Pack Expo. The presentation generated
lots of good press, including a front page feature story in the Pack Expo Show Daily that was distributed to all
show attendees (see below).
In 2004, the CMI Business-to-Business program will focus on PR and media in an effort to generate positive
coverage concerning metal food cans. The Food Can Marketing Committee will conduct market research to
gain a better understanding of the target audience and its drivers; implement a targeted media campaign to
generate positive media coverage of today’s metal food can and establish a point of differentiation between metal
food cans and alternative packaging materials among the trade and business community; and develop an
influencer outreach program to educate industry opinion leaders about metal packaging advances and innovations.
2003 Annual Report l PAGE 8

Today’s high-tech can is the ultimate innovation for getting meals on the table fast.It’s shelf-stable, so families can stock up without worrying about spoilage and multiple trips to the supermarket. The can’s new easy-open ends are more convenient than ever.Unlike pouched and plastic packaging, cans are the most tamper and puncture resistant, which is critical in today’s society. And when it comes to your return on investment,no packaging technology compares to the low-cost design and efficiency of the can.So rediscover the can. Because modern packaging doesn’t get any more advanced.
www.cancentral.com
Can Manufacturers Institute
In 2003, the CMI Market Data Committee continued
its mission of providing statistical collection and
market analysis services for the industry, while at the
same time updating and improving existing services.
Beginning with the January 2003 CMI Beverage Can
Shipments Report, the Market Data Committee was
able to provide year-over-year comparisons of ship-
ments of cans intended for non-carbonated beverages
broken out by categories. In addition, the Market
Data Committee continued to evaluate and adjust the
CMI Metal Can Shipments Report to ensure that it
accurately reflects the size of the market for food and
general line cans. The Market Data Committee will
continue to adjust estimated shipment data for non-
reporters to reflect events in the industry.
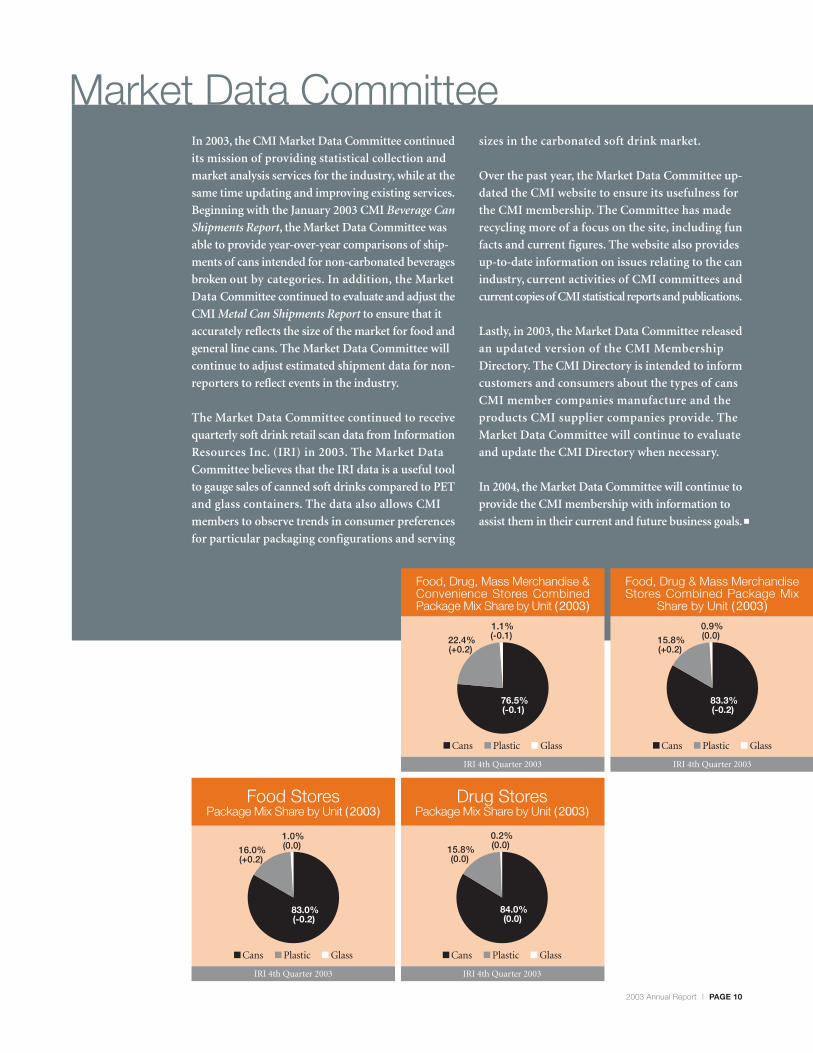
The Market Data Committee continued to receive
quarterly soft drink retail scan data from Information
Resources Inc. (IRI) in 2003. The Market Data
Committee believes that the IRI data is a useful tool
to gauge sales of canned soft drinks compared to PET
and glass containers. The data also allows CMI
members to observe trends in consumer preferences
for particular packaging configurations and serving
sizes in the carbonated soft drink market.
Over the past year, the Market Data Committee up-
dated the CMI website to ensure its usefulness for
the CMI membership. The Committee has made
recycling more of a focus on the site, including fun
facts and current figures. The website also provides
up-to-date information on issues relating to the can
industry, current activities of CMI committees and
current copies of CMI statistical reports and publications.
Lastly, in 2003, the Market Data Committee released
an updated version of the CMI Membership
Directory. The CMI Directory is intended to inform
customers and consumers about the types of cans
CMI member companies manufacture and the
products CMI supplier companies provide. The
Market Data Committee will continue to evaluate
and update the CMI Directory when necessary.
In 2004, the Market Data Committee will continue to
provide the CMI membership with information to
assist them in their current and future business goals.
Market Data Committee
IRI 4th Quarter 2003
Food StoresPackage Mix Share by Unit (2003)
IRI 4th Quarter 2003
Drug StoresPackage Mix Share by Unit (2003)
IRI 4th Quarter 2003
Food, Drug & Mass Merchandise Stores Combined Package Mix
Share by Unit ( 2003)
Food, Drug, Mass Merchandise & Convenience Stores Combined Package Mix Share by Unit (2003)
IRI 4th Quarter 2003
2003 Annual Report l PAGE 10
Cans Plastic Glass
16.0% (+0.2)
1.0% (0.0)
83.0% (-0.2)
Cans Plastic Glass
15.8% (0.0)
0.2% (0.0)
84.0% (0.0)
Cans Plastic Glass
15.8% (+0.2)
0.9% (0.0)
83.3% (-0.2)
22.4% (+0.2)
1.1% (-0.1)
76.5% (-0.1)
Cans Plastic Glass
Beverage Can Public Relations Committee/Aluminum Can Council
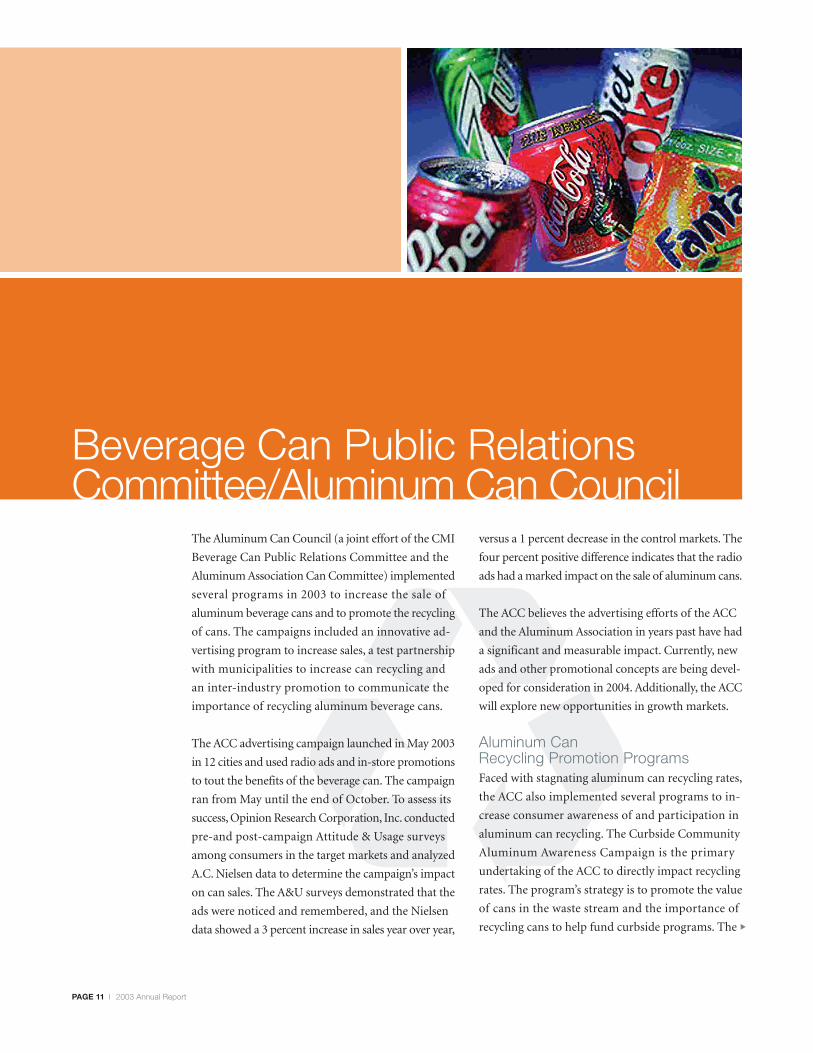
The Aluminum Can Council (a joint effort of the CMI
Beverage Can Public Relations Committee and the
Aluminum Association Can Committee) implemented
several programs in 2003 to increase the sale of
aluminum beverage cans and to promote the recycling
of cans. The campaigns included an innovative ad-
vertising program to increase sales, a test partnership
with municipalities to increase can recycling and
an inter-industry promotion to communicate the
importance of recycling aluminum beverage cans.
The ACC advertising campaign launched in May 2003
in 12 cities and used radio ads and in-store promotions
to tout the benefits of the beverage can. The campaign
ran from May until the end of October. To assess its
success, Opinion Research Corporation, Inc. conducted
pre-and post-campaign Attitude & Usage surveys
among consumers in the target markets and analyzed
A.C. Nielsen data to determine the campaign’s impact
on can sales. The A&U surveys demonstrated that the
ads were noticed and remembered, and the Nielsen
data showed a 3 percent increase in sales year over year,
versus a 1 percent decrease in the control markets. The
four percent positive difference indicates that the radio
ads had a marked impact on the sale of aluminum cans.
The ACC believes the advertising efforts of the ACC
and the Aluminum Association in years past have had
a significant and measurable impact. Currently, new
ads and other promotional concepts are being devel-
oped for consideration in 2004. Additionally, the ACC
will explore new opportunities in growth markets.
Aluminum Can Recycling Promotion ProgramsFaced with stagnating aluminum can recycling rates,
the ACC also implemented several programs to in-
crease consumer awareness of and participation in
aluminum can recycling. The Curbside Community
Aluminum Awareness Campaign is the primary
undertaking of the ACC to directly impact recycling
rates. The program’s strategy is to promote the value
of cans in the waste stream and the importance of
recycling cans to help fund curbside programs. The
PAGE 11 l 2003 Annual Report

program was designed to have municipalities assist
in its funding, as they would benefit from the increase
in aluminum cans collected. However, when seeking
municipalities with which to partner, few had the
funds to help finance a program. There was interest,
however, in experimenting with various curbside
options to determine “best practices” for municipalities
to consider. These various options are currently being
tested. The end result, it is hoped, is a “best practices”
guide that will assist municipalities in their efforts to
increase aluminum can collection.
A second program to promote recycling was an in-
plant campaign at both aluminum sheet and can
manufacturing facilities. The campaign reinforced
the industry’s message of the importance of recycling
and encouraged employees to carry the can recycling
message back to their communities through a can
recycling drive. Organized around America Recycles
Day in November, the ACC provided promotional
material and logistical support to participating facil-
ities. Anheuser-Busch Recycling arranged collection
trailers at the facilities. Some 63 facilities in 27 states
participated reaching almost 16,000 employees. They
raised more than $50,000 for charity through their
recycling efforts.
CMI’s educational program, Aluminum Beverage
Cans: The ABCs of Environmental Education, was
expanded in 2003, by contracting with the Keystone
Center to update the curriculum geared to primary
schools and to develop a new program targeted for
middle school kids. These have been completed and
marketed to teachers at the National Science Teachers
Association conference in April 2004.
2003 Annual Report l PAGE 12
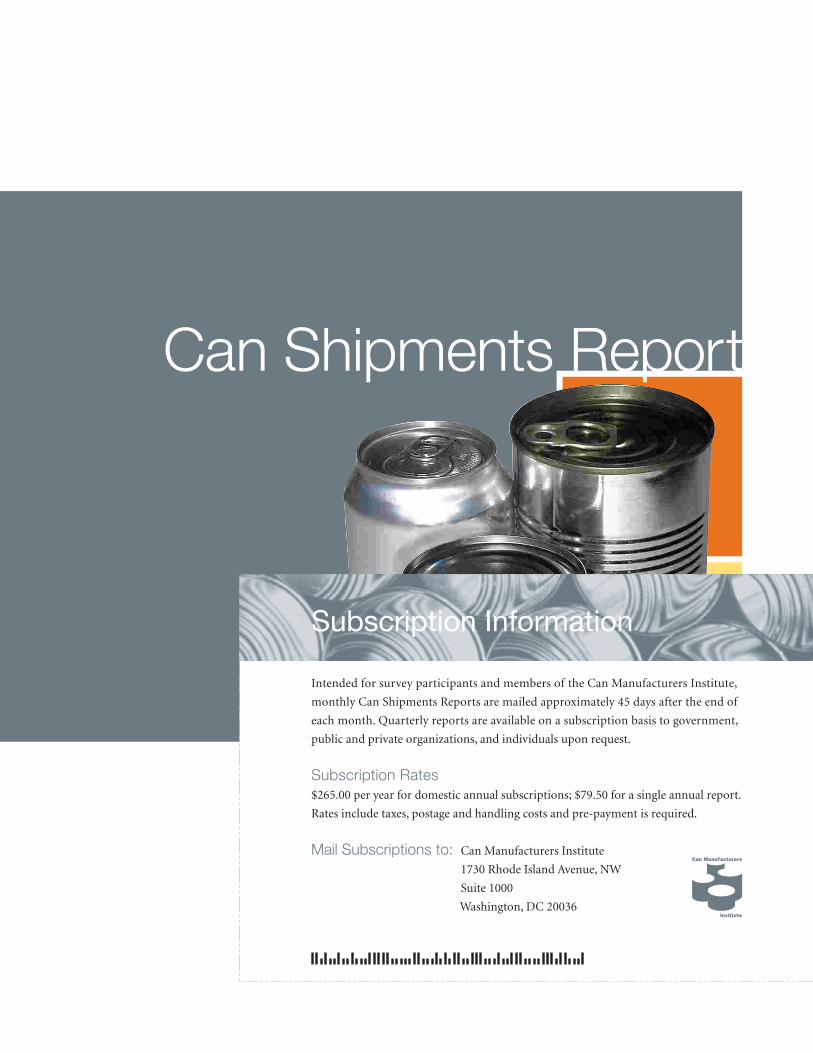
Can Shipments Report
Subscription Information
Intended for survey participants and members of the Can Manufacturers Institute,
monthly Can Shipments Reports are mailed approximately 45 days after the end of
each month. Quarterly reports are available on a subscription basis to government,
public and private organizations, and individuals upon request.
Subscription Rates$265.00 per year for domestic annual subscriptions; $79.50 for a single annual report.
Rates include taxes, postage and handling costs and pre-payment is required.
Mail Subscriptions to: Can Manufacturers Institute
1730 Rhode Island Avenue, NW
Suite 1000
Washington, DC 20036
About This ReportThe Can Shipments Report is compiled directly from reports received from can manufacturers unless otherwise
noted. This statistical program is sponsored by the Can Manufacturers Institute and is under the direction of
the CMI Market Data Committee.
CMI Market Data CommitteeAstrid Belt
Neill Mitchell
Tom Slauter (Committee Co-Chairman)
Jo Stephens
Jeff DeLiberty (Committee Co-Chairman)
Sean Reilly
AcknowledgmentsThe Can Manufacturers Institute gratefully acknowledges the cooperation of all industry participants, especially
the assistance of the CMI Market Data Committee for their efforts in the compilation of this annual report.
Participants*Allstate Can Corporation
Ball Corporation
Ball Western Can Company, L.L.C.
Bertels Can Company
BWAY Corporation
Crown Cork & Seal Company (USA), Inc.
Metal Container Corporation
Rexam Beverage Can Americas
Silgan Containers Corporation
U.S. Can Corporation
Van Can Company
Participants in the CMI Shipments Reports manufacture over 95% of the metal cans in the United States.
In order to represent the entire domestic can industry, CMI does estimate can shipments for non-reporters
in its reports.
Ball Corporation
Crown Cork & Seal Company (USA), Inc.
Metal Container Corporation
Rexam Beverage Can Americas
Silgan Containers Corporation
CMI
*
2003 Can Shipments Report l PAGE 14
General DefinitionsA metal can is a single-walled container constructed
wholly of tinplate, blackplate (including tin-free steel),
waste plate, aluminum sheet or impact extrusions,
designed for packaging products. It excludes steel pails
defined as single-walled shipping containers having
capacities of one to 12 gallons inclusive, that are
cylindrically constructed of steel of 29 gauge and heavier.
Shipments for use by the same company, an affiliate,
subsidiary, or parent company are considered as
shipments FOR OWN USE. All others are considered
shipments INVOICED FOR SALE.
Coverage of this report is confined to metal cans and
ends shipped for use on metal cans by metal can
manufacturers.
Product DefinitionsShipments: The actual number of unfilled can bodies
produced, invoiced for sale and shipped from a location
within the U.S. or U.S. controlled territory.
Exports: The actual number of unfilled can bodies
produced, invoiced for sale and shipped from a location
within the U.S. or U.S. controlled territory to a location
outside of the U.S. or U.S. controlled territory.
Beer: A two-piece aluminum or steel container con-
taining beer, non-alcoholic beer, wine/spirits, or wine/
spirit coolers.
Soft Drinks: A two-piece aluminum or steel beverage
container. Includes all carbonated and non-carbonated
soft drinks, iced tea, tonic, waters and juice beverages.
Baby Foods: Self Explanatory. Includes all milk or
soy-based baby formula and baby food products.
Dairy Products: Includes butter, cheese, eggs, milk,
milk-based products, ice cream, etc. Also includes non
milk-based puddings.
Fruit/Fruit Juices: Includes all conventional fruit items:
apples, apple sauce, peaches, pears, pineapple, etc.
Also includes fruit juices and all citrus items. Does
not include fruit juices in two-piece “soft drink” cans.
Meat & Poultry: Includes all conventional meat and
poultry items: ham, luncheon meat, potted meat,
vienna sausage. Also includes chili and meat stews.
Does not include soup and spaghetti with meat which
are in Other Foods (Including Soup).
Pet Foods: Includes cat, dog and fish food.
Seafoods: Includes fish and shell fish.
Vegetable/Vegetable Juices: Includes conventional
vegetable items: peas, green beans, corn, tomatoes,
etc. Also includes dry line items: baked beans, kidney
beans. Includes mushrooms and pickles. Does not
include soup which is in Other Foods (Including
Soup). Does not include juices in two-piece “soft
drink” cans.
Other Foods (Including Soup): Includes all food items
not otherwise enumerated. Includes soups, edible oils
and solid shortenings, spaghetti, spices, baking powder,
extracts, yeast, sandwich spreads, jams, mayonnaise,
snacks, cocoa, dough, flour, honey, nuts, popcorn,
popped corn, potato chips, pretzels, rice, noodles,
sauces, syrups, cake, candies, cereals, loose tea and
canned bags. Also includes drugs intended for human
consumption except milk-based drugs which are in
Dairy. Does not include iced tea which is in Soft Drinks.
Aerosol: This is the only category restricted by can
type. Includes food and nonfoods.
Other Nonfoods: Includes all other nonfood items
not otherwise enumerated. Includes adhesive strips,
alcohol, tennis balls, cements/dressings, chemicals,
cleaners, cosmetics, dentists’ supplies, disinfectants,
dyes, ether, wood fillers, games/toys, germicides,
gasoline, lubricating grease, grinding compounds,
insecticides, pencils, photographic supplies, plaster of
paris, floor/shoe/leather/other non-automotive
polishes, body/cleanser/talcum powders, roofing
cement, grass seed, shaving preparations, soaps,
solvents, stamp pads, tobacco and automotive products
such as motor oil, anti-freeze, brake fluid, gasoline,
radiator additives and automotive polish.
Definitions
PAGE 15 l 2003 Can Shipments Report
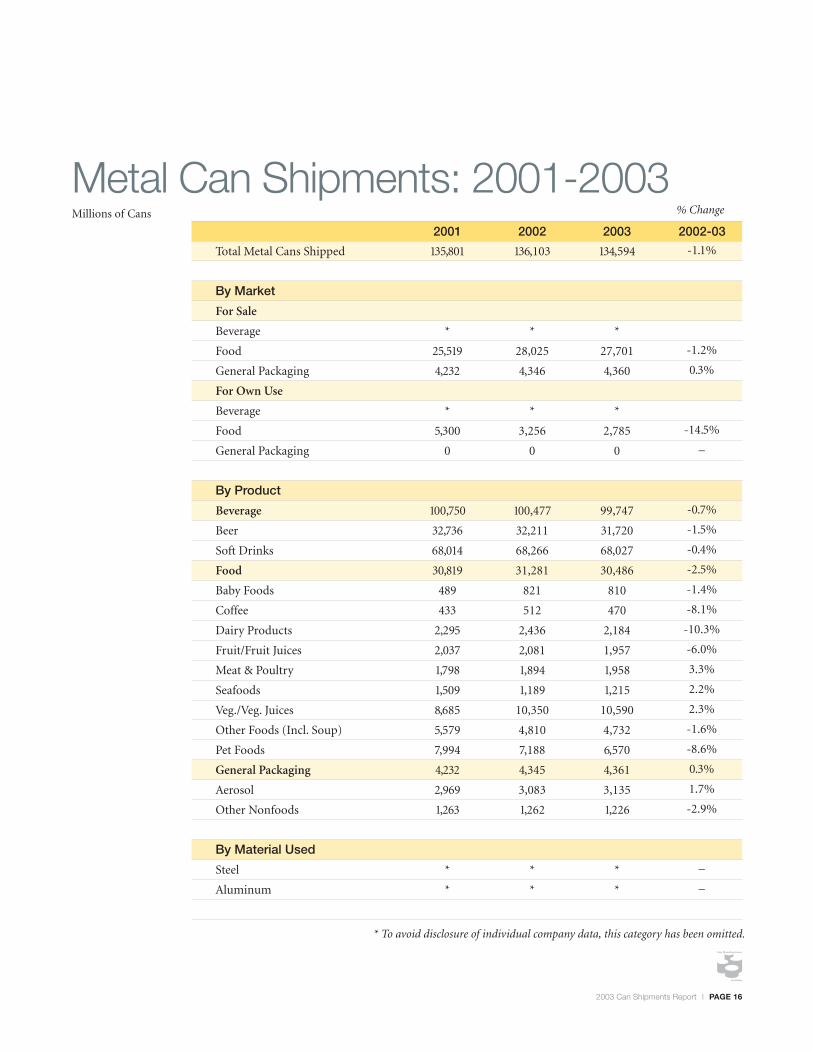
* To avoid disclosure of individual company data, this category has been omitted.
% ChangeMillions of Cans
-1.1%
-1.2%
0.3%
-14.5%
–
-0.7%
-1.5%
-0.4%
-2.5%
-1.4%
-8.1%
-10.3%
-6.0%
3.3%
2.2%
2.3%
-1.6%
-8.6%
0.3%
1.7%
-2.9%
–
–
134,594
*
27,701
4,360
*
2,785
0
99,747
31,720
68,027
30,486
810
470
2,184
1,957
1,958
1,215
10,590
4,732
6,570
4,361
3,135
1,226
*
*
Metal Can Shipments: 2001-2003135,801
*
25,519
4,232
*
5,300
0
100,750
32,736
68,014
30,819
489
433
2,295
2,037
1,798
1,509
8,685
5,579
7,994
4,232
2,969
1,263
*
*
136,103
*
28,025
4,346
*
3,256
0
100,477
32,211
68,266
31,281
821
512
2,436
2,081
1,894
1,189
10,350
4,810
7,188
4,345
3,083
1,262
*
*
Total Metal Cans Shipped
By Market
For Sale
Beverage
Food
General Packaging
For Own Use
Beverage
Food
General Packaging
By Product
Beverage
Beer
Soft Drinks
Food
Baby Foods
Coffee
Dairy Products
Fruit/Fruit Juices
Meat & Poultry
Seafoods
Veg./Veg. Juices
Other Foods (Incl. Soup)
Pet Foods
General Packaging
Aerosol
Other Nonfoods
By Material Used
Steel
Aluminum
20022001 2003 2002-03
2003 Can Shipments Report l PAGE 16

Billions of Cans
Food Can Shipments: 1998-20032.0
1.751.5
1.251.0
0.750.5
0.250.0
0.471-8.1%
2.01.75
1.51.25
1.00.75
0.50.25
0.0
0.810-1.4%
3.02.75
2.52.25
2.01.75
1.51.25
1.0 20031.957-6.0%
4.03.53.02.52.01.5
10.50.0
2.185-10.3%
3.02.75
2.52.25
2.01.75
1.51.25
1.0
1.2152.2%
2.01.75
1.51.25
1.00.75
0.50.25
0.0
1.9583.3%
20034.732-1.6%
6.56.25
6.05.75
5.55.25
5.04.75
4.5
12.011.511.010.510.0
9.59.08.58.0
10.5912.3%
Baby Foods
0.793-30.7%
0.782-1.4%
0.585-25.2%
0.489-16.5%
0.82068.0%
Coffee
0.6203.7%
0.6322.0%
0.432-31.8%
0.4330.3%
0.51218.2%
20031998 1999 2000 2001 2002 20031998 1999 2000 2001 2002
Fruit / Fruit Juices
1998 19992.500-2.3%
2.303-7.9%
20002.098-8.9%
20012.037-2.9%
20022.0812.2%
Dairy Products
1998 19991.61626.4%
1.545-4.4%
20001.83819.0%
20012.29524.8%
20022.4366.1%
2003
SeafoodsMeat & Poultry
1998 19991.661-1.2%
1.8229.7%
20001.651-9.4%
20011.7988.9%
20021.8945.3%
2003 20031998 19991.685
-11.3%1.630-3.2%
20001.6310.0%
20011.509-7.5%
20021.189
-21.2%
Other Foods (Incl. Soup)Veg. / Veg. Juices
1998 19999.2232.7%
9.7786.1%
20009.545-2.4%
20018.685-9.0%
200210.35019.2%
2003 1998 19996.093-0.7%
5.755-5.5%
20005.566-3.3%
20015.5790.2%
20024.810
-13.8%
PAGE 17 l 2003 Can Shipments Report

Millions of Cans
Total
Beverage
Beer
Soft Drinks
Food
Baby Foods
Coffee
Dairy Products
Fruit/Fruit Juices
Meat & Poultry
Seafoods
Veg./Veg. Juices
Other Foods (Incl. Soup)
Pet Foods
General Packaging
Aerosol
Other Nonfoods
** To avoid disclosure of individual company data, this category has been omitted.
Metal Can Shipments by Material/Technology: 2003
19,432
0
0
0
15,126
**
**
**
**
504
92
6,965
1,603
1,320
4,306
3,135
1,171
115,162
99,747
31,720
68,027
15,360
**
**
**
**
1,454
1,123
3,625
3,129
5,250
55
0
55
By Technology2-Piece 3-Piece
Billions of Cans
5.04.54.03.53.02.52.01.51.0
General Line Can Shipments: 1999-2003
Total Aerosol Other
134,594
99,747
31,720
68,027
30,486
810
470
2,184
1,957
1,958
1,215
10,590
4,732
6,570
4,361
3,135
1,226
Total Cans
**
99,747
31,720
68,027
**
**
**
**
**
**
**
**
**
**
0
0
0
**
0
0
0
**
**
**
**
**
**
**
**
**
**
4,361
3,135
1,226
By MaterialAluminumSteel
4.361 3.135 1.2264.406 3.066 1.340 4.356 3.002 1.354 4.232 2.969 1.263 4.346 3.083 1.263
2003 Can Shipments Report l PAGE 18
20031999 2000 2001 2002
Millions of Cans
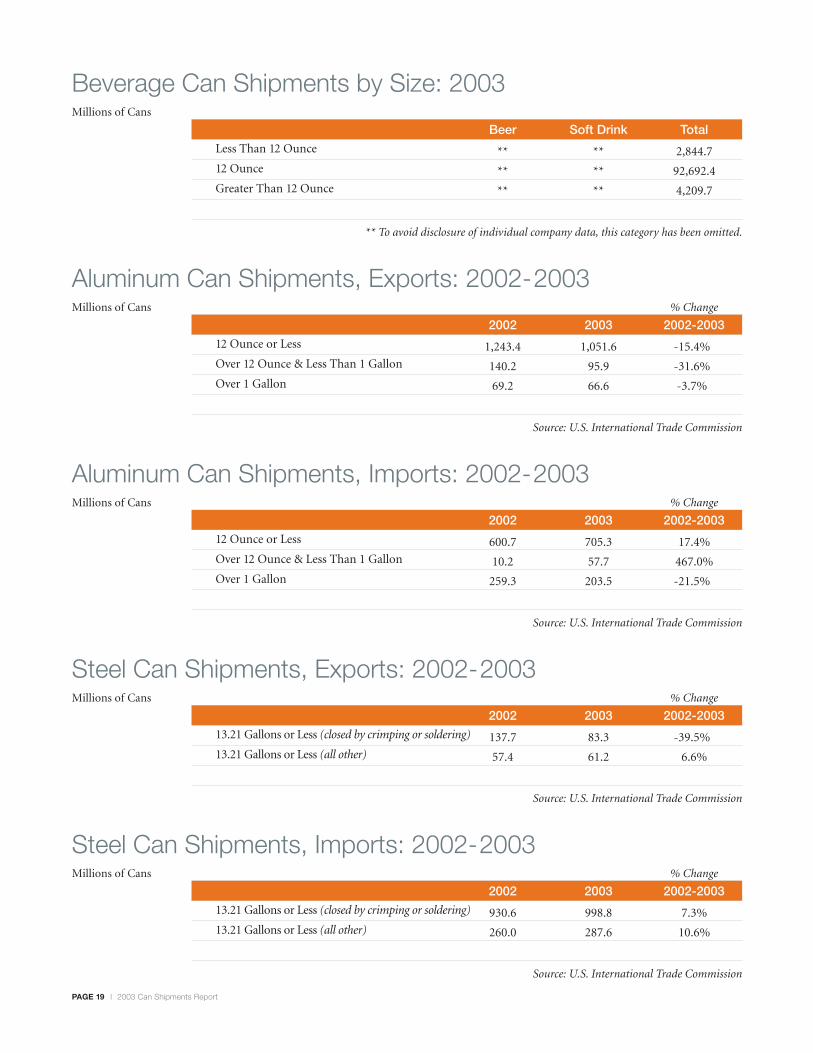
-15.4%
-31.6%
-3.7%
1,243.4
140.2
69.2
1,051.6
95.9
66.6
12 Ounce or Less
Over 12 Ounce & Less Than 1 Gallon
Over 1 Gallon
Source: U.S. International Trade Commission
Aluminum Can Shipments, Exports: 2002-2003
2002 2003 2002-2003% Change
Millions of Cans
17.4%
467.0%
-21.5%
600.7
10.2
259.3
705.3
57.7
203.5
12 Ounce or Less
Over 12 Ounce & Less Than 1 Gallon
Over 1 Gallon
Source: U.S. International Trade Commission
Aluminum Can Shipments, Imports: 2002-2003
2002 2003 2002-2003% Change
Millions of Cans
-39.5%
6.6%
137.7
57.4
83.3
61.2
13.21 Gallons or Less (closed by crimping or soldering)
13.21 Gallons or Less (all other)
Source: U.S. International Trade Commission
Steel Can Shipments, Exports: 2002-2003
2002 2003 2002-2003% Change
Millions of Cans
7.3%
10.6%
930.6
260.0
998.8
287.6
13.21 Gallons or Less (closed by crimping or soldering)
13.21 Gallons or Less (all other)
Source: U.S. International Trade Commission
Steel Can Shipments, Imports: 2002-2003
2002 2003 2002-2003% Change
Millions of Cans
2,844.7
92,692.4
4,209.7
**
**
**
**
**
**
Less Than 12 Ounce
12 Ounce
Greater Than 12 Ounce
** To avoid disclosure of individual company data, this category has been omitted.
Beverage Can Shipments by Size: 2003
Beer Soft Drink Total
PAGE 19 l 2003 Can Shipments Report
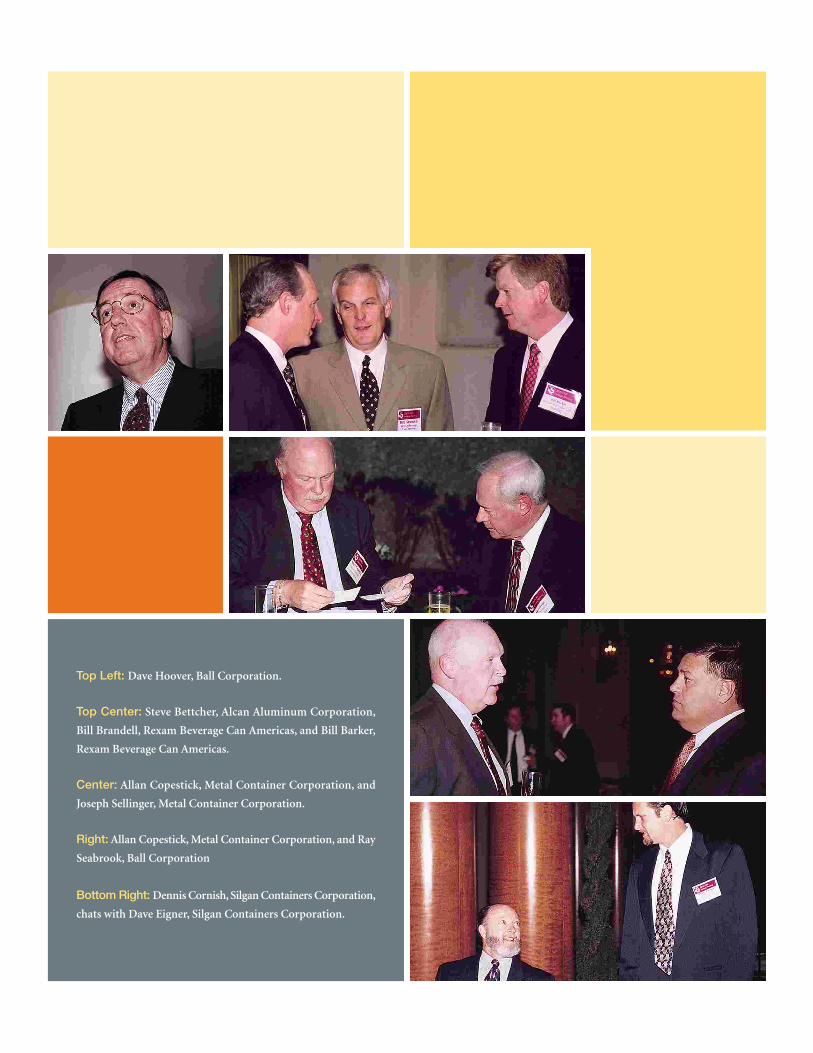
Top Left: Dave Hoover, Ball Corporation.
Top Center: Steve Bettcher, Alcan Aluminum Corporation,
Bill Brandell, Rexam Beverage Can Americas, and Bill Barker,
Rexam Beverage Can Americas.
Center: Allan Copestick, Metal Container Corporation, and
Joseph Sellinger, Metal Container Corporation.
Right: Allan Copestick, Metal Container Corporation, and Ray
Seabrook, Ball Corporation
Bottom Right: Dennis Cornish, Silgan Containers Corporation,
chats with Dave Eigner, Silgan Containers Corporation.

tel 202.232.4677 · fax 202.232.5756 · www.cancentral.com
CMI Member Companies 2004
Alcan Aluminum Corporation ALCOA, Inc.ARCO Aluminum Inc.Ball CorporationBWAY CorporationCrown Cork & Seal Company (USA), Inc.Darex Container Products, W.R. Grace & Co.ICI Packaging CoatingsINX International Ink CompanyInternational Steel Group Inc.Metal Container CorporationOrbis CorporationPPG Industries, Inc.Rexam Beverage Can AmericasSequa Can Machinery, Inc.Silgan Containers CorporationSonoco-Phoenix, Inc. The Valspar CorporationU.S. Can CorporationUSS-Posco IndustriesUSX CorporationVan Can CompanyWatson StandardWeirton Steel CorporationWise Alloys LLC
CMI Executive Committee
Ball CorporationR. David HooverJohn Friedery Ray Seabrook
Crown Cork & Seal Company (USA), Inc.John ConwayFrank MechuraAlan Rutherford
Metal Container CorporationJoseph SellingerTony Bhalla Allan Copestick
Rexam Beverage Can AmericasLars EmilsonWilliam BarkerBill Brandell
Silgan Containers CorporationJames BeamGary Hughes
Can Manufacturers InstituteRobert Budway