2002 annual results presentation a member of the li & fung (retailing) group 14 march 2003
TRANSCRIPT

2002 Annual Results Pres2002 Annual Results Presentationentation
A member of the Li & Fung (Retailing) GroupA member of the Li & Fung (Retailing) Group 14 March 200314 March 2003

2002 Hong Kong Overall Retail Sales 2002 Hong Kong Overall Retail Sales Year-on-Year % ChangeYear-on-Year % Change
-11.8%
7.2%
-3.7% -3.7%
-5.9%
-7.7%
-4.1% -4.4% -4.5%
-2.7% -2.8%-1.9%
-14%
-12%
-10%
-8%
-6%
-4%
-2%
0%
2%
4%
6%
8%
10%
Jan Feb Mar Apr May Jun Jul Aug Sep Oct Nov Dec
Total : $177 BillionTotal : $177 Billion - 4.1%- 4.1%
Source: HKSAR, Census and Statistics DepartmentSource: HKSAR, Census and Statistics Department

2002 Annual Results Presentation2002 Annual Results PresentationAgendaAgenda
2002 Financial Results Highlights2002 Financial Results Highlights
2003 Outlook & Update2003 Outlook & Update
Questions & AnswersQuestions & Answers

2002 Financial Results Highlights2002 Financial Results HighlightsGroup TurnoverGroup Turnover
972.9
1,140.71,305.1
1,393.5
0
400
800
1,200
1,600H
K$
Mill
ion
1999 2000 2001 2002
+ 7%+ 7%
No. of Stores in HK:No. of Stores in HK: 114 114 123 123 146 146 166 166
No. of Stores in China: -No. of Stores in China: - - - - - 2 2
HK Overall Retail Sales: - 8.1% + 3.8%HK Overall Retail Sales: - 8.1% + 3.8% - 1.2% - 4.1% - 1.2% - 4.1%

2002 Financial Results Highlights2002 Financial Results HighlightsGroup Net ProfitGroup Net Profit
6.6
48.1
65.572.1
0
20
40
60
80
HK
$ M
illio
n
1999 2000 2001 2002
+ 10%+ 10%
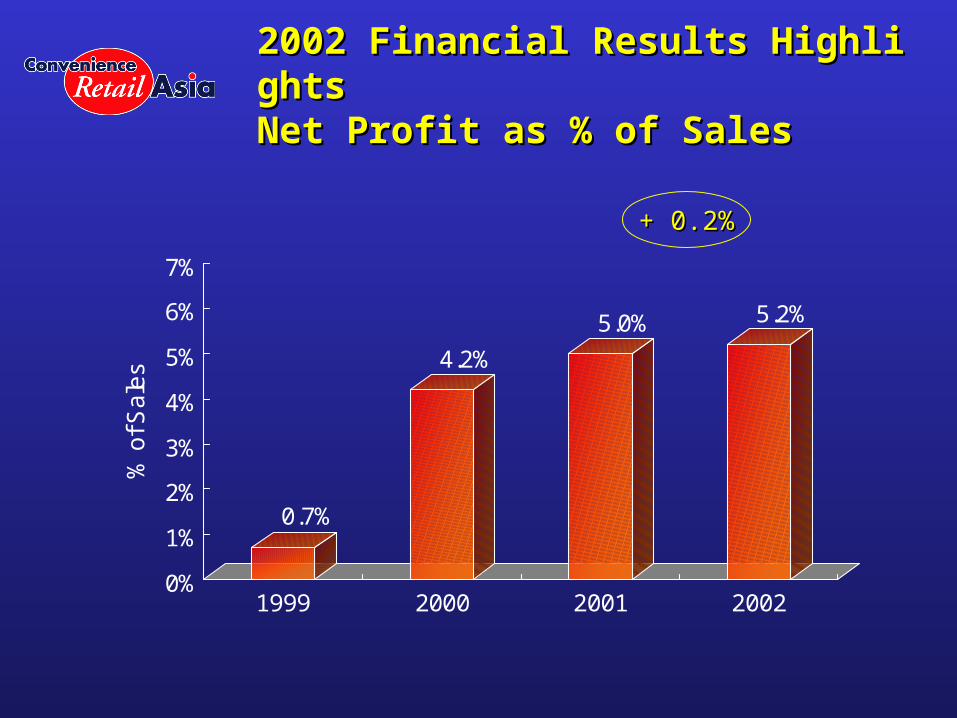
2002 Financial Results Highlights2002 Financial Results HighlightsNet Profit as % of SalesNet Profit as % of Sales
0.7%
4.2%
5.0% 5.2%
0%
1%
2%
3%
4%
5%
6%
7%
% o
f Sa
les
1999 2000 2001 2002
+ 0.2%+ 0.2%

2002 Financial Results Highlights2002 Financial Results HighlightsBasic Earnings Per ShareBasic Earnings Per Share
1.3
9.8 10.110.9
0
2
4
6
8
10
12
14
HK
Ce
nts
1999 2000 2001 2002
+ 8%+ 8%

2002 Financial Results Highlights2002 Financial Results Highlights
20022002 20012001
Number of StoresNumber of Stores 166166 146146 + 14%+ 14%
Group Turnover (HK$ Million)Group Turnover (HK$ Million) 1,393.51,393.5 1,305.11,305.1 + 7%+ 7%
Group Net Profit (HK$ Million)Group Net Profit (HK$ Million) 72.172.1 65.565.5 + 10%+ 10%
Net Profit as % of TurnoverNet Profit as % of Turnover 5.2%5.2% 5.0%5.0% + 0.2%+ 0.2%
Basic Earnings Per ShareBasic Earnings Per Share 10.9 Cents10.9 Cents 10.1 Cents10.1 Cents + 8%+ 8%

Why 2002 Favourable Results?Why 2002 Favourable Results?Total 2002 Sales Increased Yet ComparablTotal 2002 Sales Increased Yet Comparable Stores Sales Droppede Stores Sales Dropped
10.6%
5%5%
7%
-0.1%
-5%-6%
-5%
-10%
-5%
0%
5%
10%
15%
1st Qtr 2nd Qtr 3rd Qtr 4th Qtr
% C
ha
ng
e
Total Sales 121 Comparable Stores Sales
Total 2002: + 6.8%Total 2002: + 6.8%
Total 2002: - 4.3%Total 2002: - 4.3%

Why 2002 Favourable Results?Why 2002 Favourable Results?Improving Gross Margin/Other IncomeImproving Gross Margin/Other Income
30.4%31.0%
31.6%
32.8%
26%
28%
30%
32%
34%
1999 2000 2001 2002
+ 1.2%+ 1.2%
Gross Margin/Other Income as % of SalesGross Margin/Other Income as % of Sales

9.5%
7.6%
7.2%
8.6%
6.9%
6.4%
8.5%
6.9%
6.7%
8.9%
6.9%
6.9%
0%
5%
10%
15%
20%
25%
30%
1999 2000 2001 2002
Labour Cost Rental Cost Other Expenses
Why 2002 Favourable Results?Why 2002 Favourable Results?Tight Control of Store Operating ExpensesTight Control of Store Operating Expenses
Store Operating Expenses as % of SalesStore Operating Expenses as % of Sales
24.3%24.3%21.9%21.9% 22.1%22.1% 22.7%22.7%

44thth Quarter 2002 Financial Results Hig Quarter 2002 Financial Results Highlightshlights
20022002 20012001
Group Turnover (HK$ Million)Group Turnover (HK$ Million) 360.8360.8 326.3326.3 + 10.6%+ 10.6%
Comparable StoresComparable Stores 286.7286.7 287.0287.0 - 0.1%- 0.1%
Group Net Profit (HK$ Million)Group Net Profit (HK$ Million) 19.619.6 15.915.9 +23%+23%
Net Profit as % of TurnoverNet Profit as % of Turnover 5.4%5.4% 4.9%4.9% + 0.5%+ 0.5%

2002 Achievements2002 Achievements8 Consecutive Quarters of Profitability Growth8 Consecutive Quarters of Profitability Growth
Q1Q1
20012001
Q2Q2
20012001
Q3Q3
20012001
Q4Q4
20012001
Q1Q1
20022002
Q2Q2
20022002
Q3Q3
20022002
Q4Q4
20022002
+136%
+ 33% + 36%
+ 7% + 7% + 9%+ 3%
+ 23%

2002 Achievements2002 AchievementsConsumer Acceptance of China ModelConsumer Acceptance of China Model
44thth Generation: Generation:
Fresh & Hot Bakery and Gourmet Fresh & Hot Bakery and Gourmet
Hot DrinksHot Drinks
Hi-tech RetailerHi-tech Retailer
STF&F (Speed, Tidiness, STF&F (Speed, Tidiness,
Friendliness & Fun)Friendliness & Fun)
Genuine Products GuaranteeGenuine Products Guarantee
Best Cigarette & Magazine Best Cigarette & Magazine
CategoriesCategories
Grocery at Supermarket PricingGrocery at Supermarket Pricing

2002 Achievements2002 Achievements
Forbes Global Best 200 CompaniesForbes Global Best 200 Companies
(Under A Billion) (Under A Billion) for 2002for 2002
Winner of 2002 HKRMA Service & Courtesy AwardWinner of 2002 HKRMA Service & Courtesy Award
- - Supervisory Level of Supermarket / Convenience Supervisory Level of Supermarket / Convenience
Stores CategoryStores Category
$408M$408M Cash On HandCash On Hand

2003 Update & Outlook2003 Update & Outlook

2003 Update & Outlook2003 Update & OutlookCircle K Hong KongCircle K Hong Kong
High Unemployment, Deflation, Budget Deficit & Tax Increases High Unemployment, Deflation, Budget Deficit & Tax Increases
= Weaker Sentiment to Spend= Weaker Sentiment to Spend
Expect Retail Spending to Drop 3% - 5% in 2003Expect Retail Spending to Drop 3% - 5% in 2003
Our Strategies:Our Strategies:
Efficiency & Cost ControlEfficiency & Cost Control
New Product CategoriesNew Product Categories
Creative PromotionsCreative Promotions
Mass CustomizationMass Customization
Quality & Profitable New OutletsQuality & Profitable New Outlets

2003 Update & Outlook2003 Update & OutlookCircle K ChinaCircle K China
4 Stores Operating by End of March 4 Stores Operating by End of March
20032003
First Batch of 10 Stores by Mid YearFirst Batch of 10 Stores by Mid Year
Aggressive Growth after Fine Tuning Aggressive Growth after Fine Tuning
of Store Model & Supply Chainof Store Model & Supply Chain
30 Stores by End of Year with 30 Stores by End of Year with
Positive Store ContributionPositive Store Contribution

2003 Update & Outlook2003 Update & OutlookTo SummarizeTo Summarize
Solid Foundations in Hong Kong & ChinaSolid Foundations in Hong Kong & China
First 2 Quarters – Profitability Growth A First 2 Quarters – Profitability Growth A
ChallengeChallenge
Weak Hong Kong MarketWeak Hong Kong Market
Heaviest Start Up Cost in ChinaHeaviest Start Up Cost in China
Improving Results in 2Improving Results in 2ndnd Half Half