2000 annual water column monitoring report - mwra - … · · 2002-07-26high-frequency basis for...
TRANSCRIPT

2000 annual water column
monitoring report
Massachusetts Water Resources Authority
Environmental Quality Department Report ENQUAD 2001-17

Citation Libby PS, Hunt CD, McLeod LA, Geyer WR, Keller AA, Oviatt CA, Borkman D, Turner JT. 2001. 2000 Annual Water Column Monitoring Report. Boston: Massachusetts Water Resources Authority. Report ENQUAD 2001-17. 196 p.
2000 Annual Water Column Monitoring Report
Submitted to
Massachusetts Water Resources Authority Environmental Quality Department
100 First Avenue Charleston Navy Yard
Boston, MA 02129 (617) 242-6000
prepared by
Scott Libby1 Carlton Hunt1 Lynn McLeod1 Rocky Geyer2 Aimee Keller3
Candace Oviatt3 David Borkman4
Jeff Turner4
1Battelle 397 Washington Street Duxbury, MA 02332
2Woods Hole Oceanographic Institute
Woods Hole, MA 02543
3University of Rhode Island Narragansett, RI 02882
4University of Massachusetts Dartmouth
North Dartmouth, MA 02747
November 2001
Report No. 2001-17

2000 Annual Water Column Monitoring Report November 2001
i
EXECUTIVE SUMMARY
The Massachusetts Water Resources Authority (MWRA) has collected water quality data in Massachusetts and Cape Cod Bays for the Harbor and Outfall Monitoring (HOM) Program since 1992. This monitoring is in support of the HOM Program mission to assess the potential environmental effects of the relocation of effluent discharge from Boston Harbor to Massachusetts Bay. The data from 1992 through September 5, 2000 were collected to establish baseline water quality conditions and to provide the means to detect significant departure from the baseline after the outfall becomes operational. The surveys have been designed to evaluate water quality on both a high-frequency basis for a limited area in the vicinity of the outfall site (nearfield surveys) and a low-frequency basis over an extended area throughout Boston Harbor, Massachusetts Bay, and Cape Cod Bay (farfield). This annual report evaluates the 2000 water column monitoring results, assesses spatial and temporal trends in the data, and compares these results and trends for 2000 with previous baseline monitoring years (1992-1999). Because the outfall became operational on September 6, 2000, this report also compares fall 2000 data against seasonal water quality thresholds and examines responses in the nearfield to the transfer of effluent discharge from the Boston Harbor outfall to the bay outfall. Over the course of the HOM program, a general trend in water quality events has emerged from the data collected in Massachusetts and Cape Cod Bays. The trends are evident even though the timing and year-to-year manifestations of these events are variable. In general, but not always, a winter/spring phytoplankton bloom occurs as light becomes more available, temperature increases, and nutrients are readily available. Later in the spring, the water column transitions from well mixed to stratified conditions, which serves to cut off the supply of nutrients to the surface waters and terminate the spring bloom. The summer is generally a period of strong stratification, depleted nutrients, and a relatively stable mixed-assemblage phytoplankton community. In the fall, stratification deteriorates and supplies nutrients to surface waters often developing into a fall phytoplankton bloom. The lowest dissolved oxygen concentrations are observed prior to the fall overturn of the water column – usually in October. By late fall or early winter, the water column becomes well mixed and resets to winter conditions. In 2000, substantial blooms occurred during both the spring and fall. These blooms and the conditions that contributed to their occurrence and duration are the major natural events of 2000. The physical processes operating in the bay in 2000 closely followed climatology and none of the forcing parameters (e.g. wind patterns) or physical variables (e.g., salinity, temperature) showed extreme behavior. In the fall, evidence of vigorous mixing was not evident, although there was a fairly rapid reduction in stratification and strong downwelling in the fall. Thus, mixing did not appear to influence the major chlorophyll bloom observed in this period. Nearfield monitoring data indicated that an influx of nutrient rich, more saline, dense waters was introduced into Massachusetts Bay in late August and September. However, there were no clear signs of an anomalous advection or other physical forcing factors that might indicate a physically stimulated plankton bloom. The 2000 seasonal trends in nutrient, chlorophyll and dissolved oxygen concentrations were typical for the nearfield area in comparison to previous baseline monitoring years. The values observed for several of these parameters in 2000, however, reached the maximum values observed in the baseline period. In general, nutrient concentrations across Massachusetts Bay from 1992 to 2000 increased particularly since 1998. In Boston Harbor, NH4 concentrations in 2000 had increased by ~7 µM over the baseline period. The increase appears to be related to the increased discharge of NH4 from the Deer Island Facility. Ammonium concentrations also show an increase, but to a lesser degree in the coastal, nearfield, and offshore waters.

2000 Annual Water Column Monitoring Report November 2001
ii
The increased nutrient concentrations are coincident with an observed increase in chlorophyll and particulate organic carbon levels between 1997 to 2000. Nearfield chlorophyll concentrations in 2000 were unprecedented and exceeded 1992-1999 seasonal and annual mean values. Annual mean chlorophyll levels in other areas of the bay in 2000 also reached the highest values observed during the baseline period. The increase continued a substantial increase in annual mean chlorophyll observed since 1997. The factors controlling this increase in annual mean chlorophyll concentrations are likely related to the regional and local factors that affect nutrient concentrations. Primary production and plankton abundance in 2000 generally followed trends observed throughout the bays during previous monitoring years, even though substantial phytoplankton blooms occurred during both the spring and fall. A system-wide bloom of Phaeocystis pouchetii reached levels approaching 12.3 million cells per liter in winter/spring 2000. This species has been observed to bloom in the winter/spring in two-to three-year cycles with blooms recorded during the baseline monitoring program in 1992, 1994, 1997, and 2000. Observations of concurrent Phaeocystis blooms in 1994 in Buzzards Bay and “upstream “ from Massachusetts Bay in the Gulf of Maine in 2000 reveal that such Phaeocystis blooms are regional events. The long-standing nature of such blooms is attested to by Bigelow’s observation of them in April in Massachusetts Bay and off Cape Cod in the early 1900s. The major Phaeocystis bloom observed in spring and the unprecedented chlorophyll concentrations during the winter/spring and summer of 2000 imply that there was a substantial amount of organic material produced in the nearfield. The resulting flux of organic material into the bottom waters from these events could have affected the bottom water dissolved oxygen and led to low DO concentrations during the fall of 2000. However, in contrast to 1999, the nearfield and Stellwagen Basin bottom water DO minima for 2000 were in the middle of the observed range of baseline values. One mitigating factor could be the influx of nutrient rich, saline waters in late August and September due to physical mixing or horizontal transport which may have been a source of nutrients for the fall bloom. The 2000 fall bloom had started in Massachusetts Bay by early September, prior to the transfer of MWRA effluent to the bay outfall, and continued through late October. Chlorophyll concentrations, although showing a steady increase in September, did not reach maximum levels until late October. The peak survey mean chlorophyll concentration in late October was higher than any observed over the baseline period. These high concentrations combined with the extended duration of the bloom resulted in a fall mean chlorophyll concentration of 5.69 µgL-1. The fall 2000 mean was higher than all baseline values and continued the trend of elevated fall chlorophyll concentrations started in 1999. There was a coincident, though not commensurate, increase in POC concentrations during these fall blooms. The 1999 and 2000 fall blooms exhibited the highest fall mean POC concentrations in the nearfield for 1992 to 2000. Productivity was highest at station N18 during the September surveys and in late October further offshore at station N04. Nearfield production in fall 2000 was comparable to the highest baseline rates, which were measured during the fall 1997 bloom (~2,500 and 5,000 mgCm-2d-1 at stations N04 and N18, respectively). As in 1999, phytoplankton abundance, primary production, and chlorophyll did not parallel each other closely during the fall bloom in 2000. Nearfield phytoplankton abundance peaked in early September and gradually declined through October. Both 1999 and 2000 had relatively low phytoplankton abundance in comparison to previous fall blooms in 1993, 1995, and 1997. The regional fall bloom in 2000 consisted of chain-forming diatoms and may be related to another apparently regional event in 2000 – an anomalously high abundance of ctenophores. The ctenophore Mnemiopsis leidyi was abundant in Boston Harbor, coastal, and western nearfield waters during in September and October. The fall 2000 ctenophore “bloom” was unprecedented for the baseline

2000 Annual Water Column Monitoring Report November 2001
iii
period and caused severe decimation of abundances of copepods. Such overpredation of zooplankton grazers could have contributed to increases in large chain-forming diatoms observed in 20µm screened sample. Unusually high abundances of ctenophores were also observed in October 2000 in Buzzards Bay suggesting that the ctenophore bloom in Boston Harbor was part of another regional event.
September 6, 2000 marked the end of the baseline period. This event allowed MWRA to calculate the final threshold values by which unacceptable changes to the ecosystem will be evaluated. Those parameters include background levels for dissolved oxygen concentrations and percent saturation in bottom waters of the nearfield and Stellwagen Basin, annual and seasonal chlorophyll levels in the nearfield, and nuisance algae (Alexandrium, Phaeocystis, and Pseudo-nitzschia). The fall of 2000 was the first fall seasonal time period that could be compared against these thresholds. The comparison showed that the caution level for bottom water dissolved oxygen percent saturation (80%) was exceeded in both the nearfield and Stellwagen Basin, an observation which is tempered by the fact that dissolved oxygen saturation had fallen below 80% saturation 6 of the preceeding 8 years. The fall mean areal chlorophyll caution threshold (161 mg m-2) was also exceeded. None of the nuisance algae thresholds were exceeded for fall 2000. The chlorophyll exceedance in the fall of 2000 was evaluated and the response found to be part of the fall chlorophyll bloom observed in satellite imagery throughout the western Gulf of Maine. Thus, the cause of the high chlorophyll could not be attributed to the transfer of effluent from the mouth of Boston Harbor to the new outfall in Massachusetts Bay.

2000 Annual Water Column Monitoring Report November 2001
iv
TABLE OF CONTENTS 1.0 INTRODUCTION.........................................................................................................................1-1 2.0 2000 WATER COLUMN MONITORING PROGRAM..............................................................2-1
2.1 Data Sources........................................................................................................................2-1 2.2 2000 Water Column Monitoring Program Overview..........................................................2-1 2.3 Data Revisions.....................................................................................................................2-3
3.0 PHYSICAL CHARACTERIZATION..........................................................................................3-1 3.1 Forcing Variables ................................................................................................................3-1
3.1.1 River Discharge......................................................................................................3-1 3.1.2 Winds.......................................................................................................................3-1
3.2 Air Temperature ..................................................................................................................3-3 3.3 Water Temperature..............................................................................................................3-4
3.3.1 Nearfield description ..............................................................................................3-4 3.3.2 Spatial Temperature Structure................................................................................3-4
3.4 Salinity.................................................................................................................................3-4 3.4.1 Nearfield Description .............................................................................................3-4 3.4.2 Spatial Salinity Structure........................................................................................3-4
3.5 Stratification ........................................................................................................................3-4 3.5.1 Nearfield Description .............................................................................................3-4 3.5.2 Spatial Variations in Stratification .........................................................................3-5
3.6 Temperature and Salinity Impact on Dissolved Oxygen.....................................................3-5 3.7 Summary .............................................................................................................................3-5
4.0 WATER QUALITY......................................................................................................................4-1 4.1 Nutrients ..............................................................................................................................4-1
4.1.1 Nearfield Trends.....................................................................................................4-1 4.1.2 Farfield Comparisons .............................................................................................4-4 4.1.3 Interannual Comparisons........................................................................................4-6
4.2 Chlorophyll..........................................................................................................................4-8 4.2.1 Nearfield Trends.....................................................................................................4-8 4.2.2 Farfield Comparisons ...........................................................................................4-11 4.2.3 Interannual Comparisons......................................................................................4-11
4.3 Dissolved Oxygen .............................................................................................................4-14 4.3.1 Nearfield Trends...................................................................................................4-14 4.3.2 Farfield Comparisons ...........................................................................................4-15 4.3.3 Interannual Comparisons......................................................................................4-16
4.4 Summary of 2000 Water Quality Events...........................................................................4-17 5.0 PRODUCTIVITY AND RESPIRATION.....................................................................................5-1
5.1 Productivity .........................................................................................................................5-1 5.1.1 Nearfield Production ..............................................................................................5-1 5.1.2 Harbor Production ..................................................................................................5-3 5.1.3 Chlorophyll-Specific Production............................................................................5-4 5.1.4 Potential Production ...............................................................................................5-5 5.1.5 P-I Curve Parameters..............................................................................................5-6 5.1.6 Comparison with Prior Years .................................................................................5-7 5.1.7 Modeling of Phytoplankton Production .................................................................5-8 5.1.8 Production Summary..............................................................................................5-9
5.2 Respiration.........................................................................................................................5-10 5.2.1 Water Column Respiration...................................................................................5-10

2000 Annual Water Column Monitoring Report November 2001
v
5.2.2 Carbon-Specific Respiration ................................................................................5-11 5.2.3 1992-2000 Interannual Comparison .....................................................................5-13 5.2.4 Respiration Summary ...........................................................................................5-14
6.0 PLANKTON .................................................................................................................................6-1 6.1 Phytoplankton......................................................................................................................6-2
6.1.1 Seasonal Trends in Total Phytoplankton Abundance.............................................6-2 6.1.2 Nearfield Phytoplankton Community Structure .....................................................6-4 6.1.3 Farfield Phytoplankton Assemblages .....................................................................6-5 6.1.4 Nuisance Algae.......................................................................................................6-6 6.1.5 Phytoplankton Interannual Comparisons ...............................................................6-7
6.2 Summary of 2000 Phytoplankton Results ...........................................................................6-8 6.3 Zooplankton.........................................................................................................................6-8
6.3.1 Seasonal Trends in Total Zooplankton Abundance................................................6-8 6.3.2 Nearfield Zooplankton Community Structure........................................................6-9 6.3.3 Farfield Zooplankton Assemblages......................................................................6-10 6.3.4 Zooplankton Interannual Comparisons ................................................................6-11 6.3.5 Summary of 2000 Zooplankton Results ...............................................................6-11
6.4 Discussion of Plankton Results .........................................................................................6-11 7.0 SUMMARY OVERVIEW OF 2000.............................................................................................7-1
7.1 Summary of 2000 Conditions..............................................................................................7-1 7.1.1 Phaeocystis Bloom .................................................................................................7-2 7.1.2 Fall 2000 Bloom.....................................................................................................7-3
7.2 Contingency plan thresholds ...............................................................................................7-6 8.0 REFERENCES..............................................................................................................................8-1
FIGURES
Figure 2-1. Locations of nearfield stations, MWRA offshore outfall, and USGS mooring.................. 2-8 Figure 2-2. Locations of farfield stations and regional station groupings............................................. 2-9 Figure 3-1. Charles River (at Waltham) and Merrimack River (at Lowell) discharge
for the year 2000, compared to the 10-year average. ......................................................... 3-6 Figure 3-2. Charles River (at Waltham) and Merrimack River (at Lowell) discharge,
1990–2000 (5 day running mean)...................................................................................... 3-7 Figure 3-3. Wind-stress roses for Winter (Jan.-Mar.), Spring (Apr.-Jun.), Summer (Jul.-Sep.)
and Fall (Sep.-Dec)............................................................................................................. 3-8 Figure 3-4. Monthly average N-S wind stress at Boston Buoy for 2000 compared with
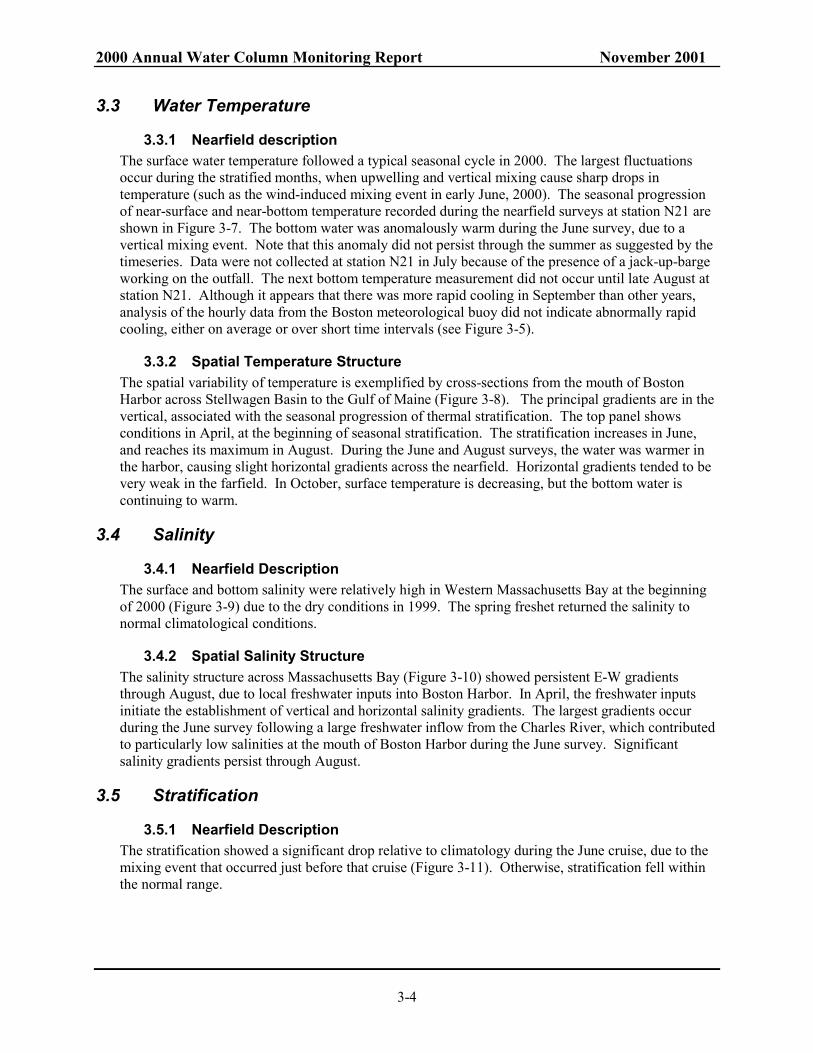
10-year average. ............................................................................................................... 3-9 Figure 3-5. Hourly surface water temperature in 2000 (Black) measured at the Boston
Meteorological Buoy compared to data from the last 10 years. ....................................... 3-10 Figure 3-6. Hourly air temperature at the Boston Buoy (Black) superimposed on the data
from the previous 10 years (green)................................................................................... 3-11 Figure 3-7. Near-surface and near-bottom temperature observed during nearfield cruises. ............. 3-12 Figure 3-8. Temperature cross-sections from Boston Harbor to the Gulf of Maine, through
the outfall zone. ................................................................................................................ 3-13 Figure 3-9. Near-surface and near-bottom salinity observed during nearfield cruises ....................... 3-14 Figure 3-10. Salinity cross-sections from Boston Harbor to the Gulf of Maine,
through the outfall zone.................................................................................................... 3-15

2000 Annual Water Column Monitoring Report November 2001
vi
Figure 3-11. Density difference between surface and bottom at Nearfield Station N21 during 2000 (black) and years 1992-1999 (green). .......................................................... 3-16
Figure 3-12. Density variations across Massachusetts Bay during four surveys in 2000. .................... 3-17 Figure 3-13. Dissolved oxygen (in mg/l) across Massachusetts Bay during four surveys in 2000....... 3-18 Figure 3-14. Autumn near-bottom salinity vs. dissolved oxygen at N-21 (left panel) and
near-bottom temperature vs. DO (right panel). ............................................................. 3-19 Figure 3-15. Comparison of observed and model results for near-bottom dissolved oxygen. ............ 3-20 Figure 4-1. 2000 nearfield nutrient cycles for (a) NO3 and (b) SiO4. ................................................ 4-19 Figure 4-2. 2000 nearfield nutrient cycles for (a) PO4 and (b) NH4. ................................................. 4-20 Figure 4-3. Nearfield depth vs. time contour plots of sigma-T, salinity, and NO3 at station N18. ..... 4-21 Figure 4-4. Time series of surface and bottom water NH4 concentrations for five
representative nearfield stations. .................................................................................... 4-22 Figure 4-5. Effluent flow and NH4 loading from MWRA Deer Island Treatment Plant
for the fall of 2000............................................................................................................ 4-23 Figure 4-6. NH4 distribution in the nearfield by depth for (a) September 1 and
(b) September 22, 2000. Plots displayed from surface to bottom ................................... 4-24 Figure 4-7. NH4 distribution in the nearfield by depth for (a) October 12 and
(b) October 22, 2000. Plots displayed from surface to bottom......................................... 4-25 Figure 4-8. NH4 distribution in the nearfield by depth for (a) November 29 and
(b) December 21, 2000. Plots displayed from surface to bottom. ................................... 4-26 Figure 4-9. Time-series of survey mean (a) NO3 and (b) SiO4 concentration in
Massachusetts and Cape Cod Bays. ................................................................................. 4-27 Figure 4-10. Time-series of survey mean (a) PO4 and (b) NH4 concentration in
Massachusetts and Cape Cod Bays. ................................................................................. 4-28 Figure 4-11. Surface contour of DIN for farfield survey in February and April 2000.......................... 4-29 Figure 4-12. Surface contour of DIN for farfield survey in August and October 2000. ....................... 4-30 Figure 4-13. NH4 concentrations along Boston-Nearfield transect in August and October 2000......... 4-31 Figure 4-14. Salinity along Boston-Nearfield transect in August and October 2000............................ 4-32 Figure 4-15. Nutrient concentrations along Boston-Nearfield transect in August 2000. ...................... 4-33 Figure 4-16. Nutrient concentrations along Boston-Nearfield transect in October 2000...................... 4-34 Figure 4-17. Interannual NO3 cycle in the nearfield. .......................................................................... 4-35 Figure 4-18. Interannual NO3 cycle in Massachusetts and Cape Cod Bays. ....................................... 4-36 Figure 4-19. Interannual NH4 cycle in Massachusetts and Cape Cod Bays. ....................................... 4-37 Figure 4-20. Model predicted effluent concentrations in surface (1 m) waters with harbor and
bay outfalls under summer and winter physical conditions (Signell et al., 1996)............ 4-38 Figure 4-21. Model predicted effluent concentrations at mid-depth (14 m) waters with harbor
and bay outfalls under summer (below pycnocline) and winter physical conditions (Signell et al., 1996). ..................................................................................... 4-39
Figure 4-22 Surface contour of NH4 for farfield survey in October 1999 and October 2000.............. 4-40 Figure 4-23. Mid-depth contour of NH4 for farfield survey in October 1999 and October 2000. ........ 4-41 Figure 4-24. 2000 nearfield chlorophyll cycle. ................................................................................... 4-42 Figure 4-25. Time series of surface and mid-depth water chlorophyll concentrations for five
representative nearfield stations. ...................................................................................... 4-43 Figure 4-26. Contour of (a) surface and (b) mid-depth chlorophyll for nearfield survey
WN00C (early September 2000). ................................................................................... 4-44 Figure 4-27. Contour of (a) surface and (b) mid-depth chlorophyll for nearfield survey
WN00D (late September 2000). . .................................................................................... 4-45 Figure 4-28. Nearfield depth vs. time contour plots of in situ fluorescence profile data at
stations N10, N21, N18 and N07 for the fall of 2000. ..................................................... 4-46 Figure 4-29. Monthly composite of SeaWiFS chlorophyll images for the southwestern Gulf of
Maine for September and October 2000 [J. Yoder (URI) and J. O’Reilly (NOAA)]. ..... 4-47

2000 Annual Water Column Monitoring Report November 2001
vii
Figure 4-30. Time-series of mean chlorophyll concentrations in Massachusetts and Cape Cod Bays. . ...................................................................................................................... 4-48
Figure 4-31. Surface contour of chlorophyll concentrations for farfield survey in October 2000........ 4-49 Figure 4-32. Annual nearfield chlorophyll cycle for each year of baseline monitoring
1992 to 2000. Mean of data from all depths at all nearfield stations............................... 4-50 Figure 4-33. Annual mean chlorophyll in Massachusetts and Cape Cod Bays. 4-51 Figure 4-34. Monthly composite of SeaWiFS chlorophyll images for the southwestern
Gulf of Maine for September and October in 1997 to 2000............................................. 4-52 Figure 4-35. 2000 nearfield DO cycle (a) DO concentration and (b) DO %saturation......................... 4-53 Figure 4-36. Time-series of average bottom dissolved oxygen concentration for 2000 ....................... 4-54 Figure 4-37. Bottom water dissolved oxygen contour plot for farfield survey in October 2000. ......... 4-55 Figure 4-38. Interannual dissolved oxygen concentration cycle in (a) nearfield and
(b) Stellwagen Basin. ...................................................................................................... 4-56 Figure 4-39. Interannual dissolved oxygen % saturation cycle in (a) nearfield and
(b) Stellwagen Basin. ...................................................................................................... 4-57 Figure 5-1. Areal production (mgCm-2d-1) for stations F23, N04, and N18 over the
2000 annual cycle. . ......................................................................................................... 5-15 Figure 5-2. Time series of contoured daily production (mgCm-3d-1) over depth (m) at
station N04. ...................................................................................................................... 5-16 Figure 5-3. Time series of contoured daily production (mgCm-3d-1) over depth (m) at
station N18. ...................................................................................................................... 5-17 Figure 5-4. Chlorophyll a distribution for the 2000 season represented as averaged over
depth and integrated over depth at stations F23, N04, and N18....................................... 5-18 Figure 5-5. Time series of contoured chlorophyll a (µg l-1) over depth (m) at station N04................ 5-19 Figure 5-6. Time series of contoured chlorophyll a (µg l-1) over depth (m) at station N18................ 5-20 Figure 5-7. Time series of contoured daily production (mgCm-3d-1) over depth (m) at
station F23. ....................................................................................................................... 5-21 Figure 5-8. Time series of contoured chlorophyll a (µg l-1) over depth (m) at station F23. ............... 5-22 Figure 5-9. Time series of areal production (mgCm-2d-1) and depth-averaged chlorophyll-specific
production (mgCmgChla-1d-1) for stations N04, N18 and F23 over the annual cycle. ..... 5-23 Figure 5-10. Time series of contoured chlorophyll-specific production (mgCmgChla-1d-1)
over depth (m) at station N04. .......................................................................................... 5-24 Figure 5-11. Time series of contoured chlorophyll-specific production (mgCmgChla-1d-1) o
ver depth (m) at station N18. ............................................................................................ 5-25 Figure 5-12. Time series of contoured chlorophyll-specific production (mgCmgChla-1d-1)
over depth (m) at station F23............................................................................................ 5-26 Figure 5-13. Photoperiod light field over the course of the day during the first six surveys ................ 5-27 Figure 5-14. Potential production (mgCm-3d-1) calculated using incident light from a cloudless day.. 5-28 Figure 5-15. Measured and potential areal production (mgCm-2d-1) for the 2000 season at
stations F23, N04, and N18. ............................................................................................. 5-29 Figure 5-16. Alpha, α, [mgCm-3hr-1(µE m-2 s-1)] in 2000 at stations F23, N04, and N18 at
5 depths............................................................................................................................. 5-30 Figure 5-17. Chlorophyll-specific alpha, αB, mgC(mgchla)-1 hr-1 in 2000 at stations F23, N04,
and N18 at 5 depths. ......................................................................................................... 5-31 Figure 5-18. Pmax (mgC m-3 hr-1) in 2000 at stations F23, N04, and N18 at 5 depths. .......................... 5-32 Figure 5-19. PB
max(mgCmgChla-1hr-1 ) in 2000 at stations F23, N04, and N18 at 5 depths. ................. 5-33 Figure 5-20. Relationship between the fitted values of the parameters of the P-I curves 5-34 Figure 5-21. Frequency distributions for chlorophyll-specific alpha for stations F23, N04, N18
and the pooled data during 2000....................................................................................... 5-35
2000 Annual Water Column Monitoring Report November 2001
viii
Figure 5-22. Frequency distributions for chlorophyll-specific PBmax for stations F23, N04, N18
and the pooled data during 2000....................................................................................... 5-36 Figure 5-23. Areal production (mgCm-2d-1) for stations F23, N04 and N16/N18 from 1995
to 2000.............................................................................................................................. 5-37 Figure 5-24. Production (mgCm-2d-1) at nearfield stations N04 and N16/N18 from 1995 to 2000 ...... 5-38 Figure 5-25. Annual production (g C m-2yr-1) for stations F23, N04, and N16/N18 from
1995–2000. ....................................................................................................................... 5-39 Figure 5-26. Relationships between areal production (mg C m-2 d-1) and the composite
function BZpI0 (see text) for stations F23, N04 and N18 in 2000..................................... 5-40 Figure 5-27. Relationships between areal production (mg C m-2 d-1) and phytoplankton
biomass (mg Chl a m-3) for stations F23, N04 and N18 in 2000...................................... 5-41 Figure 5-28. Relationship between the fitted values of Pmax and phytoplankton biomass
(mg Chl a m-3) using the seasonal data for 2000. ............................................................. 5-42 Figure 5-29. Relationship between the fitted values of α and phytoplankton biomass
(mg Chl a m-3) using the seasonal data for 2000. ............................................................. 5-43 Figure 5-30. Time-series of respiration (µM O2 hr-1) at stations N18 and N04. ................................... 5-44 Figure 5-31. Time-series of respiration (µM O2 hr-1) at stations F23 and F19...................................... 5-45 Figure 5-32. Time-series of POC (µM) at stations N18, N04 and F23................................................. 5-46 Figure 5-33. Time-series of carbon-specific respiration (µM O2 µM C-1 hr-1) at stations N18,
N04 and F23. .................................................................................................................... 5-47 Figure 5-34. Time-series of bottom water respiration (µM O2 hr-1) at stations N04, N16/N18,
F23, and F19 for 1995-2000............................................................................................. 5-48 Figure 5-35. Time-series of bottom water POC (µM) at stations N04, N16/N18, F23 and F19
for 1995 to 2000. .............................................................................................................. 5-49 Figure 6-1. Total phytoplankton abundance for nearfield whole-water samples. ............................... 6-13 Figure 6-2. Total phytoplankton abundance for farfield whole-water samples. ................................. 6-13 Figure 6-3. Total phytoplankton abundance for nearfield 20-µm screened samples .......................... 6-14 Figure 6-4. Total phytoplankton abundance for farfield 20-µm screened samples............................. 6-14 Figure 6-5. Average phytoplankton abundance by major taxonomic group ....................................... 6-15 Figure 6-6. Average phytoplankton abundance by major taxonomic group, (a) Boston
Harbor and (b) coastal area. ............................................................................................ 6-16 Figure 6-7. Average phytoplankton abundance by major taxonomic group ....................................... 6-17 Figure 6-8. Phaeocystis pouchetii abundance in the nearfield for 1992-2000 .................................... 6-18 Figure 6-9. Alexandrium spp. abundance in the nearfield for 1992-2000........................................... 6-19 Figure 6-10. Pseudo-nitzschia abundance in the nearfield for 1992-2000............................................ 6-20 Figure 6-11. Total phytoplankton abundance for whole-water samples at selected areas
for 1992-2000. .................................................................................................................. 6-21 Figure 6-12. Total microflagellate abundance for whole-water samples at selected areas
for 1992-2000. .................................................................................................................. 6-22 Figure 6-13. Zooplankton abundance for nearfield............................................................................... 6-23 Figure 6-14. Zooplankton abundance for farfield ................................................................................. 6-23 Figure 6-15. Nearfield zooplankton abundance by major taxonomic group at stations N18,
N16 and N04. ................................................................................................................... 6-24 Figure 6-16. Total zooplankton abundance at selected areas for 1992-2000. ....................................... 6-25 Figure 6-17. Copepod Nauplii abundance at selected areas for 1992-2000.......................................... 6-26 Figure 6-18. Oithona similis adult and copepodite abundance at selected areas for 1992-2000. ......... 6-27 Figure 6-19. Acartia spp. adults and copepodites abundance at selected areas for 1992-2000. ........... 6-28 Figure 6-20. Total Diatom abundance for whole-water samples at selected areas for 1992-2000 ....... 6-29 Figure 6-21. Meroplankton abundance at selected areas for 1992-2000............................................... 6-30 Figure 7-1. Annual mean DIN and ammonium in Massachusetts and Cape Cod Bays. ....................... 7-9

2000 Annual Water Column Monitoring Report November 2001
ix
Figure 7-2. Mean DIN, ammonium, chlorophyll, and POC concentrations in the nearfield during the fall period. ........................................................................................................................ 7-10
Figure 7-3. Nearfield survey mean values for production (gCm-2d-1), chlorophyll (µgL-1), total phytoplankton (106 cellsL-1) and total diatoms (106 cellsL-1) ........................................... 7-11
Figure 7-4. Nearfield survey mean values for production (gCm-2d-1), chlorophyll (µgL-1), total phytoplankton (106 cellsL-1) and total diatoms (106 cellsL-1) ........................................... 7-12
TABLES
Table 1-1. Major Upgrades to the MWRA Treatment System. ............................................................. 1-1 Table 2-1. Water quality surveys for 2000 (WF001-WN00H).............................................................. 2-2 Table 2-2. Station types, applicable analyses, and number of depths sampled. .................................... 2-3 Table 2-3. Distribution of stations by station types. .............................................................................. 2-3 Table 2-4. Summary of corrections applied to HOM3 chlorophyll data. .............................................. 2-7 Table 3-1. River discharge summary for the Charles and Merrimack Rivers 1990-2000. .................... 3-1 Table 3-2. Southerly (upwelling) Wind Stress, 1990-2000. Calculated seasonally averaged
stress in Pa*103 at the Boston Buoy (Large and Pond, 1981). ............................................. 3-2 Table 3-3. Wind Speed, 1990-2000. Seasonally averaged speed in m/s at the Boston
Buoy (USGS). ...................................................................................................................... 3-2 Table 3-4. Significant Wind Events, Fall 1999 and Fall 2000............................................................... 3-3 Table 3-5. Winter Air Temperature, 1992-2000. Average temperature in °C at the Boston Buoy. ... 3-3 Table 4-1. Seasonal Chlorophyll Concentrations in the Nearfield (µg L-1) ......................................... 4-12 Table 4-2. Seasonal Mean Areal Chlorophyll Concentrations in the Nearfield (mg m-2) ................... 4-13 Table 5-1. Slope of Equation P = mBZpI0 + b from 1994 through 2000. .............................................. 5-9 Table 6-1. Nearfield and farfield averages and ranges of abundance (106 cells L-1) of
whole-water phytoplankton.................................................................................................. 6-3 Table 6-2. Nearfield and farfield average and ranges of abundance (cells L-1) for >20 µm-screened
dinoflagellates ...................................................................................................................... 6-3 Table 6-3. Nearfield and farfield average and ranges of abundance (103 animals m-3) for
zooplankton .......................................................................................................................... 6-9 Table 7-1. Seasonal mean of nearfield phytoplankton C/Chla (data from surface and
mid-depth samples only; 1995 to 1997 data not included)................................................... 7-5 Table 7-2. Contingency plan threshold values for water column monitoring........................................ 7-7

2000 Annual Water Column Monitoring Report November 2001
1-1
1.0 INTRODUCTION The Massachusetts Water Resources Authority (MWRA) has implemented a long-term Harbor and Outfall Monitoring (HOM) Program for Massachusetts and Cape Cod Bays. The objective of the HOM Program is to (1) verify compliance with NPDES permit requirements; (2) evaluate whether the impact of the discharge on the environment is within the bounds projected by the SEIS; and (3) determine whether change within the system exceeds the Contingency Plan thresholds. To help establish the present water quality conditions, Battelle was contracted by MWRA to conduct baseline and post-discharge water quality surveys in Massachusetts and Cape Cod Bays in 2000. The surveys conducted between February and September 5th of 2000 represent the ninth consecutive year of MWRA baseline monitoring while surveys conducted between September 6th and December of 2000 represent the beginning of post-discharge monitoring. A time line of major upgrades to the MWRA treatment system is provided for reference in Table 1-1.
Table 1-1. Major Upgrades to the MWRA Treatment System.
Date Upgrade December 1991 Sludge discharges ended January 1995 New primary plant on-line December 1995 Disinfection facilities completed August, 1997 Battery A brought on-line: secondary treatment begins
on approximately 40% of the Deer Island effluent1 March, 1998 Battery B brought on-line: secondary treatment begins
on approximately 80% of the Deer Island effluent1 July 9, 1998 Nut Island discharges ceased: south system flows
transferred to Deer Island September 6, 2000 New outfall diffuser system on-line
1- Actual percentage varies depending on the amount of input to Deer Island.
The 2000 water column monitoring data have been reported in a series of survey reports, data reports, and semi-annual interpretive reports (Libby et al. 2000a and 2001). The purpose of this report is to present a compilation of the 2000 results in the context of the seasonal trends and the annual cycle of ecological events in Massachusetts and Cape Cod Bays. The data have been evaluated based on a variety of spatial and temporal scales that are relevant to understanding environmental variability in the bays. In situ vertical profiles and discrete water samples provide the data with which to examine spatial variability whether it is vertically over the water column, locally within a particular region (i.e. nearfield or harbor) or regionally throughout the Bays. The temporal variability of each of the parameters provides information on the gross seasonal trends on a regional scale and allows for a more thorough characterization of trends in the nearfield area. The 2000 baseline data have also been compared to previous baseline monitoring data to evaluate interannual variability and to characterize trends while the 2000 post-discharge data have been compared to the baseline monitoring data.
The water column data presented in this report include physical characteristics – temperature, salinity, and density (Section 3), water quality parameters – nutrients, chlorophyll, and dissolved oxygen (Section 4), production and respiration (Section 5), and phytoplankton and zooplankton (Section 6). In each of these sections, a preliminary attempt has been made to integrate across disciplines when interpreting the data. The final section of this report completes this integration and summarizes the major themes from the 2000 water column data including responses that occurred once the outfall was placed on-line

2000 Annual Water Column Monitoring Report November 2001
2-1
2.0 2000 WATER COLUMN MONITORING PROGRAM This section provides a summary of the 2000 HOM Program. The sources of information and data discussed in this report are identified and a general overview of the monitoring program is provided.
2.1 Data Sources A detailed presentation of field sampling equipment and procedures, sample handling and custody, sample processing and laboratory analysis, and instrument performance specifications and data quality objectives are discussed in the Combined Work/Quality Assurance Project Plan (CW/QAPP) for Water Quality Monitoring: 1998-2000 (Albro et al., 1998). Details on any deviations from the methods outlined in the CW/QAPP have been provided in individual survey reports and the semiannual reports. For each water column survey, the survey objectives, station locations and tracklines, instrumentation and vessel information, sampling methodologies, and staffing were documented in a survey plan. Following each survey, the activities that were accomplished, the actual sequence of events and tracklines, the number and types of samples collected, a preliminary summary of in situ, phytoplankton, and whale watch data, and any deviations from the plan were reported in a survey report.
Results for 2000 water column surveys have been presented in nutrient (including calibration information, sensor and water chemistry data), plankton (phytoplankton and zooplankton), and productivity/respiration data reports. These data reports were submitted to the MWRA five times per year. The 2000 results have also been presented in semi-annual water column reports that provide full descriptions of physical, chemical, and biological conditions in the Bays over the course of the year (Libby et al. 2000a and 2001). The semi-annual reports also provide an initial interpretation of the results on various spatial and temporal scales. The data that have been submitted in the data reports, presented in the semi-annual reports, and are discussed in this report are available in the MWRA HOM Program Database.
2.2 2000 Water Column Monitoring Program Overview This annual report summarizes and evaluates water column monitoring results from the 17 surveys that were conducted in 2000 (Table 2-1). The surveys have been designed to evaluate water quality on both a high-frequency basis for a limited area (nearfield surveys) and a low-frequency basis for an extended area (farfield). A total of 48 stations are distributed throughout Boston Harbor, Massachusetts Bay, and Cape Cod Bay in a strategic pattern that is intended to provide a comprehensive characterization of the area (Figures 2-1 and 2-2). The nearfield stations, located in Massachusetts Bay in the vicinity of the outfall site, were sampled during each of the 17 surveys. The farfield stations, located throughout Boston Harbor, Massachusetts Bay, and Cape Cod Bay, were sampled during the 6 combined farfield/nearfield surveys.
The 21 nearfield stations are located in a grid pattern covering an area of approximately 100 km2 centered on the MWRA outfall site (Figure 2-1). The 28 farfield stations are located throughout Boston Harbor, Massachusetts Bay, and Cape Cod Bay (Figure 2-2). This includes stations F32 and F33 that were added to the monitoring program in 1998 to better characterize zooplankton variability in Cape Cod Bay. Stations F32 and F33 are sampled during the winter/spring farfield surveys that are conducted in February through April. Station N16 is sampled twice during the combined surveys as both a farfield and a nearfield station. For the 2000 monitoring, a decision was made to collect more data at stations ‘upstream’ of the nearfield area (stations F22 and F26). Additional nutrient parameters were measured at these stations starting in February (WF001) and beginning with the April survey (WF004) phytoplankton and zooplankton samples were also added to the list of parameters measured at these stations to better define biological conditions at the northeastern boundary of Massachusetts Bay. These additional parameters continue to be measured at stations F22

2000 Annual Water Column Monitoring Report November 2001
2-2
and F26 during each farfield survey. Starting with the August combined survey (WF00B), additional nutrient samples were also collected at station F19 to provide ancillary data on dissolved and particulate organic nutrients coincident with respiration measurements.
Table 2-1. Water quality surveys for 2000 (WF001-WN00H).
Survey # Type of Survey Survey Dates WF001 Nearfield/Farfield February 2 – 5 WF002 Nearfield/Farfield February 23 – 27 WN003 Nearfield March 14 WF004 Nearfield/Farfield March 30 – April 7
WN005 Nearfield May 1 WN006 Nearfield May 17 WF007 Nearfield/Farfield June 8 – 13 WN008 Nearfield July 6 WN009 Nearfield July 19 WN00A Nearfield August 2 WF00B Nearfield/Farfield August 16 – 18, 20 WN00C Nearfield September 1 WN00D Nearfield September 22 WF00E Nearfield/Farfield October 3-5, 12 a WN00F Nearfield October 24 WN00G Nearfield November 29 WN00H Nearfield December 21
a Due to severe weather, the WF00E survey was completed over the course of two weeks in October – nearfield samples were collected October 5th and farfield samples were collected October 3, 4, and 12.
The stations for the farfield surveys have been further separated into regional groupings according to geographic location to simplify regional data comparisons. These regional groupings include Boston Harbor (three stations), coastal (six stations along the coastline from Nahant to Marshfield), offshore (eight deeper-water stations in central Massachusetts Bay), boundary (five stations in an arc from Cape Ann to Provincetown, all stations are in or adjacent to the Stellwagen Bank National Marine Sanctuary), and Cape Cod Bay (five stations, two of which are only sampled for zooplankton during the first three combined surveys). The regional nomenclature is used throughout this report and regional comparisons are made by partitioning the total data set. For this report, a subset of the data has also been grouped to focus on the deep-water stations in Stellwagen Basin (F12, F17, F19 and F22 – see Figure 2-2).
Vertical profiles of in situ data were collected during the downcast at all stations. In situ data were also recorded during the upcast coincident with water sampling events. Discrete water samples are generally collected at five depths at each station (surface, mid-surface, mid-depth, mid-bottom, and bottom). Only three depths are sampled at the shallow harbor stations F30 and F31, and at stations F32 and F33 only hydrographic profiles of in situ data and zooplankton net tow samples were collected.
Station designations were assigned according to the type of analyses performed at that station, with each type distinguished by a letter code (Tables 2-2 and 2-3). At E type stations, only dissolved inorganic nutrient (DIN) samples were collected. DIN and dissolved oxygen (DO) samples were collected at type F stations. DIN, other dissolved and particulate nutrients, chlorophyll, total suspended solids (TSS) and DO were collected at type A and D stations with additional samples collected at type D stations for plankton and urea analyses. The type G stations are similar to the type D stations except that samples were only collected at three depths at these shallow stations. The full

2000 Annual Water Column Monitoring Report November 2001
2-3
suite of analyses, including productivity and respiration measurements, was conducted at the three type P stations. In 1998, stations F32 and F33 (type Z) were added to the monitoring program to better capture the winter/spring spatial variability of zooplankton assemblages in Cape Cod Bay. During 2000, stations F22 and F26 were sampled as type A stations (additional nutrients) during the first two farfield surveys (WF001 and WF002) and as type D stations (addition of plankton samples) for the remaining farfield surveys of 2000 and station F19 was sampled as a type A+R station during the last two farfield surveys of the year (WF00B and WF00E).
Table 2-2. Station types, applicable analyses, and number of depths sampled.
Station Type A D E F G P R4 Z
Number of Stations 6 10 24 2 2 3 1 2 Dissolved inorganic nutrients (NH4, NO3, NO2, PO4, and SiO4)
5 5 5 5 3 5
Other nutrients (DOC, TDN, TDP, PC, PN, PP, Biogenic Si)1
3 3 3 3
Chlorophyll 1 3 3 3 3 Total suspended solids 1 3 3 3 3 Dissolved oxygen 5 5 5 3 5 Phytoplankton, urea 2 2 2 2 Zooplankton3 1 1 1 1 Respiration 1 3 3 Productivity, DIC 5
1Samples collected at bottom, mid-depth, and surface 2Samples collected at mid-depth and surface 3Vertical tow samples collected 4Respiration samples collected at type A station F19 (prior to 2000 a type F station)
Table 2-3. Distribution of stations by station types.
Station Type Number Station Number
A 6 N01, N07, N10, N16, N20, and F19 D 10 F01, F02, F06, F13, F22, F24, F25, F26, F27, and N16 (on farfield
survey day) E 24 F03, F05, F07, F10, F14-F18, F28, N02, N03, N05, N06, N08, N09,
N11-N15, N17, N19, and N21 F 2 F12 and F29 G 2 F30 and F31 P 3 F23, N04, and N18 R1 1 F19
Z 2 F32 and F33 1Respiration samples collected at type A station F19
2.3 Data Revisions Two data sets, irradiance and chlorophyll, have been revised based on analytical and sensor issues identified in 2001. The corrected data from 1998 through 2000 are presented in this report and have been used for all applicable calculations. The irradiance data were corrected based on problems with the MWRA Deer Island light sensor. The problem was discovered when the sensor was replaced on April 20, 2001 and the old unit
2000 Annual Water Column Monitoring Report November 2001
2-4
subsequently post-calibrated. The new calibration values were different from the initial values and were the result of damage to the unit during installation (10/96). The unit had been reading 75% of the correct value. The revised Deer Island surface irradiance data were used to recalculate the productivity data presented in this report. In the fall of 2000, extracted chlorophyll and draft calibrated fluorescence data exhibited unusually high values relative to all other data collected during the program (and were more than twice as high as the corrected data presented in this report). These high values precipitated a major review of all HOM3 chlorophyll and fluorescence data. (Note that the HOM program is often referred to by individual contract periods: HOM1 is 1992–1994, HOM 2 is 1995–1997, and HOM 3 is 1998–2001.) The quality assurance review found analytical errors in the chlorophyll measurement method used by the MWRA monitoring program during 1998-2000 and identified three technical issues requiring action: correction for chlorophyll standard purity (all HOM3 data), recalculation of chlorophyll calibration factors due to mathematical error (April 1998 through 2000), and degradation of the chlorophyll standard (limited number of surveys in December 1998 and fall 2000). Without correction, these issues resulted in an upward bias in the extracted chlorophyll and calibrated fluorescence data for all 1998 to 2000 surveys except survey WN008 (Table 2-4). The causes of the issues and corrective actions are summarized below.
Standard purity corrections The Battelle SOP for extracted chlorophyll analysis did not require an independent verification of the chlorophyll content in the standard by spectrophotometric techniques (Battelle 1999). Rather, the SOP required gravimetric determination of the chlorophyll concentration in the standard. This procedure assumed the chlorophyll content of the chemical was 100%. The vendor (Sigma) reported impurities of 94.8 and 90.8 percent for the two chlorophyll lots (Catalog #C5753) used by Battelle under the HOM3 program (lots 105H9532 and 68H7820, respectively). Spectrophotometric analysis was used to determine that the purity of the standards was lower than the nominal value reported by Sigma. Lot #105H9532 was used from February 1998 through November 1998. The second lot (#68H7820) was used from December 1998 through March 2001 (verified chlorophyll standards were used for the early 2001 samples). The extracted chlorophyll concentrations determined against these lots were corrected for lot purity determined in one of two ways (this purity correction is applicable because each standard was weighed with an assumption of 100% chlorophyll purity). As material from lot #105H9532 was no longer available in early 2001, a set of data from an interlaboratory comparison was used to estimate standard purity. A set of blind samples (drawn from the primary production samples across four surveys) was measured by URI in 1998. The URI samples were measured against a spectrophotometrically verified standard. Regression analysis of these data against Battelle’s chlorophyll results (corrected for all measurement issues except for lot purity) showed that Battelle‘s data was 87.4 percent of that measured by URI. This purity correction was determined to be appropriate for the affected data (Table 2-4). The purity of lot #68H7820 was determined spectrophotometrically at MBL using four separate chlorophyll vials purchased from Sigma. During these measurements one solution was determined to be wet and was not included as a standard. The mean of the spectrophotometrically measured standards (84.1% versus the nominal weight) was used to correct the extracted chlorophyll concentrations determined using this chlorophyll standard (Table 2-4).

2000 Annual Water Column Monitoring Report November 2001
2-5
Mathematical corrections to the extracted chlorophyll calibration factors During the evaluation of the HOM3 chlorophyll data, a minor mathematical error in the formula used to calculate the calibration coefficients (Fs and r) was discovered. This error affected chlorophyll and phaeopigment concentration calculations beginning with deployment of a digital Turner Designs 10-AU fluorometer by Battelle in early 1998. The mathematical correction was applied on a calibration-by-calibration basis and was usually small (<1% change), however larger errors (<6%) were also found and corrected (Table 2-4).
Degraded chlorophyll standards During the fall of 2000, a degraded chlorophyll standard was used to calibrate extracted chlorophyll data for surveys WN00D, WF00E, and WN00F. The degradation was identified from the ratio of the fluorometer reading before acidification and after acidification (Rb and Ra, respectively). The ratio for the chlorophyll standard used in this calibration was found to be low in comparison to previous calibration results, while the ratios for the unknown samples from these surveys were within the usual range. To correct for the degraded standard, the Turner 10-AU fluorometer was post-calibrated against phaeophytin concentration or Ra. The ratio of Rb/Ra for chlorophyll standard lot #68H7820 had a mean of 1.91 ± 0.03 for standards prepared from this lot number. This ratio was used to estimate Rb based on Ra. The newly calculated calibration coefficients resulted in a ~60% reduction in the calculated chlorophyll concentrations (Table 2-4) relative to the initial calibration. From 1998 to 2000, the chlorophyll standards from the purchased vials (nominally 1 mg chlorophyll), weighed between 1 to 2 mg. However, a much higher weight was determined for the WN98H calibration (>6 mg). Sigma chemical informed Battelle and MWRA that the 1-mg vials could experience a seal failure, thus a potential for the very hydroscopic chemical to absorb water. Other factors in addition to the elevated weight of the WN98H standard suggested that the standard was wet but not degraded. Thus the chlorophyll results could be corrected based on coproporphyrin check standard data. The wet standard correction resulted in a 65% decrease in WN98H chlorophyll concentrations. There is suggestive evidence that a small number of additional calibrations (2-3) might have used vials that experienced seal failure and water contamination (though to a much lesser extent than WN98H). However, the evidence was not strong enough to justify applying a correction to the data from those calibrations. During the evaluation we further determined that comparability of chlorophyll results among other programs regional and national programs will likely vary by 10 to 20 and higher percent (Arar and Collins, 1997). This is in part due to analytical variability, but it is also due to the various equations used by investigators in determining the concentrations of chlorophyll standards from spectrophotometric absorbance data (e.g. trichromatic or modified Lorenzen; see Jeffery et al., 1997 for details). Since these equations are a matter of choice by individual investigators, there is a built in variability among investigators. The equations used to correct HOM3 data and to revise Battelle’s chlorophyll SOP for future measurements are based on the modified Lorenzen equations, which is consistent with MWRA and MBL laboratory methods. This ensures internal consistency in the chlorophyll measurements under the HOM contract. Moreover, until such time that a nationally consistent set of equations for calculating chlorophyll from absorbance data is agreed to by the scientific community, the HOM program will measure all relevant absorbance wavelengths when verifying standards to ensure data can be used in the broadest sense. After applying the corrections as detailed above, we believe that the extracted chlorophyll and calibrated fluorescence data from 1998-2000 are fit for use, with appropriate caution. The corrected data are therefore used in this report and will continue to be used in future water column reports. All derivative data in this report (e.g. chlorophyll specific productivity) use the corrected chlorophyll

2000 Annual Water Column Monitoring Report November 2001
2-6
data. All affected data have been permanently qualified in MWRA's monitoring database as "use with caution", directing the data user to this report section for details. Errata notices are being added to both hardcopy and online versions of all 1998 and 1999 water column synthesis reports (e.g. Libby et al. 1999), notifying the reader that the chlorophyll data discussed in those reports were corrected after the reports were finalized.

2000 Annual Water Column Monitoring Report November 2001
2-7
Table 2-4. Summary of corrections applied to HOM3 chlorophyll data.
EVENT_ID Corrected for Lot 105H
purity (87.4%)
Corrected for Lot 68H
purity (84.1%)
Math Error Correction
Degraded/Wet Standard
Correction
Roll-up of Correction
Factors WF981 0.874 -- -- -- 0.874 WF982 0.874 -- -- -- 0.874 WN983 0.874 -- -- -- 0.874 WF984 0.874 -- 1.133 -- 0.990 WN985 0.874 -- 1.054 -- 0.921 WN986 0.874 -- 1.131 -- 0.989 WF987 0.874 -- 0.967 -- 0.845
WF987-A 0.874 -- 1.006 -- 0.879 WF987-B 0.874 -- 1.011 -- 0.884 WF987-C 0.874 -- 0.997 -- 0.871 WN988 0.874 -- 0.997 -- 0.871 WN989 0.874 -- 0.997 -- 0.871 WN98A 0.874 -- 0.994 -- 0.869 WF98B 0.874 -- 0.994 -- 0.869 WN98C 0.874 -- 0.994 -- 0.869 WN98D 0.874 -- 0.995 -- 0.870 WF98E 0.874 -- 0.995 -- 0.870 WN98F 0.874 -- 0.997 -- 0.871 WN98G 0.874 -- 0.997 -- 0.871 WN98H -- 0.841 0.997 0.35 0.294 WF991 -- 0.841 1.002 -- 0.843 WF992 -- 0.841 1.002 -- 0.843 WN993 -- 0.841 0.997 -- 0.838 WF994 -- 0.841 0.997 -- 0.838 WF994 -- 0.841 0.979 -- 0.823 WN995 -- 0.841 0.979 -- 0.823 WN996 -- 0.841 0.979 -- 0.823 WF997 -- 0.841 1.002 -- 0.843 WN998 -- 0.841 1.002 -- 0.843 WN999 -- 0.841 0.976 -- 0.821 WN99A -- 0.841 0.976 -- 0.821 WF99B -- 0.841 0.976 -- 0.821 WN99C -- 0.841 0.974 -- 0.819 WN99D -- 0.841 0.974 -- 0.819 WF99E -- 0.841 0.987 -- 0.830 WF99E -- 0.841 0.989 -- 0.832 WN99F -- 0.841 0.997 -- 0.838 WN99G -- 0.841 0.997 -- 0.838 WN99H -- 0.841 1.004 -- 0.845 WF001 -- 0.841 1.004 -- 0.845 WF002 -- 0.841 0.993 -- 0.835 WN003 -- 0.841 0.993 -- 0.835 WF004 -- 0.841 0.989 -- 0.832 WN005 -- 0.841 1.000 -- 0.841 WN006 -- 0.841 1.000 -- 0.841 WF007 -- 0.841 1.047 -- 0.881 WN008 -- 0.841 1.763 -- 1.483 WN009 -- 0.841 0.959 -- 0.807 WN00A -- 0.841 0.959 -- 0.807 WF00B -- 0.841 1.001 -- 0.842 WN00C -- 0.841 1.001 -- 0.842 WN00D -- 0.841 0.392 Note A 0.330 WF00E -- 0.841 0.392 Note A 0.330 WN00F -- 0.841 0.392 Note A 0.330 WN00G -- 0.841 0.995 -- 0.837 WN00H -- 0.841 0.995 -- 0.837
A The degraded standard correction was incorporated in the new calibration factors and accounted for under the "math error" fix.

2000 Annual Water Column Monitoring Report November 2001
2-8
Figure 2-1. Locations of nearfield stations, MWRA offshore outfall, and USGS mooring.
�
�
�
�
�
�
�
�
�
�
�
�
�
�
�
�
�
�
�
�
�
�
N01N02
N03N04
N05
N06
N07N08
N09N10
N11
N12N13 N14 N15
N16
N17N18N19N20
N21USGS
42°1
0'
42°10'
42°1
5'
42°15'
42°2
0'
42°20'
42°2
5'
42°25'
42°3
0'
42°30'
71°5'
71°5'
71°
71°
70°55'
70°55'
70°50'
70°50'
70°45'
70°45'
70°40'
70°40'
N
EW
S
USGS Mooring�
4 0 4 Miles
LEGEND
N01 Sampling Location Name
Outfall Diffuser

2000 Annual Water Column Monitoring Report November 2001
2-9
Figure 2-2. Locations of farfield stations and regional station groupings.
�
�
�
�
�
�
�
�
�
�
�
�
�
�
�
�
�
�
�
�
�
�
�
�
�
�
�
�
F01
F02
F03
F05
F06F07
F10
F12
F13
F14F15
F16F17
F18F19
F22
F23
F24
F25
F26
F27
F28
F29
F30
F31
F32
F33
N16
Harbor
Cape Cod Bay
Offshore
Boundary
Coastal
41°4
5'41°45'
42° 42°
42°1
5'42°15'
42°3
0'42°30'
71°
71°
70°45'
70°45'
70°30'
70°30'
70°15'
70°15'
70°
70°
10 0 10 Miles
F01 Sampling Location Name
N
EW
S
Outfall Diffuser
Stellwagen Bank National Marine Sanctuary
LEGEND
2000 Annual Water Column Monitoring Report November 2001
3-1
3.0 PHYSICAL CHARACTERIZATION
3.1 Forcing Variables
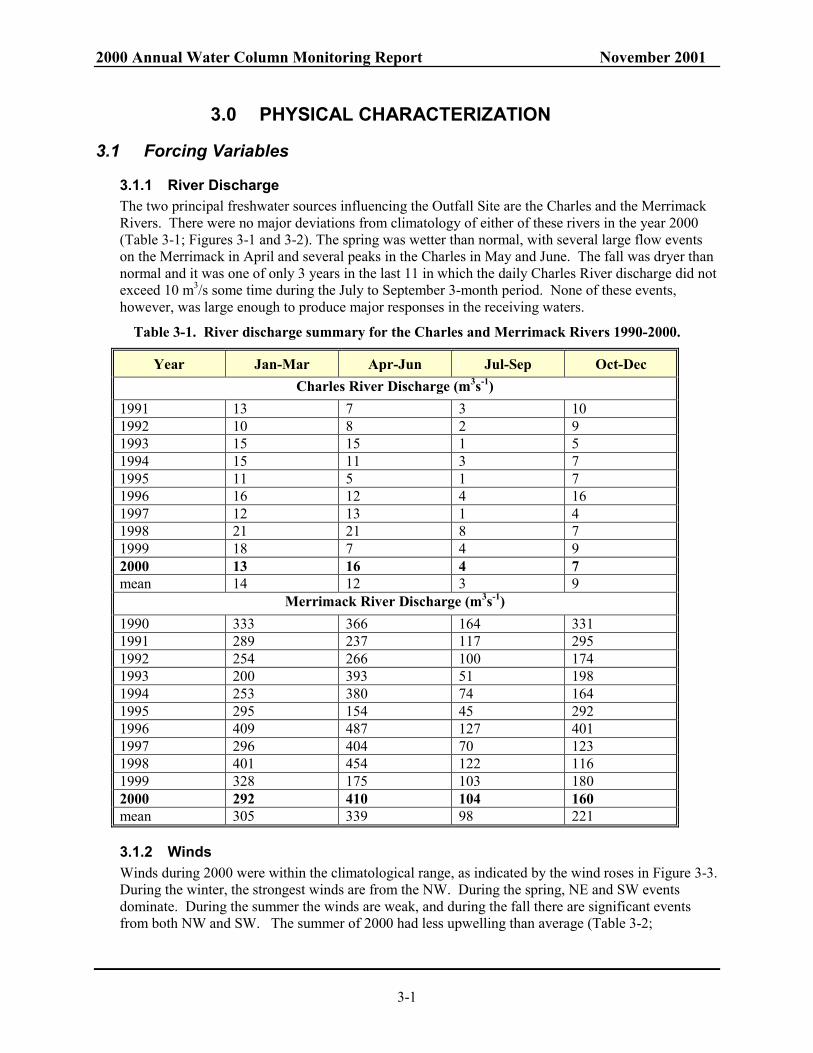
3.1.1 River Discharge The two principal freshwater sources influencing the Outfall Site are the Charles and the Merrimack Rivers. There were no major deviations from climatology of either of these rivers in the year 2000 (Table 3-1; Figures 3-1 and 3-2). The spring was wetter than normal, with several large flow events on the Merrimack in April and several peaks in the Charles in May and June. The fall was dryer than normal and it was one of only 3 years in the last 11 in which the daily Charles River discharge did not exceed 10 m3/s some time during the July to September 3-month period. None of these events, however, was large enough to produce major responses in the receiving waters.
Table 3-1. River discharge summary for the Charles and Merrimack Rivers 1990-2000.
Year Jan-Mar Apr-Jun Jul-Sep Oct-Dec Charles River Discharge (m3s-1)
1991 13 7 3 10 1992 10 8 2 9 1993 15 15 1 5 1994 15 11 3 7 1995 11 5 1 7 1996 16 12 4 16 1997 12 13 1 4 1998 21 21 8 7 1999 18 7 4 9 2000 13 16 4 7 mean 14 12 3 9
Merrimack River Discharge (m3s-1) 1990 333 366 164 331 1991 289 237 117 295 1992 254 266 100 174 1993 200 393 51 198 1994 253 380 74 164 1995 295 154 45 292 1996 409 487 127 401 1997 296 404 70 123 1998 401 454 122 116 1999 328 175 103 180 2000 292 410 104 160 mean 305 339 98 221
3.1.2 Winds Winds during 2000 were within the climatological range, as indicated by the wind roses in Figure 3-3. During the winter, the strongest winds are from the NW. During the spring, NE and SW events dominate. During the summer the winds are weak, and during the fall there are significant events from both NW and SW. The summer of 2000 had less upwelling than average (Table 3-2;

2000 Annual Water Column Monitoring Report November 2001
3-2
Figure 3-4), similar to 1995 and 1996, which led to warm bottom waters in the fall. The wind speeds were also typical (Table 3-3). To determine whether particular events may have contributed to excess mixing during the fall of 2000, the major wind events were identified, and their influence on surface water cooling was determined. Table 3-4 shows a comparison of the significant wind events in the fall of 2000 with those of 1999. There were no particularly large magnitude cooling events, nor were the events more frequent or numerous. The number and magnitude of cooling events was actually weaker than average. There were fewer occurrences of significant cooling in 2000 than in 1999 or the previous 10 years (Figure 3-5).
Table 3-2. Southerly (upwelling) Wind Stress, 1990-2000. Calculated seasonally averaged stress in Pa*103 at the Boston Buoy (Large and Pond, 1981).
Jan.-Mar. Apr.-Jun. Jul.-Sep. Oct.-Dec. 1990 -0.0 1.4 0.8 0.1 1991 -1.6 -0.2 1.0 -4.2 1992 -3.8 -0.4 1.0 -3.4 1993 -4.5 -0.0 1.3 -1.3 1994 -3.5 1.0 0.4 -1.7 1995 -0.1 0.0 -0.0 -0.9 1996 -2.8 0.5 -0.2 -1.3 1997 -0.1 -0.8 0.5 -2.2 1998 -4.3 -0.8 0.9 -0.5 1999 -2.1 -0.2 0.7 -0.9 2000 -3.3 0.0 -0.1 -2.6 mean -2.3 0.0 0.6 -1.7
Table 3-3. Wind Speed, 1990-2000. Seasonally averaged speed in m/s at the Boston Buoy (USGS).
Jan.-Mar. Apr.-Jun. Jul.-Sep. Oct.-Dec. 1990 7.0 5.8 4.4 7.9 1991 7.6 5.8 5.3 7.5 1992 7.9 5.8 5.1 7.0 1993 7.7 5.8 4.9 6.9 1994 7.4 5.9 5.6 6.8 1995 6.6 4.6 4.6 7.2 1996 7.3 5.1 4.5 6.6 1997 7.6 5.3 5.1 6.6 1998 6.9 4.6 3.9 6.8 1999 7.3 4.5 4.3 6.8 2000 7.3 5.4 4.6 7.2 mean 7.3 5.3 4.8 7.0

2000 Annual Water Column Monitoring Report November 2001
3-3
Table 3-4. Significant Wind Events, Fall 1999 and Fall 2000.
Date Max wind
stress (nt/m2)
Direction of max
Delta T1 (degrees C)
Cooling2 (degrees C)
Fall 1999 Sept 16-17 .7 NE, E, SE,
S 0 2.0
Oct 3-8 .38 N, NW 6.0 1.9 Oct 13-17 0.8 NW 7.0 1.0 Oct. 18-20 .4 NW 6.8 .6 Nov. 2-5 .3 SE,SW 4.5 .8 Nov. 6-8 .3 NW 6.5 .6 Nov., 10-11 .3 NNE 6.0 .6
Fall 2000 Sept 1-6 .3 N 2.8 2.3 Oct 7-10 .38 W,N,SW 7.2 1.6 Oct 28-31 0.5 NW, N 8.0 1.8 Nov. 14-18 .33 W 3.7 .3 Nov. 22-27 .3 WNW 11.4 .6
1Difference between air and surface water temperatures 2Drop in surface water temperature during wind event
3.2 Air Temperature The annual progression of air temperature was within the normal range. There were some pronounced cold snaps, such as mid-January, April, and several events in May-June (Figure 3-6). Previous analysis has indicated that the average wintertime temperature influences the bottom-water temperature at the onset of stratification. Table 3-5 indicates that in 2000, the average wintertime temperature was close to its climatological average.
Table 3-5. Winter Air Temperature, 1992-2000. Average temperature in °C at the Boston Buoy. Data from NOAA National Data Buoy Center (http://scaboard.ndbc.noaa.gov/data).
Year Dec. 1 - Feb. 28 1992-1993 -0.4 1993-1994 -1.4 1994-1995 1.7 1995-1996 -0.4 1996-1997 2.3 1997-1998 2.6 1998-1999 2.2 1999-2000 0.8 mean 0.9
2000 Annual Water Column Monitoring Report November 2001
3-4
3.3 Water Temperature
3.3.1 Nearfield description The surface water temperature followed a typical seasonal cycle in 2000. The largest fluctuations occur during the stratified months, when upwelling and vertical mixing cause sharp drops in temperature (such as the wind-induced mixing event in early June, 2000). The seasonal progression of near-surface and near-bottom temperature recorded during the nearfield surveys at station N21 are shown in Figure 3-7. The bottom water was anomalously warm during the June survey, due to a vertical mixing event. Note that this anomaly did not persist through the summer as suggested by the timeseries. Data were not collected at station N21 in July because of the presence of a jack-up-barge working on the outfall. The next bottom temperature measurement did not occur until late August at station N21. Although it appears that there was more rapid cooling in September than other years, analysis of the hourly data from the Boston meteorological buoy did not indicate abnormally rapid cooling, either on average or over short time intervals (see Figure 3-5).
3.3.2 Spatial Temperature Structure The spatial variability of temperature is exemplified by cross-sections from the mouth of Boston Harbor across Stellwagen Basin to the Gulf of Maine (Figure 3-8). The principal gradients are in the vertical, associated with the seasonal progression of thermal stratification. The top panel shows conditions in April, at the beginning of seasonal stratification. The stratification increases in June, and reaches its maximum in August. During the June and August surveys, the water was warmer in the harbor, causing slight horizontal gradients across the nearfield. Horizontal gradients tended to be very weak in the farfield. In October, surface temperature is decreasing, but the bottom water is continuing to warm.
3.4 Salinity
3.4.1 Nearfield Description The surface and bottom salinity were relatively high in Western Massachusetts Bay at the beginning of 2000 (Figure 3-9) due to the dry conditions in 1999. The spring freshet returned the salinity to normal climatological conditions.
3.4.2 Spatial Salinity Structure The salinity structure across Massachusetts Bay (Figure 3-10) showed persistent E-W gradients through August, due to local freshwater inputs into Boston Harbor. In April, the freshwater inputs initiate the establishment of vertical and horizontal salinity gradients. The largest gradients occur during the June survey following a large freshwater inflow from the Charles River, which contributed to particularly low salinities at the mouth of Boston Harbor during the June survey. Significant salinity gradients persist through August.
3.5 Stratification
3.5.1 Nearfield Description The stratification showed a significant drop relative to climatology during the June cruise, due to the mixing event that occurred just before that cruise (Figure 3-11). Otherwise, stratification fell within the normal range.

2000 Annual Water Column Monitoring Report November 2001
3-5
3.5.2 Spatial Variations in Stratification The stratification early in 2000 reflected the salinity structure (see Figure 3-10), with strong stratification near Boston Harbor and weak stratification further offshore (Figure 3-12). By June, the stratification was dominated by the temperature structure, which produced strong stratification throughout Massachusetts Bay. This condition persisted through the August observations. The maximum stratification occurred in August, with contributions from both temperature and salinity. By October, surface cooling eliminated the stratification above 20-m depth, but there was still stratification between 20 and 40-m depth due both to temperature and salinity variations.
3.6 Temperature and Salinity Impact on Dissolved Oxygen The near-bottom dissolved oxygen in the nearfield did not show a major depression during the summer of 2000 as it did in 1999 (see Section 4.3). Dissolved oxygen variations were close to the climatological average. During the spring, there was a strong vertical gradient in dissolved oxygen, although levels throughout the domain were high (Figure 3-13). In June, there was little vertical gradient, and levels were distinctly lower in western Massachusetts Bay than offshore. This tendency was also observed in August, with values around 7 mg/l near the outfall site. In the October observations, again there was a vertical gradient, with higher values in the near-surface over the Outfall site and values less than 7 near the bottom. Regression analysis was performed between the near-bottom temperature and salinity and dissolved oxygen, to see whether the 2000 data also showed the relationship to these variables that was indicated in previous years (as noted in Libby et al. 2000b). The relationship was roughly consistent with other years (Figure 3-14), although neither temperature nor salinity showed significant anomalies. The overall trend is for low DO to occur when the bottom waters have higher salinity and warmer temperatures. Note that the dissolved oxygen in 2000 lies somewhat above both regression lines, but it is not inconsistent with the overall trends indicated by previous years. Following the analysis described in the 1999 Water Column Report (Libby et al. 2000b), a linear model was used to hindcast the variability of the fall, deep dissolved oxygen levels (Figure 3-15). The regression model for near-bottom dissolved oxygen is based on a linear relationship with near-bottom temperature and salinity:
DO= A – B × T´ – C × S´ where T´and S´ are the near-bottom temperature and salinity anomalies (relative to the 9-year mean for Sept.-Oct., A=7.47, B=1.9, and C=0.22). The regression coefficient for the relationship is r2=0.75, i.e. 75% of the variance in dissolved oxygen is explained by the model. For 2000, the model predicted a lower dissolved oxygen level than was observed, mainly because the near-bottom salinity was higher than average, which tends to correlate with low DO values.
3.7 Summary The physical processes in 2000 followed climatology quite closely and none of the forcing parameters or physical variables showed extreme behavior. In reference to the fall chlorophyll bloom, there was no evidence of particularly vigorous mixing, although there was a fairly rapid reduction in stratification and strong downwelling in the fall. Furthermore, there were no clear signs of anomalous advection, unusual amounts of run-off, or other physical forcing factors that might indicate a physically stimulated plankton bloom.

2000 Annual Water Column Monitoring Report November 2001
3-6
Figure 3-1. Charles River (at Waltham) and Merrimack River (at Lowell) discharge for the year 2000, compared to the 10-year average.

2000 Annual Water Column Monitoring Report November 2001
3-7
Figure 3-2. Charles River (at Waltham) and Merrimack River (at Lowell) discharge, 1990–2000 (5 day running mean).

2000 Annual Water Column Monitoring Report November 2001
3-8
Figure 3-3. Wind-stress roses for Winter (Jan.-Mar.), Spring (Apr.-Jun.), Summer (Jul.-Sep.) and Fall (Sep.-Dec), with 2000 shown in black and data from the last 10 years in gray. The positions
of the dots indicate the direction to which the winds are blowing.

2000 Annual Water Column Monitoring Report November 2001
3-9
Figure 3-4. Monthly average N-S wind stress at Boston Buoy for 2000 compared with 10-year average. Positive values indicate northward-directed, upwelling-favorable wind stress.
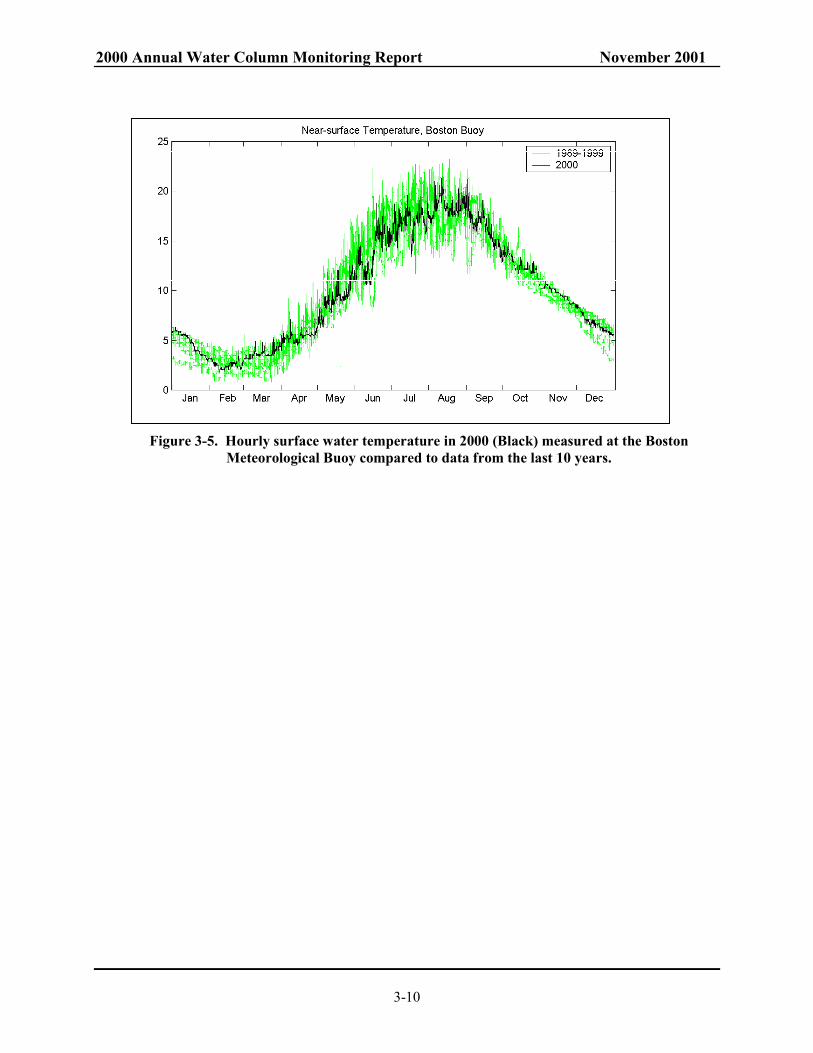
2000 Annual Water Column Monitoring Report November 2001
3-10
Figure 3-5. Hourly surface water temperature in 2000 (Black) measured at the Boston Meteorological Buoy compared to data from the last 10 years.

2000 Annual Water Column Monitoring Report November 2001
3-11
Figure 3-6. Hourly air temperature at the Boston Buoy (Black) superimposed on the data from the previous 10 years (green).

2000 Annual Water Column Monitoring Report November 2001
3-12
Figure 3-7. Near-surface and near-bottom temperature observed during nearfield cruises. Upper panel—timeseries for the entire monitoring interval; Lower panel—annual variation for 2000
(Black) compared with previous years (green).

2000 Annual Water Column Monitoring Report November 2001
3-13
Figure 3-8. Temperature cross-sections from Boston Harbor to the Gulf of Maine, through the outfall zone.

2000 Annual Water Column Monitoring Report November 2001
3-14
Figure 3-9. Near-surface and near-bottom salinity observed during nearfield cruises. Upper panel—timeseries for the entire monitoring interval; Lower panel—annual variation for 2000
(Black) compared with previous years (green).

2000 Annual Water Column Monitoring Report November 2001
3-15
Figure 3-10. Salinity cross-sections from Boston Harbor to the Gulf of Maine, through the outfall zone.

2000 Annual Water Column Monitoring Report November 2001
3-16
Figure 3-11. Density difference between surface and bottom at Nearfield Station N21 during 2000 (black) and years 1992-1999 (green).
Diff
eren
ce in
sig
ma-
t

2000 Annual Water Column Monitoring Report November 2001
3-17
Figure 3-12. Density variations across Massachusetts Bay during four surveys in 2000.

2000 Annual Water Column Monitoring Report November 2001
3-18
Figure 3-13. Dissolved oxygen (in mg/l) across Massachusetts Bay during four surveys in 2000.

2000 Annual Water Column Monitoring Report November 2001
3-19
Figure 3-14. Autumn near-bottom salinity vs. dissolved oxygen at N-21 (left panel) and near-bottom temperature vs. DO (right panel). The year 2000 is denoted by 0.
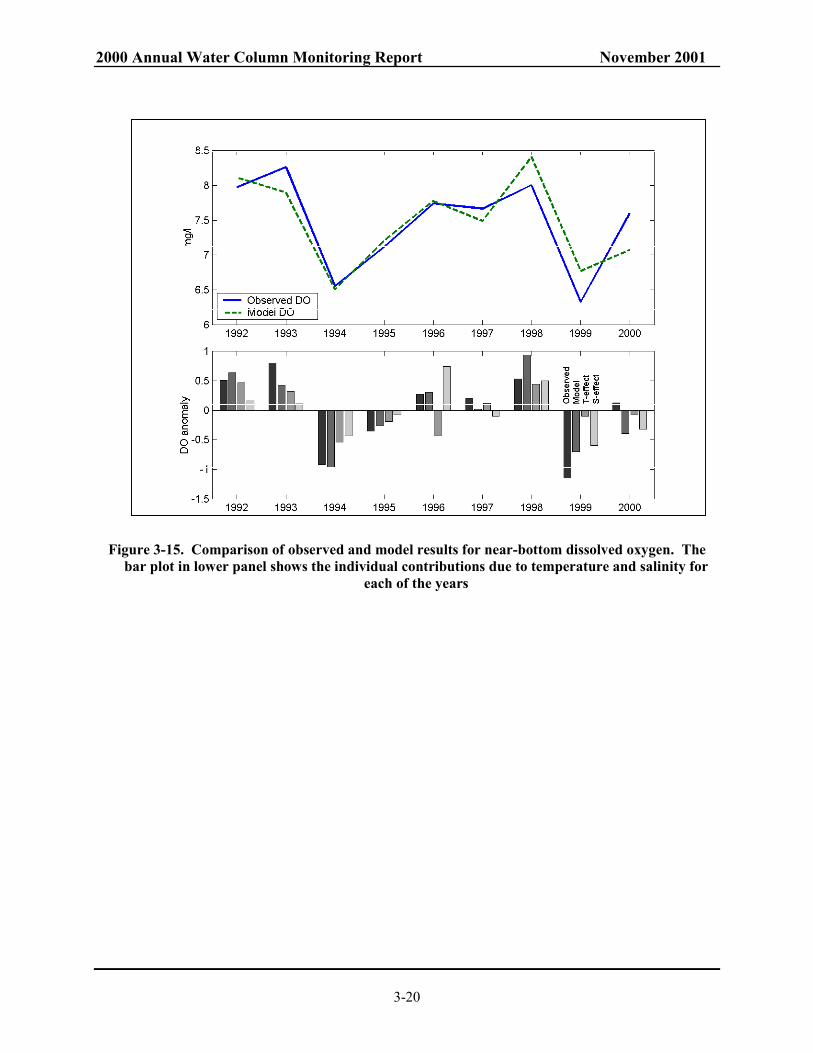
2000 Annual Water Column Monitoring Report November 2001
3-20
Figure 3-15. Comparison of observed and model results for near-bottom dissolved oxygen. The bar plot in lower panel shows the individual contributions due to temperature and salinity for
each of the years

2000 Annual Water Column Monitoring Report November 2001
4-1
4.0 WATER QUALITY Data presented in this section are organized by type of data. Temporal trends in the data are presented on narrow (nearfield) and broad (regional) spatial scales and compared on an interannual basis over the entire baseline monitoring period – 1992 to September 2000. The physical data on temperature, salinity and density presented in the previous section provide the stage upon which discussions of the main water quality parameters are developed. Sections 4.1, 4.2, and 4.3 present an overview of the distribution of nutrients, chlorophyll a and dissolved oxygen respectively. A summary of the major results of these water quality measurements is provided in Section 4.4.
4.1 Nutrients This section provides an overview of the trends and distribution of nutrients in Massachusetts and Cape Cod Bays in 2000 with particular focus on dissolved inorganic nutrients in the nearfield. The higher frequency sampling in the nearfield allows for a more detailed examination of the temporal trends of nutrients in Massachusetts Bay. The data are presented as individual values at representative stations, as mean survey values across the area and as annual means. The farfield data are grouped by geographic region (see Figure 2-2) as in previous annual reports to examine regional variability in nutrient distribution. A detailed presentation of the data was provided in the two semi-annual reports for 2000 (Libby et al., 2000a and 2001). The discussion presented in this section focuses on the major themes that were observed in the dissolved inorganic nutrient data in 2000. This includes the nutrient dynamics associated with the seasonal phytoplankton blooms, the continuation of high ammonium concentrations in Boston Harbor and near-harbor coastal waters during the first part of 2000, and the transfer of effluent to the bay outfall and the change in the ammonium signature in the nearfield. In general, nutrient concentrations were relatively high in February when the water column was well mixed and biological uptake of nutrients was limited. The spring 2000 Phaeocystis pouchetii bloom led to a reduction in nutrient concentrations throughout the water column from February to April. With the onset of stratification, nutrient concentrations in the surface layer were depleted throughout the nearfield by early April. Seasonal stratification led to the persistent nutrient depleted conditions in the surface and mid-depth waters and ultimately to an increase in nutrient concentrations in bottom waters due to increased rates of respiration (see Section 5.2) and remineralization of organic matter. In the fall, nutrient concentrations began to increase with the breakdown of stratification, but they remained low in the surface waters and decreased at mid-depth during the fall bloom. In November and December, nutrient concentrations returned to elevated winter values as the water column became well mixed.
4.1.1 Nearfield Trends Nutrient trends in the nearfield are summarized by plotting dissolved inorganic nutrient concentrations versus time (Figures 4-1 and 4-2). These figures present the average and range of the surface, mid-depth, and bottom values for each nearfield survey. Note that when a subsurface chlorophyll maximum was present, the mid-depth sample represents the water quality characteristics associated with the feature. During the two February surveys, nitrate (NO3), silicate (SiO4), and phosphate (PO4) concentrations were relatively high and uniform over the water column (Figures 4-1 and 4-2). Nearfield mean ammonium (NH4) concentrations increased from early to late February and exhibited a wide range of values at each depth especially the surface waters (~0-7.5 µM; Figure 4-2b). Nutrient concentrations

2000 Annual Water Column Monitoring Report November 2001
4-2
decreased between February and March coincident with increasing productivity and phytoplankton abundance (primarily diatoms). By April, NO3 concentrations had become depleted and nutrient limiting in the nearfield surface waters (Figure 4-1a). The sharp decrease in NO3 was coincident with a decrease in PO4 and NH4 concentrations (Figure 4-2). The March to April draw down in NO3 and PO4 was concomitant with the onset of stratification and the major winter/spring Phaeocystis bloom with its associated maxima in production, chlorophyll concentrations, and phytoplankton counts in the nearfield. Silicate concentrations did not follow this trend due to the dominance of the phytoplankton assemblage by Phaeocystis rather than diatoms, and concentrations actually increased from March to early April (Figure 4-1b). From early April to early May, there was an increase in surface water nutrient concentrations to match deeper water concentrations, while bottom water NO3 and PO4 concentrations continued to decline. This suggests that a mixing event may have occurred following the April survey after the end of the Phaeocystis bloom and prior to establishment of more stratified conditions in May. By mid May, surface water nutrient concentrations were again depleted and these summer conditions of depleted NO3 and PO4 concentrations existed in the surface waters until October. Surface water SiO4 concentrations remained relatively constant (~3 µM) over the summer from June through August. Bottom water NO3, PO4, and SiO4 concentrations reached a minimum in June and generally increased through the summer due to biological degradation and remineralization processes. Ammonium concentrations were much more variable, but were generally high (~2-3 µM) in the nearfield bottom waters through early October. From early August to early October, surface water SiO4 concentrations decreased with the progression of the fall bloom that consisted of a mixed diatom assemblage (Figure 4-1b). Surface concentrations of NO3 remained depleted in the surface water during this period and surface NH4 concentrations decreased from early August to early September and remained very low through early October (Figures 4-1a and 4-2b). There was an increase in NO3 and PO4 at mid-depth from late August to late September. This may have been due to mixing with bottom waters as the stratified water column began to breakdown or an influx of denser, more saline waters (Figure 4-3). Elevated NO3 concentrations were concomitant with the incursion of more saline, denser water. Higher PO4 and SiO4 concentrations were also associated with this water mass. The physical oceanographic data do not provide insight into the presence or intrusion of another water mass into the nearfield or Massachusetts Bay during August to September. It is likely, however, that the physical forcing mechanism (mixing, currents, North Atlantic Oscillation, etc.) that led to the input of nutrients into the surface layer in the nearfield may have contributed to the development of the regional bloom in other areas. Mean NH4 concentrations were very low over the water column in early September (< 1 µM) and values only ranged from 0 to 1.5 µM across the nearfield (Figure 4-2b). It is unclear as to why NH4 concentrations were so low during this survey, but it was likely due to biological utilization (high production and phytoplankton abundance). Following the initiation of discharge from the outfall on September 6th, NH4 concentrations increased in nearfield mid-depth and bottom waters in late September and early October, but remained low in the surface waters until the water column was well mixed in late October. The fall bloom in 2000 was composed of a mixed diatom assemblage and had begun by the early September survey, which was conducted prior to the startup of the offshore outfall. Surface nutrient concentrations remained low from early September to early October, but the availability of nutrients below the surface layer resulted in a prolonged bloom from early September to late October. Productivity and phytoplankton abundance were highest in September and early October, very high

2000 Annual Water Column Monitoring Report November 2001
4-3
chlorophyll concentrations were present through the end of October. Nutrient concentrations increased from early October to late October as stratification broke down across the bays, but nutrient concentrations did not become homogenous over the water column until November due to continued utilization in the upper water column. As demonstrated in this set of nearfield average figures and during previous years (Libby et al., 2000b), a wide range in nutrient concentrations is frequently observed at each sampling depth (Figures 4-1 and 4-2). This range is primarily the result of variations in station depth (increasing to the east) and station location (proximity to Boston Harbor). Physical (stratification) and biological (blooms/utilization) events generally proceed in an inshore to offshore or offshore to inshore sequence and this pattern is often displayed in plots of nutrient trends. A consistent pattern that has been observed year-in-year-out during the baseline monitoring program is the influence of the Boston Harbor nutrient signal at station N10, which is most clearly seen in the high and variable NH4 concentrations (Figure 4-4). The stations presented in Figure 4-4 represent the four corners (N01, N04, N07, and N10) and center (N21; over outfall) of the nearfield. The trends observed at stations N01, N04, and N07 (year round) and N21 (until September) are representative of the general NH4 trends in the nearfield over the baseline period. The time series at station N10 with high and variable surface concentrations shows the influence of the harbor signal that fluctuated over the tidal cycle. Following the initiation of discharge from the Massachusetts Bay outfall in September 2000, very high and variable NH4 concentrations were observed at station N21, which is located along the outfall diffuser. NH4 concentrations at station N10, although still higher than concentrations at offshore stations N04 and N07, are comparable to those observed at station N01 and more consistent. The transfer of discharge from the harbor to Massachusetts Bay had a clear effect on the distribution pattern of NH4 in the nearfield. This was one of the most noteworthy observations for 2000. From the fall of 1998 to September 2000, elevated concentrations of NH4 were continually observed in the western nearfield that correlated with high concentrations observed in Boston Harbor. The source of the NH4 was determined to be an increase in the discharge of NH4 from the Deer Island facility (Libby et al., 1999). This increase may result from a combination of increased treated sewage flow from the Deer Island Outfall (as all sewage from the MWRA system is now treated at the Deer Island facility) and the improved treatment process. Secondary treatment, which is now fully online during low flow, treats the sewage more completely and breaks down organic wastes. One of the consequences or by-products of the secondary treatment process is higher ammonium concentrations in the effluent (Hunt et al., 2000). The transfer of discharge to the bay decreased NH4 concentration in the harbor, coastal waters, and western nearfield, and moved the anthropogenic signal offshore to the center of the nearfield. Following the initiation of discharge at the outfall, MWRA effluent ammonia concentrations and loading were relatively constant during the fall of 2000 (19.9±3.4 mgL-1 and 23.3±4.5 metric tons day-1, respectively from September 10th to December 31st; Figure 4-5). Although it is not a conservative tracer due to biological utilization, NH4 does provide a potential natural tracer of the effluent plume in the nearfield area especially in low light conditions where biological activity is minimal (i.e. below the pycnocline during stratified conditions and during the winter). The nearfield NH4 concentrations on September 1st showed very low concentrations and no clear pattern in the nearfield (Figure 4-6a). By late September, approximately two weeks after the outfall began operations, the distribution of NH4 concentrations clearly demonstrated that the effluent was present within the nearfield (Figure 4-6b). In late September, water column stratification was beginning to breakdown. Although production rates were high, it appears that the effluent plume NH4 signal extended into the surface waters. By early October, the data suggest that the plume was trapped below the pycnocline (Figure 4-7a), but physical conditions may have been such that the NH4 was utilized before reaching the surface waters (slow mixing or transport) or was transported out of the

2000 Annual Water Column Monitoring Report November 2001
4-4
nearfield area before reaching the surface (fast transport). By late October and for the remainder of the year, the effluent plume was clearly observed over the entire water column in the nearfield (Figures 4-7b and 4-8). Ammonium in the water column has proven to be an excellent tracer of the influence of Boston Harbor on coastal and western nearfield waters over the course of the baseline monitoring program and it appears that it is a clear indicator of the effluent plume in the nearfield now that the outfall is online.
4.1.2 Farfield Comparisons The annual nutrient cycle in Massachusetts and Cape Cod Bays was examined using nutrient time series plots and contour maps. To distinguish regional concentration differences and processes, the data have been grouped by geographic region: Boston Harbor, Boundary, Cape Cod Bay, Coastal, Nearfield, and Offshore (Figure 2-2). A small subset of the farfield data is presented to focus the discussion on the major regional trends that were observed in 2000. Of special note are changes that were observed after initiation of discharge from the offshore outfall (a comprehensive data presentation was provided in Libby et al. 2000a and 2001). As has been the case during each of the baseline years, the highest nutrient concentrations were consistently measured at the harbor and harbor-influenced coastal and nearfield stations. Dissolved inorganic nutrients, except for NH4, were generally at a maximum during the two February surveys (Figures 4-9 and 4-10). The main exception was the elevated concentrations of SiO4 and PO4 observed at the Boston Harbor stations in the summer. Nutrient concentrations were lower in Cape Cod Bay than in Massachusetts Bay during the first two farfield surveys and concentrations decreased from early to late February. This decrease was coincident with an increase in diatoms in Cape Cod Bay. A plot of surface DIN concentrations during WF002 shows both the elevated concentrations present in the harbor and coastal waters and the lower concentrations in Cape Cod Bay (Figure 4-11a). Mean NO3 and PO4 concentrations decreased sharply from February to April coincident with the substantial Phaeocystis bloom that occurred in March/April 2000 (Figures 4-9a and 4-10a). In comparison to the high concentrations in February, surface DIN in April was very low (<1µM) throughout most of Massachusetts Bay, with higher concentrations in Cape Cod Bay and the highest levels in Boston Harbor (8.9 µM at station F23; Figure 4-11b). Although harbor concentrations were still elevated relative to other areas, mean NH4 concentration exhibited a precipitous decline at the harbor and coastal stations from February to April, while concentrations remained unchanged from February levels in the other areas. Silicate remained relatively high throughout the bays. During the summer, NO3, PO4, and SiO4 concentrations remained relatively constant with mean NO3 and PO4 concentrations low to depleted in June and August and mean SiO4 concentrations ranging from 4-6 µM (Figures 4-9 and 4-10). Elevated SiO4 and PO4 concentrations were observed at the Boston Harbor stations during the summer. Ammonium concentrations were quite variable in June and August and elevated concentrations were observed in the harbor and coastal waters during both surveys (Figure 4-10b). The distribution of nutrient concentrations during the summer surveys was similar for each of the nutrients and is well represented by the trends in surface DIN during WF00B (Figure 4-12a). The high surface DIN concentrations in Boston Harbor (maximum of 21 µM at station F30) are due to elevated NH4 concentrations (17.3 µM at station F30). Although nutrient concentrations are normally high in the harbor, the availability of nutrients throughout the summer is unusual as this is normally the period of highest production and biological utilization of nutrients in harbor waters. The elevated summer harbor concentrations in 2000 coincide with generally low production rates in comparison to previous years (see Section 5.1.2).

2000 Annual Water Column Monitoring Report November 2001
4-5
By October, surface water nutrient concentrations had decreased at the harbor and inshore stations and remained relatively depleted in the nearfield and further offshore due to utilization during the substantial fall bloom (Figure 4-12b). The harbor signal was very weak as surface water DIN concentrations of 1 to 5 µM were measured both within and just outside the harbor. This was due to a combination of increased utilization during the fall bloom and the transfer of MWRA discharge from the harbor outfall to the new outfall on September 6th. Note that the mean NH4 concentration in Boston Harbor was less than that observed in the nearfield in October (1.75 µM vs. 2.28 µM; Figure 4-10b). Nearfield mean NH4 concentrations remained high (>2 µM) for the remainder of 2000. As shown in Figures 4-7 and 4-8, the elevated nearfield means from October to December resulted from very high NH4 concentrations within the plume not elevated concentrations throughout the nearfield area. The series of DIN surface water contours suggests a change in DIN, or more specifically NH4, distribution after initiation of discharge at the offshore outfall on September 6th. This is more clearly shown by examining the vertical distribution of NH4 along the Boston-Nearfield transect (Figure 4-13). During the August farfield survey, the NH4 concentration trends were indicative of the Boston Harbor signal and its influence on nearby coastal and western nearfield waters. This trend has been observed consistently in nutrient data during the baseline monitoring program and the elevated NH4 concentrations have been observed since late 1998 (Libby et al., 2000b). By October 2000, the MWRA outfall had moved offshore at a depth of ~30 m and the effluent plume was clearly observed in the NH4 data (Figure 4-13b). The plume appears to have been confined below the pycnocline along the Boston-Nearfield transect as it was in the nearfield contour data for October (see Figure 4-7a). A review of concomitant salinity data along the transect, however, suggests that the plume may have extended into surface waters (Figure 4-14b). Lower salinity water was observed both in the plume at depth at stations N20 and N21 and in surface waters of stations N16 and F24. The lack of an NH4 signal in these surface waters suggests that the NH4 was utilized before reaching the surface waters during the fall bloom. It should be noted again, however, that NH4 is not a conservative tracer and that given the temporal and spatial scales that NH4 is measured during these surveys it is difficult to definitively ascribe changes in the distribution of the plume to particular physical or biological factors. A more refined examination of physical current structure, mixing, and loading might allow for a better differentiation of physical and biological effects on NH4 distributions in the nearfield. During the fall of 2000, there was clearly an input of nutrients into the nearfield via the outfall, but the effluent plume was not the only source as the breakdown of stratification and increased mixing brought nutrient rich bottom water into the upper water column. The breakdown of stratified conditions from August to October is illustrated by the salinity data along the Boston-Nearfield transect. In August, the water column was strongly stratified, and higher salinity waters (>32 PSU) were only found at depths of >40 m or at the boundary station F27 (Figure 4-14a). By October, the water column had become quite well mixed and higher salinity waters were evident above 20 m depths (Figure 4-14b). As the lower salinity effluent plume supplied NH4 to the nearfield, the mixing of the more saline bottom waters into the surface layer in the coastal waters of Massachusetts Bay supplied NO3, PO4, and SiO4. This can be seen by comparing the concentrations of these nutrients along the Boston-Nearfield transect in August and October (Figures 4-15 and 4-16). Although these nutrients continued to be relatively depleted in the surface waters during both months, NO3, PO4, and SiO4 concentrations increased in the upper water column from August to October. The availability of nutrients in the fall due to the breakdown of stratification is one of the primary factors fall blooms are a relatively consistent occurrence in Massachusetts Bay. It should also be noted that elevated PO4 concentrations were also observed in the effluent plume in October.

2000 Annual Water Column Monitoring Report November 2001
4-6
4.1.3 Interannual Comparisons The year-to-year variability in nutrient concentrations is dependent upon a variety of physical and biological factors. This section focuses on characterizing the year-to-year variability and evaluating the major events or deviations from the ‘normal’ trends that were observed in 2000, primarily focused on comparisons of fall 2000 data to the baseline trends. Data are presented as survey means and annual means for each area (as defined in Figure 2-2). The occurrence of a bloom in phytoplankton and chlorophyll of varying intensity often characterizes the winter/spring period in Massachusetts and Cape Cod Bays. The presence of elevated nutrient concentrations, increasing light availability and water temperatures, and the onset of seasonal stratification establish conditions that are conducive for a bloom to occur in the bays. The intensity of the winter/spring draw down of nutrients is related to the strength of the bloom – the more intense the bloom the lower the concentrations of nutrients in the surface waters. During the summer-stratified period, nutrients are generally depleted in the surface waters and tend to increase at depth as organic material is degraded and nutrients remineralized. During years when upwelling conditions are favorable, nutrient concentrations may increase in July and August in western Massachusetts Bay at western nearfield and coastal stations. The fall is often a period of increasing nutrient concentrations as the water column returns to well-mixed winter conditions. This fall trend may be punctuated by decreases in nutrient concentrations during strong fall blooms (i.e. Asterionellopsis glacialis bloom in the fall of 1993). As mentioned in the previous section, the input of bottom water nutrients into the surface layer as stratification breaks down is one of the primary factors that initiate fall blooms in these temperate coastal waters. The inputs of nutrients and the continued availability of light provide the fuel for these blooms. This general pattern for nutrient concentrations is depicted for NO3 in Figure 4-17 for the nearfield area. The interannual variability is much less than the seasonal concentration range that results from spring draw down and fall increases each year. There are, however, interannual differences in the timing and extent of the nutrient dynamics. For NO3, the 2000 data are comparable to previous baseline years that showed strong seasonal trends. The winter/spring draw down of NO3 was very sharp as observed in 1992, 1994, and 1996, when substantial blooms led to a sharp decline in NO3 concentrations in both surface and bottom waters from February to March. This departs from a two-year trend, 1998 to 1999, when winter draw down was less intense. In 1998, there was no winter/spring bloom and nutrient concentrations remained elevated in the surface waters until May. NO3 concentrations were depleted in the nearfield surface waters into October 2000 due to the regional fall bloom of diatoms (see Section 6.1). Nearfield surface waters are often depleted in NO3 into late September and October due to a balance of physical and biological factors. In 2000, it appears that the breakdown of stratified conditions led to increased nutrient availability and a fall diatom bloom, which kept nutrient concentrations from increasing in the surface waters. This is often the case during years with significant fall blooms – 1993, 1995, and 1999 for example. In other years, mixing is delayed until later in the fall leaving surface waters depleted in nutrients and not able to supply nutrients to fuel a fall bloom. The monitoring program cannot provide all the data that would be needed to elucidate the cause and effect relationships because there are numerous other factors (physical, chemical and biological) that may play a major or minor role in the development of fall bloom. However, it is necessary to continue to observe the trends especially now that a direct source of nutrients has been moved to the nearfield area. A comparison of survey mean NO3 concentrations for each of the six areas across the bays is presented in Figure 4-18. As with the nearfield data, the year-to-year trends are similar for each of the areas though there are differences between areas. Mean NO3 concentrations in Cape Cod Bay generally decrease more quickly in the spring, remain lower over the summer, and stay lower into the

2000 Annual Water Column Monitoring Report November 2001
4-7
fall than NO3 concentrations in Massachusetts Bay. The early spring decrease is related to the earlier occurrence of the spring bloom in Cape Cod Bay waters relative to the other areas. The persistence of low nutrient conditions is related to the lack of elevated concentrations of nutrients at depth in these shallow waters. In 2000, NO3 concentrations remained low into the fall not only in Cape Cod Bay, but also the shallow harbor and coastal areas. This is similar to 1993 when the major Asterionellopsis glacialis bloom occurred. Mean NO3 concentrations remained somewhat elevated during each of these years due to high concentrations in the bottom waters. Elevated concentrations at depth and the overall depth at offshore and boundary stations consistently yields higher survey mean nutrient concentrations for these areas. Area mean SiO4 and PO4 concentrations exhibited a similar trend to NO3 and were generally consistent from year to year. The main exception was elevated SiO4 and PO4 concentrations during the summer of 2000 at the Boston Harbor stations. In 1999, elevated summer concentrations also occurred during the usual summer peak in harbor production. During the baseline period, the normal biological progression in the harbor has been increasing chlorophyll concentration, phytoplankton abundance, productivity, and nutrient utilization from winter to summer and then a decrease in primary productivity and nutrient utilization in the late summer or fall when the system “shuts down”. In 2000, however, as mentioned earlier and discussed in Section 5.1.2, Boston Harbor production peaked during the spring Phaeocystis bloom and remained low through the summer and fall in 2000. The elevated summer nutrient concentrations in 1999 and 2000 and the low summer productivity in 2000 may be related to changes in nutrient dynamics in the harbor as influenced by changes in MWRA discharge. Water quality changes in the harbor are the focus of intensive study by MWRA (Taylor 2001) and continued monitoring should provide additional insight into changes in nutrient and biological dynamics in the harbor that result from relocation of the outfall. Plots of area mean NH4 show that annual concentration minima and maxima were generally higher in 2000 than during previous baseline monitoring years (Figure 4-19). Mean NH4 concentrations in the harbor were once again elevated in the winter and summer of 2000 as they had been in 1999 and continued a trend that was first observed in Boston Harbor in the fall/winter of 1998. This trend of increasing NH4 also appears to be occurring at the other five areas in Cape Cod and Massachusetts Bay (Figure 4-19) suggesting that there may be two coincident processes affecting regional and localized (western Massachusetts Bay) NH4 concentrations. Although the mean NH4 data are quite variable from year to year, the nearfield means for October to December of 2000 mark one of the few instances where nearfield concentrations of NH4 were higher than Boston Harbor and coastal concentrations. This trend is likely to continue now that the outfall is online. It should be noted, however, that this is not a ‘new’ source of nutrients to the nearfield; rather it is reaching the nearfield area via a new pathway – the subsurface outfall vs. tidal flow from the harbor. Model predictions have been run to compare the distribution of effluent in Massachusetts and Cape Cod Bays for both the harbor and bay outfalls (Signell et al., 1996). The results for summer-stratified and winter well-mixed conditions are presented in Figures 4-20 and 4-21 for comparison against monitoring results. The dilution simulations predicted that the concentrations of effluent would be greatly reduced in the harbor, would increase locally within the plume in the nearfield, and have little impact on concentrations in the rest of Massachusetts and Cape Cod Bays. Monitoring data from October 1999 and 2000 are presented in Figures 4-22 and 4-23. During each of these surveys, the water column was weakly stratified in undergoing a transition from seasonal stratification and well-mixed winter conditions. Both the surface and bottom contours of NH4 data are similar to the model predictions for summer-stratified conditions. Surface water concentrations were high in the harbor in 1999 and low in 2000. Bottom water NH4 concentrations were high in the harbor and low in the bays in 1999, while concentrations were low in the harbor, high in the nearfield in the vicinity of the outfall, and low throughout the rest of Massachusetts and Cape Cod Bays in 2000. These NH4

2000 Annual Water Column Monitoring Report November 2001
4-8
concentrations are not a conservative tracer of the effluent plume and biological utilization certainly affected concentrations during the fall blooms that occurred each year, but the overall patterns that were observed are an unambiguous confirmation of the model dilution simulations.
4.2 Chlorophyll This section presents an overview of the trends and distribution of chlorophyll in Massachusetts and Cape Cod Bays in 2000 and an interannual comparison with the 1992-1999 baseline monitoring data set. The reported data represent chlorophyll as measured by calibrated in situ fluorescence at discrete sampling depths. The in situ fluorescence measurements were calibrated with analytical chlorophyll a measurements made at a subset of stations on each survey (Albro et al., 1998). Unless specified as chlorophyll a, the term chlorophyll in this report refers to the post-survey calibrated in situ fluorescence values. The chlorophyll data presented in this report are from the surface, mid-depth, and bottom sampling depths. The mid-depth sample coincides with the subsurface chlorophyll maximum if one was present in the water column. The data are presented as mean survey values across areas and as individual values at representative stations. The farfield data are grouped by geographic region (see Figure 2-2) as in previous reports to examine regional variability in nutrient distribution. A detailed presentation of the data was provided in the two semi-annual reports for 2000 (Libby et al. 2000a and 2001). The discussion presented in this section focuses on the major themes that were observed in the chlorophyll data in 2000 - the winter/spring Phaeocystis bloom, the major regional fall bloom, and comparison of fall 2000 data versus the baseline threshold.
4.2.1 Nearfield Trends The main trends in chlorophyll data for 2000 were characterized by the massive spring and fall blooms that were observed throughout the bays and along the rest of the western Gulf of Maine. The winter/spring 2000 (February through April) nearfield mean chlorophyll concentration was the highest recorded for the baseline monitoring program (5.03 µgL-1). High chlorophyll concentrations were observed during both the mid March and early April survey. Chlorophyll concentrations decreased somewhat over the summer, but remained high in comparison to previous baseline years (summer mean = 2.29 µgL-1). Very high chlorophyll concentrations were also observed in the nearfield during the fall season (mean = 5.69 µgL-1). These high concentrations were the result of an early fall increase in chlorophyll concentrations in September at the initiation of the fall bloom and the two month duration of the bloom into late October. The overall annual mean for all stations and all depths sampled during the nearfield surveys was 4.31 µgL-1 in 2000. This is the highest annual average by almost a factor of two compared to previous baseline monitoring years except for 1999, which had an annual mean of 3.70 µgL-1. Trends in the nearfield chlorophyll concentrations are summarized in Figure 4-24. This figure presents the average and range of the surface, mid-depth, and bottom values for each nearfield survey. Note that when a subsurface chlorophyll maximum was present, the mid-depth sample represents the water quality characteristics associated with the feature. The nearfield mean for the mid-depth chlorophyll concentrations was higher than the surface and bottom mean values for each of the surveys in 2000. The mean chlorophyll concentrations were low (~2 µgL-1) and consistent over depth in early February. By late February, subsurface chlorophyll concentrations had increased at mid-depth (~3 µgL-1). In March, mean chlorophyll values increased substantially and ranged from 5.5 µgL-1 in the bottom waters to 13 µgL-1 at the subsurface chlorophyll maximum. There was a wide range (~15 µgL-1) in concentrations at each sampling depth across the nearfield. The highest concentrations were observed in the southeast corner of the nearfield at and near station N07, while

2000 Annual Water Column Monitoring Report November 2001
4-9
the lowest were to the northeast at station N04 (Figure 4-25). These high chlorophyll concentrations were coincident with high production, an increase in centric diatoms, and the initiation of the winter/spring Phaeocystis bloom. Production was high at station N04, but peak production at this station was not achieved until the April survey. While further south at station N18, the productivity in March was among the highest measured during the baseline period (see Section 5.1.1). By April, nearfield mean chlorophyll values had decreased considerably in the surface and bottom waters (~2 µgL-1). The mean concentrations at the subsurface chlorophyll maximum had decreased to 9.5 µgL-1. This decrease in chlorophyll concentrations occurred despite a 2-3 fold increase in phytoplankton abundance in surface waters and a 5 fold increase in abundance at mid-depth. Surface chlorophyll concentrations were highest at station N10 (>5 µgL-1) and decreased sharply to <1 µgL-1 at station N21 and the eastern nearfield (Figure 4-25). This was coincident with a very strong inshore to offshore decrease in nutrient concentrations (see Figure 4-11b). The availability of nutrients at depth led to a subsurface chlorophyll maximum at most of the nearfield stations. The exceptions being the inshore stations like N10 that had elevated surface concentrations due to availability of nutrients via Boston Harbor. The elevated chlorophyll concentrations were concomitant with high phytoplankton abundance and high production rates during the April survey. The phytoplankton abundances in the nearfield chlorophyll maximum samples were almost double that of the surface samples (3-6 million cells L-1 versus 7-11 million cells L-1). Production was still high at station N18 in April and the annual peak in production occurred at station N04. In comparison to the March survey, the chlorophyll per cell ratio was much lower in April and, with the inshore to offshore trends in production, may suggest that the survey was conducted towards the end of the Phaeocystis bloom. Following the decline of the Phaeocystis bloom, nearfield chlorophyll concentrations decreased to <3 µgL-1 in early May. There was an equally severe decrease observed in phytoplankton abundance from 4-11 million cells L-1 in early April to ≤1 million cells L-1 in early May. By mid May, however, chlorophyll concentrations had increased in the surface and mid-depth waters to 3 and 7.5 µgL-1, respectively. This increase was coincident with a >2-fold increase in phytoplankton abundance from early to mid May due predominantly to increases in microflagellates and centric diatoms. Concentrations at the harbor-influenced station N10 were high (~13 µgL-1) at both surface and mid-depth. Surface concentrations decreased sharply with distance offshore in response to nutrient availability (Figure 4-25). Chlorophyll concentrations remained elevated at mid-depth, but also tended to decrease from inshore to offshore. A similar pattern and range of chlorophyll concentrations was observed during the June and early July surveys. Elevated surface and mid-depth concentrations were observed in the southwestern portion of the nearfield and concentrations decreased to the north and offshore. Although the concentrations were higher than usual at the inshore stations, the trend in the data is typical of the summer chlorophyll pattern for the nearfield with elevated chlorophyll concentrations at the harbor-influenced western nearfield stations and a deepening subsurface chlorophyll maximum across the rest of the nearfield, which is associated with the pycnocline and the nutrients available from the deeper waters. The high concentrations of chlorophyll at the inshore stations from mid May to early July of 2000 led to the highest calculated nearfield summer mean of the baseline period. During the summer from late July through August, nearfield chlorophyll concentrations were consistently low. Mean values were ≤2 µgL-1 except at mid-depth in late August (~4 µgL-1) and ranged from 0 to 5 µgL-1. There was a substantial increase in chlorophyll concentrations at mid-depth by the early September survey. Mean chlorophyll concentrations increased slightly in the surface waters to 3 µgL-1 with a range of values from 0 to 9 µgL-1 with the higher values at the inshore stations (Figure 4-26a). The mean mid-depth concentration increased to >10 µgL-1 and the highest values were generally located in near the center of the nearfield and to the southwest (Figure 4-26b).

2000 Annual Water Column Monitoring Report November 2001
4-10
By late September, nearfield mean chlorophyll concentrations had doubled to ~7 µgL-1 in the surface waters and increase slightly at mid-depth and a wide range of values (0 to 25 µgL-1) was observed at both surface and mid-depth (Figure 4-24). Chlorophyll concentrations reached an annual maximum in the mid-depth waters at station N10 (22.5 µgL-1) and surface and mid-depth waters at station N21 (13.5 and 23.9 µgL-1, respectively). Chlorophyll concentrations were lower at the offshore stations and to the north for both the surface and mid-depth waters (Figure 4-27). The patterns exhibited in Figures 4-26 and 4-27 show elevated chlorophyll concentrations at the inshore stations out to the vicinity of the outfall. Although it may be suggestive of an outfall effect, the early September survey was conducted five days before the start of the offshore outfall and the trend was likely due to an inshore to offshore development of the fall bloom as has often been the case during the baseline period. An inshore to offshore trend in bloom progression is also suggested in the production data with higher values observed at station N18 in comparison to offshore station N04 during each of the September surveys. The elevated chlorophyll and production in September were coincident with relatively high abundance of diatoms (~1.5 million cells L-1) that were the basis for the fall bloom. It should be noted that diatom abundances during the fall 2000 bloom were moderate in comparison to the substantial fall blooms observed in 1993, 1995 or 1997 (see Figure 6-20). The fall bloom continued in October with mean chlorophyll concentrations increasing to 12.3 µgL-1 in the surface waters and 14.6 µgL-1 at mid-depth (Figure 4-24). Surface concentrations were higher in the southern half of the nearfield, while mid-depth concentrations were elevated at both the inshore and southern nearfield stations (Figure 4-25). These increases in chlorophyll occurred even though production rates decreased from late September to early October by about 50% at station N04 and 80% at station N18 (see Figure 5-1) and diatom abundance had decreased by more than 50% (see Figure 6-5). Chlorophyll concentrations reached a maximum during the late October survey. Bottom and surface water concentrations did not change substantially from the previous survey, but at mid-depth chlorophyll concentrations increased to 23 µgL-1 and values ranged from 11.6 to 43.6 µgL-1. The highest values were at stations located near the center of the nearfield (N13, N19 and N20) and further offshore (N05, N06, N07, and N16). This increase from mid to late October was coincident with an increase in production but a continued decrease in phytoplankton abundance. By late November, chlorophyll concentrations had decreased to low levels throughout the nearfield. The disconnect between chlorophyll concentrations, production and phytoplankton abundance during the fall 2000 bloom is discussed in more detail in Section 7. The progression of chlorophyll concentrations in the nearfield during the fall of 2000 can be more clearly seen through a series of contour plots of fluorescence over time at stations N10, N21, N18, and N07 (Figure 4-28). These stations are representative of inshore (N10), center (N21 and N18), and offshore (N07) nearfield stations. The fall bloom began in early September and elevated chlorophyll concentrations were observed at each of these stations, though they were somewhat lower at station N10. By late September, chlorophyll concentrations had increased substantially at stations N10 and N21 reaching concentrations of >15 µgL-1 over the upper 10 to 15 m of the water column. Chlorophyll concentrations had increased at stations N18 and N07, but not to the same levels. It is interesting that there was such a difference in chlorophyll concentrations between stations N18 and N21, which are only a couple kilometers apart. It is unclear if the elevated concentrations at N21 are in response to the additional source of nutrients from the outfall or result from local physical factors. The trends in Figures 4-26 and 4-27 suggest that this pattern was observed both prior to and after the outfall going online. By late October, chlorophyll concentrations reached a maximum at station N18 and N07. Concentrations of >11 µgL-1 were observed from the surface to depths of 20 meters at each of these stations. High chlorophyll concentrations at depth were also found at station N21with a subsurface maximum of > 15 µgL-1 at ~20 m. Although still high (9-15 µgL-1), concentrations were slightly lower in the surface waters at station N21 and over the water column at station N10. These

2000 Annual Water Column Monitoring Report November 2001
4-11
time series contours suggest there was some inshore to offshore variability during the fall 2000 bloom, but more importantly they show that chlorophyll concentrations were very high over an extended time period throughout the upper water column. The magnitude and breadth of the bloom are corroborated by composite SeaWiFS images for September and October (Figure 4-29). Elevated chlorophyll concentrations (5-15µgL-1) were present in coastal waters throughout the region during each of the months and October seems to have somewhat higher concentrations than September.
4.2.2 Farfield Comparisons The annual mean fluorescence in some of the farfield areas was higher than the 4.31 µgL-1 annual mean for the nearfield. For the regional areas, the 2000 mean fluorescence values were 7.51 µgL-1 at the coastal stations, 5.53 µgL-1 in Boston Harbor, 5.27 µgL-1 in Cape Cod Bay, 2.85 µgL-1 at the offshore stations, and 2.60 µgL-1 at the boundary stations. Time series plots of chlorophyll concentrations for each of the farfield areas are presented in Figure 4-30. Although the survey mean concentrations were unusually high, the seasonal patterns in chlorophyll were typical for the bays in 2000, but not so for Boston Harbor. In the bays, maximum area mean chlorophyll values were observed during the winter/spring and fall blooms. Area mean chlorophyll concentrations were lower, but remained relatively high (2-4 µgL-1), over the summer. Boston Harbor concentrations followed a similar pattern to the bays rather than its typical pattern of relatively low chlorophyll concentrations in the winter and fall and annual maxima during the summer. Chlorophyll concentrations in Cape Cod Bay suggest that the winter/spring bloom occurred earlier in these shallow waters than in Massachusetts Bay. The high February chlorophyll concentrations in Cape Cod Bay were due to a bloom of diatoms that preceded the bays wide Phaeocystis bloom in March/April. Nearfield mean chlorophyll concentrations achieved a maximum for the winter/spring bloom during the March survey when diatoms were still abundant and Phaeocystis was beginning to bloom. By April, the Phaeocystis bloom was occurring throughout the bays and winter/spring maximum chlorophyll concentrations were observed in the harbor, coastal, offshore, and boundary areas. Mean chlorophyll concentrations decreased from April to August. Annual maximum chlorophyll concentrations were measured in each of the areas during the fall bloom. Mean concentrations reached 6 µgL-1 at the offshore and boundary stations and were about double that at the Cape Cod Bay, coastal, and Boston Harbor stations. The nearfield mean was 9 µgL-1 during the mid October survey, but reached 12 µgL-1 a few weeks later. As these mean values suggest, there was a gradient of decreasing chlorophyll from inshore to offshore especially in the surface waters (Figure 4-31). The pattern in surface chlorophyll concentrations in and around the nearfield suggests that the local source of nutrients from the outfall may have had a localized effect during the fall bloom.
4.2.3 Interannual Comparisons The major themes observed in the chlorophyll data in 2000 included the winter/spring and the fall blooms, which contributed to unprecedented chlorophyll concentrations throughout Cape Cod and Massachusetts Bays. This section focuses on evaluating the major events or deviations from the ‘normal’ trends that were mentioned in the previous sections in comparison to the annual seasonal cycles for chlorophyll during previous baseline monitoring years (1992-2000). A comparison of fall 2000 results versus baseline threshold values is also included. The annual cycle of chlorophyll in the nearfield is presented in Figure 4-32 for each of the baseline monitoring years. The annual cycle has been divided into three ‘seasons’: spring (January to April), summer (May to August), and fall (September to December) for interpretive purposes and thresholds. Seasonal means for the chlorophyll data are provided for each of the baseline monitoring years in
2000 Annual Water Column Monitoring Report November 2001
4-12
Table 4-1. These time periods represent common seasonal patterns in physical and biological processes that have been observed in the nearfield area.
Table 4-1. Seasonal Chlorophyll Concentrations in the Nearfield (µµµµg L-1)
Winter/Spring Summer Fall Year Mean SD N Mean SD N Mean SD N 1992 1.93 1.52 364 1.88 1.66 625 2.45 1.77 339 1993 0.89 0.73 417 1.80 1.68 728 4.05 4.18 525 1994 1.89 1.33 525 1.53 1.13 608 2.46 1.81 525 1995 1.04 1.56 456 0.73 1.14 645 2.60 3.42 511 1996 2.44 2.24 480 0.81 0.88 532 1.41 1.95 424 1997 1.29 1.35 471 1.08 2.10 581 1.31 2.35 501 1998 0.45 1.11 304 1.72 2.47 664 1.89 2.61 440 1999 3.83 3.49 400 1.82 2.79 677 5.45 7.02 478 2000 5.03 5.16 311 2.29 2.87 624 5.69 6.85 576
The mean chlorophyll concentration for the nearfield for winter/spring (February through April) of 2000 was 5.03 µgL-1, which is greater than any previous winter/spring mean obtained for the nearfield during the baseline monitoring period. Based on chlorophyll concentrations, large spring blooms only occurred during four of the previous seven years of baseline monitoring: 1992, 1994, 1996, and 1999. Seasonal mean chlorophyll concentrations were approximately 2 µgL-1 or more during each of these years (Table 4-1). The winter/spring mean chlorophyll value in 2000 was more than double those in 1992, 1994, and 1996 and more than 1 µgL-1 higher than the large 1999 spring bloom. The 2000 nearfield mean chlorophyll concentrations decreased from April to May, but ranged between 2.3 and 4.4 µgL-1 until late July. Low mean chlorophyll concentrations were observed in late July and early August (~1 µgL-1) and increased in mid August to 2 µgL-1 (Figure 4-32). Although lower than the winter/spring or fall seasonal means, the summer 2000 seasonal mean chlorophyll concentration in the nearfield (2.29 µgL-1) was the highest observed during the 1992-2000 period and continued the trend of elevated summer concentrations first observed in 1998. The 2000 fall bloom had started by early September and continued through late October. The peak survey mean chlorophyll concentration was higher than any observed over the baseline period. The extended duration of the bloom and the high concentrations resulted in a fall mean chlorophyll concentration of 5.69 µgL-1, which was higher than all baseline values although relatively high fall means and fall peak survey means were observed in 1993, 1995, and 1999. As in 1999, phytoplankton abundance, primary production, and chlorophyll did not parallel each other closely during the fall bloom in 2000. Nearfield phytoplankton abundance peaked in early September and gradually declined through October. Productivity was highest at station N18 during the September surveys and in late October at station N04. Chlorophyll concentrations, though steadily increasing in September, did not reach maximum levels until October. The winter/spring, summer, and fall seasonal mean chlorophyll concentrations in 2000 were all higher than any of the previous baseline means (Table 4-1). The fall of 2000, however, was the first time period to be compared against baseline by way of threshold values. The fall mean chlorophyll concentration (5.69 µgL-1) was more than double the 1992-1999 fall mean of 2.70 µgL-1 and would have exceeded the originally proposed threshold value of 4.96 µgL-1 (95th percentile of baseline means). It should be noted that the mean chlorophyll concentration for fall 1999 (5.45 µgL-1) was also higher than this value.

2000 Annual Water Column Monitoring Report November 2001
4-13
Based on a review of the baseline data and the mechanisms for calculating threshold values (seasonal and annual), a change was made in the way in which the thresholds are calculated. It was determined that an areal representation of chlorophyll would better represent nearfield baseline conditions (and changes from those conditions) than a volumetric mean. Also, it was decided to use downcast in situ fluorescence for the calculation because it provides better vertical resolution than the 5-depth upcast dataset. The seasonal thresholds and seasonal areal mean chlorophyll concentrations are presented in Table 4-2. As seen with the volumetric chlorophyll means, the seasonal means of areal chlorophyll in 2000 were higher than any values measured in 1992 to 1999 and both the fall of 1999 and 2000 were higher than the threshold value of 161 mg m-2. As discussed herein, fall blooms are typical for the bays and the bloom in 2000 occurred over the entire Gulf of Maine region and exhibited elevated chlorophyll concentrations from early September through late October. The fall bloom in 2000, as well as 1999, is part of the natural variability of the region. The annual caution and warning thresholds are also presented in Table 4-3 for reference. The annual thresholds are calculated on a non-calendar year from September 6 to September 5 starting in September 6, 1992. The annual mean for 2000 (calculated for 9/6/1999 to 9/5/2000), the final year for the baseline period, was higher than the caution threshold (1.5 times the baseline mean), but lower than the warning threshold (2 times the baseline mean).
Table 4-2. Seasonal Mean Areal Chlorophyll Concentrations in the Nearfield (mg m-2)
Winter/Spring Summer Fall Annual Year Mean SD N Mean SD N Mean SD N Mean* 1992 59.70 35.21 4 59.63 32.17 6 84.15 23.10 4 na 1993 33.18 26.77 4 60.68 18.12 7 135.75 114.75 5 59.60 1994 70.84 39.52 5 54.55 11.84 6 89.93 33.44 5 85.02 1995 35.91 36.41 5 26.69 15.44 6 84.56 70.59 6 49.33 1996 89.94 66.43 5 27.94 11.06 6 46.05 52.36 6 63.26 1997 49.24 25.78 5 38.04 23.25 6 41.47 45.18 6 45.25 1998 22.39 11.20 4 50.36 16.32 7 67.87 37.84 6 41.20 1999 175.68 63.79 4 54.52 19.59 7 168.13 105.79 6 90.60 2000 190.84 184.02 4 83.76 56.94 7 204.69 164.07 6 136.11 Caution 182 80 161 107 Warning 143
*Annual mean calculated from September 6th to September 5th starting from September, 1992. The nearfield was not the only area where unprecedented chlorophyll concentrations were observed in 2000. The annual average volumetric and areal chlorophyll concentrations (based on calendar years) for each of the six areas are presented in Figure 4-33. These values were calculated as the average of the survey means using all data collected during each of the surveys from each sampling depth. The 2000 annual mean chlorophyll concentrations were the highest observed over the baseline period and continue a trend of increasing chlorophyll from 1997 to 2000. These trends were the same for both volumetric and areal representations of chlorophyll concentrations. The main difference between the two is that the magnitude of the values for the deep offshore and boundary stations increased and at the shallow coastal and harbor stations decreased (areal vs. volumetric). The most substantial increase was for Cape Cod Bay, which had concentrations double from 3.8 µgL-1 in 1999 to 7.5 µgL-1 in 2000. This likely had more to do with the fortuitous sampling of the pre-Phaeocystis diatom bloom in February than any other factor, as the Phaeocystis and fall blooms were region-wide events. Although annual mean chlorophyll leveled off at the offshore and boundary stations, the continued presence of elevated chlorophyll at these stations suggests that large scale forces are influencing

2000 Annual Water Column Monitoring Report November 2001
4-14
chlorophyll concentrations throughout the Gulf of Maine and the trend of increasing concentrations from 1997 to 2000 is not directly related to local factors. The regional trend for fall blooms is clearly illustrated in Figure 4-34. These images are monthly composites of SeaWiFS images for the southwestern Gulf of Maine [courtesy of J. Yoder (URI) and J. O’Reilly (NOAA)]. The September and October images for 1997 and 1998 look qualitatively similar, but there is an obvious increase in chlorophyll concentrations from 1998 to 1999 to 2000. This interpretation of these images is qualitative, but the relative increases are unambiguous and, more notably, they are occurring throughout southwestern Gulf of Maine.
4.3 Dissolved Oxygen This section provides an overview of the trends and distribution of dissolved oxygen (DO) in the bottom waters of Massachusetts and Cape Cod Bays in 2000 and an interannual comparison with the baseline monitoring data set. The data that are reported represent in situ sensor data collected during sampling events at the five sampling depths (A-E). The in situ measurements were calibrated against DO concentration determined by a standard Winkler titration method at a subset of stations on each survey (Albro et al., 1998). The DO data are presented as mean survey values across areas and as individual values at representative stations. The farfield data are grouped by geographic region (see Figure 2-2) as in previous reports to examine regional variability in nutrient distribution. DO data collected from stations in Stellwagen Basin (F12, F17, F19, and F22) have been grouped to evaluate DO trends in these deep waters. A detailed presentation of the data was provided in the two semi-annual reports for 2000 (Libby et al. 2000a and 2001). Spatial and temporal trends in the concentration of dissolved oxygen (DO) and percent saturation are evaluated for the nearfield area (Section 4.3.1) and for the entire region (Section 4.3.2). Special attention is focused on fall 2000 and comparisons against threshold values. In 2000, the minimum bottom water DO concentration was 6.3 mgL-1 in the nearfield at station N11 in early October and at station N07 in late October. Regionally, a DO concentration minimum of 4.8 mgL-1 was observed in Cape Cod Bay at station F02 in October. The second lowest DO value (5.9 mgL-1) was measured at the same station during the August farfield survey. August is relatively early for such a low bottom water DO concentration at station F02. It may have resulted from the large amount of organic material produced during the spring diatom and then Phaeocystis blooms that were observed in Cape Cod Bay. Not surprisingly, these four bottom water samples also had the lowest %saturation values for the year – 55% at F02 in October, 65% at F02 in August, 69% at N07 in late October, and 70% at N11 in October. The 2000 nearfield survey mean bottom water DO minimum (7.1 mgL-1) and %saturation minimum (78%) occurred during the mid October survey. These values were comparable to the survey mean bottom water minima for Stellwagen Basin stations – 7.3 mgL-1 and 78%. Although all of these survey mean minimum values are well within the range observed during baseline monitoring, the DO %saturation values were below the caution threshold (80%) for both the nearfield and Stellwagen Basin.
4.3.1 Nearfield Trends Dissolved oxygen concentrations and %saturation for surface, mid-depth and bottom waters at the nearfield stations are plotted for each of the nearfield surveys in Figure 4-35. These figures present the average and range of values for each of the depths. In 2000, the winter/spring bloom led to increases in surface and mid-depth DO concentrations and concentrations remained >10.5 mgL-1 from February to June. The maximum concentration of almost 13 mgL-1 observed in April was coincident with elevated chlorophyll concentrations and high primary production. Following the April survey,

2000 Annual Water Column Monitoring Report November 2001
4-15
surface water DO concentrations decreased reaching average concentrations of about 10±0.5 mgL-1 in June and early July. During the summer, lower production rates and increased respiration rates (see Section 5.2) led to decreases in DO through August when minima were observed in surface and mid-depth waters. Bottom water DO concentrations remained stable (~10.5 mgL-1) from early February through April and then decreased from April to July reaching concentrations of <9 mgL-1 in July and early August. Bottom waters decreased to <8 mgL-1 by late August. DO concentrations increased in the upper water column during the extended fall bloom ranging from 9.5 to 10 mgL-1 and remained there through the end of the year. Mean bottom water DO concentrations continued to decrease from August into October. The influx of nutrient rich, saline bottom water into the nearfield in September may have also had higher DO concentrations as DO minima in the nearfield increased from 6.6 mgL-1 in August to 7.3 mgL-1 in early September. The bottom water survey mean DO concentration minimum was observed in October (7.1 mgL-1). Bottom water DO did not increase until after stratification completely broke down following the late October survey. DO %saturation followed a trend similar to that of DO concentration (Figure 4-35b). The surface waters were slightly under saturated with respect to DO in early February (~95%) and increased steadily until reaching supersaturated levels in April (~125%). Surface water DO %saturation varied by 10-15% from April to October, but remained supersaturated at levels of 110-130%. There was little variation in average DO %saturation for the bottom waters for the first half of the year (February to June) ranging from 95 to 100 %saturation. Following the June survey, DO %saturation values decreased to ~90 %saturation in July and August. By late August, survey mean DO %saturation had decreased to 84% and bottom water minimum DO %saturation to 73%. DO %saturation remained above 80% during the two September surveys and the bottom water minimum values for both surveys were >75%. These survey minimum values were an increase from the late August minimum suggesting an input of less oxygen depleted water via mixing or horizontal transport. In mid October, the survey mean annual minimum of 78% saturation was measured, which is below the current caution threshold of 80% for the nearfield. By late October, the mean DO %saturation value had begun to increase (83%), but the minimum bottom water value (69%) was measured at offshore station N07. This is consistent with the inshore to offshore progression in destratification typically observed in the nearfield. By November, the entire water column had returned to saturation (100%). Given the unprecedented chlorophyll concentrations during the winter/spring and summer of 2000 and the relatively high respiration rates achieved during the summer, it is surprising that lower DO concentrations were not observed. The influx of nutrient rich, saline waters in late August and September due to physical mixing or horizontal transport may have alleviated detrimental DO conditions as well as been the source of nutrients for the fall bloom (See Section 4.1.1).
4.3.2 Farfield Comparisons The DO of bottom waters was compared between areas over the course of the six combined surveys. A time series of the average bottom water DO concentration for each area is presented in Figure 4-36a. In 2000, average bottom water DO concentrations in the farfield ranged from 6 to 13 mgL-1. As observed in the nearfield area, DO concentrations were high (10-13 mgL-1) in the farfield bottom waters from February through April. Lower concentrations were consistently observed at the deeper boundary and offshore areas during this period. Between the April and August surveys, there was a steady decline in bottom water DO throughout the Bays. Over this four-month period, bottom water DO concentrations declined by 5 mgL-1 in Boston Harbor, by 3.5 mgL-1 in coastal waters, by 3 mgL-1 in Cape Cod Bay, and by ~1.5 mgL-1 at offshore and boundary stations. Area mean DO concentration reached minimum values (~7.3 mgL-1) in the coastal and Cape Cod Bay areas by the August survey increasing slightly by October. Boston Harbor survey mean DO concentration was also lowest in August at 6.4 mgL-1, but increased to 7.8 mgL-1 by October. At offshore and boundary stations, mean

2000 Annual Water Column Monitoring Report November 2001
4-16
DO concentrations decreased from April to October. The October bottom water mean DO concentrations were comparable at each of the five areas ranging from 7.5 to 8 mgL-1, which was higher than the nearfield mean during this survey of 7.1 mgL-1. The DO pattern in Stellwagen Basin (stations F12, F17, F19, and F22) was similar to that observed at the boundary, offshore and nearfield areas of Massachusetts Bay (Figure 4-36b). The spatial pattern of bottom water shows the inshore to offshore gradient of decreasing DO concentrations (Figure 4-37). Besides the survey minimum value at station F02 in Cape Cod Bay, lower DO concentrations were generally found in the nearfield area and offshore waters including Stellwagen Basin. Higher DO concentrations were located at inshore coastal, harbor and Cape Cod Bay stations that had already become well mixed.
4.3.3 Interannual Comparisons The DO cycle in the nearfield and Stellwagen Basin for each of the baseline monitoring years is presented in Figure 4-38. In 2000, as during most years (except 1998), the DO cycle follows a repetitive pattern of higher concentrations in late winter/early spring, decreasing concentrations through the summer to the fall and then increasing concentrations following the overturn of the water column in the fall. No measurements were made in Stellwagen Basin after October to verify the return to winter conditions. The 2000 winter/spring bottom water DO concentrations were within the range for February through April seen during previous years. From April to October, mean bottom water DO concentrations declined from ~10.5 mgL-1 to an annual minimum of 7.1 mgL-1. The annual minimum in 2000 was about average in comparison to previous years and well above the lowest baseline value of 5.9 mgL-1 observed in 1999. In Stellwagen Basin, the survey mean minimum concentration was 7.3 mgL-1 slightly higher than the nearfield value and well within the 6.3 to 7.9 mgL-1 range of minima measure during previous years. The annual survey mean minimum for DO concentrations in 2000 were above caution (6.5 mgL-1) and warning (6.0 mgL-1) thresholds, but DO %saturation minima exceeded the caution (80%) thresholds for both nearfield and Stellwagen Basin although both were in the middle of the range of minima observed during previous years. In the nearfield, annual minima ranged from a low of 64% in 1999 to a high of 84% in 1996 and in Stellwagen Basin the values ranged from 66% in 1999 to 81% in 1993 (Figure 4-39). The fall of 2000 minima are within the normal variability of bottom water DO %saturation values for Massachusetts Bay as determined during the baseline monitoring program. Because of the inconsistency between the threshold values (taken from State regulatory values that had been applied to marine waters from freshwater standards) and baseline measurements, MWRA requested that the threshold be removed. Instead EPA and Massachusetts DEP suggested adding the phrase “unless background conditions are lower” to the threshold. MWRA has proposed background values of 5.75 mgL-1 and 64.3% for the nearfield and 6.2 mgL-1 and 66.3% for Stellwagen Basin. These values are calculated as the 5th percentile of the annual survey mean DO concentration and %saturation minima measured during the baseline period from 1992 to 1999. These values along with the caution and warning thresholds have been plotted in Figures 4-38 and 4-39 for comparison against baseline and 2000 survey minima. Over the eight baseline years, the background values were approached on a few occasions (1994 and 1995), but exceeded only in 1999. The background values appear to be sufficiently conservative constraints for comparison against future years’ results. The decline in bottom water DO was driven by the input of organic material from the winter/spring bloom and summer production. The unprecedented chlorophyll concentrations observed in 2000 imply that there was a substantial amount of organic material produced in the nearfield. As in 1999, it was expected that the flux of this organic material into the bottom waters might again lead to exceptionally low DO concentrations during the fall of 2000, but the situation was mitigated perhaps

2000 Annual Water Column Monitoring Report November 2001
4-17
by an influx of less DO depleted waters from offshore. The connection between these physical mechanisms and DO concentrations is speculative at this point, but it is expected that ongoing data analysis and modeling will help to clarify the underlying relationships
4.4 Summary of 2000 Water Quality Events In general, the 2000 trends in nutrient, chlorophyll and dissolved oxygen concentrations were typical for the nearfield area in comparison to previous baseline monitoring years. The 2000 chlorophyll values, however, were the highest for the 1992 to 2000 period and the mean fall 2000 chlorophyll concentration exceeded the caution threshold. Dissolved oxygen minima were relatively high in comparison to previous years, but the annual mean minimum DO %saturation in the nearfield and Stellwagen Bank were below the caution threshold of 80%. Typical seasonal trends were seen for nutrients in 2000. Ammonium concentrations continued to be high in and near Boston Harbor as observed since 1998. There was a sharp decrease in NH4 concentrations in October 2000 during the fall bloom and after MWRA transferred effluent discharge from the harbor to the bay outfall on September 6, 2000. As expected, this transfer led to a substantial increase in NH4 concentrations in the nearfield. Ammonium concentrations appear to be a good tracer, albeit not a conservative tracer, of the effluent plume in the nearfield. Monitoring data from before and after September 6th corroborate model simulations that showed that the transfer of discharge offshore would result in lower effluent concentrations (as indicated by NH4) in Boston Harbor, a localized increase in the nearfield, and little change outside of the nearfield. It is unclear at this time if the direct input of nutrients, specifically NH4, into the nearfield bottom waters had a localized effect on fall bloom biomass and production efficiency. The occurrence of two substantial blooms in 2000 led to high chlorophyll concentrations throughout Massachusetts and Cape Cod Bays during the winter/spring and fall. Annual mean chlorophyll concentrations for each regional area were the highest observed over the baseline period and continue the trend of increasing values since 1997. The factors controlling this increase in annual mean chlorophyll concentrations are likely related to underlying regional factors affecting nutrient concentrations and may have localized perturbations that augment the regional trends. In the nearfield, the seasonal mean chlorophyll concentrations were all higher than previous baseline monitoring values. The Phaeocystis bloom in the spring contributed to a winter/spring mean of 5.03 µgL-1 (190.8 mg m-2), which was double all values observed from 1992 to 1998 and greater than 1 µgL-1 higher than the 1999 winter/spring mean. Although summer values appeared relatively low in comparison, the 2000 summer mean was also the highest (2.29 µgL-1; 83.8 mg m-2) observed over the baseline period. The magnitude and duration of the region-wide fall bloom resulted in a fall mean chlorophyll concentration in the nearfield of 5.69 µgL-1 (204.7 mg m-2). This value was slightly higher than the fall mean in 1999 (5.45 µgL-1; 168.1 mg m-2). All three of the seasonal means in 2000 and the fall mean in 1999 were higher than the seasonal caution thresholds. As the outfall started discharging on September 6th, only the fall 2000 mean is compared against this regulatory threshold. The exceedance of the fall seasonal threshold in 2000 was due to a large region-wide bloom that appears to be part of the natural variability of the region. It remains unclear what localized effect the MWRA outfall may have had on the magnitude or duration of the fall bloom in the nearfield.
The 2000 nearfield survey mean bottom water DO minimum (7.1 mgL-1) was in the middle of the range of values observed during for the baseline monitoring program (5.9 mgL-1 in 1999 to 7.8 mgL-1 in 1993). In Stellwagen Basin, the survey mean minimum concentration was 7.3 mgL-1 slightly higher than the nearfield value and well within the 6.3 to 7.9 mgL-1 range of minima measure during previous years. The annual survey mean minimum for DO concentrations in 2000 were above

2000 Annual Water Column Monitoring Report November 2001
4-18
caution (6.5 mgL-1) and warning (6.0 mgL-1) thresholds, but DO %saturation minima exceeded the caution (80%) thresholds for both nearfield and Stellwagen Basin even though both were in the middle of the range of minima observed during previous years. The fall of 2000 minima are within the normal variability of bottom water DO %saturation values for Massachusetts Bay as determined during the baseline monitoring program. EPA has suggested and MWRA has proposed background values measured during the baseline period from 1992 to 1999 be used in addition to existing threshold values. Over the eight baseline years, the background values were approached on a few occasions (1994 and 1995), but exceeded only in 1999. The background values appear to be conservative constraints for comparison against future years results.

2000 Annual Water Column Monitoring Report November 2001
4-19
Figure 4-1. 2000 nearfield nutrient cycles for (a) NO3 and (b) SiO4. Survey average and range for surface, mid-depth and bottom samples collected during each nearfield survey. Surface and
bottom data offset for clarity.
(b) Silicate
0
2
4
6
8
10
12
14
16
18
20
Jan Feb Mar Apr May Jun Jul Aug Sep Oct Nov Dec
SiO
4 (µM
)
Surface Mid-Depth Bottom
Surface and Bottom are offset by 3 days
(a) Nitrate
0
2
4
6
8
10
12
Jan Feb Mar Apr May Jun Jul Aug Sep Oct Nov Dec
NO
3 (µM
)
Surface Mid-Depth Bottom
Surface and Bottom are offset by 3 days
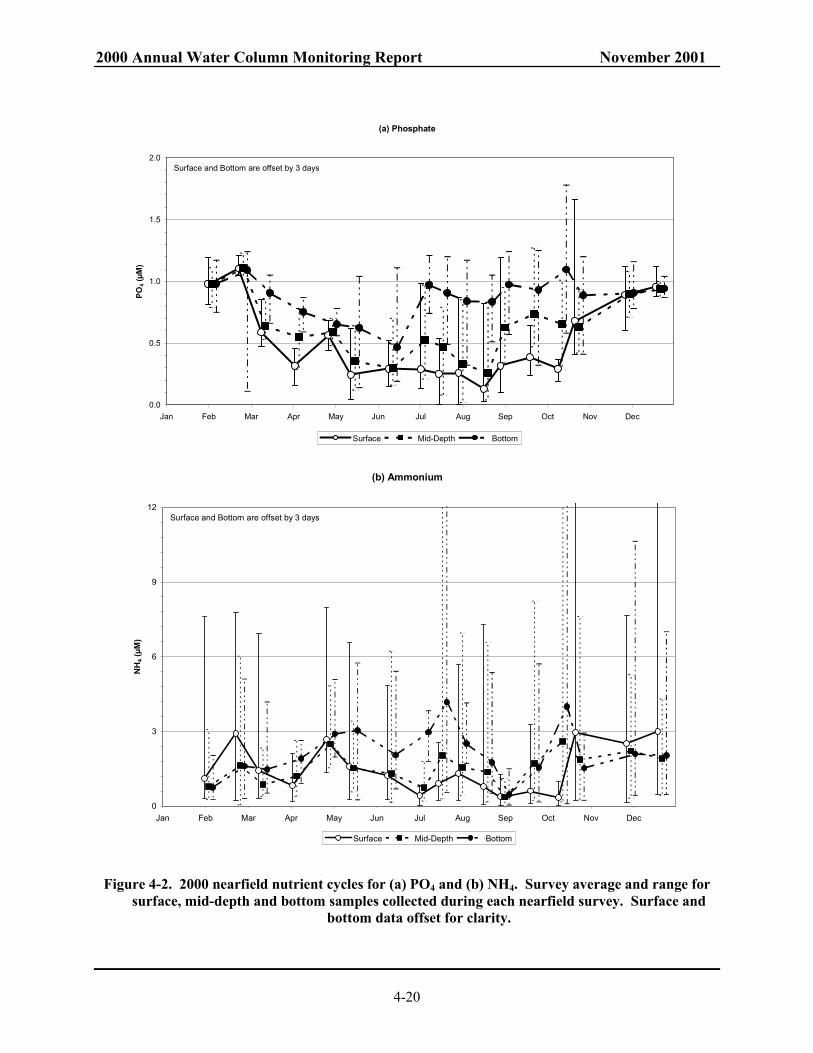
2000 Annual Water Column Monitoring Report November 2001
4-20
Figure 4-2. 2000 nearfield nutrient cycles for (a) PO4 and (b) NH4. Survey average and range for surface, mid-depth and bottom samples collected during each nearfield survey. Surface and
bottom data offset for clarity.
(a) Phosphate
0.0
0.5
1.0
1.5
2.0
Jan Feb Mar Apr May Jun Jul Aug Sep Oct Nov Dec
PO4 (
µM)
Surface Mid-Depth Bottom
Surface and Bottom are offset by 3 days
(b) Ammonium
0
3
6
9
12
Jan Feb Mar Apr May Jun Jul Aug Sep Oct Nov Dec
NH
4 (µM
)
Surface Mid-Depth Bottom
Surface and Bottom are offset by 3 days

2000 Annual Water Column Monitoring Report November 2001
4-21
-20
-10
0
Dep
th (
m)
22.2 22.6 23.0 23.4 23.8 24.2 24.6 25.0 27.0
Aug Sep Oct Nov Dec
Sigma T at Station: N18
-20
-10
0
Dep
th (
m)
30.8 31.0 31.2 31.4 31.6 31.8 32.0 32.2 33.0
Aug Sep Oct Nov Dec
Salinity at Station: N18
-20
-10
0
Dep
th (
m)
1 2 3 4 5 6 7 8 12
Aug Sep Oct Nov Dec
Nitrate at Station: N18
Figure 4-3. Nearfield depth vs. time contour plots of sigma-T, salinity, and NO3 at station N18.

2000 Annual Water Column Monitoring Report November 2001
4-22
Figure 4-4. Time series of surface and bottom water NH4 concentrations for five representative nearfield stations. Note different scale for station N21.
(b) Station N04
0
2
4
6
8
10
Jan Feb Mar Apr May Jun Jul Aug Sep Oct Nov Dec
NH
4(µM
)
Bottom Surface
(a) Station N01
0
2
4
6
8
10
Jan Feb Mar Apr May Jun Jul Aug Sep Oct Nov Dec
NH
4(µM
)
Bottom Surface
(c) Station N21
0
5
10
15
20
25
Jan Feb Mar Apr May Jun Jul Aug Sep Oct Nov Dec
NH
4(µM
)
Bottom Surface
(d) Station N10
0
2
4
6
8
10
Jan Feb Mar Apr May Jun Jul Aug Sep Oct Nov Dec
NH
4(µM
)
Bottom Surface
(e) Station N07
0
2
4
6
8
10
Jan Feb Mar Apr May Jun Jul Aug Sep Oct Nov Dec
NH
4(µM
)
Bottom Surface

2000 Annual Water Column Monitoring Report November 2001
4-23
Figure 4-5. Effluent flow and NH4 loading from MWRA Deer Island Treatment Plant for the fall of 2000.
Effluent Characteristics Fall 2000
0
50
100
150
200
250
300
350
400
450
500
1-Sep 15-Sep 29-Sep 13-Oct 27-Oct 10-Nov 24-Nov 8-Dec 22-Dec
FLow
(MG
D)
0
5
10
15
20
25
30
35
40
45
50
NH
4 Ef
fluen
t (m
g N
/L) a
nd L
oadi
ng (M
TD)
FlowLoadAmmonia

2000 Annual Water Column Monitoring Report November 2001
4-24
Figure 4-6. NH4 distribution in the nearfield by depth for (a) September 1 and (b) September 22,
2000. Plots displayed from surface to bottom
0.01
0.7
0.49
0.83
0.08
0.16
0.5
0.53
0.05
0.14
0.84
0.23
0.35
0.1
0.27
0.09
0.18
0.25
0.06
0.04
0.16
70° 52' W 70° 50' W 70° 48' W 70° 46' W 70° 44' W 70° 42' W
42° 20' N
42° 22' N
42° 24' N
42° 26' N
(a) (b)
Surface
Mid depth
Bottom

2000 Annual Water Column Monitoring Report November 2001
4-25
Figure 4-7. NH4 distribution in the nearfield by depth for (a) October 12 and (b) October 22, 2000.
Plots displayed from surface to bottom.
2.66
1.39
3.09
0.62
1.06
0.26
0.46
7.61
5.91
0.62
2.80
0.76
1.07
0.68
0.24
0.53
70° 52' W 70° 50' W 70° 48' W 70° 46' W 70° 44' W 70° 42' W
42° 20' N
42° 22' N
42° 24' N
42° 26' N
2.74
1.72
2.88
2.09
1.50
0.73
0.93
2.93
2.40
0.82
2.13
1.14
1.07
0.44
0.23
0.55
70° 52' W 70° 50' W 70° 48' W 70° 46' W 70° 44' W 70° 42' W
42° 20' N
42° 22' N
42° 24' N
42° 26' N
2.73
1.44
2.96
0.64
0.58
0.29
0.29
21.49
6.05
0.35
2.75
0.73
3.46
2.68
0.21
0.44
70° 52' W 70° 50' W 70° 48' W 70° 46' W 70° 44' W 70° 42' W
42° 20' N
42° 22' N
42° 24' N
42° 26' N
1.93
1.54
2.52
1.10
0.24
0.19
0.36
14.78
5.76
0.24
2.83
0.77
2.17
1.05
0.17
0.69
70° 52' W 70° 50' W 70° 48' W 70° 46' W 70° 44' W
42° 20' N
42° 22' N
42° 24' N
42° 26' N
2.47
1.88
2.46
2.50
0.89
0.52
0.89
6.33
0.97
0.44
2.09
0.89
0.38
0.38
0.13
0.49
70° 52' W 70° 50' W 70° 48' W 70° 46' W 70° 44' W 70° 42' W
42° 20' N
42° 22' N
42° 24' N
42° 26' N
0.12
0.66
1.56
1.23
0.41
0.49
0.31
0.32
0.23
0.02
0.75
0.32
0.39
0.34
0.65
0.14
0.16
0.01
0.28
0.34
0.03
70° 52' W 70° 50' W 70° 48' W 70° 46' W 70° 44' W 70° 42' W
42° 20' N
42° 22' N
42° 24' N
42° 26' N
2.58
0.54
0.16
1.07
2.23
4.34
7.86
0.39
7.05
0.20
23.12
2.00
0.35
0.23
0.39
0.25
0.50
0.56
0.17
0.23
0.34
70° 52' W 70° 50' W 70° 48' W 70° 46' W 70° 44' W 70° 42' W
42° 20' N
42° 22' N
42° 24' N
42° 26' N
2.82
1.78
2.92
1.77
8.78
1.18
8.89
0.29
25.92
0.78
25.48
0.53
0.25
0.26
0.22
0.70
0.90
1.17
0.12
0.37
0.43
70° 52' W 70° 50' W 70° 48' W 70° 46' W 70° 44' W 70° 42' W
42° 20' N
42° 22' N
42° 24' N
42° 26' N
2.52
2.05
2.75
2.26
7.24
0.92
8.91
0.77
27.84
0.64
23.32
0.40
0.82
0.52
0.54
0.67
0.75
0.35
0.12
0.09
0.41
70° 52' W 70° 50' W 70° 48' W 70° 46' W 70° 44' W 70° 42' W
42° 20' N
42° 22' N
42° 24' N
42° 26' N
0.44
0.09
0.23
0.41
0.15
0.73
1.00
0.29
0.21
0.05
0.21
0.01
0.40
0.77
0.61
0.21
0.07
0.17
0.08
0.01
0.99
70° 52' W 70° 50' W 70° 48' W 70° 46' W 70° 44' W 70° 42' W
42° 20' N
42° 22' N
42° 24' N
42° 26' N
(a) (b)
Surface
Mid depth
Bottom
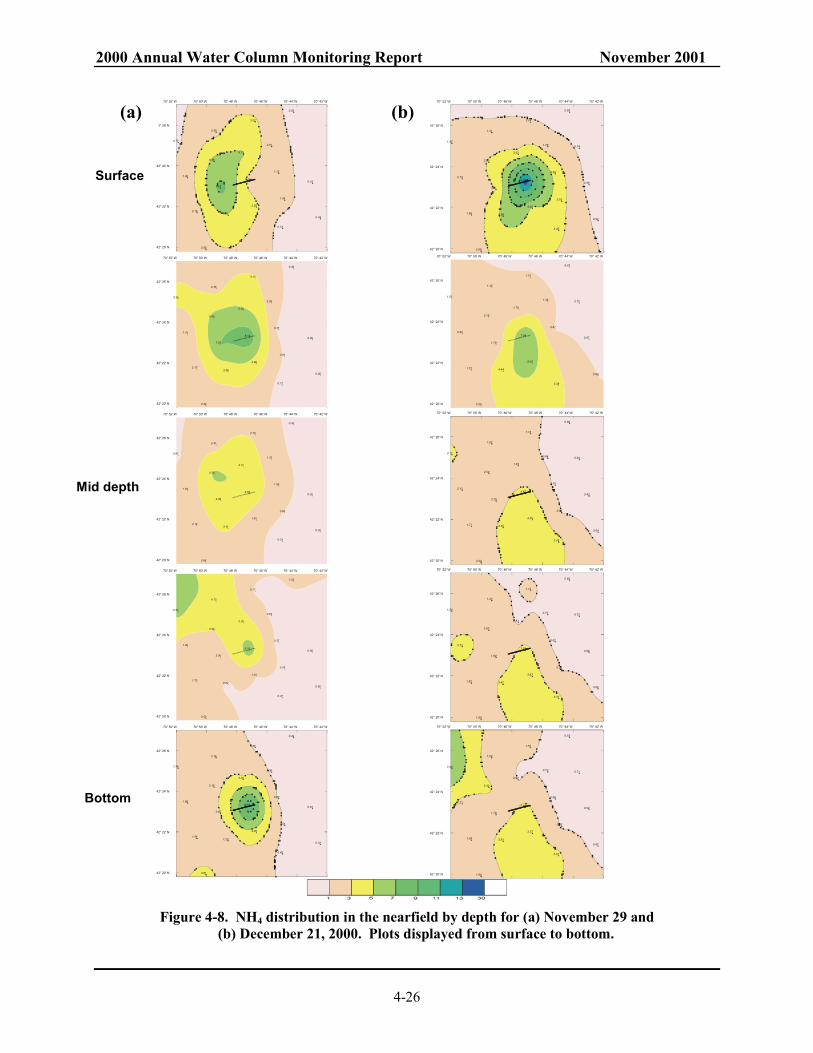
2000 Annual Water Column Monitoring Report November 2001
4-26
Figure 4-8. NH4 distribution in the nearfield by depth for (a) November 29 and
(b) December 21, 2000. Plots displayed from surface to bottom.
0.81
1.84
2.14
2.64
5.28
2.41
4.09
3.11
4.77
4.52
2.73
1.61
1.70
1.93
0.31
0.93
0.49
0.32
0.32
70° 52' W 70° 50' W 70° 48' W 70° 46' W 70° 44' W 70° 42' W
42° 20' N
42° 22' N
42° 24' N
42° 26' N
5.54
1.80
1.73
2.53
2.99
4.72
2.00
0.82
3.76
6.15
0.77
1.01
0.64
0.37
0.37
0.76
1.23
0.56
0.62
70° 52' W 70° 50' W 70° 48' W 70° 46' W 70° 44' W 70° 42' W
42° 20' N
42° 22' N
42° 24' N
42° 26' N
1.34
1.88
1.54
3.61
2.16
2.16
3.02
1.23
3.34
10.63
0.86
4.05
0.56
0.60
0.42
0.54
0.49
0.53
0.72
70° 52' W 70° 50' W 70° 48' W 70° 46' W 70° 44' W 70° 42' W
42° 20' N
42° 22' N
42° 24' N
42° 26' N
0.77
1.86
2.15
2.50
5.56
2.50
7.67
4.87
5.11
2.18
3.22
3.25
2.01
1.73
0.14
1.55
0.29
0.18
0.34
70° 52' W 70° 50' W 70° 48' W 70° 46' W 70° 44' W 70° 42' W
42° 20' N
42° 22' N
42° 24' N
42° 26' N
3.35
1.75
2.17
2.42
5.65
2.36
7.03
3.58
5.20
8.14
3.12
3.98
2.05
0.47
0.17
0.81
0.36
0.20
0.26
70° 52' W 70° 50' W 70° 48' W 70° 46' W 70° 44' W 70° 42' W
42° 20' N
42° 22' N
42° 24' N
42° 26' N
1.42
2.13
1.86
2.59
3.20
1.41
3.01
5.59
3.52
14.10
1.14
4.50
1.78
4.34
3.45
3.51
0.53
0.74
0.46
0.54
70° 52' W 70° 50' W 70° 48' W 70° 46' W 70° 44' W 70° 42' W
42° 20' N
42° 22' N
42° 24' N
42° 26' N
1.51
2.20
1.72
2.00
2.16
1.30
1.79
4.44
1.78
7.04
1.12
5.42
1.34
0.87
3.38
0.42
0.72
0.57
0.99
70° 52' W 70° 50' W 70° 48' W 70° 46' W 70° 44' W 70° 42' W
42° 20' N
42° 22' N
42° 24' N
42° 26' N
3.17
2.12
1.77
2.09
2.54
1.62
2.25
3.45
1.23
3.67
1.15
4.30
0.84
0.70
3.45
0.95
0.80
0.84
0.43
0.64
70° 52' W 70° 50' W 70° 48' W 70° 46' W 70° 44' W 70° 42' W
42° 20' N
42° 22' N
42° 24' N
42° 26' N
1.50
3.72
1.82
1.90
2.62
1.23
1.69
3.47
0.83
3.59
1.14
3.67
0.77
0.52
3.31
0.90
0.60
0.72
0.69
0.69
70° 52' W 70° 50' W 70° 48' W 70° 46' W 70° 44' W 70° 42' W
42° 20' N
42° 22' N
42° 24' N
42° 26' N
7.00
2.27
1.83
1.90
3.32
1.50
1.79
3.91
0.92
3.41
1.16
3.77
0.73
0.58
3.37
0.83
0.53
0.71
0.52
0.47
70° 52' W 70° 50' W 70° 48' W 70° 46' W 70° 44' W 70° 42' W
42° 20' N
42° 22' N
42° 24' N
42° 26' N
(a) (b)
Surface
Mid depth
Bottom

2000 Annual Water Column Monitoring Report November 2001
4-27
Figure 4-9. Time-series of survey mean (a) NO3 and (b) SiO4 concentration in Massachusetts and Cape Cod Bays. Data collected from all depths and all stations in the six areas.
(a) Survey Mean Nitrate
0
2
4
6
8
10
12
Jan Feb Mar Apr May Jun Jul Aug Sep Oct Nov Dec
NO
3 (µµ µµ
M)
Nearfield Boston Harbor Boundary Cape Cod Coastal Offshore
(b) Survey Mean Silicate
0
2
4
6
8
10
12
14
Jan Feb Mar Apr May Jun Jul Aug Sep Oct Nov Dec
SiO
4 (µµ µµ
M)
Nearfield Boston Harbor Boundary Cape Cod Coastal Offshore

2000 Annual Water Column Monitoring Report November 2001
4-28
Figure 4-10. Time-series of survey mean (a) PO4 and (b) NH4 concentration in Massachusetts and Cape Cod Bays. Data collected from all depths and all stations in the six areas.
(a) Survey Mean Phosphate
0.0
0.5
1.0
1.5
2.0
Jan Feb Mar Apr May Jun Jul Aug Sep Oct Nov Dec
PO4 (µµ µµ
M)
Nearfield Boston Harbor Boundary Cape Cod Coastal Offshore
Survey Mean Ammonium
0
4
8
12
16
20
Jan Feb Mar Apr May Jun Jul Aug Sep Oct Nov Dec
Bos
ton
Har
bor N
H 4 ( µµ µµ
M)
0
1
2
3
4
5
NH
4 (µµ µµ
M)
Boston Harbor Nearfield Boundary Cape Cod Coastal Offshore
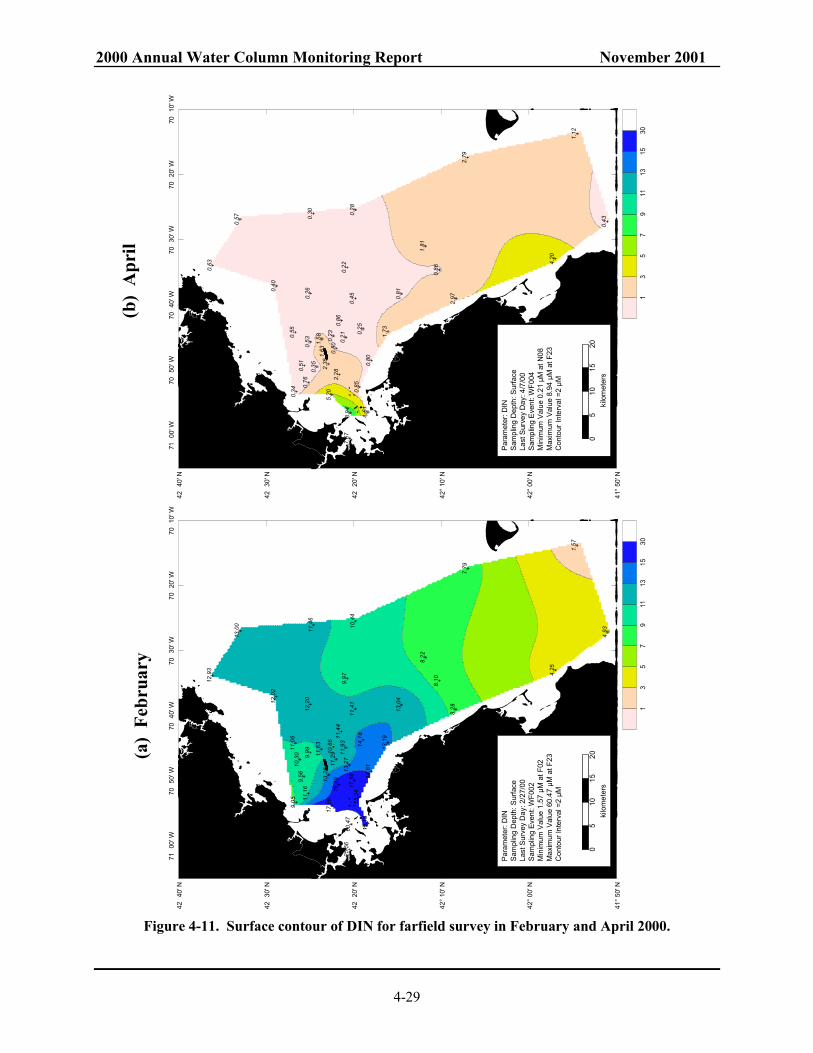
2000 Annual Water Column Monitoring Report November 2001
4-29
7.67
8.94
1.61
5.200.34 0.850.76 2.280.350.51 2.35 0.80
1.63 0.800.53 1.58 0.210.230.55
1.730.250.86
2.97
0.45 0.81
0.260.40
0.860.220.63 4.20
1.81
0.430.57 0.30 0.28
2.79
1.12
13
57
911
1315
30
71 0
0' W
70 5
0' W
70 4
0' W
70 3
0' W
70 2
0' W
70 1
0' W
41° 5
0' N
42° 0
0' N
42° 1
0' N
42 2
0' N
42 3
0' N
42 4
0' N
05
1015
20ki
lom
eter
s
Para
met
er: D
INSa
mpl
ing
Dep
th: S
urfa
ceLa
st S
urve
y D
ay: 4
/7/0
0Sa
mpl
ing
Even
t: W
F004
Min
imum
Val
ue 0
.21
µM a
t N08
Max
imum
Val
ue 8
.94
µM a
t F23
Con
tour
Inte
rval
=2
µM
25.56
60.47
15.18
17.86
9.05 15.34
11.16 16.39
17.59
9.56
13.28
14.81
13.27
10.30
11.299.99 11.63
11.93
10.86
11.06
13.19
14.1811.44
8.28
11.41
13.04
12.2012.02
8.109.9712.93
4.25
8.22
4.93
13.00
11.46
10.44
7.79
1.57
13
57
911
1315
30
71 0
0' W
70 5
0' W
70 4
0' W
70 3
0' W
70 2
0' W
70 1
0' W
41° 5
0' N
42° 0
0' N
42° 1
0' N
42 2
0' N
42 3
0' N
42 4
0' N
05
1015
20ki
lom
eter
s
Para
met
er: D
INSa
mpl
ing
Dep
th: S
urfa
ceLa
st S
urve
y D
ay: 2
/27/
00Sa
mpl
ing
Even
t: W
F002
Min
imum
Val
ue 1
.57
µM a
t F02
Max
imum
Val
ue 6
0.47
µM
at F
23C
onto
ur In
terv
al =
2 µM
Figure 4-11. Surface contour of DIN for farfield survey in February and April 2000.
(b)
Apr
il (a
) Fe
brua
ry
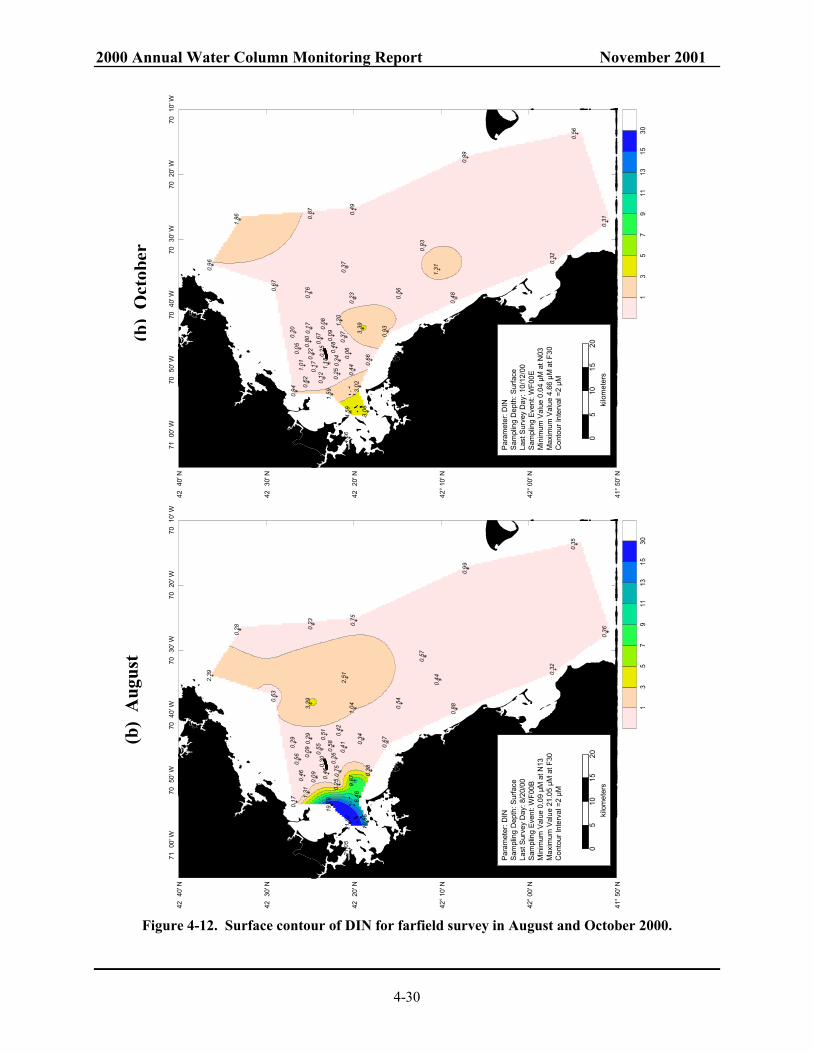
2000 Annual Water Column Monitoring Report November 2001
4-30
4.66
4.59
3.06
1.590.94 3.020.62 0.12 0.25 0.440.171.01 1.18 0.34
0.660.22
0.060.250.05 0.480.80 0.67 0.370.090.20
0.933.39
0.17 0.08 1.20
0.23
0.480.56
0.760.67
1.310.370.96 0.32
0.93
0.311.86 0.87 0.49
0.99
0.56
13
57
911
1315
30
71 0
0' W
70 5
0' W
70 4
0' W
70 3
0' W
70 2
0' W
70 1
0' W
41° 5
0' N
42° 0
0' N
42° 1
0' N
42 2
0' N
42 3
0' N
42 4
0' N
05
1015
20ki
lom
eter
s
Para
met
er: D
INSa
mpl
ing
Dep
th: S
urfa
ceLa
st S
urve
y D
ay: 1
0/12
/00
Sam
plin
g Ev
ent:
WF0
0EM
inim
um V
alue
0.0
4 µM
at N
03M
axim
um V
alue
4.6
6 µM
at F
30C
onto
ur In
terv
al =
2 µM
21.05
21.02
10.85
19.79
0.17 8.461.31 0.25 9.870.090.46 0.46 0.75
0.38
0.300.56 0.260.09 0.55 0.410.580.29
0.670.34
0.29 0.51 0.42
0.88
1.043.29
0.540.63
0.442.512.39 0.32
0.57
0.360.28 0.23 0.75
0.99
0.35
13
57
911
1315
30
71 0
0' W
70 5
0' W
70 4
0' W
70 3
0' W
70 2
0' W
70 1
0' W
41° 5
0' N
42° 0
0' N
42° 1
0' N
42 2
0' N
42 3
0' N
42 4
0' N
05
1015
20ki
lom
eter
s
Para
met
er: D
INSa
mpl
ing
Dep
th: S
urfa
ceLa
st S
urve
y D
ay: 8
/20/
00Sa
mpl
ing
Even
t: W
F00B
Min
imum
Val
ue 0
.09
µM a
t N13
Max
imum
Val
ue 2
1.05
µM
at F
30C
onto
ur In
terv
al =
2 µM
Figure 4-12. Surface contour of DIN for farfield survey in August and October 2000.
(b)
Oct
ober
(b)
Aug
ust

2000 Annual Water Column Monitoring Report November 2001
4-31
(a) August
0 10 20 30 40 50
Distance (km)
-100
-80
-60
-40
-20
0
Dep
th (
m)
F23 F24 N20N21N16 F19 F27
1 3 5 7 9 11 13 15 30
Parameter: AmmoniumLast Survey Day: 8/20/00Sampling Event: WF00BBoston-Nearfield TransectContour Interval =2 µM
(b) October
0 10 20 30 40 50
Distance (km)
-100
-80
-60
-40
-20
0
Dep
th (
m)
F23 F24 N20N21N16 F19 F27
1 3 5 7 9 11 13 15 30
Parameter: AmmoniumLast Survey Day: 10/12/00Sampling Event: WF00EBoston-Nearfield TransectContour Interval =2 µM
Figure 4-13. NH4 concentrations along Boston-Nearfield transect in August and October 2000.

2000 Annual Water Column Monitoring Report November 2001
4-32
(a) August
0 10 20 30 40 50
Distance (km)
-100
-80
-60
-40
-20
0
Dep
th (
m)
F23 F24 N20N21N16 F19 F27
31.0 31.2 31.4 31.6 31.8 32.0 32.2 32.4 33.0
Parameter: SalinityLast Survey Day: 8/20/00Sampling Event: WF00BBoston-Nearfield TransectContour Interval =0.2 PSU
(b) October
0 10 20 30 40 50
Distance (km)
-100
-80
-60
-40
-20
0
Dep
th (
m)
F23 F24 N20N21N16 F19 F27
31.6 31.7 31.8 31.9 32.0 32.1 32.2 32.3 33.0
Parameter: SalinityLast Survey Day: 10/12/00Sampling Event: WF00EBoston-Nearfield TransectContour Interval =0.1 PSU
Figure 4-14. Salinity along Boston-Nearfield transect in August and October 2000.
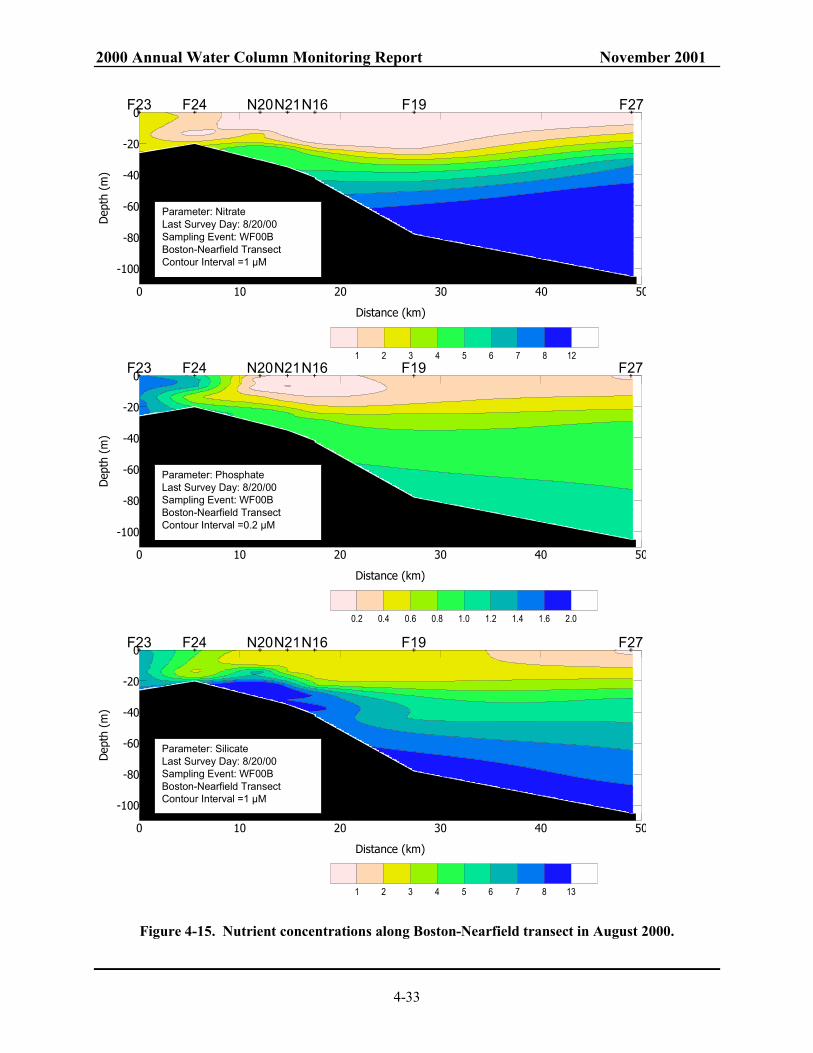
2000 Annual Water Column Monitoring Report November 2001
4-33
Figure 4-15. Nutrient concentrations along Boston-Nearfield transect in August 2000.
0 10 20 30 40 50
Distance (km)
-100
-80
-60
-40
-20
0
Dep
th (
m)
F23 F24 N20N21N16 F19 F27
0.2 0.4 0.6 0.8 1.0 1.2 1.4 1.6 2.0
Parameter: PhosphateLast Survey Day: 8/20/00Sampling Event: WF00BBoston-Nearfield TransectContour Interval =0.2 µM
0 10 20 30 40 50
Distance (km)
-100
-80
-60
-40
-20
0D
epth
(m
)F23 F24 N20N21N16 F19 F27
1 2 3 4 5 6 7 8 12
Parameter: NitrateLast Survey Day: 8/20/00Sampling Event: WF00BBoston-Nearfield TransectContour Interval =1 µM
0 10 20 30 40 50
Distance (km)
-100
-80
-60
-40
-20
0
Dep
th (
m)
F23 F24 N20N21N16 F19 F27
1 2 3 4 5 6 7 8 13
Parameter: SilicateLast Survey Day: 8/20/00Sampling Event: WF00BBoston-Nearfield TransectContour Interval =1 µM
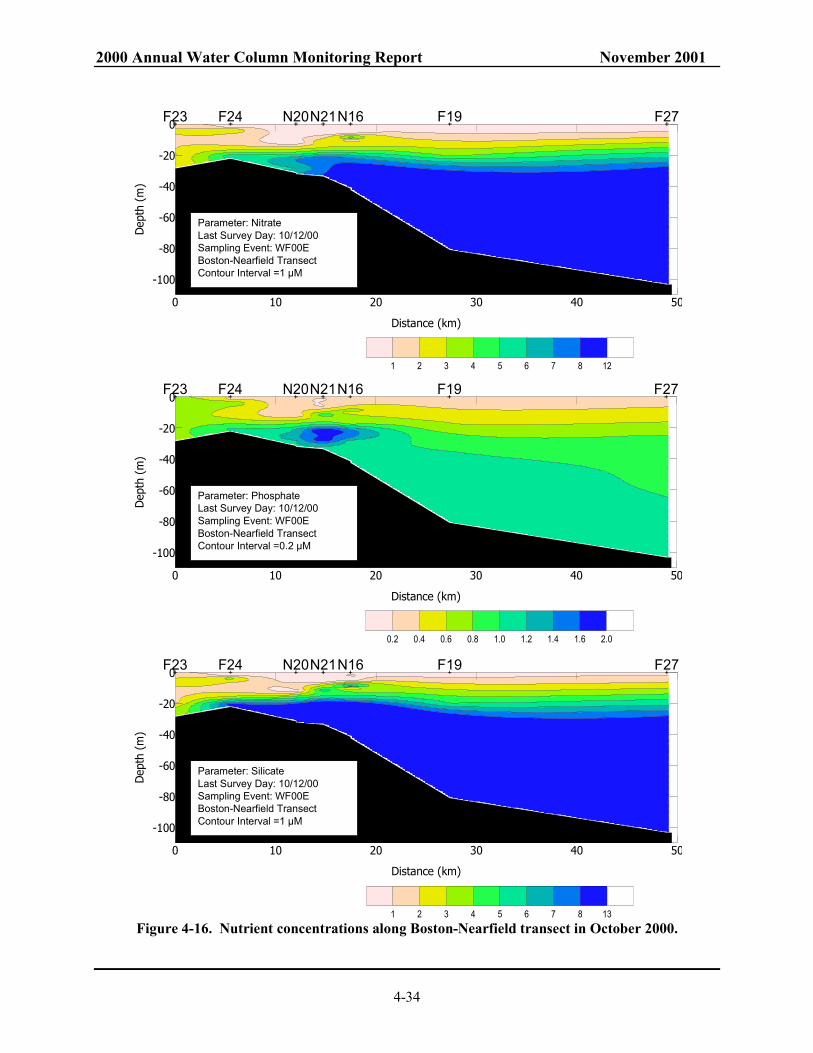
2000 Annual Water Column Monitoring Report November 2001
4-34
Figure 4-16. Nutrient concentrations along Boston-Nearfield transect in October 2000.
0 10 20 30 40 50
Distance (km)
-100
-80
-60
-40
-20
0D
epth
(m
)
F23 F24 N20N21N16 F19 F27
1 2 3 4 5 6 7 8 12
Parameter: NitrateLast Survey Day: 10/12/00Sampling Event: WF00EBoston-Nearfield TransectContour Interval =1 µM
0 10 20 30 40 50
Distance (km)
-100
-80
-60
-40
-20
0
Dep
th (
m)
F23 F24 N20N21N16 F19 F27
0.2 0.4 0.6 0.8 1.0 1.2 1.4 1.6 2.0
Parameter: PhosphateLast Survey Day: 10/12/00Sampling Event: WF00EBoston-Nearfield TransectContour Interval =0.2 µM
0 10 20 30 40 50
Distance (km)
-100
-80
-60
-40
-20
0
Dep
th (
m)
F23 F24 N20N21N16 F19 F27
1 2 3 4 5 6 7 8 13
Parameter: SilicateLast Survey Day: 10/12/00Sampling Event: WF00EBoston-Nearfield TransectContour Interval =1 µM

2000 Annual Water Column Monitoring Report November 2001
4-35
Figure 4-17. Interannual NO3 cycle in the nearfield. Survey surface and bottom depth means at all nearfield stations.
0
2
4
6
8
10
12
1992 1993 1994 1995 1996 1997 1998 1999 2000
NO
3 (µM
)
Surface Bottom

2000 Annual Water Column Monitoring Report November 2001
4-36
Figure 4-18. Interannual NO3 cycle in Massachusetts and Cape Cod Bays. Mean of data collected from all depths and all stations in the six areas.
Survey Mean Nitrate
0
2
4
6
8
10
12
14
1992 1993 1994 1995 1996 1997 1998 1999 2000
NO
3 (µµ µµ
M)
Boston Harbor Nearfield Coastal
Survey Mean Nitrate
0
2
4
6
8
10
12
14
1992 1993 1994 1995 1996 1997 1998 1999 2000
NO
3 (µµ µµ
M)
Boundary Cape Cod Offshore

2000 Annual Water Column Monitoring Report November 2001
4-37
Figure 4-19. Interannual NH4 cycle in Massachusetts and Cape Cod Bays. Mean of data collected from all depths and all stations in the six areas.
Survey Mean Ammonium
0
3
6
9
12
15
18
1992 1993 1994 1995 1996 1997 1998 1999 2000
Bos
ton
Har
bor N
H4 (µµ µµ
M)
0
1
2
3
4
5
6
NH 4
( µµ µµM
)
Boston Harbor Nearfield CoastalSurvey Mean Ammonium
0
1
2
3
4
5
6
1992 1993 1994 1995 1996 1997 1998 1999 2000
NH 4
( µµ µµM
)
Boundary Cape Cod Offshore

2000 Annual Water Column Monitoring Report November 2001
4-38
Figure 4-20. Model predicted effluent concentrations in surface (1 m) waters with harbor and bay outfalls under summer and winter physical conditions (Signell et al., 1996).
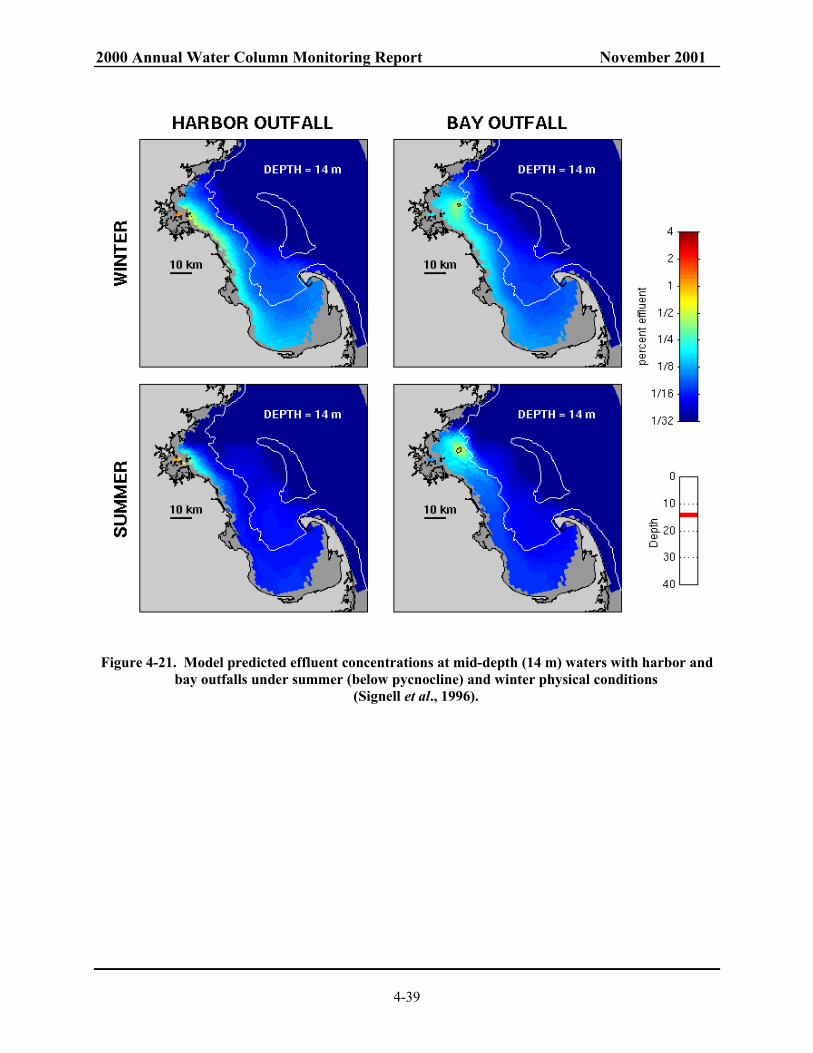
2000 Annual Water Column Monitoring Report November 2001
4-39
Figure 4-21. Model predicted effluent concentrations at mid-depth (14 m) waters with harbor and bay outfalls under summer (below pycnocline) and winter physical conditions
(Signell et al., 1996).

2000 Annual Water Column Monitoring Report November 2001
4-40
1.64
2.38
1.19
1.110.83 1.770.44 0.09 0.23 0.410.150.73 1.00 0.29
0.470.21
0.050.210.01 0.400.77 0.61 0.210.070.17 0.691.85
0.08 0.01 0.99
0.21
0.310.46
0.720.56
0.490.330.84 0.26
0.63
0.201.67 0.79 0.40
0.14
0.29
13
57
911
1315
30
71 0
0' W
70 5
0' W
70 4
0' W
70 3
0' W
70 2
0' W
70 1
0' W
41° 5
0' N
42° 0
0' N
42° 1
0' N
42 2
0' N
42 3
0' N
42 4
0' N
05
1015
20ki
lom
eter
s
Para
met
er: A
mm
oniu
mSa
mpl
ing
Dep
th: S
urfa
ceLa
st S
urve
y D
ay: 1
0/12
/00
Sam
plin
g Ev
ent:
WF0
0EM
inim
um V
alue
0.0
1 µM
at N
03M
axim
um V
alue
2.3
8 µM
at F
23C
onto
ur In
terv
al =
2 µM
0.16
0.53
0.85
1.34
0.23
0.31
14.61
0.02
0.660.39
0.49
0.49
0.85
0.50
0.23
1.35
16.02
0.57
0.09
0.17
0.51
4.34
0.62
0.07
10.45
10.450.56
0.29
13.23
0.74
0.62
0.35
19.92
0.76
0.52
0.41
0.100.06
0.18
0.38
0.38
1.67
0.19
0.30
0.32
0.35
0.45
0.22
13
57
911
1315
30
71 0
0' W
70 5
0' W
70 4
0' W
70 3
0' W
70 2
0' W
70 1
0' W
41° 5
0' N
42° 0
0' N
42° 1
0' N
42 2
0' N
42 3
0' N
42 4
0' N
05
1015
20ki
lom
eter
s
Para
met
er: A
mm
oniu
mSa
mpl
ing
Dep
th: S
urfa
ceLa
st S
urve
y D
ay: 1
0/8/
99Sa
mpl
ing
Even
t: W
F99E
Min
imum
Val
ue 0
.02
µM a
t N05
Max
imum
Val
ue 1
9.92
µM
at F
30C
onto
ur In
terv
al =
2 µM
Figure 4-22. Surface contour of NH4 for farfield survey in October 1999 and October 2000.
(b)
Oct
ober
200
0 (a
) O
ctob
er 1
999

2000 Annual Water Column Monitoring Report November 2001
4-41
1.41
2.29
1.38
1.732.25 2.122.58 0.54 0.16 1.072.234.34 7.86 0.39 1.087.05
0.20
23.12
2.00 0.350.23 0.39 0.250.500.56 1.141.90
0.17 0.23 0.34
0.52
0.640.78
0.610.69
0.741.990.87 0.40
0.86
0.240.84 1.60 0.37
0.93
0.43
13
57
911
1315
30
71 0
0' W
70 5
0' W
70 4
0' W
70 3
0' W
70 2
0' W
70 1
0' W
41° 5
0' N
42° 0
0' N
42° 1
0' N
42 2
0' N
42 3
0' N
42 4
0' N
05
1015
20ki
lom
eter
s
Para
met
er: A
mm
oniu
mSa
mpl
ing
Dep
th: M
id-D
epth
Last
Sur
vey
Day
: 10/
12/0
0Sa
mpl
ing
Even
t: W
F00E
Min
imum
Val
ue 0
.16
µM a
t N11
Max
imum
Val
ue 2
3.12
µM
at N
21C
onto
ur In
terv
al =
2 µM
12.89
0.28
0.06
0.53
0.16
0.89
0.45
0.07
0.36
1.22
0.53
0.53
0.95
15.17
0.44
0.12
0.12
9.72
9.72
0.39
0.39
0.39
0.33
13.39
4.02
0.64
0.370.81
0.06
0.54
0.78
0.41
0.56
0.18
0.67
0.82
0.33
1.03
1.01
4.20
0.59
1.22
1.23
0.38
0.38
19.91
0.51
0.45
13
57
911
1315
30
71 0
0' W
70 5
0' W
70 4
0' W
70 3
0' W
70 2
0' W
70 1
0' W
41° 5
0' N
42° 0
0' N
42° 1
0' N
42 2
0' N
42 3
0' N
42 4
0' N
05
1015
20ki
lom
eter
s
Para
met
er: A
mm
oniu
mSa
mpl
ing
Dep
th: M
id-D
epth
Last
Sur
vey
Day
: 10/
8/99
Sam
plin
g Ev
ent:
WF9
9EM
inim
um V
alue
0.0
6 µM
at N
05M
axim
um V
alue
19.
91 µ
M a
t F30
Con
tour
Inte
rval
=2
µM
Figure 4-23. Mid-depth contour of NH4 for farfield survey in October 1999 and October 2000.
(b)
Oct
ober
200
0 (a
) O
ctob
er 1
999
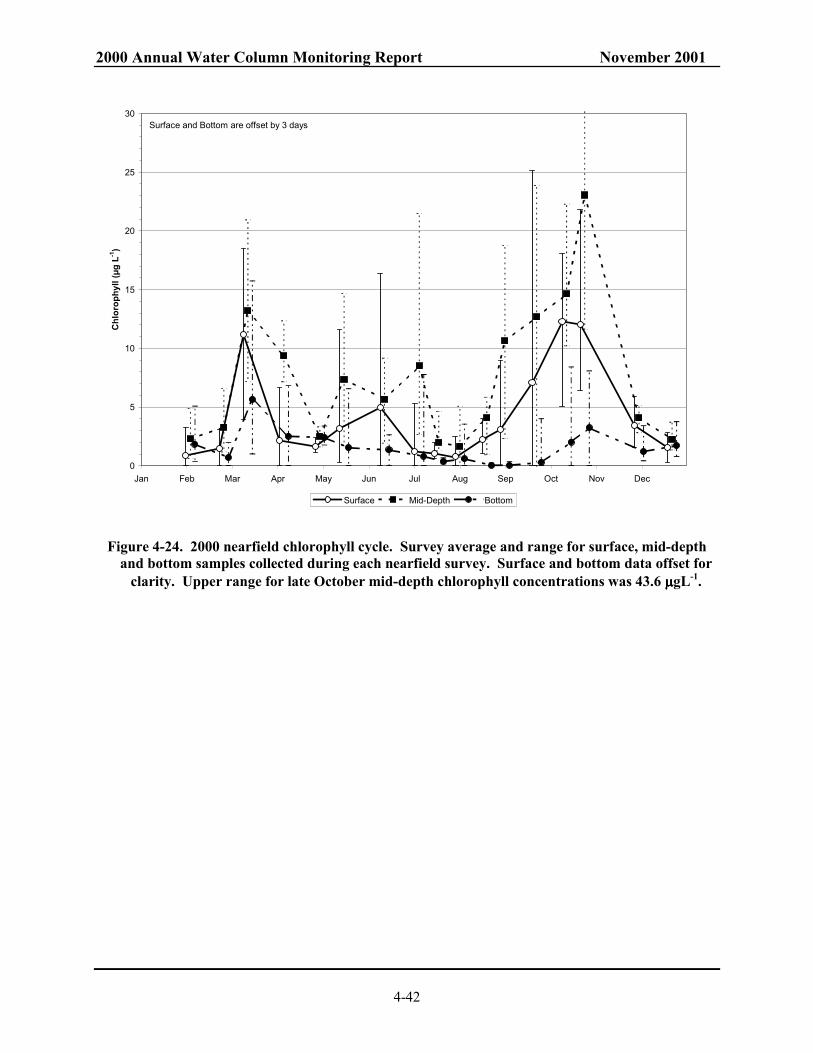
2000 Annual Water Column Monitoring Report November 2001
4-42
Figure 4-24. 2000 nearfield chlorophyll cycle. Survey average and range for surface, mid-depth and bottom samples collected during each nearfield survey. Surface and bottom data offset for
clarity. Upper range for late October mid-depth chlorophyll concentrations was 43.6 µµµµgL-1.
0
5
10
15
20
25
30
Jan Feb Mar Apr May Jun Jul Aug Sep Oct Nov Dec
Chl
orop
hyll
(µg
L-1)
Surface Mid-Depth Bottom
Surface and Bottom are offset by 3 days
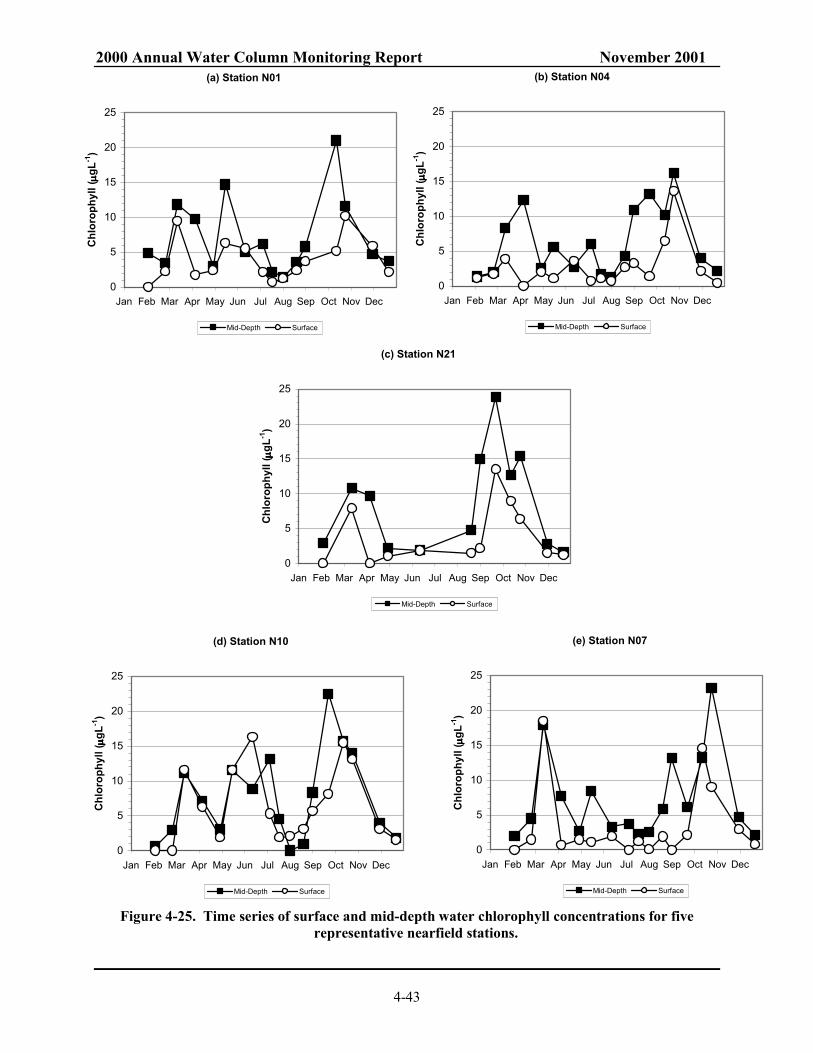
2000 Annual Water Column Monitoring Report November 2001
4-43
Figure 4-25. Time series of surface and mid-depth water chlorophyll concentrations for five representative nearfield stations.
(a) Station N01
0
5
10
15
20
25
Jan Feb Mar Apr May Jun Jul Aug Sep Oct Nov Dec
Chl
orop
hyll
( µµ µµgL
-1)
Mid-Depth Surface
(b) Station N04
0
5
10
15
20
25
Jan Feb Mar Apr May Jun Jul Aug Sep Oct Nov Dec
Chl
orop
hyll
( µµ µµgL
-1)
Mid-Depth Surface
(c) Station N21
0
5
10
15
20
25
Jan Feb Mar Apr May Jun Jul Aug Sep Oct Nov Dec
Chl
orop
hyll
( µµ µµgL
-1)
Mid-Depth Surface
(d) Station N10
0
5
10
15
20
25
Jan Feb Mar Apr May Jun Jul Aug Sep Oct Nov Dec
Chl
orop
hyll
( µµ µµgL
-1)
Mid-Depth Surface
(e) Station N07
0
5
10
15
20
25
Jan Feb Mar Apr May Jun Jul Aug Sep Oct Nov Dec
Chl
orop
hyll
( µµ µµgL
-1)
Mid-Depth Surface
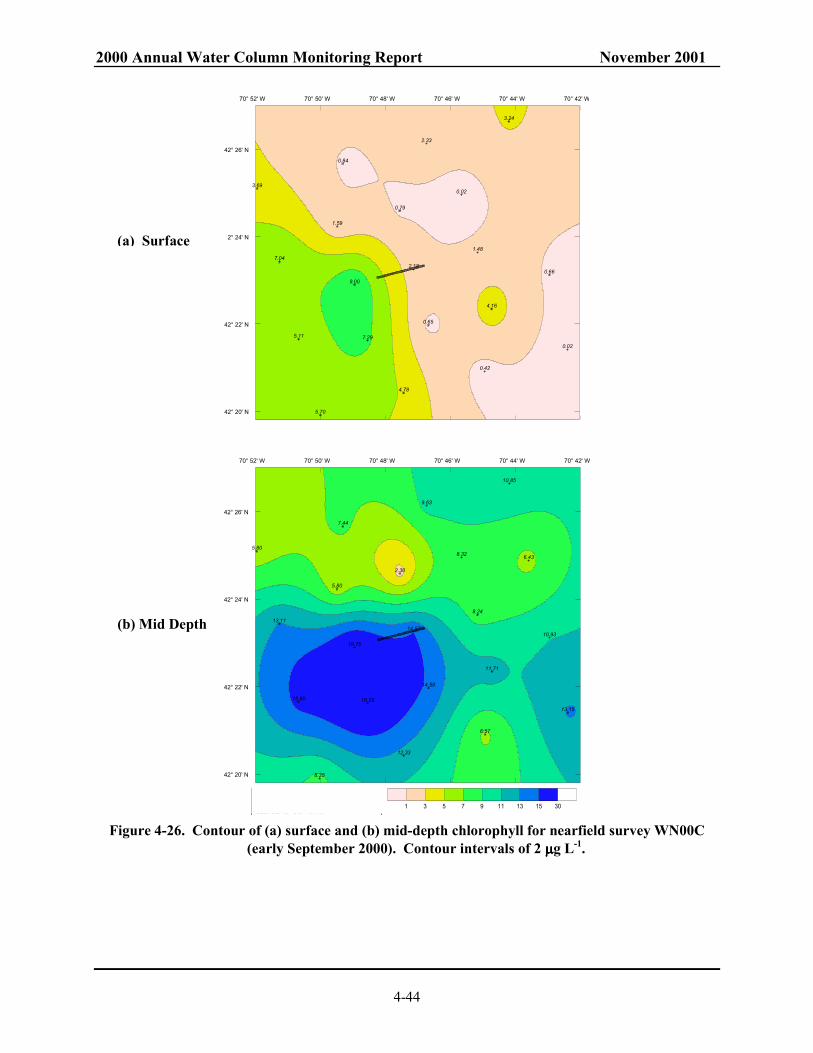
2000 Annual Water Column Monitoring Report November 2001
4-44
4.16
0.66
5.11
4.78
0.42
0.84
1.59
0.02
2.33
7.29
3.24
1.48
0.65
0.79
7.04
0.02
5.70
2.18
9.00
3.69
70° 52' W 70° 50' W 70° 48' W 70° 46' W 70° 44' W 70° 42' W
42° 20' N
42° 22' N
42° 24' N
42° 26' N
8.24
6.57
10.93
6.43
9.63
5.80
12.33
15.60
11.71
14.97
18.25
10.85
18.75
2.30
13.15
13.11
5.80
14.58
8.32
8.35
7.44
1 3 5 7 9 11 13 15 30
70° 52' W 70° 50' W 70° 48' W 70° 46' W 70° 44' W 70° 42' W
42° 20' N
42° 22' N
42° 24' N
42° 26' N
Parameter: FluorescenceSampling Depth: Mid-DepthLast Survey Day: 9/1/00
Figure 4-26. Contour of (a) surface and (b) mid-depth chlorophyll for nearfield survey WN00C (early September 2000). Contour intervals of 2 µµµµg L-1.
(a) Surface
(b) Mid Depth

2000 Annual Water Column Monitoring Report November 2001
4-45
0.96
2.48
6.58
8.14
22.07
5.22
11.96
13.53
2.60
25.13
3.44
2.16
1.65
14.41
1.38
1.74
2.42
70° 52' W 70° 50' W 70° 48' W 70° 46' W 70° 44' W 70° 42' W
42° 20' N
42° 22' N
42° 24' N
42° 26' N
9.14
11.97
13.75
6.88
18.99
10.09
11.61
12.37
13.22
23.85
23.33
22.49
9.18
6.16
20.83
14.43
12.41
1 3 5 7 9 11 13 15 30
70° 52' W 70° 50' W 70° 48' W 70° 46' W 70° 44' W 70° 42' W
42° 20' N
42° 22' N
42° 24' N
42° 26' N
Parameter: FluorescenceSampling Depth: Mid-DepthLast Survey Day: 9/22/00
Figure 4-27. Contour of (a) surface and (b) mid-depth chlorophyll for nearfield survey WN00D (late September 2000). Contour intervals of 2 µµµµg L-1.
(a) Surface
(b) Mid Depth
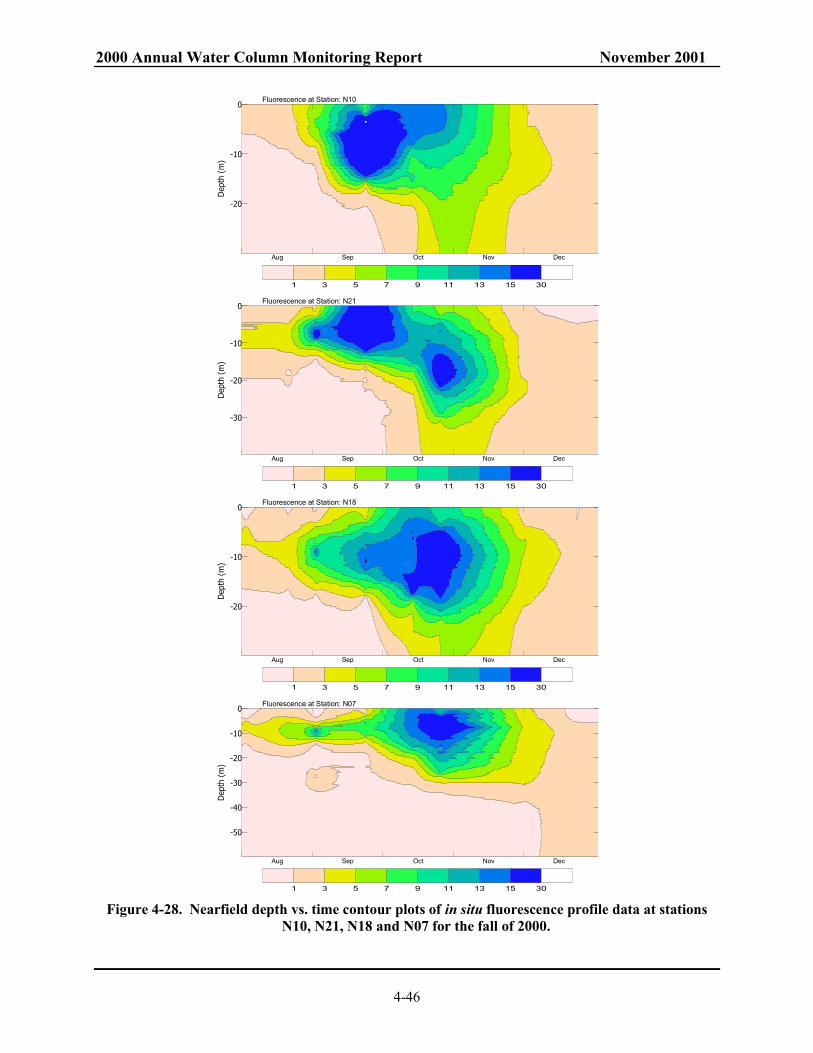
2000 Annual Water Column Monitoring Report November 2001
4-46
-20
-10
0
Dep
th (
m)
1 3 5 7 9 11 13 15 30
Aug Sep Oct Nov Dec
Fluorescence at Station: N10
-30
-20
-10
0
Dep
th (
m)
1 3 5 7 9 11 13 15 30
Aug Sep Oct Nov Dec
Fluorescence at Station: N21
-20
-10
0
Dep
th (
m)
1 3 5 7 9 11 13 15 30
Aug Sep Oct Nov Dec
Fluorescence at Station: N18
-50
-40
-30
-20
-10
0
Dep
th (
m)
1 3 5 7 9 11 13 15 30
Aug Sep Oct Nov Dec
Fluorescence at Station: N07
Figure 4-28. Nearfield depth vs. time contour plots of in situ fluorescence profile data at stations
N10, N21, N18 and N07 for the fall of 2000.

2000 Annual Water Column Monitoring Report November 2001
4-47
Figure 4-29. Monthly composite of SeaWiFS chlorophyll images for the southwestern Gulf of Maine for September and October 2000 [J. Yoder (URI) and J. O’Reilly (NOAA)].

2000 Annual Water Column Monitoring Report November 2001
4-48
Figure 4-30. Time-series of mean chlorophyll concentrations in Massachusetts and Cape Cod Bays. Data collected from all depths and all stations in the six areas.
Survey Mean Chlorophyll
0
2
4
6
8
10
12
14
Jan Feb Mar Apr May Jun Jul Aug Sep Oct Nov Dec
Chl
orop
hyll
( µµ µµg
L-1)
Nearfield Boston Harbor Boundary Cape Cod Coastal Offshore

2000 Annual Water Column Monitoring Report November 2001
4-49
7.68
8.16
9.86
13.19
15.5114.59
16.8216.8216.82
5.88
13.56
5.00
5.345.34
7.59
6.15
7.59
13.23
15.328.95
5.13
13.64
6.86
13.67
5.20
11.08
4.37
6.47
8.05
9.26
14.62
6.49
4.37
7.468.058.05
5.94
5.31
7.49
12.46
14.54
3.183.183.18
16.03
17.5917.59
9.819.81
14.64
18.11
4.7915.41
12.33
12.74
17.69
16.32
1 3 5 7 9 11 13 15 30
71° 00' W 70° 50' W 70° 40' W 70° 30' W 70° 20' W 70° 10' W
41° 50' N
42° 00' N
42° 10' N
42° 20' N
42° 30' N
42° 40' N
0 5 10 15 20kilometers
Parameter: FluorescenceSampling Depth: SurfaceLast Survey Day: 10/12/00Sampling Event: WF00EMinimum Value 3.18 µg/L at F22Maximum Value 18.11 µg/L at N11Contour Interval =2 µg/L
Figure 4-31. Surface contour of chlorophyll concentrations for farfield survey in October 2000.

2000 Annual Water Column Monitoring Report November 2001
4-50
Figure 4-32. Annual nearfield chlorophyll cycle for each year of baseline monitoring 1992 to 2000. Mean of data from all depths at all nearfield stations. 2000 data are in bold.
Survey Mean Chlorophyll
0
2
4
6
8
10
12
14
Jan Feb Mar Apr May Jun Jul Aug Sep Oct Nov Dec
Chl
orop
hyll
( µµ µµg
L-1)
1999
1995
1993

2000 Annual Water Column Monitoring Report November 2001
4-51
Figure 4-33. Annual mean chlorophyll in Massachusetts and Cape Cod Bays. (a) Mean of chlorophyll concentrations from all depths, all stations and all surveys in the six areas and (b) Areal mean based on downcast profile data from all stations and all surveys in the six areas.
(a) Annual Mean Chlorophyll Concentrations
0
1
2
3
4
5
6
7
8
1992 1993 1994 1995 1996 1997 1998 1999 2000
Year
Chl
orop
hyll
( µµ µµg
L-1)
Nearfield Boston Harbor Boundary Cape Cod Coastal Offshore
(b) Annual Mean Areal Chlorophyll
0
20
40
60
80
100
120
140
160
180
1992 1993 1994 1995 1996 1997 1998 1999 2000
Year
Chl
a (m
g m
-2)
Nearfield Boston Harbor Boundary Cape Cod Coastal Offshore

2000 Annual Water Column Monitoring Report November 2001
4-52
Figure 4-34. Monthly composite of SeaWiFS chlorophyll images for the southwestern Gulf of Maine for September and October in 1997 to 2000 [J. Yoder (URI) and J. O’Reilly (NOAA)].

2000 Annual Water Column Monitoring Report November 2001
4-53
Figure 4-35. 2000 nearfield DO cycle (a) DO concentration and (b) DO %saturation. Survey average and range for surface, mid-depth and bottom samples collected during each nearfield
survey. Caution and warning thresholds and proposed background values are marked for comparison.
(a) DO Concentration
5
6
7
8
9
10
11
12
13
14
Jan Feb Mar Apr May Jun Jul Aug Sep Oct Nov Dec
DO
(mg
L-1)
Surface Mid-Depth Bottom Caution W arning
Surface and Bottom are offset by 3 days
(b) DO %saturation
60
70
80
90
100
110
120
130
140
150
160
Jan Feb Mar Apr May Jun Jul Aug Sep Oct Nov Dec
Dis
solv
ed O
xyge
n (%
sat)
Surface Mid-Depth Bottom Caution Warning
Surface and Bottom are offset by 3 days

2000 Annual Water Column Monitoring Report November 2001
4-54
Figure 4-36. Time-series of average bottom dissolved oxygen concentration for 2000 in (a) Massachusetts and Cape Cod Bays (data collected from all depths and all stations in the five
farfield areas) and (b) Stellwagen Basin (data collected from all depths at stations F12, F17, F19 and F22).
(a) Farfield DO Concentration
5
6
7
8
9
10
11
12
13
14
Jan Feb Mar Apr May Jun Jul Aug Sep Oct Nov Dec
DO
(mgL
-1)
Boston Harbor Boundary Cape Cod Coastal Offshore
(b) Stellwagen Basin DO Concentration
5
6
7
8
9
10
11
12
13
14
Jan Feb Mar Apr May Jun Jul Aug Sep Oct Nov Dec
DO
(mgL
-1)
Bottom Surface
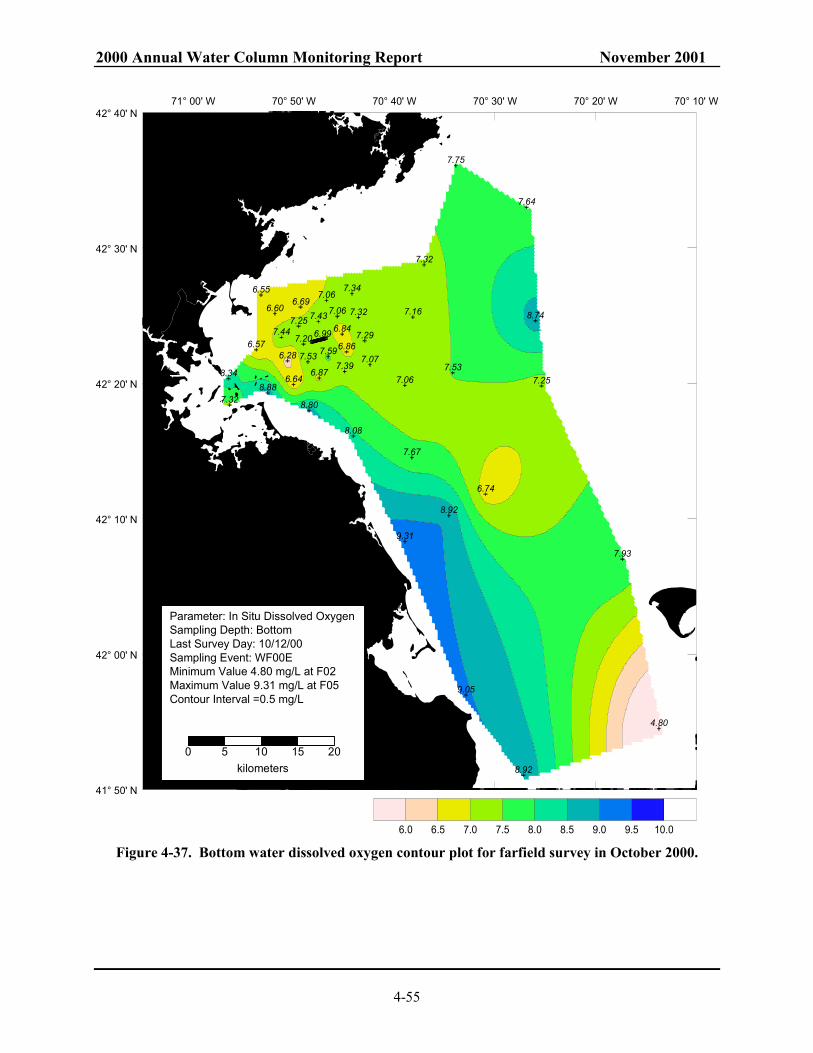
2000 Annual Water Column Monitoring Report November 2001
4-55
7.43
6.74
9.31
8.34 7.53
8.80
7.39
7.06
7.32
7.447.20
8.88
7.166.60
7.53
4.80
7.34
9.05
6.28
7.32
6.84
6.57 6.86
7.32
7.256.64
7.75
6.99
7.64
7.07
6.69
8.92
7.25
6.55
8.92
7.29
8.74
7.93
6.87
8.08
7.06
7.06
7.59
7.67
6.0 6.5 7.0 7.5 8.0 8.5 9.0 9.5 10.0
71° 00' W 70° 50' W 70° 40' W 70° 30' W 70° 20' W 70° 10' W
41° 50' N
42° 00' N
42° 10' N
42° 20' N
42° 30' N
42° 40' N
0 5 10 15 20kilometers
Parameter: In Situ Dissolved OxygenSampling Depth: BottomLast Survey Day: 10/12/00Sampling Event: WF00EMinimum Value 4.80 mg/L at F02Maximum Value 9.31 mg/L at F05Contour Interval =0.5 mg/L
Figure 4-37. Bottom water dissolved oxygen contour plot for farfield survey in October 2000.

2000 Annual Water Column Monitoring Report November 2001
4-56
Figure 4-38. Interannual dissolved oxygen concentration cycle in (a) nearfield and (b) Stellwagen Basin. Mean and minimum bottom data from each survey at all stations. Caution (6.5 mgL-1)
and warning (6 mgL-1) thresholds are marked for comparison. Proposed background values for the nearfield and Stellwagen Basin are also included (5.75 and 6.2 mgL-1, respectively).
(b) Stellwagen Basin DO
4
5
6
7
8
9
10
11
12
13
1992 1993 1994 1995 1996 1997 1998 1999 2000
DO
(mg
L-1)
Mean Minimum Caution Warning Background
(a) Nearfield DO
4
5
6
7
8
9
10
11
12
13
1992 1993 1994 1995 1996 1997 1998 1999 2000
DO
(mg
L -1 )
Mean Minimum Caution Warning Background

2000 Annual Water Column Monitoring Report November 2001
4-57
Figure 4-39. Interannual dissolved oxygen % saturation cycle in (a) nearfield and (b) Stellwagen Basin. Mean and minimum bottom data from each survey at all stations. Caution (80%) and warning (75%) thresholds are marked for comparison. Proposed background values for the
nearfield and Stellwagen Basin are also included (64.3% and 66.3%, respectively)
(a) Nearfield DO %SAT
40
50
60
70
80
90
100
110
120
1992 1993 1994 1995 1996 1997 1998 1999 2000
DO
%SA
T
Mean Minimum Caution Warning Background
(b) Stellwagen Basin DO %SAT
40
50
60
70
80
90
100
110
120
1992 1993 1994 1995 1996 1997 1998 1999 2000
DO
%SA
T
Mean Minimum Caution Warning Background

2000 Annual Water Column Monitoring Report November 2001
5-1
5.0 PRODUCTIVITY AND RESPIRATION
5.1 Productivity Production measurements were made at two nearfield stations (N04 and N18) and one farfield station (F23) near the entrance of Boston Harbor. Station N04, an outer nearfield station has been monitored for phytoplankton production since 1992 and it is an important historical reference site, although the methods used did not become constant and comparable until 1995. Station N18, located 1.5 km south of the outfall site has been monitored since 1997 when it was included in the survey because it is in a region potentially influenced by effluent from the bay outfall. Both N04 and N18 were visited 17 times over the 2000 season for measuring production. Phytoplankton production at the Boston Harbor outer edge station, F23, was measured 6 times over the annual cycle in 2000. F23 has traditionally been sampled less frequently than the high-density nearfield productivity stations. Samples were collected at five depths throughout the euphotic zone and incubated in temperature-controlled incubators. After collection of the productivity samples, they were returned to the Marine Ecosystems Research Laboratory (MERL) in Rhode Island. 14C production was determined using standard procedures (e.g., Strickland and Parsons 1972). Chlorophyll concentrations presented and used for calculations in this section are extracted chlorophyll values. Details on the methods used for measuring and calculating production are provided in Albro et al. 1998 and Libby et al. 1999. Production data for 2000 have been presented in detail in the semi annual report appendices (Libby et al. 2000a and 2001).
5.1.1 Nearfield Production In 2000, the nearfield stations (N04 and N18) and the Boston Harbor station (F23) exhibited similar patterns in the seasonal cycle of primary productivity (Figure 5-1). This is a departure from past surveys where station F23 has generally been characterized by a seasonal productivity cycle markedly different from the nearfield sites. Areal production in 2000 at the nearfield sites (N04 and N18) was characterized by both spring and fall blooms. Although a spring bloom was absent in 1998, spring and fall blooms generally occur at these stations. Station N18 was further characterized by a major mid-summer bloom, which did not occur at either station N04 or F23. The bloom periods exhibited an average 2-4-fold increase in productivity compared to non-bloom periods (late spring, summer and late fall). Areal production at the nearfield stations was relatively low (< 500 mg C m-2 d-1) during the initial survey in early February. Values increased at both nearfield sites to major production peaks by mid March. At station N18, the peak spring production (4017 mg C m-2 d-1) occurred at this time, after which productivity decreased somewhat during the fourth survey (1 April 2000). At station N04, productivity increased slightly from mid-March to 1 April 2000 with the peak spring productivity (2882 mg C m-2 d-1) observed during at that time. At both stations, the timing and duration of the spring blooms in production were similar; however the peak productivity at station N18 was considerably higher. The spring bloom in 2000 was initially a mixed diatom/Phaeocystis pouchetii bloom in March but by early April was numerically dominated by Phaeocystis pouchetii. Although most spring blooms in Massachusetts Bay have been diatom dominated, Phaeocystis blooms have occasionally occurred, most recently in 1997. The magnitude of the spring bloom in 2000 at station N04 was similar to that observed in other years (with the exception of 1998). The peak spring productivity at station N18 in 2000 was among the highest on record over the period having comparable methods(1995-2000). The end of the winter-spring bloom period coincided with the onset of stratification and the depletion of nutrients in the surface waters.
Following the spring bloom, areal productivity dropped to ~480-650 mg C m-2 d-1 in May at both nearfield sites. Productivity at station N04 remained moderate (~1000 to 1600 mg C m-2 d-1) throughout the summer (May through August). However, at station N18, productivity gradually increased from May to early July when a major summer productivity peak was observed (4000 mg C

2000 Annual Water Column Monitoring Report November 2001
5-2
m-2 d-1). Areal production was at its peak summer value (~1600 mg C m-2 d-1) for station N04 in mid-July. During the stratified summer period both sites were dominated by microflagellates, however the abundance at N18 was twice that at N04.
Productivity at both sites was moderate and similar during August (<2000 mg C m-2 d-1) but diverged somewhat in September. Both stations exhibited fall blooms, however, the timing and magnitude of the blooms differed. At station N04 a bimodal fall bloom was observed. Areal productivity increased to ~2400 mg C m-2 d-1 on 22 September, dropped to ~675 mg C m-2 d-1 on 5 October then increased to a second peak of ~2400 mg C m-2 d-1 by 24 October. At station N18 productivity increased to ~4000 mg C m-2 d-1 on 1 September then climbed to the highest value recorded during 2000 (~5000 mg C m-2 d-1) on 22 September. The elevated productivity observed at station N18 on 22 September 2000 is comparable to the highest value (5024 mg C m-2d-1 at N18 in October 1997) observed throughout the 1995-2000 period in the nearfield. Another high value (5053 mg C m-2d-1) was measured at station N10 in April 1996. This station is often influenced by tidal exchange with Boston Harbor and is not indicative of nearfield conditions.
The elevated productivity at station N18 was recorded during the first cruise following the 6 September 2000 start-up of the sewage outfall and was the cause of some initial concern. Station N18 is the productivity station closest to the outfall and any effects from sewage-derived nutrients would be detected here first. However, the increase in productivity was minor relative to some years and productivity at N18 was lower than N04 on subsequent dates. The patterns observed at the nearfield sites were consistent with those observed during prior years although the timing of events varied. The elevated productivity during the fall bloom at the nearfield sites coincided with increased abundance of chain-forming diatoms such as Leptocylindrus danicus, Rhizosolenia setigera, Guinardia delicatula, and Chaetoceros debilis.
Productivity at station N18 (and also N16 where productivity was measured pre-1997) is generally greater than that observed at station N04. The elevated production at station N18 in September of 2000 is similar to that observed in August 1999. In both cases the productivity peak at N18 was greater than the maximum productivity recorded at station F23, at the outer edge of Boston Harbor, throughout the seasonal cycle. This continues a trend first noted in 1997. In 1995 and 1996, the highest areal productivity values were recorded at station F23. Beginning in 1997, the highest areal productivity measurements over the annual cycle were recorded in the central nearfield region (station N18) rather than in Boston Harbor.
Areal production at stations N04 and N18 was similar for the remainder of the 2000 monitoring period. Production decreased during the late November survey then reached its lowest annual level in December at station N18 and its second lowest value of the year at station N04. The fall productivity pattern observed in 2000 was similar to that observed in prior years, although peak values were somewhat elevated at station N18. The duration of the fall bloom was also similar to that observed in prior years.
The vertical distribution of primary productivity (mg C m-3 d-1) over the annual cycle at stations N04 and N18 indicated that the majority of production was occurring in the upper 10 m of the water column at both stations (Figures 5-2 and 5-3). The spring peak in areal productivity, initially observed in mid-March at both stations N04 and N18, was concentrated in the surface water. In early April, the peak productivity at both stations was at the mid-surface depth, with a well-developed productivity maximum observed at station N04 (Figure 5-2). For both stations N04 and N18, the highest winter-spring production values observed (>200 mg C m-3 d-1) occurred at the mid-surface depth in early April. Surface production, at the nearfield stations, tended to decrease following the spring peak values but increased again in July at station N18 (Figure 5-3).
A subsurface (5-10 m) productivity maximum was measured at station N18 in July. However, no subsurface production maximum was observed at station N04 during the July survey (Figures 5-2 and

2000 Annual Water Column Monitoring Report November 2001
5-3
5-3). Subsurface productivity maxima tended to occur at both station N04 and N18 during June and July 1999.
The volumetric data reveal that increased areal productivity at station N04 during late September, was the result of elevated production (>100 mg C m-3 d-1) in the surface and mid-surface waters, at depths less than 10 m (Figure 5-2). The elevated areal productivity during early September at station N18 was concentrated in the upper 5-8 m of the water column (Figure 5-3). At station N18, the annual productivity peak occurred in late-September and was distributed throughout the upper 10 m of the water column with values from the surface to mid-depth samples ranging from ~200-550 mg C m-3 d-1 (Figure 5-3). At the two nearfield stations, surface production tended to decrease following the late summer-early fall peak values, but increased again in late October at Station N04. For station N04, the highest production values observed (~250 mg C m-3 d-1) occurred at the surface in late October. For station N18, the highest production values observed (~500 mg C m-3 d-1) were recorded at mid-depth (5.1 m) in July 2000 and again at the surface (1.7 m) on 22 September 2000. Peak production values tended to be correlated with the occurrence of the highest chlorophyll a measurements.
The subsurface (4.5 – 7.75 m) productivity maximum measured at station N18 in early September was a major component of the elevated areal productivity recorded. Station N04 did not exhibit a subsurface elevation in productivity, thus accounting for the wide difference in areal production between the nearfield sites during the 1 September 2000 survey. Elevated surface production was observed at station N04 during the late October survey, but not at station N18. The productivity pattern at specified depths observed in 2000 was similar to that observed in prior years. At station N04, productivity >10 mg m-3 d-1 was rarely observed at depths deeper than 25 m. At station N18, productivity as high as 40 mg C m-3 d-1 was frequently recorded at depths of ~15 m with values from 60-120 mg C m-3 d-1 occasionally observed there.
The annual pattern of average chlorophyll (Figure 5-4) for the nearfield stations N04 and N18 followed the pattern observed for areal production. The winter-spring phytoplankton bloom resulted in elevated phytoplankton biomass during the bloom period and increased subsurface chlorophyll accumulation in approximately two weeks (Figures 5-4, 5-5 and 5-6). The higher productivity observed during the spring bloom period at station N18 was reflected in higher biomass values. The chlorophyll concentrations during July 2000 were markedly different between the nearfield sites with the elevated production observed at station N18 during this period reflected in elevated biomass (>8 µg l-1). The magnitude of the fall chlorophyll peaks was similar at both stations. The fall bloom represented a 2 - 4-fold increase in biomass relative to summer values (Figure 5-4).
Average chlorophyll values for station N04 and N18 (Figure 5-4) and the vertical distribution of chlorophyll (Figures 5-5 and 5-6) indicated that chlorophyll concentrations were elevated in the spring and fall periods and that subsurface chlorophyll maxima were typical during most periods of elevated phytoplankton biomass. Particularly well-developed sub-surface chlorophyll maxima were associated with the fall phytoplankton bloom. At station N18, elevated chlorophyll values were observed at all depths (surface through bottom samples, maximum depth ~25 m) during the fall bloom. At station N04, high chlorophyll values also occurred to a depth of 25 m, but because of the greater water column depth at this eastern nearfield station high chlorophyll concentrations were confined to the upper half of the water column.
5.1.2 Harbor Production At the Boston Harbor productivity/respiration station (F23), areal production was measured six times from February through October 2000 (Figure 5-1). Production ranged from a low of ~150 mg C m-2 d-1 in early February to a peak value of ~4400 mg C m-2 d-1 in April 2000. Production declined in June to ~450 mg C m-2 d-1 and remained low in August. This pattern is markedly different from most years when productivity continued to increase at station F23 during the summer. In October, production was somewhat greater than August but did not display the elevated levels that were

2000 Annual Water Column Monitoring Report November 2001
5-4
observed at the two nearfield sites (Figure 5-1). The production data are not in agreement with the chlorophyll data (Figure 5-4) at station F23. The annual peak in chlorophyll occurred in October while peak production occurred during spring at the harbor station.
Because of the low temporal resolution, samples were collected at station F23 during the winter-spring bloom but not the fall bloom period at the nearfield sites. In 1999, both the peak spring and fall period were sampled. Unlike prior years, the harbor exhibited a predominant spring bloom, rather than a pattern of gradually increasing production from spring through summer. The vertical distribution of primary productivity (mg C m-3 d-1) at station F23 indicated that production occurred primarily in the upper 10 m of the water column (Figure 5-7) throughout the annual cycle. Peak productivity (~600 mg C m-3 d-1) during the spring bloom occurred in the surface waters (1.9 m) with high productivity (>100 mg C m-3 d-1) extending downwards to mid-depth. In the fall production occurred primarily in the upper 5 m of the water column, and at lower rates relative to spring. Phytoplankton abundance during the spring bloom in the harbor, as in the nearfield, was numerically dominated by Phaeocystis pouchetii. The summer and fall periods were dominated by microflagellates and cryptomonads with diatoms subdominant.
At the outer edge of the harbor (station F23) (Figure 5-4) average chlorophyll concentrations were somewhat elevated in the spring (7-8 µg l-1) but reached peak annual abundance (~14 µg l-1) in fall (October). Chlorophyll was very low during the initial surveys (0.8 – 1.6 µg l-1). Within the harbor (Figure 5-8), chlorophyll was differentially distributed throughout the water column during the spring bloom period (April), with high values in both the upper 10 m and at depth. The contour plots of production versus biomass suggest that the subsurface chlorophyll did not contribute significantly to areal production during the spring bloom. During the period of peak annual biomass in October, chlorophyll was evenly distributed throughout the water column.
5.1.3 Chlorophyll-Specific Production Depth-averaged chlorophyll-specific production (Figure 5-9, shown in comparison with areal production for all stations) exhibited both spring (April) and summer (July) peaks at stations N04 and N18. Chlorophyll-specific production is an approximate measure for the efficiency of production. The distribution of chlorophyll-specific production indicates that the efficiency of production was high relative to the amount of biomass present at the nearfield stations, particularly prior to the fall period. At both stations N04 and N18 the peak chlorophyll-specific production occurred in mid-July during a period of relatively low productivity and biomass. Efficiency of production was highest at the harbor site relative to biomass during the spring-bloom period, however this pattern was most likely constrained by the limited sampling over the annual cycle. At the nearfield sites, the late-spring peaks observed in chlorophyll-specific areal production occurred during, and just after, a period of elevated areal production (the winter-spring bloom) and phytoplankton biomass (Figure 5-4). By contrast, the late summer peaks preceded a period of increased areal production and elevated chlorophyll a at station N18 and N04.
As in prior years, depth-averaged chlorophyll-specific production was similar at both nearfield sites (station N04 and N18) over time (Figure 5-9). Depth-averaged chlorophyll-specific production was relatively low at the start of the sampling period then gradually increased at both stations until spring peaks were reached during the early-April survey (19-36 mg C mg Chl a-1 d-1). Values remained elevated through early-May then gradually declined in June and early-July. Seasonal maxima (27-39 mg C mg Chl a-1 d-1) occurred in mid-July at both sites and remained elevated during early August. Following these peak values, depth-averaged chlorophyll-specific production decreased to less than 14 mg C mg Chl a-1 d-1 in mid-August 2000. Chlorophyll-specific productivity remained low at both stations until the seasonal minima were reached during the early October survey. Values then gradually climbed to between 2-12 mg C mg Chl a-1 d-1 for the remainder of the sampling period.

2000 Annual Water Column Monitoring Report November 2001
5-5
With the exception of the spring peak (22 mg C mg Chl a-1 d-1), depth-averaged chlorophyll-specific production was relatively low (2-15 mg C mg Chl a-1 d-1) at station F23 over the annual cycle.
Contour plots summarized the spatial and temporal distribution of chlorophyll-specific production on a volumetric basis over the sampling period (Figures 5-10 to 5-12). Chlorophyll-specific production can be used as an indicator of the optimal conditions necessary for photosynthesis. Chlorophyll-specific daily production was concentrated in the upper 10 m of the water column at station N04 during the sampling cycle (Figure 5-10). Peak values were observed in the upper 5-m during the mid-summer period. During the spring and early summer moderate production per unit chlorophyll (8-15 mg C mg Chl a-1 d-1) was observed at depths of 10-25 m but not during the late summer and fall at station N04. Chlorophyll-specific production was relatively low at all depths greater than 25 m.
Chlorophyll-specific production at station N18 was also concentrated in the upper portions of the water column (Figure 5-11). Peak chlorophyll-specific production occurred in the upper 5-8 m of the water column similar to observations recorded at station N04. Elevated chlorophyll-specific productions occurred during April and mid-July at station N18. The observed pattern at station N18 suggests that the efficiency of photosynthesis continued to be relatively high and variable throughout the spring and early summer then declined again during the late summer period of low nutrients and stratification. Efficiency increased again in the fall. When the efficiency of photosynthesis is high but not reflected in higher phytoplankton biomass (measured as total chlorophyll a) it suggests that other processes (such as predation by zooplankton) were important in controlling the patterns observed.
At station F23, chlorophyll-specific production was concentrated in the upper 10 m throughout the annual cycle (Figure 5-12). Chlorophyll-specific production was elevated during the spring period of peak phytoplankton production at this station. There was some evidence of increased phytoplankton efficiency during the fall bloom period as well at this station.
5.1.4 Potential Production Potential production for a cloudless day was calculated for each day production was measured and at all five depths. Figure 5-13 provides examples of the daily photosynthetically active irradiance on both the sampling day and a cloudless day close in time to the day of sampling for the first six surveys. Daily light was highly variable because of clouds as expected. Light ranged from being relatively low (cloudy) as on 3 February and 27 February to close to that expected on a cloudless day as on 1 April and 17 May. When the daily light field for a cloudless day was substituted for the observed cloudy-day light field it was possible to determine the potential (or maximum) production for each sample period. Figure 5-14 shows the potential daily production (mg C m-3 d-1) for each station and depth over the annual cycle. The seasonal pattern closely followed that observed for daily production suggesting that no major production peaks were missed because of dense cloud cover. For station N04 the spring and fall blooms remained the dominant features of the annual cycle. For station N18, the late summer production peak dominated the seasonal cycle but the spring and fall bloom periods were also very well represented. Similarly for station F23, the gradual increase to a seasonal spring production peak followed by a decline was observed.
The potential and measured areal productions (mg C m-2 d-1) are compared over the seasonal cycle for each station in Figure 5-15. Although potential production was approximately 40% greater than measured production on some dates (5 October) the over all pattern was very similar. By chance, cloudy days tended to occur during periods of relatively low productivity. Potential annual production (g C m-2 y-1) at each station was 32 - 47 g C m-2 y-1 greater than measured production (see inset on Figure 5-15 with higher values being the annual potential productivity).

2000 Annual Water Column Monitoring Report November 2001
5-6
5.1.5 P-I Curve Parameters The response of phytoplankton to changes in their physical environment is frequently characterized by indices of photoadaptation of the phytoplankton populations. Two such indices are α [mg C m-3 hr-1 (µE m-2 s-1)-1] or αB [mg C (mg Chl a)-1 hr-1 (µE m-2 s-1)-1] and Pmax (mg C m-3 hr-1) or PB
max (mg C mg Chl a-1 hr-1), the parameters derived from the photosynthesis versus irradiance curves. The utility of α B and PB
max for comparing phytoplankton populations was demonstrated by Harrison and Platt (1980) who showed that the parameters were sensitive to a wide range of environmental variables. Cote and Platt (1984) also demonstrated that the effects of transient physical phenomena, such as storms and periods of upwelling are reflected in changes in photosynthetic parameters. Changes in these indices may thus define response to a dynamically changing physical environment.
Examination of α [mg C m-3 hr-1 (µE m-2 s-1)-1] and αB [mg C (mg Chl a)-1 hr-1 (µE m-2 s-1)-1] over the season (Figures 5-16 and 5-17) revealed some interesting differences. The time series data for nearfield stations N04 and N18 (Figure 5-16) clearly demonstrated the tendency for α to vary with primary productivity over the seasonal cycle. There was a marked 3-4-fold increase in α at the time of the spring and fall blooms at both stations. Additionally, station N18 shows a marked increase during the July period of elevated production. During the fall bloom period, as well as at other times of the year, there was a tendency for α to decrease with depth. A similar tendency has been noted in previous years (Libby et al. 1999). At station F23, α showed similar variability over the annual cycle, with a 2-4 fold increase in April during the period of peak productivity. Interestingly, α did not tend to decrease at depth at station F23 but was relatively constant throughout the water column.
By contrast, αB (Figure 5-17) was characterized by elevated values during spring and mid-summer at the nearfield sites and closely followed the seasonal pattern observed for chlorophyll-specific production. The previously observed tendency for decreasing values of α with depth was not as consistent when α was normalized to biomass. At station F23, αB was elevated during the spring period of peak production.
Similar contrasts exist when the seasonal values for Pmax (mg C m-3 hr-1) and PBmax (mg C mg Chl a-1
hr-1) are compared (Figures 5-18 and 5-19). Pmax essentially followed the seasonal patterns observed for both production at depth (mg C m-3 d-1) and areal production (mg C m-2 d-1) (Figure 5-1). At the nearfield sites, Pmax exhibited seasonal peaks during the spring and fall bloom periods, as well as a marked increase at station N18 during the July production maximum. The seasonal pattern was also very similar to that observed for α (Figure 5-16). Additionally Pmax also displayed a tendency to vary with depth. At station F23, the observed time series for Pmax was very similar to the seasonal pattern observed for areal productivity at that site (Figure 5-1).
PBmax was less variable over the seasonal cycle than either Pmax or αB at the nearfield stations (Figure
5-19). At station N04, PBmax was relatively constant from February through June and again from mid-
August through December. Major peaks occurred during mid-July and early August but were confined to the surface and mid-surface water only. At station N18, peaks were somewhat more frequent but generally included only the surface and mid-surface depths as well. At station F23, the biomass-normalized values for Pmax varied with depth and over the annual cycle. The seasonal changes in magnitude of the P-I curve parameters were greater at station F23 compared with the nearfield stations. At the nearfield sites and the harbor station, the spring increase in photosynthetic indices is most likely tied to improved light availability as the season progresses. Increases at other times of the year were related to improved nutrient availability either as a result of coastal upwelling or the breakdown of stratification in the fall (station N04 and N18).
Because of the close similarity in the station-specific seasonal patterns between α and Pmax, we regressed the estimated parameters of the P-I curves against each other to examine the strength of the
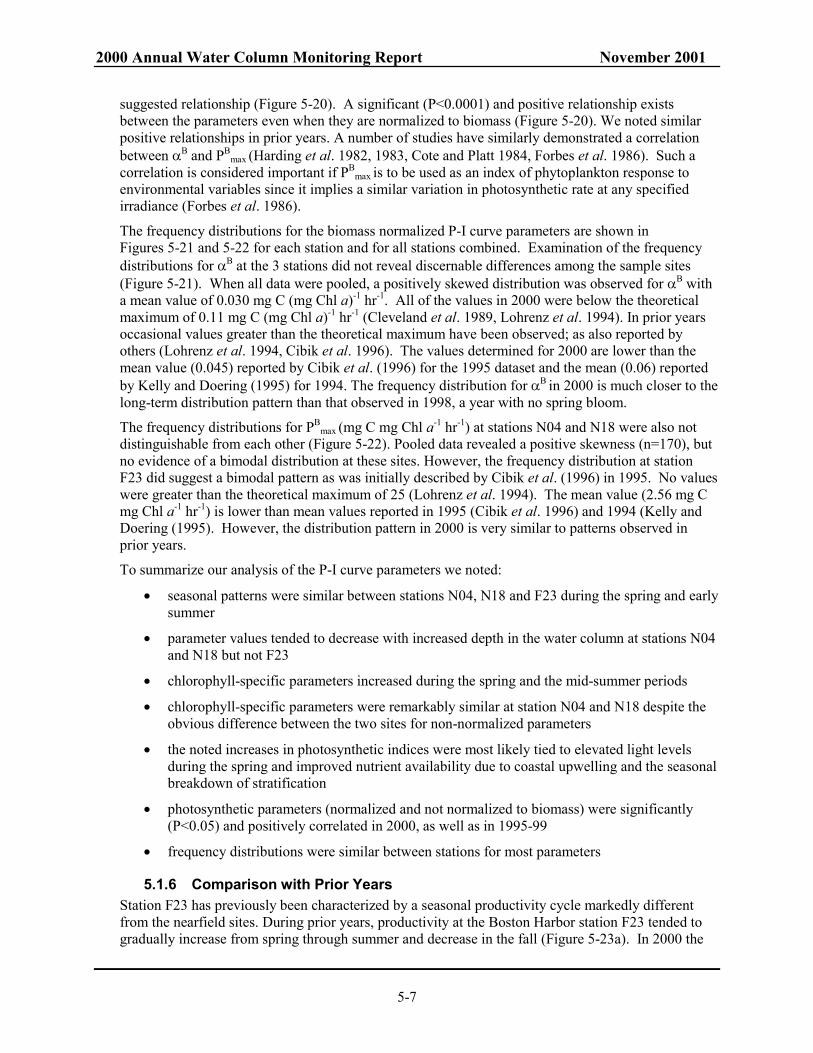
2000 Annual Water Column Monitoring Report November 2001
5-7
suggested relationship (Figure 5-20). A significant (P<0.0001) and positive relationship exists between the parameters even when they are normalized to biomass (Figure 5-20). We noted similar positive relationships in prior years. A number of studies have similarly demonstrated a correlation between αB and PB
max (Harding et al. 1982, 1983, Cote and Platt 1984, Forbes et al. 1986). Such a correlation is considered important if PB
max is to be used as an index of phytoplankton response to environmental variables since it implies a similar variation in photosynthetic rate at any specified irradiance (Forbes et al. 1986).
The frequency distributions for the biomass normalized P-I curve parameters are shown in Figures 5-21 and 5-22 for each station and for all stations combined. Examination of the frequency distributions for αB at the 3 stations did not reveal discernable differences among the sample sites (Figure 5-21). When all data were pooled, a positively skewed distribution was observed for αB with a mean value of 0.030 mg C (mg Chl a)-1 hr-1. All of the values in 2000 were below the theoretical maximum of 0.11 mg C (mg Chl a)-1 hr-1 (Cleveland et al. 1989, Lohrenz et al. 1994). In prior years occasional values greater than the theoretical maximum have been observed; as also reported by others (Lohrenz et al. 1994, Cibik et al. 1996). The values determined for 2000 are lower than the mean value (0.045) reported by Cibik et al. (1996) for the 1995 dataset and the mean (0.06) reported by Kelly and Doering (1995) for 1994. The frequency distribution for αB in 2000 is much closer to the long-term distribution pattern than that observed in 1998, a year with no spring bloom.
The frequency distributions for PBmax (mg C mg Chl a-1 hr-1) at stations N04 and N18 were also not
distinguishable from each other (Figure 5-22). Pooled data revealed a positive skewness (n=170), but no evidence of a bimodal distribution at these sites. However, the frequency distribution at station F23 did suggest a bimodal pattern as was initially described by Cibik et al. (1996) in 1995. No values were greater than the theoretical maximum of 25 (Lohrenz et al. 1994). The mean value (2.56 mg C mg Chl a-1 hr-1) is lower than mean values reported in 1995 (Cibik et al. 1996) and 1994 (Kelly and Doering (1995). However, the distribution pattern in 2000 is very similar to patterns observed in prior years.
To summarize our analysis of the P-I curve parameters we noted:
• seasonal patterns were similar between stations N04, N18 and F23 during the spring and early summer
• parameter values tended to decrease with increased depth in the water column at stations N04 and N18 but not F23
• chlorophyll-specific parameters increased during the spring and the mid-summer periods
• chlorophyll-specific parameters were remarkably similar at station N04 and N18 despite the obvious difference between the two sites for non-normalized parameters
• the noted increases in photosynthetic indices were most likely tied to elevated light levels during the spring and improved nutrient availability due to coastal upwelling and the seasonal breakdown of stratification
• photosynthetic parameters (normalized and not normalized to biomass) were significantly (P<0.05) and positively correlated in 2000, as well as in 1995-99
• frequency distributions were similar between stations for most parameters
5.1.6 Comparison with Prior Years Station F23 has previously been characterized by a seasonal productivity cycle markedly different from the nearfield sites. During prior years, productivity at the Boston Harbor station F23 tended to gradually increase from spring through summer and decrease in the fall (Figure 5-23a). In 2000 the

2000 Annual Water Column Monitoring Report November 2001
5-8
productivity pattern at F23 was characterized by a spring and a fall peak and was closer to the pattern typically observed at the nearfield stations. The summer productivity values noted at F23 in 2000 are the lowest recorded from 1995-2000. Although productivity has gradually declined at station F23 this is the first annual cycle that suggests nutrients rather than light may be limiting productivity during the summer. When the seasonal patterns at station F23 are compared from 1995 through 2000, the peak production values are observed to decline from 1995 through 1998 but increase from 1998 through 2000. The apparent decrease in productivity at this station from 1995 to 1998 is coincidental and not an established trend with time. However, the switch in seasonal pattern in 2000 is distinctive, with the peak production occurring in spring in 2000 and in summer in prior years. Areal production at the nearfield stations in 2000 followed the typical pattern observed for productivity in most years (Figures 5-23b and 5-23c). In general, nearfield stations are characterized by the occurrence of a winter/spring phytoplankton bloom, variable production during the summer and a fall bloom. With the exception of the unusual elevated productivity at station N18 in July 2000, productivity at the nearfield sites followed the generally observed pattern. The spring phytoplankton blooms observed at the nearfield stations from 1995-1999 typically reached values ranging of ~3000 mg C m-2 d-1 (Figure 5-24a). The magnitude of the spring bloom in 2000 at station N04 was comparable to the spring peaks observed in 1996 and 1997 (3000 mg C m-2 d-1). At station N18, the 2000 spring bloom peak (4250 mg C m-2 d-1) was the highest spring production observed in the nearfield from 1995-2000. Cibik et al. (1998) observed a tendency for the winter-spring phytoplankton bloom to begin offshore and follow a gradient from offshore to nearshore waters. The results from 2000 do not support this observation. The bloom was initially (14 March) most intense at the inshore station (N18) followed by a later (1 April) peak in intensity at station N04. Station F23 was not sampled on 14 March 2000 but exhibited a strong productivity peak by 1 April 2000. The departure from the typical timing may be related to the phytoplankton species that dominated the spring bloom. In 2000, the bloom was dominated by Phaeocystis pouchetii, while in many years diatoms dominate the bloom. The fall phytoplankton blooms observed at nearfield stations in 1995-1999 generally reached values of 1600 to 5000 mg C m-2 d-1 (Figure 5-24b), with blooms typically lasting 1-2 months. The fall phytoplankton bloom during 2000 fell at the upper end of this range with a peak value of 4926 mg C m-2 d-1 at station N18 and 2487 mg C m-2 d-1 at station N04. The 2000 fall bloom peaks at stations N04 and N18 were comparable in magnitude to the fall of 1997 and higher than those measured during the other 4 years. On September 6 2000, the bay outfall became operational. Station N18 is closest to the outfall site and any impact of effluent-derived nutrients on productivity would be detected here first. Figures 5-24b and 5-24c show the peak and the average productivity at station N16/N18 in September – December for 1995 – 2000. Although there is no clear evidence of increased areal productivity at station N18 during the fall period in 2000 relative to other years, the mean value slightly exceeds the earlier maximum observed in 1997, while the peak fall value is slightly lower than 1997. Mean fall productivity at station N04 was also somewhat elevated in 2000.
Annual productivity estimates in 2000 at the nearfield stations were higher than those observed in 1998 (a year with no spring phytoplankton bloom) and 1999, but similar to values observed in 1997 (Figure 5-25). Annual productivity at F23 was intermediate to values observed in prior years.
5.1.7 Modeling of Phytoplankton Production As in prior years, we empirically examined the relationship between measured photic zone productivity (mg C m-2 d-1) and a composite function (BZpI0) derived by Cole and Cloern (1987)

2000 Annual Water Column Monitoring Report November 2001
5-9
where B is phytoplankton biomass (mg Chl a m-3), Zp, the photic depth (m) and I0 surface irradiance (E m-2 d-1). Significant linear relationships (P<0.05) were found for all stations in 2000 (Figure 5-26). In Table 5-1 we compare the slope of the equations developed in 2000 with those uncovered in previous years. The slopes of the equations for 1996-99 years are expected to change somewhat when the chlorophyll and incident irradiance are corrected for the final report. Based on the current values it is apparent that the slope of the equation is variable both between stations and among years. The model may allow increased temporal and spatial coverage of productivity within the system under study if the source of the observed variability in the slope is uncovered.
Table 5-1. Slope of Equation P = mBZpI0 + b from 1994 through 2000.
Station
Year F23 N04 N16-18
1994 0.56 0.56 0.56
1995 1.87 0.39 0.64
1996 0.88 0.23 0.56
1998 0.22 0.28 0.31
1999 0.44 0.38 0.23
2000 0.79 0.37 0.23
Because of the variability in the above fitted relations, we also regressed both areal productivity (mg C m-2 d-1) and the parameters of the P-I curves (Pmax and α) against phytoplankton biomass (mg Chl a m-3). An alternative approach for modeling production might be to predict the parameters of the P-I curves from measured variables and then use the predicted values to calculate production on a daily basis. The results from the linear regression of areal production versus mean chlorophyll a are seen in Figure 5-27. For station F23 the r2 value for production as a function of biomass was not significant with P>0.05. The relationships for the nearfield sites were much improved when outliers (2 at N04 and 2 at N18, values shown as open circles in the figure) were removed. Examination of the data revealed that the outliers were from the October surveys when subsurface chlorophyll maxima were present. These subsurface chlorophyll maxima resulted in elevated photic zone chlorophyll concentrations that did not contribute to organic carbon production as efficiently as predicted by the regression model. For station N04 the relationship explained less of the variability in productivity while for N18 the fit was improved. In both cases the relationships were significant (P<0.05). Biomass alone is capable of explaining 55-86% of the variation in production at the nearfield stations.
The relationships between the P-I curve parameters and phytoplankton biomass were significant (P<0.05) at the nearfield sites as well (Figures 5-28 and 5-29). Between 54-63% of the variation in the parameters was accounted for by chlorophyll a. Unlike prior years, the fit obtained at station F23 was not significant. The prediction of P-I curve parameters as a function of biomass may prove to be an alternative approach for modeling production.
5.1.8 Production Summary The major features established by the analysis of production measurements during 2000 were as follows:
• during 2000 the seasonal productivity pattern was generally typical of that observed in prior surveys, with distinct spring and fall blooms at the nearfield sites

2000 Annual Water Column Monitoring Report November 2001
5-10
• the pattern at the harbor station differed from most years with a distinct spring bloom rather than a gradual increase in productivity from winter through summer followed by a decline
• bloom periods exhibited an average 2-4 fold increase in productivity compared to non-bloom periods (early summer and late fall)
• peak production at stations N04 and N18 during the 2000 spring bloom were the highest observed at these stations from 1995-2000
• peak and mean fall production in the nearfield was comparable to rates observed in 1997 and were higher than for the rest of the 1995-2000 period
• a major summer bloom, with an important sub-surface component, occurred at station N18 in 2000 repeating a pattern initially observed in 1999
• productivity was significantly correlated with the composite parameter BZpI0 and to a lesser extent with phytoplankton biomass alone
• productivity at station N18, closest to the outfall site, did not increase following the 6 September 2000 start-up
5.2 Respiration Respiration measurements were made at the same nearfield (N04 and N18) and farfield (F23) stations as productivity and at an additional station in Stellwagen Basin (F19). All four stations were sampled during each of the combined farfield/nearfield surveys. Stations N04 and N18 were also sampled during the five nearfield only surveys. Respiration samples were collected from three depths (surface, mid-depth, and bottom) and were incubated in the dark at in situ temperatures for 8±1 days. Due to incubation problems, station F23 respiration samples in February (WF002) and nearfield samples in May (WN006) were qualified and the data are not included in the figures or discussion that follows. Both respiration (in units of µMO2/hr) and carbon-specific respiration (µMO2/µMC/hr) rates are presented in the following sections. Carbon-specific respiration was calculated by normalizing respiration rates to the coincident particulate organic carbon (POC) concentrations. Carbon-specific respiration rates provide a relative indication of the biological availability (labile) of the particulate organic material for microbial degradation. In August, additional nutrient parameters including POC were collected at station F19 marking a return to more intensive sampling at this Stellwagen Basin respiration station.
5.2.1 Water Column Respiration During the surveys conducted in February and March, respiration rates were generally low in both the nearfield and farfield areas (<0.10 µMO2hr-1; Figures 5-30 and 5-31). By April, respiration rates had doubled in the nearfield (0.1 to 0.2 µMO2hr-1) and similar increases were observed at harbor station F23 and offshore station F19. Respiration rates were higher at station N04 in comparison to N18 and there was a clear difference in respiration rates over depth at station N04 with maximum rates in the surface waters (~0.2 µMO2hr-1). The increase in respiration rates in April was coincident with the winter-spring Phaeocystis bloom. At station N04, respiration rates were higher in the surface and mid-depth waters where the temperatures were warmer and higher rates of primary production were observed. Respiration rates decreased from the April springtime highs to <0.10 µMO2hr-1 in the nearfield in May and remained relatively low in June. There was little change in the respiration rates measured at the two farfield stations from April to June. Respiration rates increased in the nearfield in July. Rates
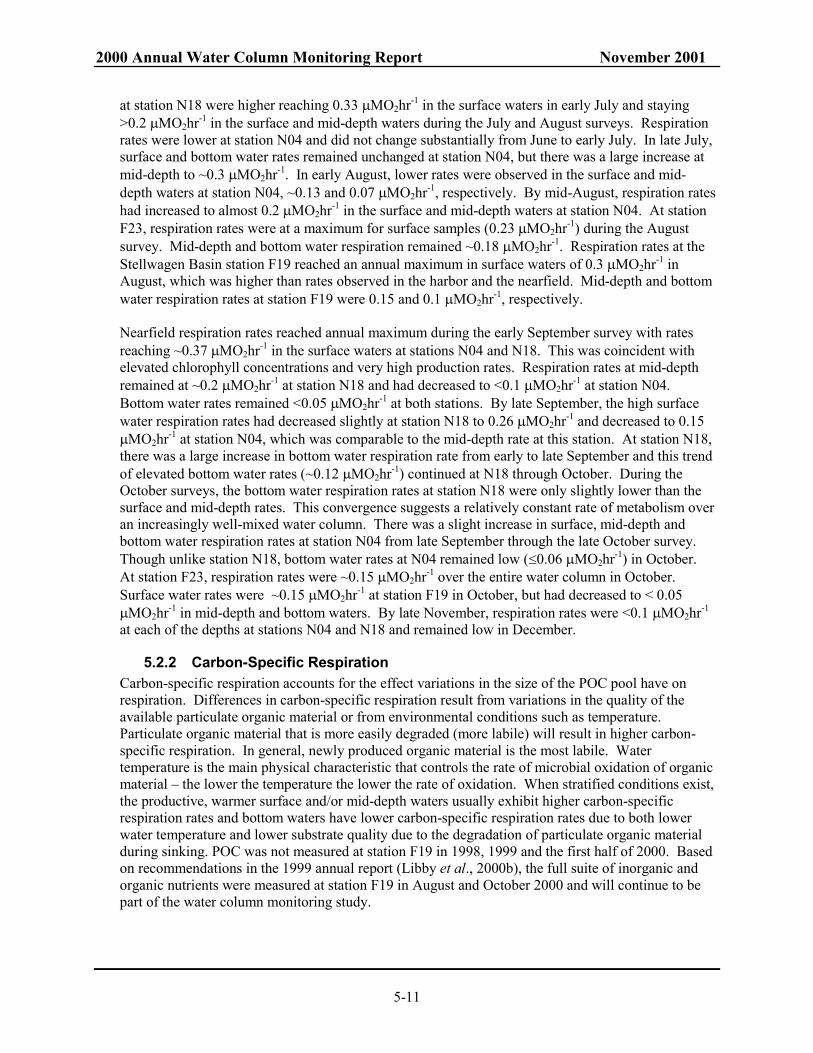
2000 Annual Water Column Monitoring Report November 2001
5-11
at station N18 were higher reaching 0.33 µMO2hr-1 in the surface waters in early July and staying >0.2 µMO2hr-1 in the surface and mid-depth waters during the July and August surveys. Respiration rates were lower at station N04 and did not change substantially from June to early July. In late July, surface and bottom water rates remained unchanged at station N04, but there was a large increase at mid-depth to ~0.3 µMO2hr-1. In early August, lower rates were observed in the surface and mid-depth waters at station N04, ~0.13 and 0.07 µMO2hr-1, respectively. By mid-August, respiration rates had increased to almost 0.2 µMO2hr-1 in the surface and mid-depth waters at station N04. At station F23, respiration rates were at a maximum for surface samples (0.23 µMO2hr-1) during the August survey. Mid-depth and bottom water respiration remained ~0.18 µMO2hr-1. Respiration rates at the Stellwagen Basin station F19 reached an annual maximum in surface waters of 0.3 µMO2hr-1 in August, which was higher than rates observed in the harbor and the nearfield. Mid-depth and bottom water respiration rates at station F19 were 0.15 and 0.1 µMO2hr-1, respectively. Nearfield respiration rates reached annual maximum during the early September survey with rates reaching ~0.37 µMO2hr-1 in the surface waters at stations N04 and N18. This was coincident with elevated chlorophyll concentrations and very high production rates. Respiration rates at mid-depth remained at ~0.2 µMO2hr-1 at station N18 and had decreased to <0.1 µMO2hr-1 at station N04. Bottom water rates remained <0.05 µMO2hr-1 at both stations. By late September, the high surface water respiration rates had decreased slightly at station N18 to 0.26 µMO2hr-1 and decreased to 0.15 µMO2hr-1 at station N04, which was comparable to the mid-depth rate at this station. At station N18, there was a large increase in bottom water respiration rate from early to late September and this trend of elevated bottom water rates (~0.12 µMO2hr-1) continued at N18 through October. During the October surveys, the bottom water respiration rates at station N18 were only slightly lower than the surface and mid-depth rates. This convergence suggests a relatively constant rate of metabolism over an increasingly well-mixed water column. There was a slight increase in surface, mid-depth and bottom water respiration rates at station N04 from late September through the late October survey. Though unlike station N18, bottom water rates at N04 remained low (≤0.06 µMO2hr-1) in October. At station F23, respiration rates were ~0.15 µMO2hr-1 over the entire water column in October. Surface water rates were ~0.15 µMO2hr-1 at station F19 in October, but had decreased to < 0.05 µMO2hr-1 in mid-depth and bottom waters. By late November, respiration rates were <0.1 µMO2hr-1 at each of the depths at stations N04 and N18 and remained low in December.
5.2.2 Carbon-Specific Respiration Carbon-specific respiration accounts for the effect variations in the size of the POC pool have on respiration. Differences in carbon-specific respiration result from variations in the quality of the available particulate organic material or from environmental conditions such as temperature. Particulate organic material that is more easily degraded (more labile) will result in higher carbon-specific respiration. In general, newly produced organic material is the most labile. Water temperature is the main physical characteristic that controls the rate of microbial oxidation of organic material – the lower the temperature the lower the rate of oxidation. When stratified conditions exist, the productive, warmer surface and/or mid-depth waters usually exhibit higher carbon-specific respiration rates and bottom waters have lower carbon-specific respiration rates due to both lower water temperature and lower substrate quality due to the degradation of particulate organic material during sinking. POC was not measured at station F19 in 1998, 1999 and the first half of 2000. Based on recommendations in the 1999 annual report (Libby et al., 2000b), the full suite of inorganic and organic nutrients were measured at station F19 in August and October 2000 and will continue to be part of the water column monitoring study.

2000 Annual Water Column Monitoring Report November 2001
5-12
POC concentrations were relatively low (10-20 µMC) in the nearfield during the first two surveys and generally uniform over the water column (Figure 5-32). In Boston Harbor, POC concentrations were similarly low in early February, but by the end of February the POC concentration in harbor surface waters had increased to ~55 µMC. By March, POC concentrations had increased to >40 µMC over the entire water column at station N18 and to ~30 µMC in surface and mid-depth waters at station N04. In April, POC concentrations had increased at both nearfield stations to approximately 40 µMC (lower in the deeper bottom water at station N04). At harbor station F23, POC concentrations remained higher than the nearfield concentrations in April (50-70 µMC). The elevated concentrations in March and April were coincident with the high chlorophyll concentrations and high production rates associated with the Phaeocystis bloom. There was a decrease in nearfield carbon-specific respiration rates from February to April coincident with the increase in productivity and POC (Figure 5-33). Carbon-specific respiration rates at station F23, however, were low throughout this period (≤ 0.005 µMO2µMC-1hr-1). The disconnect between carbon-specific respiration rates and productivity and the availability of newly formed POC plus the relatively low respiration rates observed the winter/spring of 2000 versus 1999 may be related to the type of phytoplankton that bloomed in 2000 (Phaeocystis versus a mixed diatom assemblage). POC concentrations were variable across the nearfield and harbor stations from April to August. POC decreased to ~20 µMC at the nearfield stations by early May coincident with decreases in chlorophyll concentration and production rates. By mid-May, POC concentrations had increased to levels slightly higher than those observed during the March/April bloom (40-55 µMC). At station N18, this up-and-down trend continued through August. Low concentrations (~20 µMC) were measured at station N18 in June, but high concentrations were measured in the surface and mid-depth waters in early July (80 µMC). POC concentrations returned to 40-55 µMC in late July and August for surface and mid-depth waters and ranged from 20-25 µMC in bottom waters from June through August. At station N04, POC concentrations were relatively consisted during the summer. Surface concentrations remained elevated at station N04 from June thru August (~30 µMC). In Boston Harbor, POC concentrations remained high from April to June (60-80µMC) before decreasing to ~30 µMC in August. Overall, carbon-specific respiration in the harbor and nearfield was relatively low during this time period. At the nearfield and harbor stations, the only time carbon specific respiration exceeded 0.01 µMO2µMC-1hr-1 was in the bottom waters at station N04 in late July. These low numbers suggest that there were limited supplies of labile POC available during the winter/spring and summer of 2000 despite the fact that there was a very substantial Phaeocystis bloom. At Stellwagen Basin station F19, POC concentrations were relatively high in the surface waters (37 µMC) in August, but very low in mid-depth and bottom waters (6 µMC). For the mid-depth sample, the carbon-specific respiration rate was 0.025 µMO2µMC-1hr-1, which was the highest rate calculated for 2000. By early September, POC concentrations in the surface waters reached annual maxima at both N04 (83 µM) and N18 (93 µM). Mid-depth and bottom water POC concentrations were relatively low at station N04 (21 and 9 µM), but were high at station N18 with a concentration of 52 µM at mid-depth and 32 µM in the bottom waters. This increase in POC concentrations was coincident with high productivity at both stations and the substantial increase in chlorophyll concentrations during this survey. By late September, POC concentrations had decreased to 40 to 50 µM in the surface and mid-depth waters at stations N04 and N18. Concentrations remained in this range at station N18 through October and bottom water concentrations remained relatively high (30 to 40 µM) at station N18 over this time period. Surface and mid-depth POC concentrations at station N04 decreased in early October to ~ 25 µM and then increased to 30 to 40 µM by the late October survey. Bottom water concentrations remained low at station N04 in October. By late November, POC

2000 Annual Water Column Monitoring Report November 2001
5-13
concentrations were relatively low and uniform at stations N04 and N18 and this continued into December. At station F23, POC concentrations were relatively constant (30 to 35 µMC) from August to October. Similarly consistent values were observed in the surface waters at station F19 with a concentration of 37 µM in August and 32 µM in October. POC concentrations in the bottom water remained low (<10 µM) during these two surveys, but there was an increase in the mid-depth waters at station F19 from 6 µM in August to 23 µM in October. Carbon-specific respiration rates reached a maximum in the nearfield at station N18 in late August with a rate of 0.009 µMO2µMC-1hr-1 at mid-depth (Figure 5-33a). Otherwise carbon-specific respiration rates were low (≤0.005 µMO2µMC-1hr-1) and relatively constant during the fall of 2000 (Figure 5-33). Given the high chlorophyll concentrations and production rates at stations N04 and N18 and the increase in POC concentrations by early September that resulted, it was expected that carbon-specific respiration might increase with the increased availability of newly produced, labile organic carbon. Interestingly, there was an increase in bottom water carbon-specific respiration at station N18 from early September to early October that may have been related to the increased availability of labile carbon in bottom waters due to senescence of the fall bloom. At station F23, carbon-specific respiration rates remained relatively low and constant in August and October as they had earlier in the year. At Stellwagen Basin station F19, carbon-specific respiration rates were high in the mid-depth and bottom waters in August (0.025 and 0.019 µMO2µMC-1hr-1, respectively) and decreased sharply by October over the entire water column (<0.005 µMO2µMC-1hr-1).
5.2.3 1992-2000 Interannual Comparison A comparison of bottom water respiration rates for the entire baseline period shows that the magnitude of the rates observed in the nearfield in 2000 were comparable to rates measured in 1995 through 1997 (Figure 5-34a). Although both 1999 and 2000 had a significant winter/spring bloom, the respiration rates measured in 2000 were less than half of the peak rates measured in 1999 (Libby et al., 2000b). The seemingly atypical high respiration rates observed in the nearfield in 1999 contributed to the unprecedented low DO concentrations that were observed during the fall of 1999. The relatively low respiration rates observed in 2000 did not drive DO concentration to low levels despite the occurrence of large spring and fall blooms. As discussed in Section 4.2, the 2000 chlorophyll concentrations were unprecedented in comparison to baseline values. Bottom water POC concentrations followed this trend and as seen in Figure 5-35, POC values at station N18 were higher on average than values observed from 1995 to 1999. Comparable POC concentrations were measured during spring surveys in 1997 and 1999, but POC concentrations were high over much of 2000 in station N18 bottom waters. The material from the spring and fall blooms was making it into the bottom waters, but it does not appear that conditions were conducive for high respiration rates and consequently there was a disconnect between availability of carbon and DO concentrations. This suggests that the material making it to the bottom waters was relatively refractory and more labile POC was either regenerated in the upper water column or horizontally advected. The connection between physical forcing of the system and biological rates of production and respiration, and DO concentrations is the focus of ongoing investigation. The magnitude of bottom water respiration rates at Boston Harbor station F23 were comparable to previous years for spring and fall surveys, but the August maximum in 2000 was relatively low in comparison (Figure 5-34b). This may be because of the lack of data at station F23 for June. POC concentrations peaked in June in harbor bottom waters suggesting that summer peak bottom water respiration may have been relatively high (Figure 5-35b). Harbor bottom water POC concentrations exhibit the same trend as station N18 of increasing from 1998 to 1999 to 2000. Bottom water respiration rates at offshore station F19 have remained relatively low and consistent from 1995 to

2000 Annual Water Column Monitoring Report November 2001
5-14
2000. Although the August bottom water respiration rate at station F19 was the highest recorded from 1995 to 2000, it was still low in comparison to harbor and nearfield rates.
5.2.4 Respiration Summary The major features established by the analysis of respiration measurements during 2000 were as follows: • Respiration rates increased in March and April coincident with the winter-spring Phaeocystis
bloom. Relatively high nearfield respiration rates were measured in July (~0.30 µMO2hr-1). • Nearfield respiration rates reached annual maxima during the early September survey with rates
reaching ~0.37 µMO2hr-1 in the surface waters at stations N04 and N18. This was coincident with elevated chlorophyll concentrations and very high production at these stations.
• Although both 1999 and 2000 had significant winter/spring and fall blooms, the respiration rates measured in 2000 were less than half of the peak rates measured in 1999.
• Elevated POC concentrations were coincident with the high chlorophyll concentrations and high production rates associated with the Phaeocystis bloom in the nearfield and harbor.
• POC concentrations reached a maximum at both N04 (83 µM) and N18 (93 µM) in early September. The increase in POC concentrations was coincident with the increase in productivity and chlorophyll concentrations during this survey.
• Carbon-specific respiration rates reached a maximum in late August in the nearfield at station N18 with a rate of 0.009 µMO2µMC-1hr-1 at mid-depth and in the farfield at the Stellwagen Basin station F19 in the mid-depth and bottom waters (0.025 and 0.019 µMO2µMC-1hr-1, respectively).
• The relatively low respiration rates and the disconnect between carbon-specific respiration rates and productivity observed during the winter/spring of 2000 versus 1999 may be related to the type of phytoplankton that bloomed in 2000 versus 1999 (Phaeocystis versus a mixed diatom assemblage).

2000 Annual Water Column Monitoring Report November 2001
5-15
Figure 5-1. Areal production (mgCm-2d-1) for stations F23, N04, and N18 over the 2000 annual cycle. Annual production (gCm-2y-1) is indicated in the inset of each panel.
F23
0
1000
2000
3000
4000
5000
J F M A M J J A S O N D
mg
C m
-2 d
-1
Measured
479 g C m -2 y-1
N04
0
1000
2000
3000
4000
5000
J F M A M J J A S O N D
mg
C m
-2 d
-1
Measured
523 g C m -2 y-1
N18
0
1000
2000
3000
4000
5000
J F M A M J J A S O N D2000
mg
C m
-2 d
-1
Measured
679 g C m -2 y-1

2000 Annual Water Column Monitoring Report November 2001
5-16
Daily Production at Station N04
1 2 3 4 5 6 7 8 9 10 11 12 13 14 15 16 17
-45
-40
-35
-30
-25
-20
-15
-10
-5
Dept
h (m
)
Station N04
0
1
2
10
50
100
160
200
240
F M A M J J A S O N D
2000 Figure 5-2. Time series of contoured daily production (mgCm-3d-1) over depth (m) at station N04.

2000 Annual Water Column Monitoring Report November 2001
5-17
Daily Production at Station N18
1 2 3 4 5 6 7 8 9 10 11 12 13 14 15 16 17
-25
-20
-15
-10
-5
Dept
h (m
)
Station N18
0
15
40
100
200
340
450
F M A M J J A S O N D2000
Figure 5-3. Time series of contoured daily production (mgCm-3d-1) over depth (m) at station N18.

2000 Annual Water Column Monitoring Report November 2001
5-18
Figure 5-4. Chlorophyll a distribution for the 2000 season represented as averaged over depth and integrated over depth at stations F23, N04, and N18.
F23
0369
1215
J F M A M J J A S O N D
µµ µµg
Chl
a l-1
N04
0
3
6
9
12
15
J F M A M J J A S O N D
µµ µµg
Chl
a l-1
N18
0
3
6
9
12
15
J F M A M J J A S O N D2000
µµ µµg
Chl
a l-1
Average Integra ted over Depth
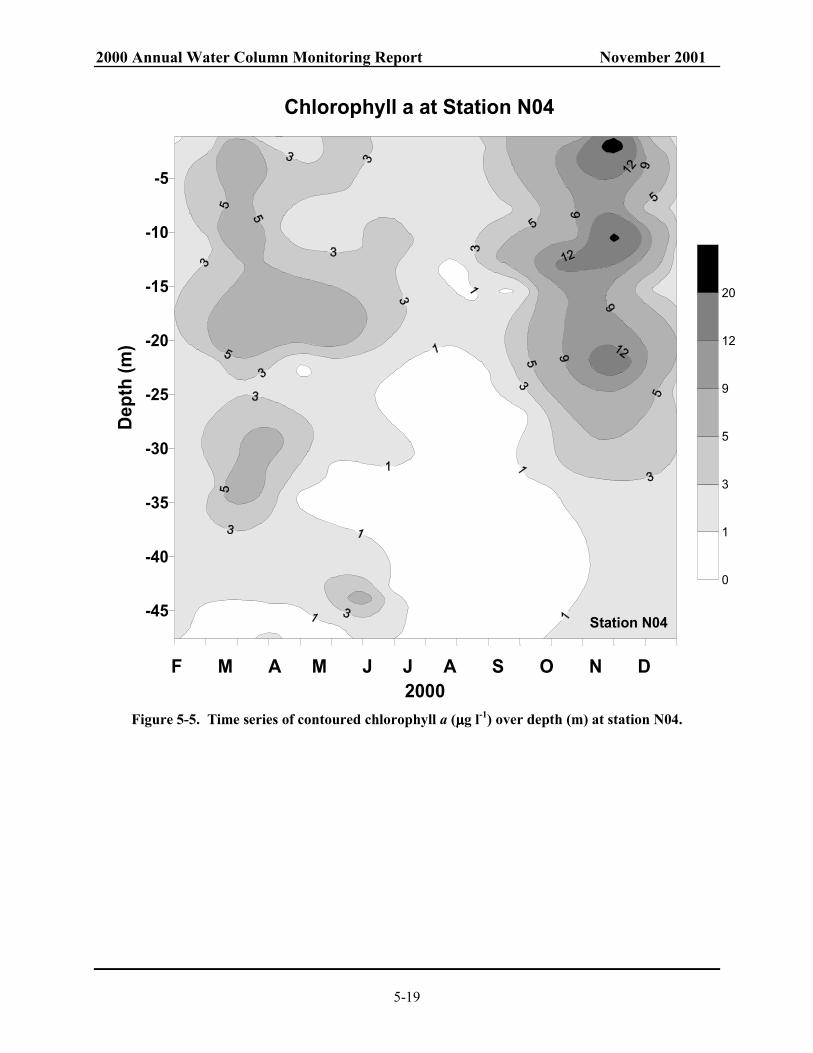
2000 Annual Water Column Monitoring Report November 2001
5-19
1 2 3 4 5 6 7 8 9 10 11 12 13 14 15 16 17
-45
-40
-35
-30
-25
-20
-15
-10
-5
Dept
h (m
)Chlorophyll a at Station N04
Station N04
0
1
3
5
9
12
20
F M A M J J A S O N D2000
Figure 5-5. Time series of contoured chlorophyll a (µµµµg l-1) over depth (m) at station N04.

2000 Annual Water Column Monitoring Report November 2001
5-20
1 2 3 4 5 6 7 8 9 10 11 12 13 14 15 16 17
-25
-20
-15
-10
-5
Dept
h (m
)Chlorophyll a at Station N18
Station N18
0
1
4
8
12
16
20
F M A M J J A S O N D2000
Figure 5-6. Time series of contoured chlorophyll a (µµµµg l-1) over depth (m) at station N18.

2000 Annual Water Column Monitoring Report November 2001
5-21
1 2 3 4 5 6 7 8 9 10 11 12 13 14
-25
-20
-15
-10
-5
Dept
h (m
)Daily Production at Station F23
Station F23
1
10
50
100
150
200
250
350
500
F M A M J J A S O2000
Figure 5-7. Time series of contoured daily production (mgCm-3d-1) over depth (m) at station F23.

2000 Annual Water Column Monitoring Report November 2001
5-22
1 2 3 4 5 6 7 8 9 10 11 12 13 14
-25
-20
-15
-10
-5
Dept
h (m
)Chlorophyll a at Station F23
Station F23
0
2
4
6
8
10
12
F M A M J J A S O2000
Figure 5-8. Time series of contoured chlorophyll a (µµµµg l-1) over depth (m) at station F23.
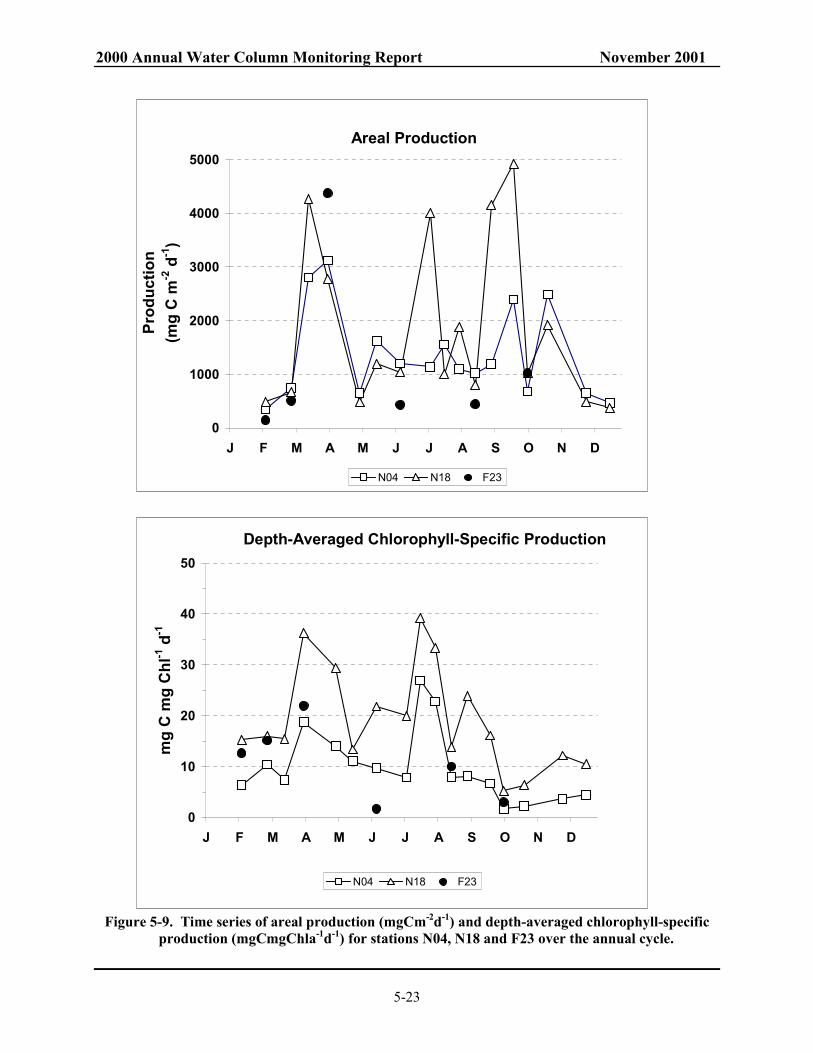
2000 Annual Water Column Monitoring Report November 2001
5-23
Figure 5-9. Time series of areal production (mgCm-2d-1) and depth-averaged chlorophyll-specific production (mgCmgChla-1d-1) for stations N04, N18 and F23 over the annual cycle.
Areal Production
0
1000
2000
3000
4000
5000
J F M A M J J A S O N D
Prod
uctio
n(m
g C
m-2
d-1
)
N04 N18 F23
Depth-Averaged Chlorophyll-Specific Production
0
10
20
30
40
50
J F M A M J J A S O N D
mg
C m
g C
hl-1
d-1
N04 N18 F23

2000 Annual Water Column Monitoring Report November 2001
5-24
1 2 3 4 5 6 7 8 9 10 11 12 13 14 15 16 17
-45
-40
-35
-30
-25
-20
-15
-10
-5
Dept
h (m
)
0
2
8
15
30
50
80
100
Station N04
Chlorophyll-Specific Production at Station N04
F M A M J J A S O N D
2000 Figure 5-10. Time series of contoured chlorophyll-specific production (mgCmgChla-1d-1) over
depth (m) at station N04.

2000 Annual Water Column Monitoring Report November 2001
5-25
1 2 3 4 5 6 7 8 9 10 11 12 13 14 15 16 17
-25
-20
-15
-10
-5
Dept
h (m
)Chlorophyll-Specific Production at Station N18
Station N18
0
5
10
20
40
80
F M A M J J A S O N D2000
Figure 5-11. Time series of contoured chlorophyll-specific production (mgCmgChla-1d-1) over depth (m) at station N18.

2000 Annual Water Column Monitoring Report November 2001
5-26
1 2 3 4 5 6 7 8 9 10 11 12 13 14
-25
-20
-15
-10
-5
Dept
h (m
)Chlorophyll-Specific Production at Station F23
Station F230
1
5
10
20
30
40
60
F M A M J J A S O N D2000
Figure 5-12. Time series of contoured chlorophyll-specific production (mgCmgChla-1d-1) over depth (m) at station F23.

2000 Annual Water Column Monitoring Report November 2001
5-27
Figure 5-13. Photoperiod light field over the course of the day during the first six surveys demonstrating the differences between observed light on the day of the survey and theoretical
maximum light from a cloudless day close in time to the survey date (used to calculate potential production).

2000 Annual Water Column Monitoring Report November 2001
5-28
Figure 5-14. Potential production (mgCm-3d-1) calculated using incident light from a cloudless day over the annual cycle for each station and depth at stations F23, N04, and N18.
Potential Production - N18
0
200
400
600
J F M A M J J A S O N D2000
mg
C m
-3 d-1
S MS M MB B
Potential Production - N04
0
100
200
300
J F M A M J J A S O N D
mg
C m
-3 d-1
Potential Production - F23
0
200
400
600
800
J F M A M J J A S O N D
mg
C m
-3 d-1

2000 Annual Water Column Monitoring Report November 2001
5-29
Figure 5-15. Measured and potential areal production (mgCm-2d-1) for the 2000 season at stations F23, N04, and N18. Annual and potential annual production (gCm-2y-1) are shown in the panel
insets, with the higher value being the potential annual production at each station.
F23
0
1000
2000
3000
4000
5000
J F M A M J J A S O N D
mg
C m
-2 d
-1
M ea sure d Potentia l
479-511 g C m -2 y-1
N04
0
1000
2000
3000
4000
5000
J F M A M J J A S O N D
mg
C m
-2 d
-1
Me a sure d Pote ntia l
523-556 g C m -2 y-1
N18
0
1000
2000
3000
4000
5000
J F M A M J J A S O N D2000
mg
C m
-2 d
-1
Me asure d Potentia l
679-726 g C m -2 y-1

2000 Annual Water Column Monitoring Report November 2001
5-30
αααα - N04
0.00
0.10
0.20
0.30
J F M A M J J A S O N D
mg
C m
-1 h
-1/( µµ µµ
E s-1
)
αααα - N18
0.00
0.10
0.20
0.30
0.40
0.50
J F M A M J J A S O N D2000
mg
C m
-1 h-1
/( µµ µµE
s-1)
S MS M MB B
αααα - F23
0.00
0.20
0.40
0.60
0.80
J F M A M J J A S O N D
mg
C m
-1 h
-1/( µµ µµ
E s-1
)
Figure 5-16. Alpha, αααα, [mgCm-3hr-1(µµµµE m-2 s-1)] in 2000 at stations F23, N04, and N18 at 5 depths.

2000 Annual Water Column Monitoring Report November 2001
5-31
ααααB- Station N04
0.00
0.04
0.08
0.12
J F M A M J J A S O N D
mg
C m
g ch
l-1 h
-1/ µµ µµ
E m
-2 s
-1)
ααααB - Station N18
0.00
0.04
0.08
0.12
J F M A M J J A S O N D
2000
mg
C m
g ch
l-1 h-1
/( µµ µµE
m-2
s-1
)
S MS M MB B
ααααB- Station F23
0.00
0.04
0.08
0.12
J F M A M J J A S O N Dmg
C m
g C
hl-1
h-1
/( µµ µµE
m-2
s-1
)
Figure 5-17. Chlorophyll-specific alpha, α α α αB, mgC(mgchla)-1 hr-1 in 2000 at stations F23, N04, and
N18 at 5 depths.

2000 Annual Water Column Monitoring Report November 2001
5-32
Figure 5-18. Pmax (mgC m-3 hr-1) in 2000 at stations F23, N04, and N18 at 5 depths.
Pmax - Station N18
0
20
40
60
J F M A M J J A S O N D
2000
mg
C m
-3 h
-1
S MS M MB B
Pmax - Station N04
0
10
20
30
40
J F M A M J J A S O N D
mg
C m
-3 h-1
Pm ax - Station F23
0
2040
60
80
J F M A M J J A S O N D
mg
C m
-3 h-1

2000 Annual Water Column Monitoring Report November 2001
5-33
Figure 5-19. PBmax(mgCmgChla-1hr-1 ) in 2000 at stations F23, N04, and N18 at 5 depths.
Pmax Chl a -1 - Station N18
0
2
4
6
8
10
J F M A M J J A S O N D2000
mg
C m
g C
hl-1
h-1
S MS M MB B
Pmax Chl a -1- Station N04
02468
10
J F M A M J J A S O N D
mg
C m
g C
hl-1
h-1
Pmax Chl a -1 - Station F23
02468
10
J F M A M J J A S O N D
mg
C m
g C
hl-1
h-1

2000 Annual Water Column Monitoring Report November 2001
5-34
αααα vs Pmax
y = 0.0096 x + 0.01R2 = 0.90
0
0.2
0.4
0.6
0.8
0 20 40 60
Pmax (mg C m-3 h-1)
mg
C m
-3 h
-1( µµ µµ
E m
-2 s
-1)-1
ααααΒΒΒΒ vs PB
max
y = 0.01 x + 0.004R2 = 0.68
0.00
0.03
0.06
0.09
0.12
0 2 4 6 8 10
PBmax (mg C mg Chl-1 hr-1)
mg
C m
g ch
l-1 ( µµ µµ
E m
-2 s
-1)-1
Figure 5-20. Relationship between the fitted values of the parameters of the P-I curves not normalized (αααα and Pmax ) and normalized (ααααΒΒΒΒ
and PBmax) to phytoplankton biomass using the
seasonal data for 2000.

2000 Annual Water Column Monitoring Report November 2001
5-35
Figure 5-21. Frequency distributions for chlorophyll-specific alpha for stations F23, N04, N18 and the pooled data during 2000.
N04
0
10
20
30
40
0.00 0.10 0.20 0.30 0.40
ααααB
Freq
uenc
y
N18
0
10
20
30
40
0.00 0.10 0.20 0.30 0.40
ααααB
Freq
uenc
yF23
0
5
10
15
20
0.00 0.10 0.20 0.30 0.40
ααααB
Freq
uenc
y
All Stations
0
20
40
60
80
0.00 0.10 0.20 0.30 0.40
ααααB
Freq
uenc
y

2000 Annual Water Column Monitoring Report November 2001
5-36
Figure 5-22. Frequency distributions for chlorophyll-specific PBmax for stations F23, N04, N18 and
the pooled data during 2000.
N04
0
10
20
30
40
0 5 10 15 20 25 30 35 40
Pm axB
Freq
uenc
y
N18
0
10
20
30
40
0 5 10 15 20 25 30 35 40
PmaxB
Freq
uenc
yF23
0
10
20
30
40
0 5 10 15 20 25 30 35 40
Pm axB
Freq
uenc
y
All Stations
0
20
40
60
80
0 5 10 15 20 25 30 35 40
PmaxB
Freq
uenc
y

2000 Annual Water Column Monitoring Report November 2001
5-37
Figure 5-23. Areal production (mgCm-2d-1) for stations F23, N04 and N16/N18 from 1995 to 2000.
(a) Station F23
0
2000
4000
6000
8000
J M S J M S J M S J M S J M S J M S
mg
C m
-2 d
-1
1995 1996 20001997 1998 1999
(b) Station N04
0
1000
2000
3000
4000
J M S J M S J M S J M S J M S J M S
mg
C m
-2 d
-1
1995 1996 1997 1998 1999 2000
(c) Station N16/N18
0
1000
2000
3000
4000
5000
6000
J M S J M S J M S J M S J M S J M S
mg
C m
-2 d
-1
N16
1995 1996 1997 1998 1999 2000
N18

2000 Annual Water Column Monitoring Report November 2001
5-38
Figure 5-24. Production (mgCm-2d-1) at nearfield stations N04 and N16/N18 from 1995 to 2000. (a) spring peak, (b) fall peak, and (c) fall (September–December) mean
Note that N16 was sampled only once in fall 1996 so no mean was calculated.
(a) Spring Productivity Peak
0
1000
2000
3000
4000
5000
6000
1995 1996 1997 1998 1999 2000
mg
C m
-2 d
-1
N16/N18 N04
(b) Fall Productivity Peak
0
1000
2000
3000
4000
5000
6000
1995 1996 1997 1998 1999 2000
mg
C m
-2 d
-1
N16/N18 N04
(c) Fall Mean Productivity
0
1000
2000
3000
4000
5000
6000
1995 1996 1997 1998 1999 2000
mg
C m
-2 d
-1
N16/N18 N04

2000 Annual Water Column Monitoring Report November 2001
5-39
Figure 5-25. Annual production (g C m-2yr-1) for stations F23, N04, and N16/N18 from 1995–2000.
Annual Production
0100200300400500600700800900
1992 1993 1994 1995 1996 1997 1998 1999 2000Year
g C
m-2
yr-1
N04 N16-18 F23

2000 Annual Water Column Monitoring Report November 2001
5-40
Figure 5-26. Relationships between areal production (mg C m-2 d-1) and the composite function BZpI0 (see text) for stations F23, N04 and N18 in 2000.
S ta tio n N0 4
y = 0 .37 x + 468R 2 = 0 .74
0
1 0 0 0
2 0 0 0
3 0 0 0
4 0 0 0
0 2 0 0 0 4 0 0 0 6 0 0 0 8 0 0 0
C o m p o s ite P a ra m e te r B ZpI0
Pro
d (m
g C
m-2
d-1
)
S ta tio n N1 8y = 0 .23 x + 374
R 2 = 0 .73
0
1 0 0 0
2 0 0 0
3 0 0 0
4 0 0 0
5 0 0 0
0 4 0 0 0 8 0 0 0 1 2 0 0 0 1 6 0 0 0 2 0 0 0 0
C o m p o s ite P a ra m e te r B ZpI0
Pro
d (m
g C
m-2
d-1
)
S ta tio n F 2 3
y = 0 .79 x - 279R 2 = 0.94
0
1 0 0 0
2 0 0 0
3 0 0 0
4 0 0 0
5 0 0 0
0 1 0 0 0 2 0 0 0 3 0 0 0 4 0 0 0 5 0 0 0 6 0 0 0
C o m p o s ite P a ra m e te r B ZpI0
Pro
d (m
g C
m-2
d-1
)

2000 Annual Water Column Monitoring Report November 2001
5-41
Figure 5-27. Relationships between areal production (mg C m-2 d-1) and phytoplankton biomass (mg Chl a m-3) for stations F23, N04 and N18 in 2000.
PRODUCTION V S Chl a - Station N18
y = 366.5 x + 218R2 = 0.86
0
10002000
30004000
5000
0 3 6 9 12 15
m g Chl a m -3
mg
C m
-2 d
-1
P roduction vs C h l a - S ta tion F23
y = 118.9 x + 476R2 = 0.14
010002000300040005000
0 5 10 15
m g Chl a m -3
mg
C m
-2 d
-1
PRODUCTION V S Chl a - Station N04
y = 326.2 x + 491R2 = 0.55
0
10002000
30004000
5000
0 3 6 9 12 15
m g Chl a m -3
mg
C m
-2 d
-1

2000 Annual Water Column Monitoring Report November 2001
5-42
Figure 5-28. Relationship between the fitted values of Pmax and phytoplankton biomass (mg Chl a m-3) using the seasonal data for 2000.
Pmax vs Chly = 2.35x + 4.54
R2 = 0.37
0
15
30
45
60
0 3 6 9 12 15
Chl a (mg m-3)
Pm
ax (m
g C
m-3
h-1
)
F23
Pmax vs Chly = 1.19 x + 2.23
R2 = 0.56
0
10
20
30
40
50
0 5 10 15 20 25 30Chl a (mg m-3)
Pm
ax (m
g C
m-3
h-1
)
N04
Pmax vs Chly = 1.96 x + 2.24
R2 = 0.58
0
10
20
30
40
50
0 5 10 15 20
Chl a (m g m -3)
Pm
ax (m
g C
m-3
h-1
)
N18

2000 Annual Water Column Monitoring Report November 2001
5-43
αααα vs Chl ay = 0.019 x + 0.05
R2 = 0.24
0.00.10.20.30.40.50.6
0 3 6 9 12 15Chl a (mg m-3)
mg
C m
-3 h
-1( µµ µµ
E m
-2s-1
)-1
F23
αααα vs Chl ay = 0.025 x + 0.01
R2 = 0.54
0.0
0.1
0.2
0.3
0.4
0.5
0 5 10 15 20 25 30
Chl a (mg m-3)
mg
C m
-3 h
-1( µµ µµ
E m
-2s-1
)-1
N04
αααα vs Chl ay = 0.02 x + 0.03
R2 = 0.63
0.0
0.1
0.2
0.3
0.4
0.5
0 5 10 15 20Chl a (mg m-3)
mg
C m
-3 h
-1( µµ µµ
E m
-2s-1
)-1
N18
Figure 5-29. Relationship between the fitted values of αααα and phytoplankton biomass (mg Chl a m-3)
using the seasonal data for 2000.

2000 Annual Water Column Monitoring Report November 2001
5-44
Figure 5-30. Time-series of respiration (µµµµM O2 hr-1) at stations N18 and N04.
(a) Station N18
0
0.1
0.2
0.3
0.4
0.5
Jan Feb Mar Apr May Jun Jul Aug Sep Oct Nov Dec
Res
pira
tion
( µµ µµM
O2 h
r-1)
Surface Mid-Depth Bottom
(b) Station N04
0
0.1
0.2
0.3
0.4
0.5
Jan Feb Mar Apr May Jun Jul Aug Sep Oct Nov Dec
Res
pira
tion
( µµ µµM
O2 h
r-1)
Surface Mid-Depth Bottom

2000 Annual Water Column Monitoring Report November 2001
5-45
Figure 5-31. Time-series of respiration (µµµµM O2 hr-1) at stations F23 and F19.
(a) Station F23
0
0.1
0.2
0.3
0.4
0.5
Jan Feb Mar Apr May Jun Jul Aug Sep Oct Nov Dec
Res
pira
tion
( µµ µµM
O2 h
r-1)
Surface Mid-Depth Bottom
(b) Station F19
0
0.1
0.2
0.3
0.4
0.5
Jan Feb Mar Apr May Jun Jul Aug Sep Oct Nov Dec
Res
pira
tion
( µµ µµM
O2 h
r-1)
Surface Mid-Depth Bottom

2000 Annual Water Column Monitoring Report November 2001
5-46
Figure 5-32. Time-series of POC (µµµµM) at stations N18, N04 and F23.
(a) Station N18
0
20
40
60
80
100
Jan Feb Mar Apr May Jun Jul Aug Sep Oct Nov Dec
POC
( µµ µµM
)
Surface Mid-Depth Bottom
(b) Station N04
0
20
40
60
80
100
Jan Feb Mar Apr May Jun Jul Aug Sep Oct Nov Dec
POC
( µµ µµM
)
Surface Mid-Depth Bottom
(c) Station F23
0
20
40
60
80
100
Jan Feb Mar Apr May Jun Jul Aug Sep Oct Nov Dec
POC
( µµ µµM
)
Surface Mid-Depth Bottom

2000 Annual Water Column Monitoring Report November 2001
5-47
Figure 5-33. Time-series of carbon-specific respiration (µµµµM O2 µµµµM C-1 hr-1) at stations N18, N04 and F23.
(b) Station N04
0.000
0.005
0.010
0.015
0.020
Jan Feb Mar Apr May Jun Jul Aug Sep Oct Nov Dec
µµ µµM
O2 µµ µµ
MC
-1 h
r-1
Surface Mid-Depth Bottom
(c) Station F23
0.000
0.005
0.010
0.015
0.020
Jan Feb Mar Apr May Jun Jul Aug Sep Oct Nov Dec
µµ µµM
O2 µµ µµ
MC
-1 h
r-1
Surface Mid-Depth Bottom
(a) Station N18
0.000
0.005
0.010
0.015
0.020
Jan Feb Mar Apr May Jun Jul Aug Sep Oct Nov Dec
µµ µµM
O2 µµ µµ
MC
-1 h
r-1
Surface Mid-Depth Bottom
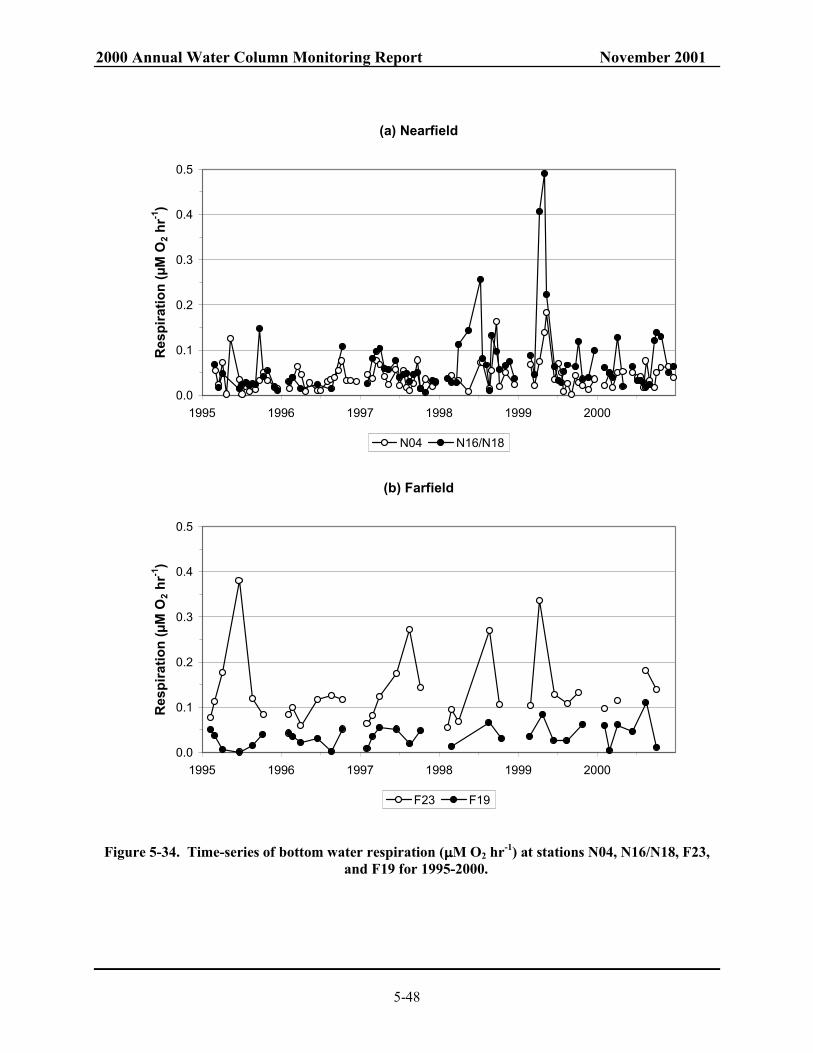
2000 Annual Water Column Monitoring Report November 2001
5-48
Figure 5-34. Time-series of bottom water respiration (µµµµM O2 hr-1) at stations N04, N16/N18, F23, and F19 for 1995-2000.
(a) Nearfield
0.0
0.1
0.2
0.3
0.4
0.5
1995 1996 1997 1998 1999 2000
Res
pira
tion
(µM
O2 h
r-1)
N04 N16/N18
(b) Farfield
0.0
0.1
0.2
0.3
0.4
0.5
1995 1996 1997 1998 1999 2000
Res
pira
tion
(µM
O2 h
r-1)
F23 F19

2000 Annual Water Column Monitoring Report November 2001
5-49
Figure 5-35. Time-series of bottom water POC (µµµµM) at stations N04, N16/N18, F23 and F19 for 1995 to 2000.
(a) Nearfield
0.0
20.0
40.0
60.0
80.0
1995 1996 1997 1998 1999 2000
POC
(µM
)
N04 N16/N18
(b) Farfield
0.0
20.0
40.0
60.0
80.0
1995 1996 1997 1998 1999 2000
POC
(µM
)
F23 F19
2000 Annual Water Column Monitoring Report November 2001
6-1
6.0 PLANKTON Plankton samples were collected on each of the water column surveys conducted during 2000. Phytoplankton and zooplankton samples were collected at two stations (N04 and N18) during each nearfield survey and at 13 farfield plus the two nearfield stations (total = 15) during the farfield surveys. During the first three farfield surveys of 2000 (WF001, WF002, and WF004), zooplankton samples were collected at two additional stations in Cape Cod Bay (F32 and F33). Phytoplankton samples included both whole-water and 20 µm-mesh screened samples from the surface and subsurface chlorophyll maximum depths. Zooplankton samples were collected by vertical/oblique tows with 102 µm-mesh nets. Methods of sample collection and analyses are detailed in Albro et al. (1998).
In this section, the seasonal trends in plankton abundance and regional characteristics of the plankton assemblages are evaluated. Total abundance and relative abundance of major taxonomic groups are presented for each phytoplankton (Section 6.1) and zooplankton (Section 6.2) community. Tables providing data on cell densities and relative abundance for all dominant plankton species (>5% abundance) were included in the 2000 semi-annual reports (Libby et al. 2000a and 2001). A brief overview of highlights of patterns in the plankton in 2000 is presented below. Details are considered in Sections 6.1 and 6.2.
Phytoplankton Overview
Total phytoplankton abundance in whole water samples was variable and low from February through early March, reaching maxima of < 2.3 x 10⁶ cells l-1. There was a system-wide major bloom of Phaeocystis pouchetii in late March - April with total phytoplankton abundance levels approaching 14 x 106 cells l-1. Phytoplankton abundance declined in May after this bloom (< 2.5 x 10⁶ cells l-1), but subsequently increased (up to 3.7 x 10⁶ cells l-1) in June and July. Similar patterns of abundance were observed at nearfield and farfield stations. Total phytoplankton abundances in the whole water samples were high: up to 3.6 million cells per liter in August and September, declining through October (< 2.5 x 10⁶ cells l-1) to low levels (< 1 x 10⁶ cells l-1) in November and December.
Whole-water phytoplankton assemblages during the first half of the year were dominated by unidentified microflagellates and several species of centric diatoms except during the Phaeocystis bloom. This is typical for the first half of the year in terms of taxonomic composition over the baseline. The whole water phytoplankton assemblage during the second half of the year was dominated by unidentified microflagellates and cryptomonads, the diatom Leptocylindrus danicus, and other centric diatoms.
There were no apparent unusual shifts in phytoplankton abundance or community composition associated with the outfall coming on line on September 6, 2000, although chlorophyll levels for this period were unusually high. The disconnect between phytoplankton abundance and chlorophyll concentrations may have been due in part to a prevalence of large chain-forming diatoms such as Chaetoceros debilis, Eucampia cornuta, Leptocylindrus danicus, Rhizosolenia setigera, Guinardia delicatula, and others that were relatively abundant in the 20-µm screened rapid analysis samples in late September and October.
There were no blooms of harmful or nuisance phytoplankton species in Massachusetts and Cape Cod Bays during 2000, other than the April bloom of Phaeocystis pouchetii. While the dinoflagellate Alexandrium tamarense and diatoms of Pseudo-nitzschia pungens and Pseudo-nitzschia spp. were recorded in trace amounts, abundance levels were low.

2000 Annual Water Column Monitoring Report November 2001
6-2
As in previous years, dinoflagellates in >20-µm screened phytoplankton samples evidenced a bloom of Ceratium furca / C. tripos / C. longipes which increased from February through July, and remained high from August through December.
Zooplankton Overview
Total zooplankton abundance generally increased from February through July. Nearfield counts of nearly 300 x 103 animals m-3 during June (WF007) were among the highest for the entire 1992-2000 baseline. These high levels were partly due to abundant bivalve veligers, which comprised up to 64% of abundance at some stations. Zooplankton abundance declined as usual from high levels in early August (48 – 85 x 103 animals m-3) to progressively lower levels through September. Boston Harbor, coastal and nearfield zooplankton declined to very low abundance in October (<25 x 103 animals m-3). Zooplankton abundance remained low in November and December (12 – 28 x 103 animals m-3). Zooplankton assemblages during 2000 were generally comprised of taxa recorded for the same time of year in previous years, but levels of Acartia spp. rebounded from the unusually low values of 1999, which were possibly due to drought, to more typical levels, during a rainy spring and early summer of 2000. Zooplankton abundance was, as usual, dominated by copepod nauplii and adults and copepodites of the small copepods Oithona similis, and copepodites of Pseudocalanus and Centropages sp., with lesser contributions, at some stations, by meroplankters such as bivalve veligers and, in Boston Harbor, Acartia tonsa adults and Acartia sp. copepodites. The precipitous decline in zooplankton abundance due to ctenophore predation in October was unprecedented throughout the baseline. The ctenophore “bloom” was recorded for stations primarily in Boston Harbor and the adjacent coastal region, with trace amounts of ctenophore tissue in the sample from station F01 in Cape Cod Bay. Although ctenophore tissue was not found in the nearfield samples in early October (WF00E), it was observed in the samples in September. Anecdotal evidence also suggests that ctenophores were present in high abundance in the nearfield during the late September and late October surveys. As at the Boston Harbor and coastal stations, ctenophore predation may have led to the very low zooplankton abundances found at station N18 in late September to late October. Linkage of the high chlorophyll observed during fall 2000 to ctenophore-induced reductions in zooplankton grazing pressure is speculative, but it may have been a factor in the regional fall bloom.
6.1 Phytoplankton
6.1.1 Seasonal Trends in Total Phytoplankton Abundance Total phytoplankton abundance in the whole-water phytoplankton samples from the nearfield was 0.1-11.1 x 10⁶ cells L-1(Figure 6-1). A similar range was observed for the farfield data (Figure 6-2) with total phytoplankton abundance range of 0.1-13.8 x 10⁶ cells L-1. Maximum levels were during the Phaeocystis bloom in late March-early April (WF004) with mean values for both the nearfield and farfield of 6.8 x 10⁶ cells L-1 (Table 6-1). Maximum values throughout the remainder of the year were < 4.0 x 10⁶ cells L-1, and usually < 2.0 x 10⁶ cells L-1.
Total abundances of dinoflagellates, silicoflagellates and protozoans in 20 µm-mesh-screened water samples were of course considerably lower than those recorded for total phytoplankton in whole-water samples, due to the screening technique which selects for larger, albeit rarer cells. Screened phytoplankton abundance in the nearfield (Figure 6-3) was generally < 5 x 10³ cells L-1 until mid-July (WN009). Maximum nearfield abundance levels reached approximately 16-20 x 103 cells L-1 in July and November (Table 6-2). This summer-fall increase in screened phytoplankton abundance largely

2000 Annual Water Column Monitoring Report November 2001
6-3
Table 6-1. Nearfield and farfield averages and ranges of abundance (106 cells L-1) of whole-water phytoplankton
Survey Dates (2000) Nearfield Mean Nearfield Range Farfield
Mean Farfield Range
WF001 2/2-5 0.45 0.30-0.68 0.47 0.24-0.81 WF002 2/23-25,27 0.22 0.13-0.38 0.67 0.14-1.50 WN003 3/14 2.10 1.89-2.27 — — WF004 3/30,4/1,3,7 6.81 2.52-11.01 6.82 1.39-13.76 WN005 5/1 0.67 0.19-1.00 — — WN006 5/17 2.29 2.07-2.52 — — WF007 6/8,9,13 1.18 0.73-1.50 1.54 0.31-3.38 WN008 7/6 2.15 0.55-3.66 — — WN009 7/19 2.27 1.53-3.05 — — WN00A 8/2 1.69 0.60-3.50 — — WF00B 8/16-18, 8/20 1.07 0.55-1.42 1.30 0.21-2.43 WN00C 9/1 2.73 2.30-3.57 — — WN00D 9/22 2.28 1.79-2.82 — — WF00E 10/3-5, 10/12 1.69 1.23-2.25 1.52 0.42-2.54 WN00F 10/24 1.47 1.20-1.67 — — WN00G 11/29 0.75 0.61-0.83 — — WN00H 12/21 0.55 0.42-0.72 — —
Table 6-2. Nearfield and farfield average and ranges of abundance (cells L-1) for >20 µµµµm-screened dinoflagellates
Survey Dates (2000) Nearfield Mean Nearfield Range Farfield
Mean Farfield Range
WF001 2/2-5 891 660-1040 886 229-3160 WF002 2/23-25,27 253 187-403 147 36-370 WN003 3/14 315 212-394 — — WF004 3/30,4/1,3,7 100 28 -205 157 34-444 WN005 5/1 383 290-500 — — WN006 5/17 4362 3833-5363 — — WF007 6/8,9,13 2692 1576-3428 1860 162-3682 WN008 7/6 1905 1214-2661 — — WN009 7/19 7638 2607-16637 — — WN00A 8/2 2308 918-4122 — — WF00B 8/16-18, 8/20 1919 77-4348 1534 41-6324 WN00C 9/1 2773 2077-3278 — — WN00D 9/22 4129 585-7637 — — WF00E 10/3-5, 10/12 2986 1133-5254 1909 423-4565 WN00F 10/24 3414 2310-3989 — — WN00G 11/29 17820 13815-19950 — — WN00H 12/21 5319 4185-6570 — —

2000 Annual Water Column Monitoring Report November 2001
6-4
reflected a sustained bloom of the dinoflagellates Ceratium longipes, C. tripos, and C. fusus and was a continuation of a sustained presence that was observed during the previous year. Farfield screened phytoplankton abundance was mostly < 5 x 10³ cells L-1 throughout the year (Figure 6-4). In addition to the dinoflagellates, a relatively high number of large chain diatoms were observed in the rapid analysis 20-µm screened samples from station N18 during the fall of 2000 (not quantified for the other screened samples).
6.1.2 Nearfield Phytoplankton Community Structure Whole-Water Phytoplankton – In February, nearfield whole-water phytoplankton assemblages from both depths were dominated by unidentified microflagellates < 10 µm in diameter, cryptomonads, centric diatoms such as Thalassiosira spp 10 - 20 µm in diameter and unidentified centric diatoms < 10 µm in diameter that were probably also a species of Thalassiosira (Figure 6-5a). Beginning in March and particularly in April, Phaeocystis pouchetii became dominant, comprising > 50% of total cells in March, increasing to > 90% of total cells in April. Microflagellates remained at similar abundances to levels in February, but the centric diatoms recorded for February, along with Thalassiosira nordenskioldii actually declined in abundance from March through April. By May Phaeocystis had disappeared, and from May through July there was increasing abundance and dominance of microflagellates < 10 µm in diameter, cryptomonads, and centric diatoms such as Skeletonema costatum, Guinardia delicatula, Thalassiosira sp. in June, joined by the centric diatoms Dactyliosolen fragilissimus and Leptocylindrus minimus in July. Also in May through July the dinoflagellates Gymnodinium sp. and Prorocentrum minimum increased in abundance. In early August, nearfield whole-water phytoplankton assemblages from both depths were dominated by unidentified microflagellates. Cryptomonads and centric diatoms of the genus Thalassiosira were subdominants. By mid August, the dominance of microflagellates and cryptomonads continued, with subdominant contributions (5-7%) from the chain-forming diatoms Bellerochea malleus and Dactyliosolen fragillissimus). In September the dominance of <10 µm microflagellates and cryptomonads continued in the nearfield, but there was a minor bloom of diatoms as subdominants in early September. These included Leptocylindrus danicus (34.5-39.2% of total cells at the surface, and 12.3-38.0% of total cells at chlorophyll maximum layers), Thalassionema nitzschoides (5.1% of total cells at the chlorophyll maximum depth at N04), and small centric diatoms <10 µm in longest dimension (5.4-8.4% of total cells). By late September, small centric diatoms <10 µm in longest dimension comprised 5.7-10.8% and L. danicus comprised 11.7-44.8% of total cells counted at both depths of both nearfield stations, with minor contributions by the diatoms Chaetoceros debilis and Eucampia cornuta. During early October microflagellate dominance was shared with cryptomonads, although small centric diatoms < 10 µm in diameter, and the chain-forming diatom Leptocylindrus danicus were still abundant. The dominance by microflagellates, cryptomonads and small centric diatoms continued during late October, with larger diatoms such as Dactyliosolen fragillissimus and Rhizosolenia setigera still abundant, as well as the dinoflagellates Heterocapsa triquetra and Prorocentrum minimum. By late November microflagellate and cryptomonad abundance was shared with small centric diatoms <10 µm in longest dimension, and at the chlorophyll maximum depth at N04, a small species of the diatom genus Thalassiosira with cells 10-20 µm in longest dimension. By late December dominance by microflagellates, cryptomonads and small centric diatoms <10 µm in longest dimension was shared at chlorophyll maximum depths with the diatom Thalassionema nitzschoides (5-6% of total cells).

2000 Annual Water Column Monitoring Report November 2001
6-5
Screened Phytoplankton - During early February nearfield screened samples were dominated by the thecate dinoflagellate Prorocentrum micans, which comprised 50-91% of cells counted. There were lesser contributions from the dinoflagellates Ceratium fusus and C. tripos, and the silicoflagellates Distephanus speculum and Dictyocha fibula. These same taxa dominated during late February although Distephanus speculum had increased to 18-46% of cells counted. In March these same taxa were abundant in varying proportions, with increases in the two Ceratium species to levels of up to 26-35% of cells counted. The same taxa were abundant in April with additions of Ceratium longipes, C. macoceros, Gymnodinium spp. Prorocentrum minimum and Protoperidinium spp.
By early May, Ceratium longipes comprised approximately 60-80% of cells counted, with lesser contributions by C. fusus, C. tripos, and Prorocentrum minimum. These taxa were joined in late May by Ceratium lineatum and Dinophysis norvegica. In June there was continued dominance by C. fusus, C. lineatum, C. longipes and C. tripos, and to a lesser extent, Dinophysis norvegica and Prorocentrum minimum. The Ceratium quartet continued to dominate in July with subdominant abundance by D. norvegica. The dinoflagellates Ceratium tripos, Ceratium fusus, and Ceratium longipes were the overwhelming dominants in nearfield screened phytoplankton samples in August and September. In October dominance by C. tripos and C. fusus was shared with other dinoflagellates such as Prorocentrum micans, Gyrodinium sp. and other athecate dinoflagellates, and the silicoflagellate Dictyocha fibula. In November C. tripos and P. micans dominance was shared by the silicoflagellates D. fibula and Distephanus speculum. At the chlorophyll maximum depth at station N04, the dinoflagellate Protoperidinium depressum comprised 48% of total cells.
6.1.3 Farfield Phytoplankton Assemblages Whole-Water Phytoplankton - Whole-water phytoplankton assemblages at farfield stations were generally similar to those in the nearfield during the same time periods, in terms of composition, abundance, and the major Phaeocystis bloom in April (Figures 6-5b, 6-6, and 6-7). During February, farfield station assemblages were dominated at both depths by the same assemblages that dominated nearfield stations. These included unidentified microflagellates, cryptomonads, and diatoms of the genus Thalassiosira. An unidentified species of the dinoflagellate genus Gymnodinium was recorded at abundances of approximately 5-10% of total cells at several stations. By April farfield stations were overwhelmingly dominated by Phaeocystis pouchetii, with comparatively minor contributions by unidentified microflagellates and the same assemblage of diatoms recorded for February. The Phaeocystis bloom was not as pronounced in Cape Cod Bay, though it was still the dominant species (Figure 6-5b). By June assemblages at both depths at farfield stations were dominated by the same microflagellates and cryptomonads that dominated the nearfield, with subdominant contributions by the same diatom taxa recorded for the nearfield during this period (Skeletonema costatum, Thalassiosira spp.) at two stations (F31, F24). Unidentified microflagellates continued to dominate most farfield station assemblages at both depths in August, with lesser contributions by cryptomonads and centric diatoms <10 µm in cell size. In October, farfield stations were dominated by unidentified microflagellates and cryptomonads <10 µm in size, with small centric diatoms < 10µm in size present in subdominant abundance.

2000 Annual Water Column Monitoring Report November 2001
6-6
Subdominant contributions at various stations came from the diatoms Chaetoceros debilis, Leptocylindrus danicus, and Skeletonema costatum, and dinoflagellates of the genus Gymnodinium. Screened Phytoplankton - Screened-water dinoflagellate assemblages at farfield stations were similar to those in the nearfield during the same time periods. In February, 20 µm-screened surface phytoplankton samples from the farfield were dominated by Prorocentrum micans and Distephanus speculum, as in the nearfield, although Prorocentrum minimum comprised 70% of cells counted at the surface at F25 during WF001. By April recorded taxa included species of the dinoflagellate genus Ceratium (C. fusus, C. tripos), Dinophysis norvegica, Prorocentrum micans, and several species of the genus Protoperidinium. In June, farfield assemblages were dominated by Ceratium tripos, C. fusus, and C. longipes, the silicoflagellates Distephanus speculum and Dictyocha fibula with lesser contributions by Prorocentrum minimum and Protoperidinium spp. at some stations. At stations F23 and F30 in Boston Harbor, the dinoflagellate Gyrodinium spirale comprised up to 37 - 65% of total cells counted, and the photosynthetic ciliate Mesodinium rubrum comprised 12-55% of total cells counted at several other stations. In July, the screened farfield samples were dominated by the same assemblages as in the nearfield, including species of the dinoflagellate genus Ceratium (fusus, lineatum, longipes, tripos), Dinophysis norvegica and Prorocentrum minimum. During both August and October, 20-µm screened phytoplankton samples from the farfield were once again similar to nearfield assemblages, dominated by the dinoflagellates Ceratium. tripos and C. fusus with lesser contributions at most stations by the dinoflagellate Prorocentrum micans and the silicoflagellate Dictyocha fibula, with trace abundances of other dinoflagellates.
6.1.4 Nuisance Algae The major bloom of harmful or nuisance phytoplankton species in Massachusetts and Cape Cod Bays during the first half of 2000 was the April bloom of Phaeocystis pouchetii. At cell concentrations of 0.2-12.3 x 10⁶ cells l-1 (mean = 6.2 x 10⁶ cells l-1) it was the major phytoplankton event of the period. Also, comparison of mean abundances of Phaeocystis from the nearfield in 2000 with those of previous “Phaeocystis” years such as 1992, and 1997 (Figure 6-8) reveals that levels in spring of 2000 were higher than those recorded for any previous years since monitoring began in 1992. Although not observed in the nearfield, Phaeocystis was seen in the farfield in 1994, and it appears that this species blooms on a 2-3 year cycle in Massachusetts and Cape Cod Bays The toxic dinoflagellate Alexandrium tamarense was only sporadically recorded. A single cell of A. tamarense was recorded in each of two whole-water samples, first at station F27 during WF004, and again from station N18 during WN009. There were a few occurrences of “Alexandrium spp.” in screened samples that were not positively identified as A. tamarense. These included single occurrences during WF001 and WN003, at abundances of 1.5 cells l-1, twice during WF004 at abundances of 3.0 – 3.1 cells l-1, at 3 stations during WF007 at abundances of 1.8 – 1.9 cells l-1, and at one station during WN009 at an abundance of 20.7 cells l-1. Abundance of Alexandrium tamarense plus Alexandrium spp. in screened samples in 2000 was typically low, as evidenced by mean abundance in the nearfield compared to previous years (Figure 6-9). Levels since 1994 have not even approached those of 1993. Pseudo-nitzschia pungens or Pseudo-nitzschia spp. were also found sporadically, in 7 whole water samples in trace amounts (hundreds of cells l-1) in early February, but not again until April, when Pseudo-nitzschia spp. were found at station N04, at an abundance of 300 cells l-1. At stations F23 and

2000 Annual Water Column Monitoring Report November 2001
6-7
F24 during June, a single cell of the potentially toxic species Pseudo-nitzschia delicatissima was recorded at each station for abundances of 400 cells l-1. Potentially toxic species of the diatom genus Pseudo-nitzschia were also present at a few stations in August, but in extremely low abundances. Pseudo-nitzschia pungens and/or delicatissima were present at most stations in October, but at low abundances. Abundance of Pseudo-nitzschia in 2000 was lower than that recorded in most previous years (Figure 6-10). Due to inconsistent characterization of Pseudo-nitzschia pungens, Pseudo-nitzschia cf. pungens, and Pseudo-nitzschia sp. in different years over the course of the baseline, records for all these categories were combined in the baseline figure. From this figure it is clear that Pseudo-nitzschia abundance has been much higher in some previous years than in 2000, and that when Pseudo-nitzschia becomes abundant, it is usually in the fall and winter rather than in the spring and summer. Although the dinoflagellate Prorocentrum micans was recorded in 33 screened samples from August through October, all but two of these records were for < 1,000 cells L-1. Abundances increased in November and December to levels of 2,380 – 8,720 cells L-1. Although other species of this genus have been associated with diarrheic shellfish poisoning (DSP), in particular P. lima (Maranda et al. 1999), P. micans has not been associated with DSP.
6.1.5 Phytoplankton Interannual Comparisons For the baseline period (1992-2000), mean total phytoplankton abundance in selected areas of the system (nearfield, harbor, Cape Cod Bay, coastal, and boundary areas) were generally < 2 x 10⁶ cells L-1 (Figure 6-11). Higher abundances were recorded during some years, particularly 1995 and 1997, and during the Asterionellopsis glacialis bloom in October 1993. In general, the magnitude and trends in 2000 phytoplankton abundance were similar to those observed during other years with spring blooms of Phaeocystis.
The whole-water phytoplankton assemblages in 2000 were generally similar to those found during other baseline monitoring years. A description of the common paradigm of “normal” seasonal succession is presented based upon the 1992-2000 baseline monitoring data. In whole-water phytoplankton samples, microflagellates are usual numerical-dominants throughout the year, and their abundance generally tracks water temperature, being most abundant in summer and least abundant in winter (Figure 6-12). Microflagellate area means over the course of the 1992-2000 baseline are remarkably repeatable (except for 1995) with summer peaks generally in the range of 1 – 2 x 10⁶ cells L-1 in most years. The apparent 1995 summer bloom of microflagellates (> 4 x 10⁶ cells L-1), which was unprecedented and unrepeated, is the only exception to the normal pattern (Figure 6-12). In addition to microflagellates, the following taxa are dominant in Massachusetts and Cape Cod Bays during the periods identified below:
Winter (primarily February) – diatoms abundant, including Chaetoceros debilis, C. socialis, Thalassiosira nordenskioldii,and T. rotula;
Spring (March, April, May) – usually (except during Phaeocystis years) including assorted species of Thalassiosira, Chaetoceros, as well as the dinoflagellate Heterocapsa rotundatum, and (especially nearshore) cryptomonads;
Summer (June, July, August) – microflagellates are at peak abundance, with cryptomonads, Skeletonema costatum (especially nearshore), Leptocylindrus danicus, Rhizosolenia delicatula, Ceratulina pelagica, and various small-sized species of Chaetoceros;

2000 Annual Water Column Monitoring Report November 2001
6-8
Fall (September through December) – diatoms are abundant, including Asterionellopsis glacialis, Rhizosolenia delicatula, Skeletonema costatum, Leptocylindrus minimus, L. danicus, as well as cryptomonads, and assorted gymnodinoid dinoflagellates.
Superimposed over the background dominance of microflagellates and common diatoms, in some years there are outbursts of a single species such as Asterionellopsis glacialis in fall of 1993, or Phaeocystis pouchetii in spring of 1992, 1994, 1997 and 2000, or congeners such as the frequent summer-fall blooms of Ceratium longipes/tripos. Although such periodic blooms may be intermittent, they can be dramatic. Why such species bloom in some years but not others is unclear.
Over the baseline, screened-water dinoflagellate assemblages are normally dominated by the same non-toxic taxa that were abundant in 2000. These include Ceratium longipes, C. tripos, other Ceratium species, and various species of Dinophysis, Protoperidinium, and athecate dinoflagellates. The toxic species Alexandrium tamarense, though usually recorded in trace amounts in late spring and early summer, has not been abundant since MWRA sampling began in 1992.
Alexandrium tamarense is thought to initiate spring blooms from cyst beds in the Casco Bay region of Maine and become transported southward in a reduced-salinity plume from the Kennebec River (Anderson, 1997). Occasionally these blooms reach Massachusetts Bay, when northeast winds cause downwelling conditions, pressing the Maine coastal current along the shoreline. The frequency of sampling for the HOM program, however, may not adequately capture the occurrence of A. tamarense. In 1993 for example, shellfish PSP toxicity caused by A. tamarense was high in the bays and extended to a section of Cape Cod Bay (Sandwich, MA) that had never before recorded toxicity, while only a slight increase in A. tamarense abundance was observed by the HOM program for that year. Also, targeted sampling for A. tamarense during the spring-early summer red tide season by Don Anderson’s group from Woods Hole Oceanographic Institution has often revealed higher abundances of this species in Massachusetts Bay than in MWRA sampling during the same months. The lack of observations of A. tamarense during some years may also have been due to inconsistencies across HOM contracts (different analysts). For instance, there were relatively high levels of Alexandrium in Massachusetts Bay in May and June of 1995 (up to 50 cells L-1, Turner et al. 2000), but there were no Alexandrium recorded for the MWRA monitoring program during that year (Figure 6-9).
6.2 Zooplankton
6.2.1 Seasonal Trends in Total Zooplankton Abundance Total zooplankton abundance in the nearfield generally increased from February through July (WF001-WN009) (Figure 6-13). The maximum nearfield values of 146-290 x 103 animals m-3 recorded for WF007, WN008 and WN009 in June and July (Table 6-3) were among the highest during the entire 1992-1999 baseline. Total zooplankton abundance at nearfield stations declined from normal seasonal high levels in early August (up to 84.9 x 10³ animals m-3) to fluctuating levels that were generally about a half to a third or less lower from late August through December (Table 6-3). Total zooplankton abundance at farfield stations from February through April was low (all stations < 50 x 103 animals m-3; Figure 6-14). The summer increase in farfield zooplankton abundance jumped by June (WF007), from all values < 50 x 103 animals m-3 in WF004 to all but one value >50 x 103 animals m-3 and 7 of 15 values >100 x 103 animals m-3 in WF007. Total zooplankton abundance at farfield stations in October was generally half or less that of August levels at most stations (Figure 6-14). Zooplankton abundance in Boston Harbor reached unprecedented low levels during October due to decimation of zooplankton populations by
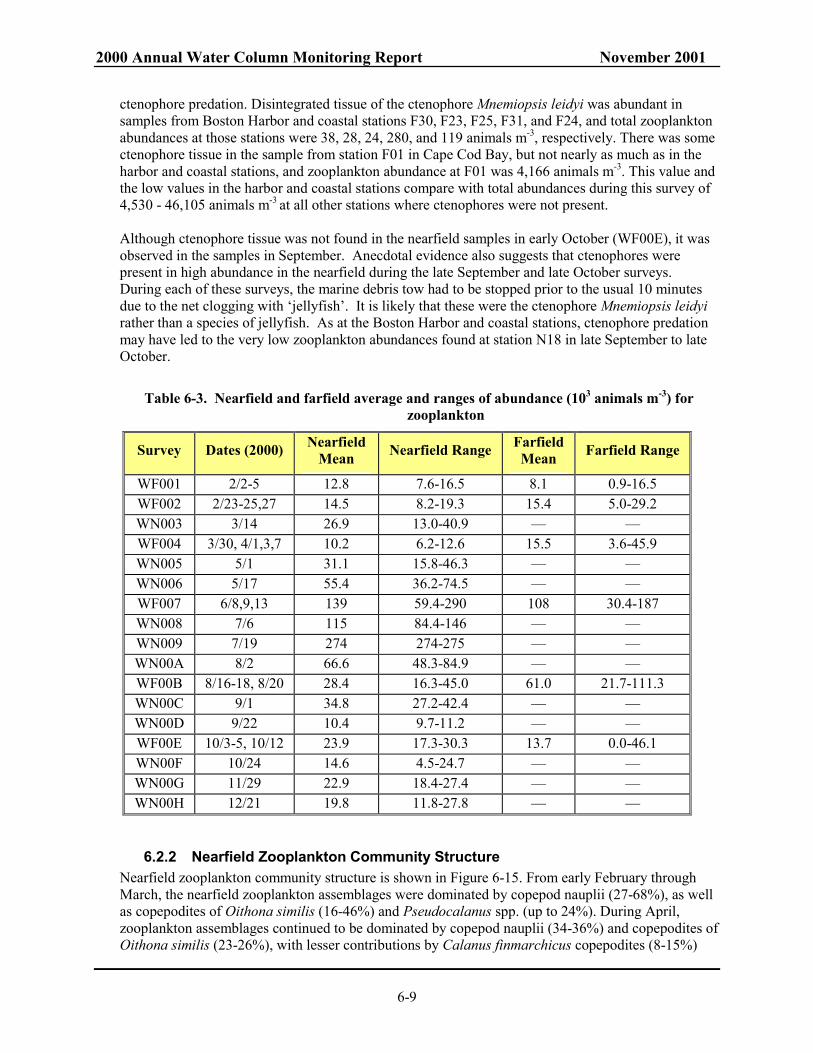
2000 Annual Water Column Monitoring Report November 2001
6-9
ctenophore predation. Disintegrated tissue of the ctenophore Mnemiopsis leidyi was abundant in samples from Boston Harbor and coastal stations F30, F23, F25, F31, and F24, and total zooplankton abundances at those stations were 38, 28, 24, 280, and 119 animals m-3, respectively. There was some ctenophore tissue in the sample from station F01 in Cape Cod Bay, but not nearly as much as in the harbor and coastal stations, and zooplankton abundance at F01 was 4,166 animals m-3. This value and the low values in the harbor and coastal stations compare with total abundances during this survey of 4,530 - 46,105 animals m-3 at all other stations where ctenophores were not present. Although ctenophore tissue was not found in the nearfield samples in early October (WF00E), it was observed in the samples in September. Anecdotal evidence also suggests that ctenophores were present in high abundance in the nearfield during the late September and late October surveys. During each of these surveys, the marine debris tow had to be stopped prior to the usual 10 minutes due to the net clogging with ‘jellyfish’. It is likely that these were the ctenophore Mnemiopsis leidyi rather than a species of jellyfish. As at the Boston Harbor and coastal stations, ctenophore predation may have led to the very low zooplankton abundances found at station N18 in late September to late October.
Table 6-3. Nearfield and farfield average and ranges of abundance (103 animals m-3) for zooplankton
Survey Dates (2000) Nearfield Mean Nearfield Range Farfield
Mean Farfield Range
WF001 2/2-5 12.8 7.6-16.5 8.1 0.9-16.5 WF002 2/23-25,27 14.5 8.2-19.3 15.4 5.0-29.2 WN003 3/14 26.9 13.0-40.9 — — WF004 3/30, 4/1,3,7 10.2 6.2-12.6 15.5 3.6-45.9 WN005 5/1 31.1 15.8-46.3 — — WN006 5/17 55.4 36.2-74.5 — — WF007 6/8,9,13 139 59.4-290 108 30.4-187 WN008 7/6 115 84.4-146 — — WN009 7/19 274 274-275 — — WN00A 8/2 66.6 48.3-84.9 — — WF00B 8/16-18, 8/20 28.4 16.3-45.0 61.0 21.7-111.3 WN00C 9/1 34.8 27.2-42.4 — — WN00D 9/22 10.4 9.7-11.2 — — WF00E 10/3-5, 10/12 23.9 17.3-30.3 13.7 0.0-46.1 WN00F 10/24 14.6 4.5-24.7 — — WN00G 11/29 22.9 18.4-27.4 — — WN00H 12/21 19.8 11.8-27.8 — —
6.2.2 Nearfield Zooplankton Community Structure Nearfield zooplankton community structure is shown in Figure 6-15. From early February through March, the nearfield zooplankton assemblages were dominated by copepod nauplii (27-68%), as well as copepodites of Oithona similis (16-46%) and Pseudocalanus spp. (up to 24%). During April, zooplankton assemblages continued to be dominated by copepod nauplii (34-36%) and copepodites of Oithona similis (23-26%), with lesser contributions by Calanus finmarchicus copepodites (8-15%)
2000 Annual Water Column Monitoring Report November 2001
6-10
and barnacle nauplii (7-11%). By May, nearfield zooplankton assemblages continued to be dominated by the combination of copepod nauplii (25-28%), copepodites of Oithona similis (6-32%) and Pseudocalanus spp. (up to 6-7%). However, during WN005 Calanus finmarchicus copepodites comprised 28-43% and during WN006, bivalve veligers were 7-33% of total abundance. At nearfield stations during June, zooplankton assemblages were dominated by bivalve veligers (7-64%), copepodites of Oithona similis (13-17%), Centropages spp. (6-14%), Calanus finmarchicus (up to 13%) and copepod nauplii (17-47%). In Figure 6-15, the disparity between total zooplankton abundance between nearfield stations N04 and N18, which were sampled on June 8th, and station N16, where the zooplankton sample was collected on June 9th, is due to the very high abundance of bivalve veligers (as “other”) at station N16. This is indicative of the biological (spawning) and physical (tides and currents) variability associated with meroplankton abundances and distribution in Massachusetts Bay. Subtracting the bivalve veliger abundance from total abundance at station N16, the total non-veliger abundance was 104 x 103 animals m-3, which is closer to the total abundances of 59 and 69 x 103 animals m-3 at the other nearfield stations. Also, abundances of other major taxa were reasonably close, with values for copepod nauplii of 25, 28, and 49 x 103 animals m-3, and for Oithona similis copepodites of 9, 10, and 13 x 103 animals m-3 at stations N04, N18, and N16, respectively. Dominance by copepodites and females of Oithona similis and Pseudocalanus spp. and copepod nauplii continued through July, with the contribution of bivalve veligers declining to 27-38%. During both July surveys, Temora longicornis copepodites comprised 7-10% of total abundance at station N04. In August, the nearfield zooplankton assemblages were dominated by copepod nauplii, and females and copepodites of Oithona similis with lesser contributions by copepodites of Temora, Centropages and Pseudocalanus sp.. During both September surveys, nearfield assemblages were primarily composed of copepod nauplii, copepodites of Acartia and Oithona sp, and the tunicate Oikopleura dioica. From October through December, the dominance of copepod nauplii and Oithona similis was shared with bivalve veligers, and to a lesser extent, copepodites of the genus Centropages.
6.2.3 Farfield Zooplankton Assemblages Zooplankton assemblages at farfield stations during February through April were generally similar to those in the nearfield. Abundant taxa throughout the area included copepod nauplii (26-67%), Oithona similis copepodites and females (8-45%), and copepodites and adults of Pseudocalanus spp. (7-33%) and Centropages spp. (6-14%) at most stations except those in Boston Harbor. Barnacle nauplii comprised 15% and 48%, respectively, at stations F30 and F31 in Boston Harbor in February. In April, Calanus finmarchicus comprised 10-11% of abundance at stations F02 and F32 in Cape Cod Bay, barnacle nauplii reached as high as 64% of total abundance at stations where present, and polychaete larvae were 13-70% of abundance at stations F23, F30 and F31 in Boston Harbor. During June farfield zooplankton assemblages were again dominated by copepod nauplii (17-50%), copepodites of Oithona similis (5-40%), and Pseudocalanus spp. (up to 12% at stations where present). Bivalve veligers accounted for up to 49% of abundance at most stations where they were present. Acartia spp. adults and copepodites accounted for 22%, 21%, and 6% of total abundance at stations F23, F30, and F31, respectively, in Boston Harbor. Also, Eurytemora herdmani adults and copepodites, typically found in low-salinity embayments, comprised 8-10% of abundance at stations F23 and F30 in Boston Harbor. Unlike the abnormally low abundance of Acartia spp. during drought conditions during the early part of 1999, with the rainy spring and summer in 2000, Acartia abundance in Boston Harbor rebounded to more typical levels.

2000 Annual Water Column Monitoring Report November 2001
6-11
At farfield stations during survey WF00B in mid-August, copepod nauplii were dominants, with subdominant contributions at various stations outside Boston Harbor by adults and copepodites of copepods such as Oithona similis, and other species recorded for the nearfield. Adults and copepodites of Acartia tonsa were dominant components of the assemblage in Boston Harbor (37-42%) and at stations F24 and F25 in the coastal region (32-37%). During WF00E in October, copepod nauplii were dominant everywhere, and outside the harbor Oithona similis, Centropages sp. copepodites and bivalve veligers were abundant at most farfield stations. A. tonsa were again dominant in Boston Harbor and adjacent coastal waters. In summary, zooplankton assemblages during 2000 were comprised of taxa recorded during previous baseline monitoring years. The major exceptions to the normal pattern were the extraordinarily high abundance of total zooplankton (as bivalve veligers) observed in June/July and the high abundance of ctenophores in Boston Harbor and coastal waters during the fall of 2000, whose predation caused unprecedented declines in abundance of other zooplankton.
6.2.4 Zooplankton Interannual Comparisons Total zooplankton abundance means for 2000 were generally higher in most areas in comparison to other baseline years, (Figure 6-16). Comparisons of area means for total zooplankton abundance with patterns for copepod nauplii and Oithona similis abundance over the same period reveal general similarity of patterns albeit on different scales (Figures 6-17 and 6-18), highlighting the importance of this copepod species to overall patterns of abundance. Abundance of O. similis was unusually high in the nearfield, but low in Boston Harbor as usual. Conversely, abundance of Acartia spp. adults and copepodites was high in Boston Harbor, compared to other locations (Figure 6-19). The major unusual zooplankton event of 2000 was the unprecedented decimation of zooplankton populations by ctenophore predation in Boston Harbor in October.
6.3 Discussion of Plankton Results The major phytoplankton result of 2000 was the spring bloom of Phaeocystis pouchetii. This species had appeared to blooming in spring in two-to three-year cycles, with blooms recorded for 1992, 1994, 1997, and 2000. However, this suggestion of an intermittent interannual “cycle” was complicated by the reappearance of Phaeocystis in 2001, only a year after the last bloom. Whether this denotes any substantial change in the plankton of Massachusetts Bay in the wake of the outfall coming on line in fall of 2000 remains to be seen. However, if Phaeocystis blooms become more frequent and are uncritically attributed to the outfall discharge, it is important to remember that periodic observations of these blooms in Massachusetts Bay preceded the outfall by almost a decade. Further, observations of concurrent Phaeocystis blooms in spring and early summer made in 1994 in Buzzards Bay (Turner et al. 2000), and in 2000 and 2001 upstream in the Gulf of Maine during the ECOHAB (ECology and Oceanography of Harmful Algal Blooms) program reveal that such Phaeocystis blooms are regional events. The long-standing nature of such blooms is attested to by their presence in April in Massachusetts Bay off Cape Cod by Bigelow (1926). The other major phytoplankton event of 2000 was the fall diatom bloom. This bloom would have been unremarkable had it not occurred shortly after the outfall discharge began. The bloom was comprised of large chain-forming taxa typical of the region for this time of the year, such as Leptocylindrus danicus, Rhizosolenia setigera, Guinardia delicatula, Chaetoceros debilis, and others which were recorded for both 20-µm screened rapid analysis samples, as well as whole-water phytoplankton samples. In terms of total diatom abundance, the 2000 bloom was dwarfed by previous fall diatom blooms such as those of 1993, 1995, and 1997 (Figure 6-20). However, in view of the anomalously high chlorophyll data recorded shortly after outfall discharge began, this fall diatom bloom might have been superficially linked to an outfall effect. In fact, the baseline reveals that such

2000 Annual Water Column Monitoring Report November 2001
6-12
fall blooms are normal components of the annual phytoplankton cycle in these waters, and SeaWiFS chlorophyll data from waters of the northeastern United States adjacent to our sampling area revealed this fall bloom to have been a regional event (See Section 4.2.2). The regional fall bloom of chain-forming diatoms may also relate to another apparently regional event in 2000, namely the anomalously high abundances of ctenophores in some areas where they had not been recorded before. The ctenophore “bloom” in Boston Harbor in October 2000 was unprecedented throughout the baseline, and this caused severe decimation of abundances of other zooplankton, particularly copepods, which could have led to release of zooplankton grazing pressure on larger phytoplankton, such as chain-forming diatoms. Ctenophores had never been captured in such high abundance over the entire MWRA baseline, and levels of other zooplankton had never been so low at this time of the year. This situation was reminiscent of that recorded for the Black Sea when the same ctenophore species, Mnemiopsis leidyi, undoubtedly introduced by ballast water from its endemic area off the mid-Atlantic to northeastern coast of the United States, ate most of the zooplankton in the Black Sea, causing irreversible trophic-level changes in the entire ecosystem, including collapse of the local sardine fishery (Shiganova & Bulgakova 2000). Overpredation of zooplankton grazers could have also contributed to resultant phytoplankton increases during the fall, particularly in terms of the bloom of large chain-forming diatoms. Such trophic cascades have been recorded previously for Narragansett Bay (Deason & Smayda, 1982) and Peconic Bay, New York (Turner et al., 1983). Unusually high abundances of ctenophores in October 2000 in Buzzards Bay (Turner, unpublished data) suggest that the ctenophore bloom in Boston Harbor was part of another regional event, which was simply better recorded for Boston Harbor than in adjacent waters. Not all regional events present a signal in the MWRA sampling area, however. The almost complete absence of Alexandrium spp. in Massachusetts Bay in 2000 is in contrast to a substantial bloom of this taxon upstream in the Gulf of Maine in spring of 2000 (ECOHAB, unpublished data). This absence from Massachusetts Bay was likely due to hydrographic and meterological conditions that were not conducive to transport of Alexandrium southward into Massachusetts Bay during the period of upstream abundance (see Anderson, 1997). Another singular aspect of zooplankton in 2000 was the pulses of bivalve veligers recorded for summer and fall. This resulted in the highest mean values for nearfield meroplankton recorded for the entire baseline (Fig. 6-21). Such meroplankton (planktonic larvae of benthic invertebrates), often dominate the numbers in many zooplankton samples, but their periods of abundance are ephemeral, and are likely more related to reproductive cycles of their macrobenthic parents, rather than to processes in the plankton. Otherwise, zooplankton abundance evidenced the typical pattern of increases through the winter and spring, high levels in the summer, followed by declines in the fall. The typical dominants such as copepod nauplii, Oithona similis adults and copepodites and Pseudocalanus spp. copepodites comprised much of most assemblages, except in the cases of meroplankton pulses which overwhelmed abundance at some stations.

2000 Annual Water Column Monitoring Report November 2001
6-13
Figure 6-1. Total phytoplankton abundance for nearfield whole-water samples. Mean and range for all.
Figure 6-2. Total phytoplankton abundance for farfield whole-water samples. Mean and range for all farfield stations and depths sampled.
Nearfield Whole Water Phytoplankton
0
2
4
6
8
10
12
14
WF001
WF002
WN003
WF004
WN005
WN006
WF007
WN008
WN009
WN00A
WF00B
WN00C
WN00D
WF00E
WN00F
WN00G
WN00H
2/2-5 2/23-27
3/14 3/30-4/7
5/1 5/17 6/8-13 7/6 7/19 8/2 8/16-20
9/1 9/22 10/3-12
10/24 11/29 12/21
106 C
ells
L-1
Farfield Whole Water Phytoplankton
0
2
4
6
8
10
12
14
WF001 WF002 WF004 WF007 WF00B WF00E
2/2-5 2/23-27 3/30-4/7 6/8-13 8/16-20 10/3-12
106 C
ells
L-1

2000 Annual Water Column Monitoring Report November 2001
6-14
Figure 6-3. Total phytoplankton abundance for nearfield 20-µµµµm screened samples. Mean and range for all nearfield stations and depths sampled.
Figure 6-4. Total phytoplankton abundance for farfield 20-µµµµm screened samples. Mean and range for all Farfield stations and depths sampled.
Nearfield Screened Phytoplankton
0
5000
10000
15000
20000
25000
WF001
WF002
WN003
WF004
WN005
WN006
WF007
WN008
WN009
WN00A
WF00B
WN00C
WN00D
WF00E
WN00F
WN00G
WN00H
2/2-5 2/23-27
3/14 3/30-4/7
5/1 5/17 6/8-13 7/6 7/19 8/2 8/16-20
9/1 9/22 10/3-12
10/24 11/29 12/21
Cel
ls L
-1
Farfield Screened Phytoplankton
0
5000
10000
15000
20000
25000
WF001 WF002 WF004 WF007 WF00B WF00E
2/2-5 2/23-27 3/30-4/7 6/8-13 8/16-20 10/3-12
Cel
ls L
-1

2000 Annual Water Column Monitoring Report November 2001
6-15
Figure 6-5. Average phytoplankton abundance by major taxonomic group, (a) nearfield area and (b) Cape Cod Bay. Data are average of surface and mid-depth samples from N04, N16, and N18
and F01 and F02, respectively.
(a) Nearfield Area
0
1
2
3
4
5
6
7
8
9
10
2-Fe
b-00
23-F
eb-0
0
14-M
ar-0
0
30-M
ar-0
0
1-M
ay-0
0
17-M
ay-0
0
8-Ju
n-00
6-Ju
l-00
19-J
ul-0
0
2-Au
g-00
16-A
ug-0
0
1-Se
p-00
22-S
ep-0
0
3-O
ct-0
0
24-O
ct-0
0
29-N
ov-0
0
21-D
ec-0
0
Abu
ndan
ce (1
06 cel
ls L
-1)
OtherDinoflagellatesPennate DiatomCentric DiatomCryptophyteMicroflagellate
(b) Cape Cod Bay
0
1
2
3
4
5
6
7
8
9
10
2-Fe
b-00
23-F
eb-0
0
14-M
ar-0
0
30-M
ar-0
0
1-M
ay-0
0
17-M
ay-0
0
8-Ju
n-00
6-Ju
l-00
19-J
ul-0
0
2-Au
g-00
16-A
ug-0
0
1-Se
p-00
22-S
ep-0
0
3-O
ct-0
0
24-O
ct-0
0
29-N
ov-0
0
21-D
ec-0
0
Abu
ndan
ce (1
06 cel
ls L
-1)
OtherDinoflagellatesPennate DiatomCentric DiatomCryptophyteMicroflagellate

2000 Annual Water Column Monitoring Report November 2001
6-16
Figure 6-6. Average phytoplankton abundance by major taxonomic group, (a) Boston Harbor and (b) coastal area. Data are average of surface and mid-depth samples from F23, F30 and F31 and
F13, F24 and F25, respectively.
(a) Boston Harbor
0
1
2
3
4
5
6
7
8
9
10
2-Fe
b-00
23-F
eb-0
0
14-M
ar-0
0
30-M
ar-0
0
1-M
ay-0
0
17-M
ay-0
0
8-Ju
n-00
6-Ju
l-00
19-J
ul-0
0
2-Au
g-00
16-A
ug-0
0
1-Se
p-00
22-S
ep-0
0
3-O
ct-0
0
24-O
ct-0
0
29-N
ov-0
0
21-D
ec-0
0
Abu
ndan
ce (1
06 cel
ls L
-1)
OtherDinoflagellatesPennate DiatomCentric DiatomCryptophyteMicroflagellate
(b) Coastal Area
0
1
2
3
4
5
6
7
8
9
10
2-Fe
b-00
23-F
eb-0
0
14-M
ar-0
0
30-M
ar-0
0
1-M
ay-0
0
17-M
ay-0
0
8-Ju
n-00
6-Ju
l-00
19-J
ul-0
0
2-Au
g-00
16-A
ug-0
0
1-Se
p-00
22-S
ep-0
0
3-O
ct-0
0
24-O
ct-0
0
29-N
ov-0
0
21-D
ec-0
0
Abu
ndan
ce (1
06 cel
ls L
-1)
OtherDinoflagellatesPennate DiatomCentric DiatomCryptophyteMicroflagellate

2000 Annual Water Column Monitoring Report November 2001
6-17
Figure 6-7. Average phytoplankton abundance by major taxonomic group, (a) boundary and (b) offshore area. Data are average of surface and mid-depth samples from F26 and F27, F06, and
F06 and F22 respectively.
(a) Boundary Area
0
1
2
3
4
5
6
7
8
9
10
2-Fe
b-00
23-F
eb-0
0
14-M
ar-0
0
30-M
ar-0
0
1-M
ay-0
0
17-M
ay-0
0
8-Ju
n-00
6-Ju
l-00
19-J
ul-0
0
2-Au
g-00
16-A
ug-0
0
1-Se
p-00
22-S
ep-0
0
3-O
ct-0
0
24-O
ct-0
0
29-N
ov-0
0
21-D
ec-0
0
Abu
ndan
ce (1
06 cel
ls L
-1)
OtherDinoflagellatesPennate DiatomCentric DiatomCryptophyteMicroflagellate
(b) Offshore Area
0
1
2
3
4
5
6
7
8
9
10
2-Fe
b-00
23-F
eb-0
0
14-M
ar-0
0
30-M
ar-0
0
1-M
ay-0
0
17-M
ay-0
0
8-Ju
n-00
6-Ju
l-00
19-J
ul-0
0
2-Au
g-00
16-A
ug-0
0
1-Se
p-00
22-S
ep-0
0
3-O
ct-0
0
24-O
ct-0
0
29-N
ov-0
0
21-D
ec-0
0
Abu
ndan
ce (1
06 cel
ls L
-1)
OtherDinoflagellatesPennate DiatomCentric DiatomCryptophyteMicroflagellate

2000 Annual Water Column Monitoring Report November 2001
6-18
0.0
1.0
2.0
3.0
4.0
5.0
6.0
7.0
1992 1993 1994 1995 1996 1997 1998 1999 2000
Abu
ndan
ce (m
illio
ns o
f cel
ls L
-1)
Figure 6-8. Phaeocystis pouchetii abundance in the nearfield for 1992-2000. Mean value for all nearfield stations sampled.

2000 Annual Water Column Monitoring Report November 2001
6-19
Figure 6-9. Alexandrium spp. abundance in the nearfield for 1992-2000. Mean value for all nearfield stations sampled.
0
10
20
30
40
50
60
1992 1993 1994 1995 1996 1997 1998 1999 2000
Abu
ndan
ce (c
ells
L-1
)

2000 Annual Water Column Monitoring Report November 2001
6-20
Figure 6-10. Pseudo-nitzschia abundance in the nearfield for 1992-2000. Mean value for all nearfield stations sampled.
0.00
0.05
0.10
0.15
0.20
0.25
1992 1993 1994 1995 1996 1997 1998 1999 2000
Abu
ndan
ce (m
illio
ns o
f cel
ls L
-1)

2000 Annual Water Column Monitoring Report November 2001
6-21
Figure 6-11. Total phytoplankton abundance for whole-water samples at selected areas for 1992-2000. Mean value for all area stations and depths sampled by survey (see Figures 6-5, 6-6, and
6-7 for station groupings).
Total Phytoplankton Abundance - Area Mean
0
2
4
6
8
10
12
1992 1993 1994 1995 1996 1997 1998 1999 2000
106 C
ells
/L
NEARFIELD HARBOR CCB COASTAL BOUNDARY

2000 Annual Water Column Monitoring Report November 2001
6-22
Figure 6-12. Total microflagellate abundance for whole-water samples at selected areas for 1992-2000. Mean value for all area stations and depths sampled by survey (see Figures 6-5, 6-6, and
6-7 for station groupings).
Total Microflagellate Abundance - Area Mean
0
1
2
3
4
5
6
1992 1993 1994 1995 1996 1997 1998 1999 2000
Abu
ndan
ce (1
06 C
ells
L-1
)
NEARFIELD HARBOR CCB COASTAL BOUNDARY

2000 Annual Water Column Monitoring Report November 2001
6-23
Figure 6-13. Zooplankton abundance for nearfield. Mean and range for all nearfield stations and depths sampled.
Figure 6-14. Zooplankton abundance for farfield. Mean and range for all farfield stations and depths sampled.
Nearfield Zooplankton
0
50
100
150
200
250
300
350
WF001
WF002
WN003
WF004
WN005
WN006
WF007
WN008
WN009
WN00A
WF00B
WN00C
WN00D
WF00E
WN00F
WN00G
WN00H
2/2-5 2/23-27
3/14 3/30-4/7
5/1 5/17 6/8-13 7/6 7/19 8/2 8/16-20
9/1 9/22 10/3-12
10/24 11/29 12/21
103
Ani
mal
s m
-3
Farfield Zooplankton
0
50
100
150
200
250
300
350
WF001 WF002 WF004 WF007 WF00B WF00E
2/2-5 2/23-27 3/30-4/7 6/8-13 8/16-20 10/3-12
103 A
nim
als
m-3
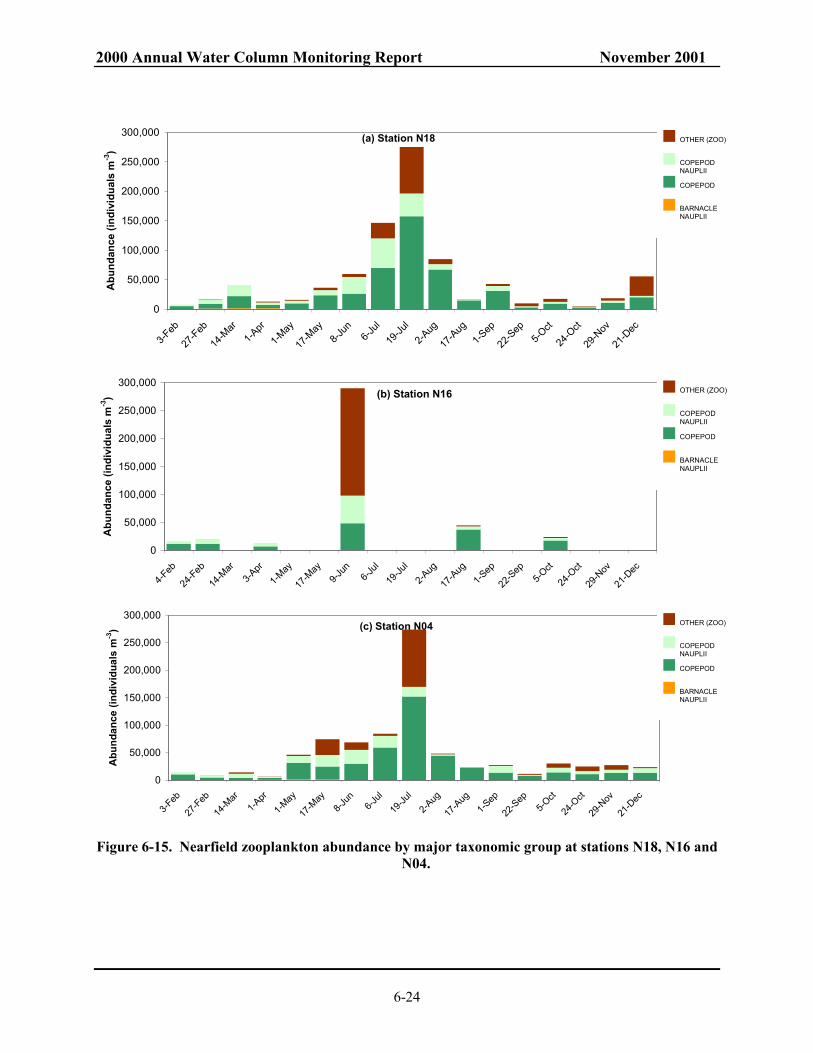
2000 Annual Water Column Monitoring Report November 2001
6-24
Figure 6-15. Nearfield zooplankton abundance by major taxonomic group at stations N18, N16 and N04.
(a) Station N18
0
50,000
100,000
150,000
200,000
250,000
300,000
3-Feb
27-Feb
14-M
ar1-A
pr
1-May
17-M
ay8-J
un6-J
ul
19-Ju
l
2-Aug
17-A
ug1-S
ep
22-S
ep5-O
ct
24-O
ct
29-N
ov
21-D
ec
Abu
ndan
ce (i
ndiv
idua
ls m
-3)
OTHER (ZOO)
COPEPODNAUPLII
COPEPOD
BARNACLENAUPLII
(b) Station N16
0
50,000
100,000
150,000
200,000
250,000
300,000
4-Feb
24-Fe
b
14-M
ar3-A
pr
1-May
17-M
ay9-J
un6-J
ul
19-Ju
l
2-Aug
17-A
ug1-S
ep
22-S
ep5-O
ct
24-O
ct
29-N
ov
21-D
ec
Abu
ndan
ce (i
ndiv
idua
ls m
-3)
OTHER (ZOO)
COPEPODNAUPLII
COPEPOD
BARNACLENAUPLII
(c) Station N04
0
50,000
100,000
150,000
200,000
250,000
300,000
3-Feb
27-Feb
14-M
ar1-A
pr
1-May
17-M
ay8-J
un6-J
ul
19-Ju
l
2-Aug
17-A
ug1-S
ep
22-S
ep5-O
ct
24-O
ct
29-N
ov
21-D
ec
Abu
ndan
ce (i
ndiv
idua
ls m
-3)
OTHER (ZOO)
COPEPODNAUPLII
COPEPOD
BARNACLENAUPLII

2000 Annual Water Column Monitoring Report November 2001
6-25
Figure 6-16. Total zooplankton abundance at selected areas for 1992-2000. Mean value for all area stations sampled by survey (see figures 6-5, 6-6, and 6-7 for station groupings).
Total Zooplankton Abundance - Area Means
0
50,000
100,000
150,000
200,000
250,000
300,000
1992 1993 1994 1995 1996 1997 1998 1999 2000
Indi
vidu
als/
m3
NEARFIELD HARBOR CCB COASTAL BOUNDARY
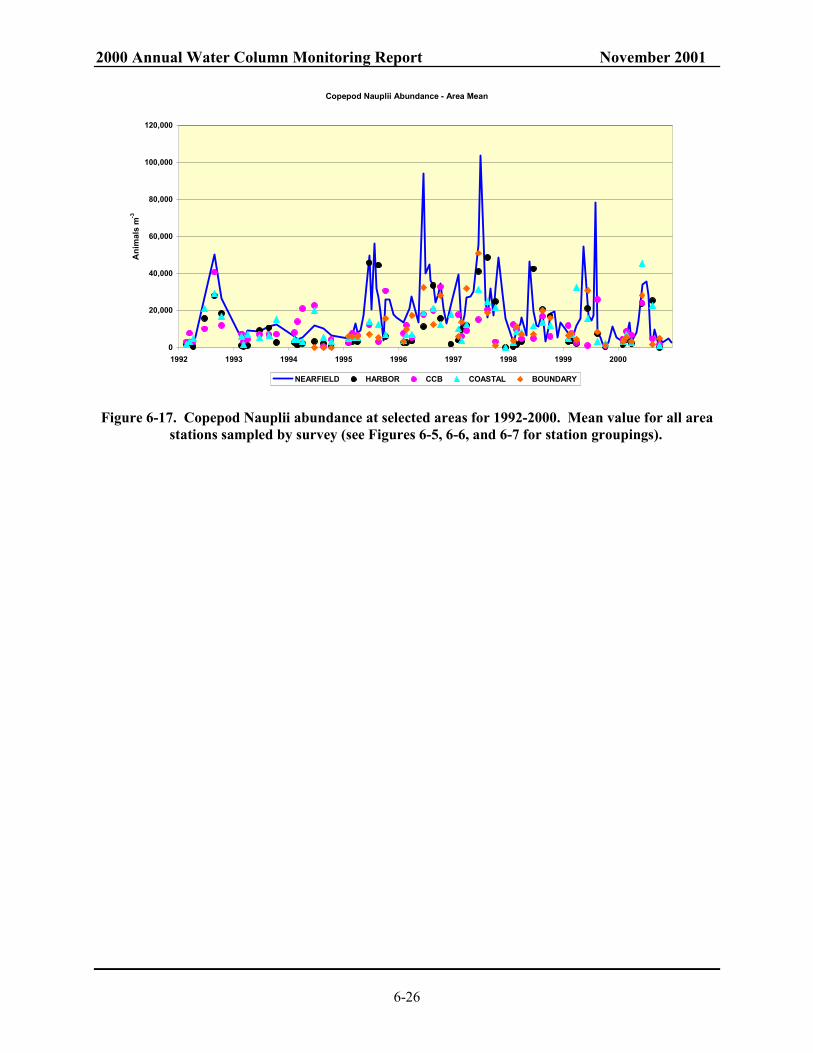
2000 Annual Water Column Monitoring Report November 2001
6-26
Figure 6-17. Copepod Nauplii abundance at selected areas for 1992-2000. Mean value for all area stations sampled by survey (see Figures 6-5, 6-6, and 6-7 for station groupings).
Copepod Nauplii Abundance - Area Mean
0
20,000
40,000
60,000
80,000
100,000
120,000
1992 1993 1994 1995 1996 1997 1998 1999 2000
Ani
mal
s m
-3
NEARFIELD HARBOR CCB COASTAL BOUNDARY

2000 Annual Water Column Monitoring Report November 2001
6-27
Figure 6-18. Oithona similis adult and copepodite abundance at selected areas for 1992-2000. Mean value for all area stations sampled by survey (see Figures 6-5, 6-6, and 6-7 for station
groupings).
Oithona Abundance - Area Mean
0
10,000
20,000
30,000
40,000
50,000
60,000
70,000
80,000
1992 1993 1994 1995 1996 1997 1998 1999 2000
Ani
mal
s m
-3
NEARFIELD HARBOR CCB COASTAL BOUNDARY

2000 Annual Water Column Monitoring Report November 2001
6-28
Figure 6-19. Acartia spp. adults and copepodites abundance at selected areas for 1992-2000. Mean value for all area stations sampled by survey (see Figures 6-5, 6-6, and 6-7 for station groupings).
Acartia Abundance - Area Mean
0
5,000
10,000
15,000
20,000
25,000
30,000
35,000
40,000
45,000
1992 1993 1994 1995 1996 1997 1998 1999 2000
Indi
vidu
als/
m3
NEARFIELD HARBOR CAPE COD COASTAL BOUNDARY
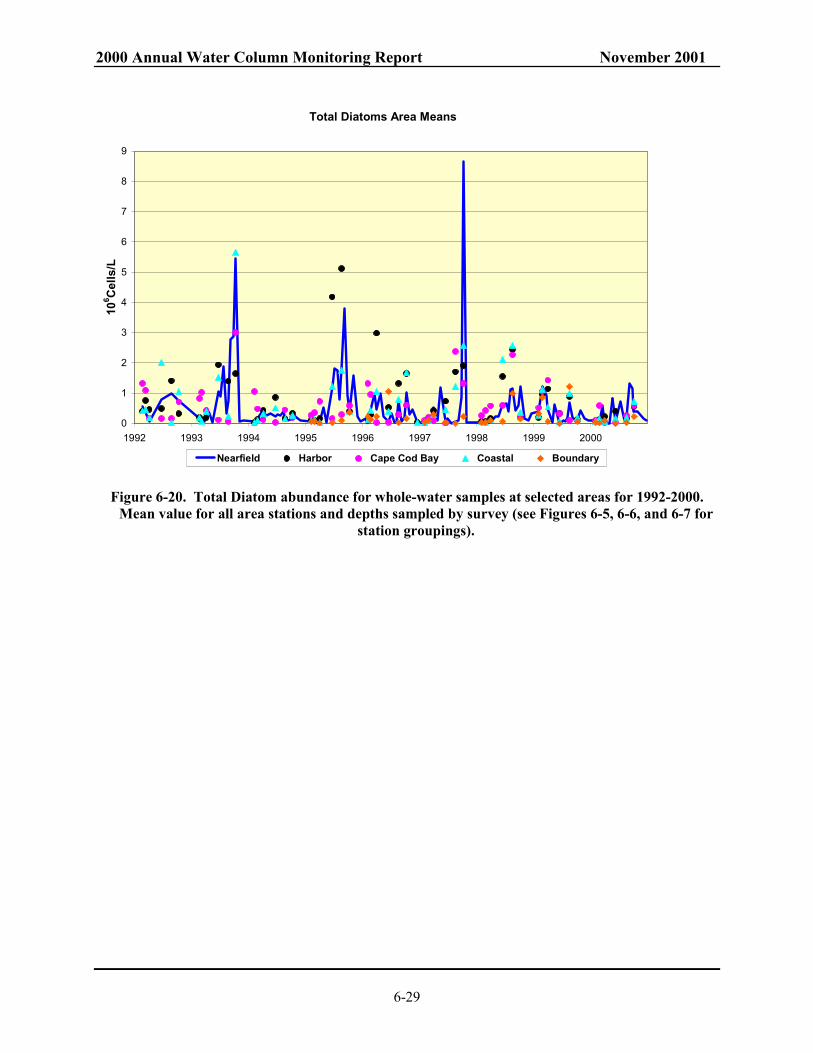
2000 Annual Water Column Monitoring Report November 2001
6-29
Figure 6-20. Total Diatom abundance for whole-water samples at selected areas for 1992-2000. Mean value for all area stations and depths sampled by survey (see Figures 6-5, 6-6, and 6-7 for
station groupings).
Total Diatoms Area Means
0
1
2
3
4
5
6
7
8
9
1992 1993 1994 1995 1996 1997 1998 1999 2000
106 C
ells
/L
Nearfield Harbor Cape Cod Bay Coastal Boundary

2000 Annual Water Column Monitoring Report November 2001
6-30
Figure 6-21. Meroplankton abundance at selected areas for 1992-2000. Mean value for all area stations and depths sampled by survey (see Figures 6-5, 6-6, and 6-7 for station groupings).
Meroplankton Abundance - Area Mean
0
25,000
50,000
75,000
100,000
125,000
150,000
175,000
200,000
1992 1993 1994 1995 1996 1997 1998 1999 2000
Ani
mal
s m
-3
NEARFIELD HARBOR CCB COASTAL BOUNDARY

2000 Annual Water Column Monitoring Report November 2001
7-1
7.0 SUMMARY OVERVIEW OF 2000 This section summarizes trends in water quality and the major water column events of 2000. Three major events or themes were evident in the 2000 water quality data: 1) a substantial spring Phaeocystis bloom, 2) a major regional fall bloom with unprecedented chlorophyll concentration, and 3) exceedance of the Contingency Plan fall chlorophyll and dissolved oxygen percent saturation thresholds. The potential causes of the observed fall chlorophyll bloom and how this manifestation fits into current understanding of phytoplankton physiological response to various environmental factors such as light, nutrient availability, and nutrient speciation are also considered in the section. Over the course of the Harbor and Outfall Monitoring Program 1992-2000, a general trend in water quality events has emerged from the data collected in Massachusetts and Cape Cod Bays. The trends are evident even though the timing and year-to-year manifestations of these events are variable. These include trends in stratification of the water column, nutrients, light, and chlorophyll and changes in the dissolved oxygen in the deep waters of the bay. In general, but not always, a winter/spring phytoplankton bloom occurs as light becomes more available, temperatures increase, and nutrients are readily available. Later in the spring, the water column transitions from well mixed to stratified conditions, which serves to cut off the supply of nutrients to the surface waters and terminate the spring bloom. The summer is generally a period of strong stratification, depleted nutrients, and a relatively stable mixed-assemblage phytoplankton community. Dissolved oxygen declines in the bottom waters over the course of the summer as increasing temperatures lead to higher respiration rates and stratification isolates these waters from the surface water sources of dissolved oxygen. In the fall, stratification deteriorates and supplies nutrients to surface waters often developing into a fall phytoplankton bloom. The lowest dissolved oxygen concentrations are observed prior to the fall overturn of the water column – usually in October. By late fall or early winter, the water column becomes well mixed and resets to winter conditions.
7.1 Summary of 2000 Conditions The physical processes in 2000 closely followed climatology and none of the forcing parameters or physical variables showed extreme behavior. In reference to the fall chlorophyll bloom, there was no evidence of particularly vigorous mixing, although there was a fairly rapid reduction in stratification and strong downwelling in the fall. Moreover, nearfield data indicate that there was an influx of nutrient rich, more saline, dense waters intro Massachusetts Bay in late August and September. However,, there were no clear signs of an anomalous advection or other physical forcing factors that might indicate a physically stimulated plankton bloom. Physical forcing mechanisms related to the North Atlantic Oscillation or potential regional wind effects on inclination of the pycnocline/thermocline, however, have not been evaluated in detail at this time, but may play a role in these wide-scale biological phenomena. In general, 2000 seasonal trends in nutrient, chlorophyll and dissolved oxygen concentrations were typical for the nearfield area in comparison to previous baseline monitoring years. The values observed for many of these parameters in 2000, however, were baseline maxima. A review of annual mean nutrient concentrations shows a significant trend of increasing nutrients across Massachusetts Bay from 1992 to 2000 (Figure 7-1a). In Boston Harbor, NH4 concentrations increased by ~7 µM over the baseline period (primarily due to increased discharge of NH4 from the Deer Island Facility; Figure 7-1b). Ammonium concentrations have increased to a lesser degree in coastal, nearfield, and offshore waters. The increase in nutrient concentrations has been coincident with an increase in chlorophyll and POC from 1997 to 2000 as shown in a comparison of nearfield fall means of these parameters (Figure 7-2).

2000 Annual Water Column Monitoring Report November 2001
7-2
Nearfield chlorophyll concentrations in 2000 were unprecedented exceeding 1992-1999 winter/spring, summer, fall, and annual mean values. Annual mean chlorophyll concentrations for the other areas of the bays also achieved baseline maxima in 2000 (see Figure 4-33). There has been a substantial increase in annual mean chlorophyll from 1997 to 2000. The factors controlling this increase in annual mean chlorophyll concentrations are likely related to the regional and local factors affecting nutrient concentrations. Although high chlorophyll concentrations (as an indicator of biomass) in 1999 contributed to baseline minima in DO concentrations, the nearfield and Stellwagen Basin bottom water DO minima for 2000 were midrange of baseline values. Physical mechanisms related to the residence time of water in the coastal zone or diffusion/mixing of DO into nearfield bottom waters may play an important direct or indirect role in controlling bottom water DO concentrations in Massachusetts Bay. The fall of 2000 marked the transfer of the MWRA effluent discharge from the harbor outfall to the offshore outfall in Massachusetts Bay (September 6, 2000). The transfer of discharge to the bay decreased NH4 concentration in the harbor, coastal waters, and western nearfield, and moved this anthropogenic signal offshore to the center of the nearfield. From the fall of 1998 to September 2000, very high concentrations of NH4 were continually observed in Boston Harbor and elevated concentrations were found in nearby coastal and western nearfield waters. The source of the NH4 was determined to be an increase in the discharge of NH4 from the Deer Island facility resulting from a combination of increased treated sewage flow (as all sewage from the MWRA system is now treated at the Deer Island facility) and the improved treatment process. The secondary treatment, which is fully online during low flow conditions, treats the sewage more completely breaking down organic wastes and, as a by-product of the process, leading to high NH4 concentrations in the effluent. Although it is not a conservative tracer due to biological utilization, NH4 has proven to be an excellent tracer of the influence of Boston Harbor on coastal and western nearfield waters over the course of the baseline monitoring program and it appears that it is a clear indicator of the effluent plume in the nearfield now that the outfall is online. The availability of NH4 in the nearfield after September 6, 2000 may have contributed to a localized increase in chlorophyll concentrations and helped to sustain the fall bloom in the nearfield for an extended duration. Additional evaluations to quantify the potential effects are recommended. The biological trends in production and plankton in 2000 generally followed trends observed during previous baseline monitoring years. A substantial Phaeocystis bloom occurred in the spring. A bloom of large chain-forming diatoms occurred in the fall, although phytoplankton abundance in the fall of 2000 was moderate in comparison to the substantial fall blooms in 1993, 1995 and 1997. These blooms and the conditions that contributed to their occurrence and duration were the major natural events of 2000. The major anthropogenic event was the transfer of the MWRA effluent discharge from the harbor outfall to the offshore outfall in Massachusetts Bay. Although these events are not directly connected, the data suggest that the MWRA effluent – specifically NH4 – inputs may have a localized impact on chlorophyll and POC concentrations in the nearfield. The blooms, regional conditions, characteristics of discharge, and their interrelationships are discussed in more detail in the following subsections.
7.1.1 Phaeocystis Bloom In winter/spring 2000, a system-wide major bloom of Phaeocystis pouchetii achieved abundance levels approaching 12.3 million cells per liter, which is the highest abundance observed for this species over the baseline period. Phaeocystis has been observed to bloom in the winter/spring in
2000 Annual Water Column Monitoring Report November 2001
7-3
two-to three-year cycles with blooms recorded in 1992, 1994, 1997, and 20001. Observations of concurrent Phaeocystis blooms in 1994 in Buzzards Bay (Turner et al., 2000) and “upstream “ from Massachusetts Bay in the Gulf of Maine in 2000 reveal that such Phaeocystis blooms are regional events. The long-standing nature of such blooms is also attested to by Bigelow’s (1926) observation of them in April in Massachusetts Bay and off Cape Cod Bay decades ago. The major Phaeocystis bloom and unprecedented chlorophyll concentrations observed in spring and summer of 2000 imply that there was a substantial amount of organic material produced in the nearfield. It was anticipated that the flux of this organic material into the bottom waters might lead to exceptionally low DO concentrations during the fall of 2000. The situation was perhaps mitigated by an influx of less DO depleted waters from offshore. Also, the influx of nutrient rich, saline waters in late August and September may have alleviated detrimental DO conditions and may have been a source of nutrients for the fall bloom. However, a connection between these physical mechanisms and DO concentrations is speculative. The interaction between the boundary conditions and responses in Massachusetts Bay is the subject of ongoing data analysis and modeling, which will help to clarify the underlying relationships.
7.1.2 Fall 2000 Bloom The 2000 fall bloom had started by the September 1st nearfield survey and continued through late October. The peak survey mean chlorophyll concentration in late October was higher than any observed over the baseline period. These high concentrations combined with the extended duration of the bloom resulted in a fall mean chlorophyll concentration of 5.69 µgL-1. The fall 2000 mean was higher than all baseline values and continued the trend of elevated fall chlorophyll concentrations started in 1999. There was a coincident, though not commensurate, increase in POC concentrations during these fall blooms. The 1999 and 2000 fall blooms exhibited the highest fall mean POC concentrations in the nearfield for 1992 to 2000. As in 1999, phytoplankton abundance, primary production, and chlorophyll did not parallel each other closely during the fall bloom in 2000. Nearfield phytoplankton abundance peaked in early September and gradually declined through October. Productivity was highest at station N18 during the September surveys and in late October further offshore at station N04. Chlorophyll concentrations, although steadily increasing in September, did not reach maximum levels until late October. The progression of the fall bloom in the nearfield has followed two general patterns. In 1993 and 1997, seasonal peaks in production, phytoplankton, POC and chlorophyll occurred concurrently (Figure 7-3). Both of these fall blooms were dominated by diatoms, the 1993 bloom was dominated by the pennate diatom Asterionellopsis glacialis and in 1997 the bloom primarily consisted of the centric diatom Thalassiosira. In 1995, 1999 and 2000, there was a disconnect in the timing of peaks in the various biological parameters (Figure 7-4). The 1995 bloom exhibited elevated diatom abundance and POC concentrations in early September coincident with a slight increase in production and chlorophyll concentration. Peak production, however, was measured in early October and peak chlorophyll concentrations in early November. Both 1999 and 2000 had moderate phytoplankton abundances in comparison to those measured during the 1993, 1995, and 1997 fall blooms (Figure 7-4). POC and chlorophyll concentrations, however, were highest during these two years and production in fall 2000 was comparable to 1997 peak production. No direct comparison can be made to the 1993 production values as different methods were used, but the data are included for
1 This suggestion of an intermittent interannual “cycle” was complicated by the reappearance of Phaeocystis in 2001, only a year after the last bloom. Whether this denotes any substantial change in the plankton of Massachusetts Bay in the wake of the outfall coming on line in fall of 2000 remains to be seen. However, if Phaeocystis blooms become more frequent and are uncritically attributed to the outfall discharge, it is important to remember that periodic observations of these blooms in Massachusetts Bay preceded the outfall by almost a decade.

2000 Annual Water Column Monitoring Report November 2001
7-4
intraannual trends (i.e. higher production in October vs. August in 1993). In 1999 and 2000, peak production rates, phytoplankton abundance and POC concentrations preceded peak chlorophyll concentrations by about a month. The apparent disconnect between the high chlorophyll concentrations observed during fall blooms in Massachusetts Bay and other biological measurements has been noted in previous MWRA reports (e.g. HydroQual, 1999 and Libby et al. 2000b). It was first noticed following the bay-wide bloom of Asterionellopsis glacialis during the fall of 1993. The Bays Eutrophication Model (BEM) was unable to adequately represent the chlorophyll signal of the A. glacialis bloom. The model adequately characterized the POC that was observed in the field, but did not do a very good job of representing the large increase in chlorophyll concentrations that was observed. One hypothesis for this was that the “winter phytoplankton assemblage” in the model did not accurately represent the C/Chla ratio of the monoculture bloom that occurred. The phytoplankton assemblages in the model are represented as a summer “mixed assemblage” and a winter/spring “diatom assemblage.” There are a number of important rate constants that vary according to which assemblage is being used. One of the key constants is the phytoplankton carbon to chlorophyll ratio (C/Chla ratio). The C/Chla ratios under nutrient-saturated conditions used by the model for the summer and winter assemblage are 65 and 40 mg C/mg Chla, respectively. In 1993, the phytoplankton assemblage of Massachusetts Bay was dominated by A. glacialis and although modeling efforts utilized the rate constants associated with a diatom assemblage, the actual C/Chla ratio may have been lower during this monospecific bloom. C/Chla ratios of approximately 20 were observed at stations with the highest phytoplankton abundance, productivity and chlorophyll concentrations. This difference likely led to the discrepancies between chlorophyll concentrations from the model output and monitoring data. To better understand phytoplankton physiological dynamics of the fall bloom, the C/Chla ratio over the baseline period was examined. Unfortunately, data from 1995 to 1997 were not conducive to this analysis as the phytoplankton and chlorophyll sampling was decoupled and the data could not be easily rectified. The C/Chl ratio was calculated based on phytoplankton carbon rather than POC to remove interference due to detrital forms of organic carbon. Estimates of phytoplankton carbon are based on a wide array of species-specific carbon content factors developed for MWRA from literature values. The carbon value is based on the carbon content of plankton for each species multiplied by the abundance of the species, which are then summed for each plankton sample. The data indicate that the C/Chla ratio for the fall has been consistently lower than the winter/spring and summer values (Table 7-1). Across surveys in the HOM database, the C/Chla ratio ranged from 10 to 420 for survey means. Lower values consistently occurred during spring and fall blooms and the higher values during the less productive, nutrient-limited summer season. The minimum and maximum C/Chla ratios observed are near the limits that have been reported in the literature. For example, estimates for C/Chla ratios span from a range of 25 to 100 (Strickland, 1960) to <10 to >300 (Cloern et al., 1995). Others have reported intermediate estimates of 10 to 200 (Falkowski and Raven, 1997) and <10 to >100 (Geider et al., 1997).

2000 Annual Water Column Monitoring Report November 2001
7-5
Table 7-1. Seasonal mean of nearfield phytoplankton C/Chla (data from surface and mid-depth samples only; 1995 to 1997 data not included).
Winter/Spring Summer Fall Year Mean SD N Mean SD N Mean SD N 1992 105.8 87.9 30 250.7 259.4 22 70.7 23.9 5 1993 115.8 74.2 32 148.9 58.7 11 50.1 16.7 10 1994 56.3 30.6 28 62.2 38.4 27 54.5 12.6 13 1998 95.0 130.8 20 139.5 116.8 32 72.9 42.9 22 1999 51.1 30.7 22 52.2 36.3 32 19.4 13.6 26 2000 26.4 26.7 22 56.6 87.2 32 27.2 21.8 26 Mean 78.3 78.5 154 107.6 137.4 156 42.9 32.8 102
By gaining insight on what leads to lower C/Chla ratios, we can improve our understanding of the cause and effect relationship of conditions that lead to the development of fall blooms in Massachusetts Bay. The phytoplankton of the western Gulf of Maine are characterized by fall peak in biomass and a fall peak in photosynthetic efficiency (O’Reilly and Zeitlin, 1998). The lower C/Chla ratios are associated with increased photosynthetic efficiency. Much of this enhanced fall production appears to be the result of increased nutrient flux from below the thermocline to the light-replete surface waters. During the fall, there is typically a shift from a dinoflagellate-dominated to diatom-dominated phytoplankton community that is nearly coincident with the breakdown of stratification and concomitant increase in diffusion of nutrient to the surface layer. Both the shift in phytoplankton community composition and the expected decrease in nutrient limitation and concomitant increases in photosynthetic efficiency are expected to result in decreased phytoplankton community C/Chla. The form of nitrogen (NO3 vs. NH4) may also play a role in achieving lowered C/Chla. Higher growth efficiencies are achieved on NH4- rather than NO3-based growth due to the lowered energetic cost of NH4 based growth (Falkowski and Raven, 1997; Sakshaug, et al., 1997). Note that increased photosynthetic efficiency and related decreased C/Chla do not necessarily result in high biomass blooms. Rather, the low C/Chla observed in autumn 2000 nearfield phytoplankton is a physiological indicator of balanced, near nutrient-replete growth in sub-saturating irradiance conditions that result in a disproportionate increase in chlorophyll versus carbon biomass – increased biomass, but also a larger increase in chlorophyll per cell. The seasonal variation in C/Chla ratios follows the seasonality of phytoplankton blooms in Massachusetts Bay. Low C/Chla ratios are associated with high growth efficiency occurring at sub-saturating irradiances and nutrient replete conditions. The taxonomic variation in C/Chla ratios indicates that a phytoplankton community dominated by diatoms would be the most likely candidate for low C/Chla ratios. Both of these factors are instrumental in the development of both winter/spring and fall blooms in Massachusetts Bay. The MWRA monitoring program has documented the importance of the fall blooms that occur on a more frequent basis in the bay. The higher frequency of fall blooms versus winter/spring blooms from 1992-2000 is one reason for the lower C/Chla and is due to the physiological response of phytoplankton to environmental conditions in the late summer/early fall in Massachusetts Bay. With nutrient and light being comparable, phytoplankton are physiologically able to achieve higher growth efficiencies and lower C/Chla ratios in warmer (15 to 20C) rather than cooler (5 to 10C) waters (Verity, 1981). The nearfield has received nutrient inputs via tidal exchange from MWRA discharges in Boston Harbor over the entire baseline period (Kelly, 1995). Modifications to the Deer Island treatment plant and diversion of flow from the Nut Island plant in 1998 drastically increased the amount of NH4

2000 Annual Water Column Monitoring Report November 2001
7-6
discharged in the effluent and therefore available in the harbor and nearfield for phytoplankton utilization (Libby et al., 2000b). The availability of NH4 in the nearfield since 1998 may have been a contributing factor to the lower C/Chla ratios in the fall of 1999 and spring and fall of 2000. During the fall of 2000, the direct input of nutrients from below the pycnocline or enhancement of diffusion through the pycnocline may be expected to further increase photosynthetic efficiency of the phytoplankton in the light-replete surface waters. In the immediate nearfield area, outfall-enhanced nutrient flux through the pycnocline to light-replete surface layers could enhance the current tendency for elevated fall biomass and photosynthetic efficiency. Whether this physiological condition for efficient growth was influenced by MWRA outfall activity or was part of the expected fall bloom cycle remains unclear (recall the low C/Chla numbers and high photosynthetic efficiency observed in the fall 1993 A. glacialis bloom). To address this question now that the outfall is online, nutrient flux across the pycnocline in the fall must be quantified and comparisons made between baseline and current flux. There are many other factors that contribute to the development of fall blooms in Massachusetts and Cape Cod Bays and for the rest of the Western Gulf of Maine. Physical forcing mechanisms related to basin scale processes (i.e. NAO) or regional currents/wind dynamics may play a role in these wide-scale biological phenomena and need to be evaluated in more detail. A variety of biological factors play a role in bloom development and grazing is expected to have played at least a localized role in the development, duration, or magnitude of the fall 2000 bloom in Boston Harbor and nearby coastal and nearfield waters. In Section 4.2.2, it was suggested that the input of nutrients to the nearfield by the bay outfall (specifically NH4) might have had a localized effect on chlorophyll concentrations. Note that the chlorophyll was elevated in the coastal and western nearfield surface waters relative to areas further offshore (see Figure 4-31). A decrease in grazing pressure on phytoplankton in these near shore waters could also have led to the occurrence of this surface chlorophyll distribution. The fall 2000 ctenophore (Mnemiopsis leidyi) “bloom” was unprecedented for the baseline period and caused severe decimation of abundances of copepods in Boston Harbor, coastal and nearfield waters. Such overpredation of zooplankton grazers could have contributed to resultant phytoplankton increases during the fall, particularly in terms of the bloom of large chain-forming diatoms. Unusually high abundances of ctenophores were also observed in October 2000 in Buzzards Bay suggesting that the ctenophore bloom in Boston Harbor was part of another regional event.
7.2 Contingency plan thresholds September 6, 2000 marked the end of the baseline period, completing the data set for MWRA to calculate the threshold values that will be used to compare monitoring results to baseline conditions. Those parameters include background levels for dissolved oxygen concentrations and percent saturation in bottom waters of the nearfield and Stellwagen Basin, annual and seasonal chlorophyll levels in the nearfield, and nuisance algae (Alexandrium, Phaeocystis, and Pseudo-nitzschia; Table 7-2). The fall of 2000 was the first seasonal time period to be compared against these thresholds. The caution level for bottom water dissolved oxygen percent saturation (80%) was exceeded in both the nearfield and Stellwagen Basin. The fall mean areal chlorophyll caution threshold (161 mg m-2) was also exceeded. None of the nuisance algae thresholds were exceeded for fall 2000. In 1997, the Outfall Monitoring Task Force recommended deleting bottom dissolved oxygen saturation as a threshold parameter, because baseline conditions frequently fell below the thresholds that had been fixed by state standards, both in the nearfield and in Stellwagen Basin. EPA and MADEP declined to accept this recommendation but in 2001 suggested adding the phrase “unless

2000 Annual Water Column Monitoring Report November 2001
7-7
background conditions are lower” to the descriptions of both dissolved oxygen concentration and dissolved oxygen saturation, bringing the threshold into closer conformity with the state standard. Fall 2000 bottom water dissolved oxygen percent saturation minima were well within the range of values observed over the baseline period and were not lower than the background conditions of 64.3% saturation in the nearfield and 66.3% saturation in Stellwagen Basin (Table 7-2). Chlorophyll threshold values are based on areal measurements, integrating data from 0.5-m intervals. The fall 2000 mean areal chlorophyll was 205 mg m-2 exceeding the caution threshold of 161 mg m-2. Had the thresholds been in place, fall chlorophyll concentrations for 1999 would have also exceeded the fall caution threshold. As discussed herein, fall blooms are typical for the bays and the bloom in 2000 occurred over the entire Gulf of Maine region and exhibited elevated chlorophyll concentrations from early September through late October. The fall bloom in 2000, as well as 1999, is part of the natural variability of the region.
Table 7-2. Contingency plan threshold values for water column monitoring.
Location Parameter Time Period Caution Level Warning Level Background Bottom Water
DO concentration Survey Mean in June-October
< 6.5 mg/l (unless background lower)
< 6.0 mg/l (unless background lower) 5.75 mg/l
Nearfield Bottom Water
DO %saturation Survey Mean in June-October
< 80% (unless background lower)
< 75% (unless background lower) 64.3%
Bottom Water DO concentration
Survey Mean in June-October
< 6.5 mg/l (unless background lower)
< 6.0 mg/l (unless background lower) 6.2 mg/l Stellwagen
Basin Bottom Water DO %saturation
Survey Mean in June-October
< 80% (unless background lower)
< 75% (unless background lower) 66.3%
Annual 107 mg/m2 143 mg/m2 -- Winter/spring 182 mg/m2 -- --
Summer 80 mg/m2 -- -- Nearfield Chlorophyll
Autumn 161 mg/m2 -- -- Winter/spring 2,020,000 cells/l -- --
Summer 334 cells/l -- -- Nearfield Phaeocystis pouchetii
Autumn 2,370 cells/l -- -- Winter/spring 21,000 cells/l -- --
Summer 38,000 cells/l -- -- Nearfield Pseudonitzschia Autumn 24,600 cells/l -- --
Nearfield Alexandrium tamarense
Any nearfield screened sample 100 cells/l -- --
The winter/spring Phaeocystis bloom and region-wide fall bloom resulted in unprecedented chlorophyll levels in 2000. Although considered a nuisance species, Phaeocystis blooms appear to be part of the normal cycle for Massachusetts Bays and other coastal waters in the region. The 2000 winter/spring bloom was substantial, but it did not lead to detrimental water quality conditions such as low dissolved oxygen. During the HOM program, fall blooms have been shown to be common events in Massachusetts and Cape Cod Bays, but the fall 2000 was remarkable in both the magnitude and duration of the bloom in the nearfield. Although unable to attribute the actual cause of the extraordinary chlorophyll concentrations observed during the region-wide fall bloom of 2000, we have gained a preliminary understanding of the many factors that contribute both regionally and locally to the development of these blooms. From an ecological point of view, the fall 2000 bloom was primarily a chlorophyll bloom. There was a disconnect between elevated phytoplankton abundances and high productivity in September and the chlorophyll concentrations maximum of late October. POC concentrations were elevated during the bloom, but not proportional to the increases in

2000 Annual Water Column Monitoring Report November 2001
7-8
chlorophyll. Overall, the system was behaving naturally and generally within the bounds observed during the previous eight years of baseline monitoring and established by other ecological studies. A number of topics have been highlighted in this report that should be addressed in a more detailed analysis. These topics are presented here as recommendations for future focus: • Closer examination of basin or regional physical forcing mechanisms including potential impacts
related to the North Atlantic Oscillation and regional wind effects on inclination of the pycnocline/thermocline and the role they may play affecting region-wide biological phenomena.
• Focus on potential impact of increased NH4 concentrations in effluent discharge from the bay
outfall. Fall 2000 data have shown the stark contrast between high NH4 concentrations in effluent versus very low background concentrations. How might this affect production and phytoplankton community structure in the nearfield (i.e. concomitant increases in NH4 and chlorophyll concentrations, changes in phytoplankton community, etc.)? How can we distinguish between localized effects and regional trends?
• Develop a box model to quantify nutrient fluxes into and out of the nearfield area. This will
provide us with a better platform from which to interpret responses of the system to changes in local (bay outfall, upwelling, and runoff) and regional (Gulf of Maine) nutrient dynamics.
• Continue to examine the cyclical blooms of various phytoplankton species (i.e. Phaeocystis
pouchetii) and occurrence of unique phytoplankton or zooplankton events (i.e. ctenophore bloom). We need to understand these cycles and geographic extent/range of these bloom events in order to put MWRA monitoring results into a regional context.

2000 Annual Water Column Monitoring Report November 2001
7-9
Figure 7-1. Annual mean DIN and ammonium in Massachusetts and Cape Cod Bays.
(a) Annual Mean DIN
0
2
4
6
8
10
12
14
16
1992 1993 1994 1995 1996 1997 1998 1999 2000
DIN
( µµ µµM
)
Nearfield Boston Harbor Boundary Cape Cod Coastal Offshore
(b) Annual Mean Ammonium
0
2
4
6
8
10
12
1992 1993 1994 1995 1996 1997 1998 1999 2000
Bos
ton
Har
bor N
H4 (µµ µµ
M)
0
1
2
3
4
5
6
Oth
er A
reas
NH 4
( µµ µµM
)
Boston Harbor Nearfield Boundary Cape Cod Coastal Offshore

2000 Annual Water Column Monitoring Report November 2001
7-10
Nearfield Fall Means
0
1
2
3
4
5
6
7
1992 1993 1994 1995 1996 1997 1998 1999 2000
Nut
rient
s ( µµ µµ
M) &
Chl
orop
hyll
( µµ µµg
L-1)
0
5
10
15
20
25
30
35
POC
( µµ µµM
)
DIN NH4 Chlorophyll POC
Figure 7-2. Mean DIN, ammonium, chlorophyll, and POC concentrations in the nearfield during the fall period.

2000 Annual Water Column Monitoring Report November 2001
7-11
(a) 1993
0
3
6
9
12
15
Aug Sep Oct Nov Dec0
12
24
36
48
60
POC
( µµ µµM
)
(b) 1997
0
3
6
9
12
15
Aug Sep Oct Nov Dec0
12
24
36
48
60
POC
( µµ µµM
)
Production Total Phytoplankton Total Diatoms Chlorophyll POC
Figure 7-3. Nearfield survey mean values for production (gCm-2d-1), chlorophyll (µµµµgL-1), total phytoplankton (106 cellsL-1) and total diatoms (106 cellsL-1) along left-hand axis and POC (µµµµM) on right-hand axis for (a) 1993 and (b) 1997. Note that production values for 1993 cannot be directly compared to 1997 or the values in Figure 7-4 as different methods were used.
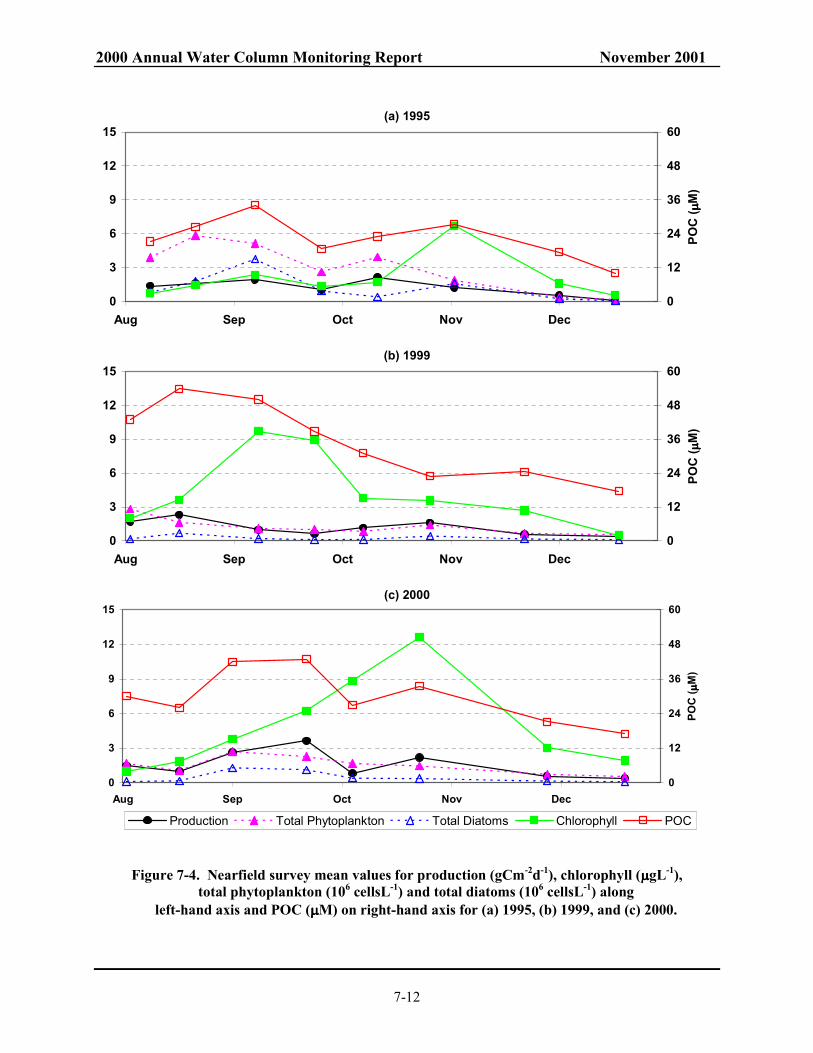
2000 Annual Water Column Monitoring Report November 2001
7-12
(a) 1995
0
3
6
9
12
15
Aug Sep Oct Nov Dec0
12
24
36
48
60
POC
( µµ µµM
)
(b) 1999
0
3
6
9
12
15
Aug Sep Oct Nov Dec0
12
24
36
48
60
POC
( µµ µµM
)
(c) 2000
0
3
6
9
12
15
Aug Sep Oct Nov Dec0
12
24
36
48
60
POC
( µµ µµM
)
Production Total Phytoplankton Total Diatoms Chlorophyll POC
Figure 7-4. Nearfield survey mean values for production (gCm-2d-1), chlorophyll (µµµµgL-1), total phytoplankton (106 cellsL-1) and total diatoms (106 cellsL-1) along
left-hand axis and POC (µµµµM) on right-hand axis for (a) 1995, (b) 1999, and (c) 2000.

2000 Annual Water Column Monitoring Report November 2001
8-1
8.0 REFERENCES Albro CS, Trulli HK, Boyle JD, Sauchuk SA, Oviatt CA, Keller AA, Zimmerman C, Turner JT, Borkman D, Tucker J. 1998. Combined work/quality assurance plan for baseline water quality monitoring: 1998-2000. Boston: Massachusetts Water Resources Authority. Report ENQUAD ms-048. 121 p. Anderson DM. 1997. Bloom dynamics of toxic Alexandrium species in the northeastern U.S. Limnology & Oceanography 42: 1009-1022. Arar EJ and Collins GB. 1997. In Vitro Determination of Chlorophyll a and Phaeophytin a in Marine and Freshwater Phytoplankton by Fluorescence. Method 445.0 Revision 1.2 (September 1997). U.S. Environmental Protection Agency, Environmental Monitoring Systems Laboratory, Office of Research and Development, Cincinnati, OH. Battelle. 1999. SOP No. 5-265, Extraction and Analysis of Chlorophyll a and Phaeophytin a in Seawater using a Turner [Designs] Model 10AU Fluorometer. Bigelow HB. 1926. Plankton of the offshore waters of the Gulf of Maine. Bulletin of the United States Bureau of Fisheries, Vol. 40, Part 1. 509 pp. Cibik SJ, Howes BL, Taylor CD, Anderson DM, Davis CS, Loder TC, III, Boudrow RD, Bowen JD. 1996. 1995 Annual water column monitoring report. Boston: Massachusetts Water Resources Authority. Report ENQUAD 1996-07. 254 p. Cibik SJ, Lemieux KB, Tracey JK, Kelly SJ, Howes BL, Taylor CD, Loder TC, III. 1998. 1997 Annual water column monitoring report. Boston: Massachusetts Water Resources Authority. Report ENQUAD 1998-19. 258 p. Cleveland JS, MJ Perry, DA Kiefer, and TC Talbot. 1989. Maximal quantum yield of photosynthesis in the northwestern Sargasso Sea. J. Mar. Res. 47: 869-886. Cloern, JE, Grenz, C and Vider-Lucas, L. 1995. An empirical model of the phytoplankton chlorophyll:carbon ratio – the conversion factor between productivity and growth rate. Limnol. Oceanogr. 40: 1313-1321. Cole BE and JE Cloern. 1987. An empirical model for estimating phytoplankton productivity in estuaries. Mar. Ecol. Prog. Series. 36: 299-305. Cote B and T Platt. 1984. Utility of the light saturation curve as an operational model for quantifying the effects of environmental conditions on phytoplankton photosynthesis. Mar. Ecol. Prog. Ser. 18: 57-66. Deason E.E. T. J. Smayda. 1982. Ctenophore-zooplankton-phytoplankton interactions in Narragansett Bay, Rhode Island, USA, during 1972-1977. Journal of Plankton Research 4: 203-217. Falkowsi, PG and Raven, JA. 1997. Aquatic Photosynthesis. Blackwell Scientific. Malden, MA. 375 pp. Forbes JR, KL Denman and DL Mackas. 1986. Determinations of photosynthetic capacity in coastal marine phytoplankton: effects of assay irradiance and variability of photosynthetic parameters. Mar. Ecol. Prog. Ser. 32: 181-191.

2000 Annual Water Column Monitoring Report November 2001
8-2
Geider RJ, MacIntyre HL and Kana TM. 1997. Dynamic model of phytoplankton growth and acclimation: responses of the balanced growth rate and the chlorophyll a: carbon ratio to light, nutrient-limitation and temperature. Mar. Ecol. Prog. Ser. 148: 187-200. Harding LW Jr., BB Prezelin, BM Sweeney and JL Cox. 1982. Primary production as influenced by diel periodicity of phytoplankton photosynthesis. Mar. Biol. 67: 179-182. Harding LW Jr., BW Meeson, and MA Tyler. 1983. Photoadaptation and diel periodicity of photosynthesis in the dinoflagellate Prorocentrum mariaelebouriae. Mar. Ecol. Prog. Ser. 13: 73-85. Harrison WG, and T Platt. 1980. Variations in assimilation numbers of coastal phytoplankton: effects of environmental co-variates. J. Plankton Res. 2: 249-260. Hunt CD, Kropp RK, Fitzpatrick JJ, Yodzis P, Ulanowicz RE. 2000. A Review of Issues Related to the Development of a Food Web Model for Important Prey of Endangered Species in Massachusetts and Cape Cod Bays. Boston: Massachusetts Water Resources Authority. Report ENQUAD 1999-14. 62 p. HydroQual. 2000. Bays Eutrophication Model (BEM): modeling analysis for the period 1992-1994. Boston: Massachusetts Water Resources Authority. Report ENQUAD 2000-02. 158 p. Jeffrey SW, Mantoura RFC, and Wright SW. 1997. Phytoplankton Pigments in Oceanography. UNESCO Publishing, Paris. 595p. Kelly JR and Doering PH. 1995. Nutrient issues update 1995: metabolism in Boston Harbor, Massachusetts and Cape Cod Bays, MA (USA) during 1992-1994. Boston: Massachusetts Water Resources Authority. Report ENQUAD 1995-19. 38 p. Large WG and S Pond. 1981. Open ocean momentum flux measurements in moderate to strong winds. J. Phys. Oceanogr., 11, pp. 324-336. Libby PS, Albro CS, Hunt CD, Geyer WR, Keller AA, Oviatt CA, Turner J. 1999. 1998 Annual water column monitoring report. Boston: Massachusetts Water Resources Authority. Report ENQUAD 1999-16. 180 p. Libby PS, McLeod LA, Keller AA, Oviatt CA, Turner J. 2000a. Semi-annual water column monitoring report: February – July 2000. Boston: Massachusetts Water Resources Authority. Report ENQUAD 2000-19. 143 pages plus appendices. Libby PS, Albro CS, Hunt CD, Geyer WR, Keller AA, Oviatt CA, Turner J. 2000b. 1999 Annual water column monitoring report. Boston: Massachusetts Water Resources Authority. Report ENQUAD 2000-09. 177 p. Libby PS, Abramson S, McLeod LA, Mongin CJ, Keller AA, Oviatt CA, Turner J. 2001. Semi-annual water column monitoring report: August – December 2000. Boston: Massachusetts Water Resources Authority. Report ENQUAD 2001-XX. (in progress). Lohrenz SE, GL Fahnenstiel, and DG Redalje. 1994. Spatial and temporal variations in photosynthetic parameters in relation to environmental conditions in coastal waters of the Northern Gulf of Mexico. Estuaries 17: 779-795.
2000 Annual Water Column Monitoring Report November 2001
8-3
Maranda L, C Chan, and C Martin. 1999. Prorocentrum lima (Dinophyceae) in waters of the Great South Channel, near Georges Bank. Journal of Phycology 35: 1158-1161. O’Reilly JE and Zeitlin C. 1998, Seasonal, horizontal, and vertical distributions of pytoplankton chlorophyll a in the Northeast US continental shelf ecosystem. NOAA Technical Report NMFS 139. 120pp. Sakshaug E, Bricaud A, Dandonneau Y, Falkowski PG, Kiefer DA, Legendre L, Morel A, Parslow J and Takahashi M. 1997. Parameters of photosynthesis: definitions, theory and interpretation of results. J. Plankton. Res. 19: 1637-1670. Shiganova TA & Y V Bulgakova. 2000. Effects of gelatinous plankton on Black Sea and Sea of Azov fish and their food resources. ICES J Mar Sci 57: 641-648. Signell RP, Jenter HL, and Blumberg AF. 1996. Circulation and Effluent Dilution Modeling in Massachusetts Bay: Model Implementation, Verification and Results. US Geological Survey Open File Report 96-015, Woods Hole MA. Strickland JDH. 1960. Measuring the production of marine phytoplankton. Bull. Fish. Res. Bd. Canada 122: 172 pp. Strickland JDH, and TR Parsons. 1972. A practical handbook of seawater analysis, 2nd ed. Bull. Fish. Res. Bd. Can. Taylor DI. 2001. Comparison of water quality in Boston Harbor before and after inter-island transfer. Boston: Massachusetts Water Resources Authority. Report ENQUAD 2001-09. 104 p. Turner JT, SF Bruno, R J Larson, R D Staker & G M Sharma. 1983. Seasonality of plankton assemblages in a temperate estuary. P.S.Z.N.I: marine Ecology 4: 81-99. Turner JT, GJ Doucette, CL Powell, DM Kulis, BA Keafer & DM Anderson (2000) Accumulation of red tide toxins in larger size fractions of zooplankton assemblages from Massachusetts Bay, USA. Marine Ecology Progress Series 203: 95-107 Verity PG. 1981. Effects of temperature, irradiance, and daylength on the marine diatom Leptocylindrus danicus Cleve. J. Expe. Mar. Biol. Ecol. 55: 79-91.

Massachusetts Water Resources Authority Charlestown Navy Yard
100 First Avenue Boston, MA 02129
(617) 242-6000 http://www.mwra.state.ma.us