2.0 hydrology 2.1 introduction
TRANSCRIPT

City of Lincoln Drainage Criteria Manual Update
Project No.020-1827 May 2021
9
2.0 HYDROLOGY
2.1 INTRODUCTION Hydrologic analysis of stream systems is done to estimate the peak rate of runoff, volume of
runoff, and time distribution of water flow during storms to design for stormwater drainage. Errors
in analysis may result in an undersized structure, which will cause drainage problems (flooding,
inundated properties, safety issues), or in an oversized structure that increases costs.
Site characteristics that have an impact on hydrology include:
• Drainage basin – Size and shape, slope, ground cover and land use, geology, soil types,
surface infiltration, ponding and storage, watershed development potential
• Stream channel – Geometry and configuration, natural controls, artificial controls, channel
modifications, aggradation, degradation, debris, Manning’s n equation (used to determine
velocity), slope
• Floodplain – Slope, vegetation, alignment, storage, location of structures, obstructions of
flow
• Meteorological – Time rate and amounts of precipitation, historical flood events
2.2 HYDROLOGIC ANALYSIS METHODS While there are many ways to conduct a hydrological analysis, it is recommended that projects
being developed within the City use the following:
Rational Method:
• Applies to drainage areas up to 150 acres
• Used for estimating peak flows and the design of subdivision storm drainage systems
(e.g., inlets, storm drainpipes)
• Shall not be used for design of storage facilities, road culverts, or bridges
• Curve Number (CN) Method
o Applies to drainage areas up to 2,000 acres
o Used for estimating peak flows and hydrographs
o Used for the design of all drainage structures including bridges, culverts, and
storage facilities
o HEC-HMS is the City’s preferred CN methodology program for stormwater master
planning and recommends its use for determining flows for hydraulic structure
design (e.g., bridges, culverts)

City of Lincoln Drainage Criteria Manual Update
Project No.020-1827 May 2021
10
These methods are recommended for use in the City’s jurisdiction because they are familiar to
City officials and local consulting engineers and have available computer programs. The methods
provide consistent results because of tested equations and well-sourced monographs.
Other methods may be used if the Director of Lincoln Transportation and Utilities approves of their
use beforehand. Source documentation and/or calibration may be required.
2.3 HYDROLOGIC DESIGN CRITERIA It is not practical to design drainage structures such as culverts to accommodate the maximum
runoff a watershed can produce. For this reason, local design frequencies are established for the
storm drainage structures and systems. The specifications for the drainage structures and
systems are detailed below.
Culverts/bridges designed to transport stormwater runoff under roadways shall convey at a
minimum the 50-year flood event with 1-foot of freeboard from the centerline of the roadway.
Arterial roadways will convey the 100-year flood event without overtopping the roadway. Flow rate
shall be based on the ultimate upstream land-use build-out. Stormwater detention may be taken
into consideration when sizing culverts for residential or commercial roads, but stormwater
detention may not be used when sizing culverts or bridges for arterial roads. The 100-year flood
event shall be routed through all culverts and bridges to be sure adjacent structures are not
flooded or that damage does not occur to the roadway or adjacent property.
Storm drains shall accommodate the 5-year flood event for residential areas; the 10-year flood
event for commercial, downtown, and industrial areas; and the 10-year flood event for residential
areas downstream from commercial, downtown, or industrial areas.
Designs must not increase flooding on adjacent property; cause exit velocities so high as to cause
scour or too low to cause deposition; or encroach onto the street or highway in a manner that
impedes traffic, merging vehicles, or pedestrian movements.
Designs may involve temporary street or road inundation for flood events greater than the design
event but not for floods equal to or less than the design event.
Inlets shall accommodate the 5-year flood event for residential developments and the 10-year
flood event for downtown, industrial, commercial, and arterial roads.
Detention and retention storage facilities shall be designed to accommodate 2-year, 10-year, and
100-year flood events so that post development peak discharge rates do not exceed
predevelopment discharge rates. In addition, stormwater runoff shall not increase flooding or
erosion hazards for adjacent, upstream, or downstream property or cause safety hazards
associated with the facility. To accomplish this, an emergency spillway may need to be provided,

City of Lincoln Drainage Criteria Manual Update
Project No.020-1827 May 2021
11
yet designs must not increase flood peaks at the downstream property line. If combined with a
stormwater quality facility, the combined facility must meet criteria for both facilities.
Stormwater quality facilities shall be designed to detain the 70th and 80th percentile rainfall events
measured at every discharge point from the project area (See Table 2-1 City of Lincoln Rainfall
Amounts by Recurrence Interval and Percentile). More detail on stormwater quality is provided in
Chapter 8.
2.4 RATIONAL METHOD The Rational method estimates the peak rate of runoff at any location in a watershed as a function
of the drainage area, runoff coefficient, and mean rainfall intensity for a duration equal to the time
of concentration. Here is the formula:
Equation 2.1 The Rational Method Equation (Q = CIA)
Q = peak rate of runoff, in cubic feet per second (cfs)
C = runoff coefficient representing a ration of runoff to rainfall for future land use
conditions
I = average rainfall intensity for a duration equal to the time of concentration (Tc) for a
selected return period, in inches per hour (in/hr)
A = drainage area contributing runoff to the design location, in acres
This method is sensitive to the parameters used for estimating peak rate of runoff (Q). Parameters
Tc, I, and C are discussed in the next section.
2.4.1 Time of Concentration (Tc)
Time of concentration is the time required for water to flow from the remotest point,
hydraulically, of the drainage area to the point under investigation (design point), which must
be determined for each design point within the drainage basin.
The duration of rainfall is set equal to the time of concentration used to estimate rainfall
intensity. There are several methods available for estimating time of concentration. Section
2.5.4 describes the recommended method for estimating the Tc.
For inlet design, the minimum time of concentration shall not be less than eight minutes. The
time of concentration for a storm drain system equals the inlet time plus the time of flow in a
closed conduit or open channel to the design point where inlet time is the time required for
runoff to flow over the surface to the nearest inlet. Inlet time is a function of the length of
overland flow, the slope, and the surface cover. The flow time for pipe or open channel,
sometimes referred to as travel time (shown as Tt in the equations), is calculated from the
hydraulic properties of the conduit or channel and added to the inlet time to obtain the total

City of Lincoln Drainage Criteria Manual Update
Project No.020-1827 May 2021
12
time of concentration. Travel time is obtained by dividing velocity of the flow into the pipe or
channel length. Manning’s n equation can be used to determine velocity (see Chapter 5 for
more discussion on Manning’s n equation).
Be aware that there are a few common issues with time of concentration calculations. In some
cases, runoff from a highly impervious portion of the drainage area may result in a greater
flow and therefore produce a distorted time of concentration than if the area were considered
as a whole. Adjustments should be made to the drainage area by disregarding those areas
where flow time is too slow to add to Q. It may require estimates of different times of
concentration to determine the design flow critical to a specific application.
Occasionally, the overland flow path is not necessarily perpendicular to the contours shown
on available maps because of grading and swales that intercept the natural contour and
conduct the water to the streets, which reduces time of concentration. Therefore, sheet flow
paths greater than 100 feet for urban areas and 150 feet for rural areas shall not be used:
2.4.2 Rainfall Intensity (I)
Rainfall intensity is defined as the average rainfall rate (in/hr) for a duration equal to the time
of concentration for a selected return period (i.e., design frequency). Once a return period has
been selected for the design and a time of concentration is determined, use of an intensity-
duration-frequency (IDF) curve determines I (See Table 2-1 and Table 2-2).
2.4.3 Runoff Coefficient (C)
The runoff coefficient (C) represents the integrated effects of many drainage basin
parameters, mainly soil type, land use, and average land slope. C requires engineering
judgement, because it is an imprecise value, especially as related to land use.
Soil properties influence the relationship between runoff and rainfall because of differing
infiltration rates. The United States Soil Conservation Service (or SCS, now the Natural
Resources Conservation Service, or NRCS) has divided soils into four hydrologic soil groups,
used in both the Rational method and the SCS method:
Group A Soils having a low runoff potential because of high infiltration rates. These soils
consist primarily of deep, well-drained sands and gravels.
Group B Soils having a moderately low runoff potential because of moderate infiltration
rates. These soils consist primarily of moderately deep to deep, moderately
well to well-drained soils with moderately fine to moderately coarse textures.
Group C Soils having a moderately high runoff potential because of slow infiltration
rates. These soils consist primarily of soils in which a layer exists near the

City of Lincoln Drainage Criteria Manual Update
Project No.020-1827 May 2021
13
surface that impedes the downward movement of water or soils with
moderately fine to fine textures.
Group D Soils having a high runoff potential because of very slow infiltration rates.
These soils consist primarily of clays with high swelling potential, soils with
permanently high water tables, soils with a claypan or clay layer at or near the
surface, and shallow soils over nearly impervious parent material.
A list of soils for the City and the soils’ hydrologic classifications are in the Lancaster County
Soil Survey (USDA 1980).
For the purposes of this drainage criteria manual, common soil classifications for City of
Lincoln area soil classifications are groups C and D. If a soil classification listed in the County
Soil Survey has a split classification (e.g., B/D), use the lower classification (e.g., D). If a soil
classification is listed in the County Soil Survey as urban or X, use soil classification D.
Soil groups are used in many cases as a significant parameter for determining hydrologic
classifications (i.e., runoff coefficient and curve number). The value of C shall be based on
fully built-out land use conditions. The minimum C shall be 0.4, unless it can be clearly
demonstrated that a value of less than 0.4 is adequate. It is common to develop a composite
C based on the percentage of diverse types of land surfaces in the drainage area.
Table 2-3 provides runoff coefficients for the Rational method based on selected land uses.
Table 2-4 provides runoff coefficients for the Rational method based on hydrologic soil groups
and slope ranges.
Infrequent, higher intensity storms require modifying C because infiltration and other losses
have a proportionally smaller effect on runoff. Adjusting the Rational method formula requires
multiplying the right side of the formula by a frequency factor (Cf), making the formula read as
follows:
Equation 2.2 Q = Cf CIA
Cf values are:
1.1 for a 25-year recurrence interval
1.2 for a 50-year recurrence interval
1.25 for a 100-year recurrence interval.
NOTE: The product of Cf times C shall not exceed 1.0.
2.4.4 Rational Method Limitations
Be aware that the Rational method has limitations. The Rational method requires a good
topographic map to define the drainage area. A field inspection should be completed to
City of Lincoln Drainage Criteria Manual Update
Project No.020-1827 May 2021
14
determine whether the natural drainage divides have been altered. When determining C for
the drainage area, future possible land use changes for the facility should be considered as
these changes could result in an inadequate drainage area.
The effects of permanent upstream detention facilities should be considered as restrictions to
the natural flow, such as highway crossing and dams in the drainage area, may affect the
design flow. The unintentional detention of flow, such as behind road crossings, should be
excluded as future improvements may negate such detention.
The Rational method is best suited to small, highly impervious areas and least suitable for
large drainage areas or drainage areas in natural or undeveloped conditions. The tables in
this manual are not intended to replace reasonable and prudent engineering judgment.
2.5 CURVE NUMBER METHOD Techniques developed by the SCS for calculating rates of runoff require the same basic data as
the Rational method: drainage area, a runoff factor, time of concentration, and rainfall.
The SCS method, referred to in this manual as the CN method, also considers the following:
• Time distribution of the rainfall
• Initial rainfall losses to interception and depression storage
• Infiltration rate that decreases during a storm
The CN method allows for calculating direct runoff for any storm, either real or fabricated, by
subtracting infiltration and other losses from the rainfall to obtain the precipitation excess (runoff
volume).
Parameters necessary for the CN method include direct runoff (Q), drainage area, rainfall, time
of concentration, and a runoff factor (i.e., CN).
2.5.1 Direct Runoff (Q)
The rainfall runoff equation for direct runoff is a method of estimating direct runoff from a 24-
hour, or one-day, storm rainfall. It is derived from experimental plots for numerous soils and
vegetative cover conditions, including land-treatment measures (i.e., contouring and
terracing). It was mainly developed for small watersheds from available daily rainfall and
watershed data. Below is the equation:
Equation 2.3 Q = (P – 0.2S)2 / (P +0.8S)
Q = accumulated direct runoff, in inches
P = accumulated rainfall (potential maximum runoff), in inches
S = potential maximum retention, in inches
City of Lincoln Drainage Criteria Manual Update
Project No.020-1827 May 2021
15
Note: S considers initial abstraction, including surface storage, interception, and infiltration prior to runoff, which, altogether, are assumed to be 20 percent of a basin’s potential losses.
S is related to the soil and cover conditions of the watershed through the CN or runoff factor CN. CN
has a range of 0 to 100, and S is related to CN by the following equation:
Equation 2.4 S = (1000 / CN) – 10
2.5.2 Drainage Area
Drainage area is determined from topographic maps and field surveys. Knowledge of the
drainage area may be required to divide large drainage areas into subdrainage areas and
account for major land use changes, to obtain analysis results at different points within the
drainage area, or to locate stormwater drainage facilities and assess the effects on flood flows.
2.5.3 Rainfall
Rainfall is based on a 24-hour storm event with various time distributions, depending on the
watershed (drainage area) location. NOAA Atlas 14 data will be used as the total rainfall
amount (See Table 2-1) for the specified return period to use with the typical time distribution
for the Lincoln area. The MSE3 (Midwest/Southeast) storm distribution (See Figure 2-2) is
the time distribution from the NOAA Atlas 14 data and shall be used as the “typical” time
distribution used for Lincoln, Nebraska. The tabular data needed for input into the software is
shown in Table 2-5.
2.5.4 Time of Concentration
Travel time (Tt) is the time it takes water to travel from one location to another in a watershed.
Travel time is a component of time of concentration, which is the time needed for runoff to
travel from the hydraulically most distant point of the watershed to a point of interest within
the watershed. Time of concentration is computed by summing all the travel times for
consecutive components of the drainage conveyance system. Procedures and equations for
calculating travel time and time of concentration are discussed in the following sections.
Water moves through a watershed as sheet flow, shallow concentrated flow, open channel
flow, or some combination of these. The type of flow that occurs is a function of the
conveyance system and is best determined by a field inspection.
As shown in the equation below, travel time is the ratio of flow length to flow velocity:
Equation 2.5 Tt = L/(3600V)
Tt = travel time, in hours (hr)
L = flow length, in feet (ft)
V = average velocity, in feet per second (ft/s)
3600 = factor to convert velocity from seconds to hours

City of Lincoln Drainage Criteria Manual Update
Project No.020-1827 May 2021
16
The time of concentration is the sum of travel time values for the various consecutive flow
segments:
Equation 2.6 Tc = Tt1 + Tt2 + ... Ttm
Tc = time of concentration, hr
m = number of flow segments
Note: Minimum Tc is 8 minutes
Sheet Flow
Sheet flow is flow over planar surfaces. It usually occurs in the headwater of watersheds. With
sheet flow, the friction value (Manning’s n) is an effective roughness coefficient that includes
the effect of raindrop impact; drag over the plane surface; obstacles such as litter, crop ridges,
and rocks; and erosion and transportation of sediment. These n values are for very shallow
flow depths of about 0.1 foot or so. Table 2-6 gives Manning’s n values for sheet flow for
various surface conditions.
Sheet flow conditions are unlikely to occur at lengths in excess of 150 feet in rural areas and
100 feet in urban areas. In urban residential developments, sheet flow conditions may occur
in rear yards and other open areas but generally change to a shallow concentrated flow when
that flow occurs between buildings. For sheet flow, use Manning’s kinematic solution to
compute travel time, which is shown in the equation below:
Equation 2.7 Tt = [0.42 (nL)0.8 / (P2) 0.5s0.4]
Tt = travel time, in minutes (min)
n = Manning’s roughness coefficient (Table 2-6)
L = flow length, feet
P2 = 2-year, 24-hr rainfall, in. (3.0 inches in Lincoln)
s = slope of HGL (land slope), in feet per feet (ft/ft)
This simplified form of the Manning’s kinematic solution is based on a shallow, steady, uniform
flow, a constant intensity of rainfall excess (rain available for runoff), a rainfall duration of 24
hours, and a minor effect of infiltration on travel time.
Shallow Concentrated Flow
Beyond the maximum lengths of 150 feet in rural areas and 100 feet in urban areas, sheet
flow usually becomes a shallow concentrated flow. Also, once flow gets to a curb line, do not
use the equations used for sheet flow. The average velocity for this flow can be determined
from the following equations in which average velocity is a function of watercourse slope and
the type of channel the flow travels through.

City of Lincoln Drainage Criteria Manual Update
Project No.020-1827 May 2021
17
Equation 2.8 Unpaved (V = 16.1345(s)0.5)
Equation 2.9 Paved (V = 20.3282(s)0.5)
V = average velocity, feet/second
s = slope of HGL (watercourse slope), ft/ft
These two equations are based on the solution of Manning’s equation with different
assumptions for n (Manning’s roughness coefficient) and r (hydraulic radius, feet). For
unpaved areas, n is 0.05 and r is 0.4 foot; for paved areas, n is 0.025 and r is 0.2 foot.
After determining the average velocity, use the equation for travel time from Equation 2.5 to
estimate travel time for the shallow concentrated flow segment.
Pipe and Open Channels
Open channels are assumed to begin where surveyed cross-section information has been
obtained, where channels are visible on aerial photographs, or where blue lines (indicating
streams) appear on United States Geological Survey (USGS) quadrangle sheets. Either
Manning’s equation or water surface profile information can be used to estimate the average
flow velocity. Average flow velocity is usually determined for bank-full elevation.
Manning’s equation is as follows:
Equation 2.10 V = (1.486 r2/3 s1/2)/n )
V = average velocity, ft/s
r = hydraulic radius, ft (this is equal to a/pw)
a = cross-sectional flow area, ft2
pw = wetted perimeter, ft
s = slope of the HGL, ft/ft
n = Manning’s roughness coefficient
After average velocity is computed, travel time for the channel segment can be estimated
using the equation for travel time from Equation 2.5.
Reservoir or Lake
Sometimes it is necessary to compute a time of concentration for a watershed that has a
relatively large body of water in the flow path. This travel time is normally very small and can
be assumed as zero.
One must not overlook the fact that this does not account for the travel time involved with the
passage of the inflow through spillway storage and the reservoir or lake outlet. This time is
generally much longer and is added to the travel time across the lake. The travel time through

City of Lincoln Drainage Criteria Manual Update
Project No.020-1827 May 2021
18
lake storage and its outlet can be determined by the storage routing procedures given in
Chapter 6.
Limitations to the Use of Tc
Manning’s kinematic solution should not be used for sheet flow longer than 150 feet for rural
areas and 100 feet for urban areas. In watersheds with storm drains, carefully identify the
appropriate hydraulic flow path to estimate time of concentration. Storm drains generally
handle only a small portion of a large event. The rest of the peak flow travels by streets, lawns,
and so on, to the outlet. Consult Chapter 3 to determine average velocity in pipes. A culvert
or bridge can act as a reservoir outlet if there is significant storage behind it. Detailed storage
routing procedures should be used to determine the outflow through the culvert.
2.5.5 Runoff Factor
The runoff factor is defined as the amount by which rainfall exceeds the capability of the land
to absorb or otherwise retain the rainfall based on land use, land treatment, soil types, and
land slope.
The runoff factor will be affected by land uses – watershed cover, both agricultural and
nonagricultural uses – by the types of vegetation found on the land, or by the presence of any
water surfaces, roads, or roofs. The runoff factor will also be affected by how the land has
been treated – by mechanical practices such as contouring or terracing and by management
practices such as rotating crops.
The CN method uses soil conditions and land use to assign a runoff factor (CN) when the soil
is not frozen. The higher the CN, the higher the runoff potential. Runoff from snowfall or frozen
ground cannot be accounted for using the CN method.
The CN method accounts for surface runoff only and does not take interflow or groundwater
into consideration.
The soil groups identified in Section 2.4.3 for the Rational method are also used for the CN
method. They are based on infiltration rates and can be found in the Lancaster County Soil
Survey. When considering hydrologic soil groups, the effects of urbanization, such as heavy
equipment compaction of soil, should be considered. The CN method describes average
conditions, and since a watershed or subwatershed is described by one CN value, the
watershed or sub-watershed should be delineated (to the extent feasible) so that it is
hydrologically homogeneous.
The CN can vary with antecedent soil moisture conditions, which is influenced by the amount
of rainfall occurring in a selected period preceding a given storm. The more rain, the more
direct runoff. A five-day period is used as the minimum for estimating antecedent moisture
conditions.

City of Lincoln Drainage Criteria Manual Update
Project No.020-1827 May 2021
19
CNs can be found from the following exhibits depending upon their application:
• Table 2-7 is to be used as a reference for estimating CNs in urban areas
• Table 2-8 is to be used as a reference for estimating CNs for cultivated agricultural
areas
• Table 2-9 is to be used as a reference for estimating CNs for other types of agricultural
areas
• Table 2-10 is to be used to convert CNs (found from the other exhibits) to a dry or wet
corresponding CN based on antecedent soil moisture conditions (not typically used for
general applications)
• Table 2-11 is to be used to determine antecedent moisture condition (not typically
used for general applications)
Composite CNs can be calculated when a drainage area has more than one land use, if the
drainage area can be adequately represented by the composite CN. Composite CNs can be
calculated by using Table 2-12.
City of Lincoln Drainage Criteria Manual Update
Project No.020-1827 May 2021
20
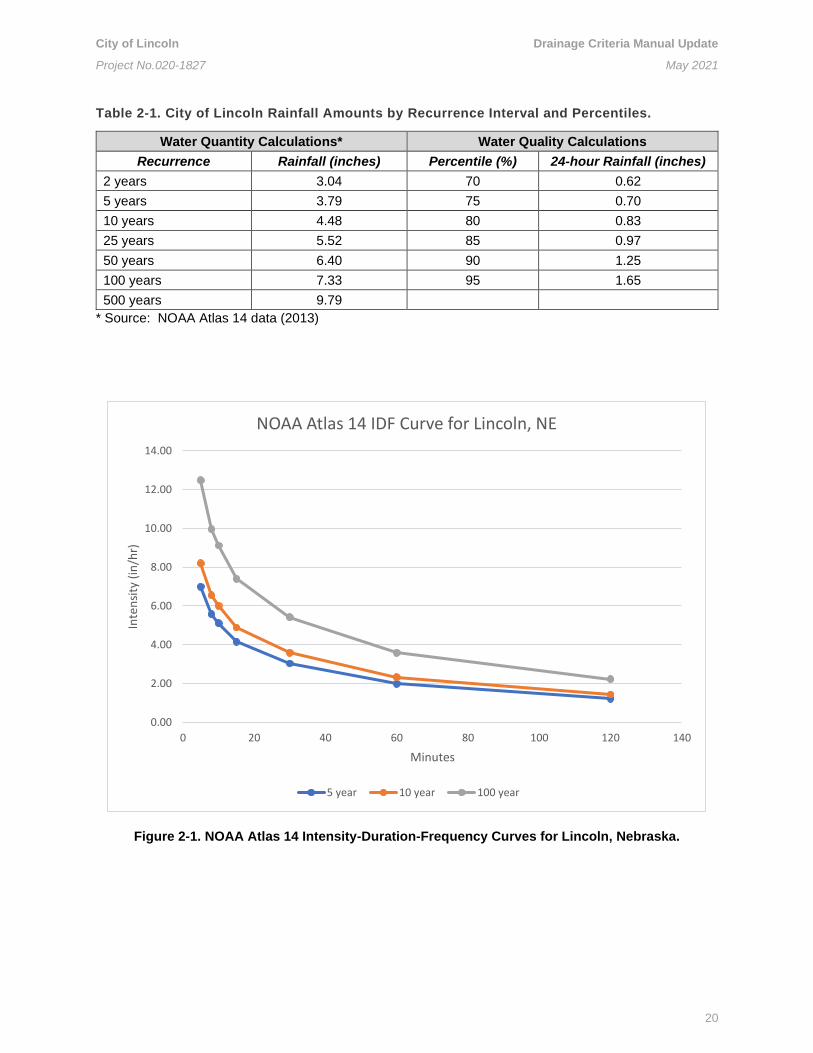
Table 2-1. City of Lincoln Rainfall Amounts by Recurrence Interval and Percentiles.
Water Quantity Calculations* Water Quality Calculations
Recurrence Rainfall (inches) Percentile (%) 24-hour Rainfall (inches)
2 years 3.04 70 0.62
5 years 3.79 75 0.70
10 years 4.48 80 0.83
25 years 5.52 85 0.97
50 years 6.40 90 1.25
100 years 7.33 95 1.65
500 years 9.79
* Source: NOAA Atlas 14 data (2013)
Figure 2-1. NOAA Atlas 14 Intensity-Duration-Frequency Curves for Lincoln, Nebraska.
0.00
2.00
4.00
6.00
8.00
10.00
12.00
14.00
0 20 40 60 80 100 120 140
Inte
nsi
ty (
in/h
r)
Minutes
NOAA Atlas 14 IDF Curve for Lincoln, NE
5 year 10 year 100 year

City of Lincoln Drainage Criteria Manual Update
Project No.020-1827 May 2021
21
Table 2-2. NOAA Atlas 14 Intensity-Duration-Frequency Table for Lincoln, Nebraska.
Intensity (inches/hour)
Minutes (Tc) 5-year event 10-year event 100-year event
5 6.98 8.20 12.48 8 5.58 6.55 9.96
10 5.11 6.00 9.12 15 4.16 4.88 7.40 30 3.04 3.58 5.42 60 1.98 2.33 3.58 120 1.22 1.44 2.23
Table 2-3. Recommended Rational Method Coefficient of Runoff Values for Various Selected Land Uses.
Description of Area Runoff Coefficients
Business: Downtown areas 0.70 – 0.95
Neighborhood areas 0.50 – 0.70
Residential: Single-family areas 0.30 – 0.50
Multi units, detached 0.40 – 0.60
Multi units, attached 0.60 – 0.75
Suburban 0.25 – 0.40
Residential (1-acre lots or larger) 0.30 – 0.45
Apartment dwelling areas 0.50 – 0.70
Industrial: Light areas 0.50 – 0.80
Heavy Areas 0.60 – 0.90
Parks, cemeteries 0.10 – 0.25
Playground areas 0.20 – 0.40
Railroad yard areas 0.20 – 0.40
Unimproved areas 0.04 – 0.38 (see Table 2-4)

City of Lincoln Drainage Criteria Manual Update
Project No.020-1827 May 2021
22
Table 2-4. Recommended Rational Method Coefficient of Runoff for Pervious Surfaces (Unimproved Areas) by Selected Hydrologic Soil Groupings and Slope Ranges.
Slope Soil Group A Soil Group B Soil Group C Soil Group D
Flat 0.04 – 0.09 0.07 – 0.12 0.11 – 0.16 0.15 – 0.20 (0 – 1%)
Average 0.09 – 0.14 0.12 – 0.17 0.16 – 0.21 0.20 – 0.25
(2 – 6%)
Steep 0.13 – 0.18 0.18 – 0.24 0.23 – 0.31 0.28 – 0.38
(Over 6%) Note: Soil Groups are further described in Section 2.4.2 Rainfall Intensity (I).
Figure 2-2. Graphic Data for the MSE3 Distribution.
Note: The Type II rainfall distribution from Technical Paper 40 is shown for comparison. Use the MSE3
rainfall distribution from NOAA Atlas 14.
0.0
0.1
0.2
0.3
0.4
0.5
0.6
0.7
0.8
0.9
1.0
0.0 5.0 10.0 15.0 20.0
Cu
mu
lati
vfe
Rai
nfa
ll, C
um
ula
tive
un
it in
ches
Time Hours
Design Storm Curves
MSE3 unit inches Type 2 unit inches

City of Lincoln Drainage Criteria Manual Update
Project No.020-1827 May 2021
23
Table 2-5. Tabular Rainfall Distribution from NOAA Atlas 14.
Time MSE3 Type II
Time MSE3 Type II
Time MSE3 Type II
hours unit inches
unit inches
hours unit
inches unit inches
hours unit
inches unit inches
0.0 0.0000 0.0000
4.0 0.0261 0.0480
8.0 0.0837 0.1200
0.1 0.0003 0.0010
4.1 0.0271 0.0494
8.1 0.0856 0.1222
0.2 0.0006 0.0020
4.2 0.0282 0.0508
8.2 0.0874 0.1246
0.3 0.0009 0.0030
4.3 0.0293 0.0523
8.3 0.0893 0.1270
0.4 0.0012 0.0041
4.4 0.0304 0.0538
8.4 0.0912 0.1296
0.5 0.0015 0.0051
4.5 0.0316 0.0553
8.5 0.0931 0.1322
0.6 0.0019 0.0062
4.6 0.0327 0.0568
8.6 0.0951 0.1350
0.7 0.0023 0.0072
4.7 0.0339 0.0583
8.7 0.0970 0.1379
0.8 0.0027 0.0083
4.8 0.0351 0.0598
8.8 0.0990 0.1408
0.9 0.0031 0.0094
4.9 0.0363 0.0614
8.9 0.1010 0.1438
1.0 0.0036 0.0105
5.0 0.0375 0.0630
9.0 0.1031 0.1470
1.1 0.0040 0.0116
5.1 0.0388 0.0646
9.1 0.1063 0.1502
1.2 0.0045 0.0127
5.2 0.0401 0.0662
9.2 0.1096 0.1534
1.3 0.0050 0.0138
5.3 0.0414 0.0679
9.3 0.1129 0.1566
1.4 0.0055 0.0150
5.4 0.0427 0.0696
9.4 0.1163 0.1598
1.5 0.0061 0.0161
5.5 0.0440 0.0712
9.5 0.1197 0.1630
1.6 0.0067 0.0173
5.6 0.0454 0.0730
9.6 0.1231 0.1663
1.7 0.0072 0.0184
5.7 0.0467 0.0747
9.7 0.1266 0.1697
1.8 0.0078 0.0196
5.8 0.0481 0.0764
9.8 0.1302 0.1733
1.9 0.0085 0.0208
5.9 0.0495 0.0782
9.9 0.1338 0.1771
2.0 0.0091 0.0220
6.0 0.0510 0.0800
10.0 0.1374 0.1810
2.1 0.0098 0.0232
6.1 0.0524 0.0818
10.1 0.1411 0.1851
2.2 0.0104 0.0244
6.2 0.0539 0.0836
10.2 0.1449 0.1895
2.3 0.0111 0.0257
6.3 0.0554 0.0855
10.3 0.1487 0.1941
2.4 0.0119 0.0269
6.4 0.0569 0.0874
10.4 0.1525 0.1989
2.5 0.0126 0.0281
6.5 0.0584 0.0892
10.5 0.1564 0.2040
2.6 0.0134 0.0294
6.6 0.0600 0.0912
10.6 0.1621 0.2094
2.7 0.0141 0.0306
6.7 0.0615 0.0931
10.7 0.1686 0.2152
2.8 0.0149 0.0319
6.8 0.0631 0.0950
10.8 0.1759 0.2214
2.9 0.0158 0.0332
6.9 0.0647 0.0970
10.9 0.1839 0.2280
3.0 0.0166 0.0345
7.0 0.0664 0.0990
11.0 0.1927 0.2350
3.1 0.0175 0.0358
7.1 0.0680 0.1010
11.1 0.2023 0.2427
3.2 0.0183 0.0371
7.2 0.0697 0.1030
11.2 0.2126 0.2513
3.3 0.0192 0.0384
7.3 0.0714 0.1051
11.3 0.2236 0.2609
3.4 0.0202 0.0398
7.4 0.0731 0.1072
11.4 0.2354 0.2715
3.5 0.0211 0.0411
7.5 0.0748 0.1093
11.5 0.2480 0.2830
3.6 0.0221 0.0425
7.6 0.0765 0.1114
11.6 0.2663 0.3068
3.7 0.0230 0.0439
7.7 0.0783 0.1135
11.7 0.2906 0.3544
3.8
0.0240 0.0452
7.8 0.0801 0.1156
11.8 0.3245 0.4308
3.9 0.0250 0.0466
7.9 0.0819 0.1178
11.9 0.3725 0.5679

City of Lincoln Drainage Criteria Manual Update
Project No.020-1827 May 2021
24
Table 2-5. Tabular Rainfall Distribution from NOAA Atlas 14 (continued).
Time MSE3 Type II
Time MSE3 Type II
Time MSE3 Type II
hours unit inches
unit inches
hours unit
inches unit inches
hours unit
inches unit inches
12.0 0.4629 0.6630
16.0 0.9163 0.8800
20.0 0.9739 0.9520
12.1 0.6276 0.6820
16.1 0.9181 0.8823
20.1 0.9750 0.9533
12.2 0.6756 0.6986
16.2 0.9199 0.8845
20.2 0.9760 0.9546
12.3 0.7094 0.7130
16.3 0.9217 0.8868
20.3 0.9770 0.9559
12.4 0.7337 0.7252
16.4 0.9235 0.8890
20.4 0.9780 0.9572
12.5 0.7520 0.7350
16.5 0.9252 0.8912
20.5 0.9789 0.9584
12.6 0.7646 0.7434
16.6 0.9269 0.8934
20.6 0.9798 0.9597
12.7 0.7764 0.7514
16.7 0.9287 0.8955
20.7 0.9808 0.9610
12.8 0.7874 0.7588
16.8 0.9303 0.8976
20.8 0.9817 0.9622
12.9 0.7977 0.7656
16.9 0.9320 0.8997
20.9 0.9825 0.9635
13.0 0.8073 0.7720
17.0 0.9337 0.9018
21.0 0.9834 0.9647
13.1 0.8161 0.7780
17.1 0.9353 0.9038
21.1 0.9842 0.9660
13.2 0.8241 0.7836
17.2 0.9369 0.9058
21.2 0.9851 0.9672
13.3 0.8314 0.7890
17.3 0.9385 0.9078
21.3 0.9859 0.9685
13.4 0.8379 0.7942
17.4 0.9401 0.9097
21.4 0.9866 0.9697
13.5 0.8436 0.7990
17.5 0.9416 0.9117
21.5 0.9874 0.9709
13.6 0.8475 0.8036
17.6 0.9431 0.9136
21.6 0.9881 0.9722
13.7 0.8513 0.8080
17.7 0.9446 0.9155
21.7 0.9889 0.9734
13.8 0.8551 0.8122
17.8 0.9461 0.9173
21.8 0.9896 0.9746
13.9 0.8589 0.8162
17.9 0.9476 0.9192
21.9 0.9902 0.9758
14.0 0.8626 0.8200
18.0 0.9491 0.9210
22.0 0.9909 0.9770
14.1 0.8662 0.8237
18.1 0.9505 0.9228
22.1 0.9916 0.9782
14.2 0.8698 0.8273
18.2 0.9519 0.9245
22.2 0.9922 0.9794
14.3 0.8734 0.8308
18.3 0.9533 0.9263
22.3 0.9928 0.9806
14.4 0.8769 0.8342
18.4 0.9547 0.9280
22.4 0.9934 0.9818
14.5 0.8803 0.8376
18.5 0.9560 0.9297
22.5 0.9939 0.9829
14.6 0.8837 0.8409
18.6 0.9573 0.9313
22.6 0.9945 0.9841
14.7 0.8871 0.8442
18.7 0.9587 0.9330
22.7 0.9950 0.9853
14.8 0.8904 0.8474
18.8 0.9599 0.9346
22.8 0.9955 0.9864
14.9 0.8937 0.8505
18.9 0.9612 0.9362
22.9 0.9960 0.9876
15.0 0.8970 0.8535
19.0 0.9625 0.9377
23.0 0.9964 0.9887
15.1 0.8990 0.8565
19.1 0.9637 0.9393
23.1 0.9969 0.9899
15.2 0.9010 0.8594
19.2 0.9649 0.9408
23.2 0.9973 0.9910
15.3 0.9030 0.8622
19.3 0.9661 0.9423
23.3 0.9977 0.9922
15.4 0.9049 0.8649
19.4 0.9673 0.9438
23.4 0.9981 0.9933
15.5 0.9069 0.8676
19.5 0.9684 0.9452
23.5 0.9985 0.9944
15.6 0.9088 0.8702
19.6 0.9696 0.9466
23.6 0.9988 0.9956
15.7 0.9107 0.8728
19.7 0.9707 0.9480
23.7 0.9991 0.9967
15.8 0.9126 0.8753
19.8 0.9718 0.9493
23.8 0.9994 0.9978
15.9 0.9144 0.8777
19.9 0.9729 0.9507
23.9 0.9997 0.9989
24.0 1.0000 1.0000

City of Lincoln Drainage Criteria Manual Update
Project No.020-1827 May 2021
25
Table 2-6. Roughness Coefficients (Manning’s n) for Sheet Flow.
Surface Description n
Smooth surfaces (concrete, asphalt, gravel, or bare soil) 0.011
Fallow (no residue) 0.05
Cultivated Soils:
Residue cover < 20% 0.06
Residue cover > 20% 0.17
Grasses:
Shortgrass prairie 0.15
Dense grasses1 0.24
Bermuda grass 0.41
Range (natural) 0.13
Woods:
Light underbrush 0.40
Dense underbrush 0.80
1 Includes species such as weeping lovegrass, bluegrass, buffalo grass, blue grama grass,
and native grass mixtures.
2 When selecting n, consider cover to a height of about 0.1 foot. This is the only part of the
plant cover that will obstruct sheet flow.

City of Lincoln Drainage Criteria Manual Update
Project No.020-1827 May 2021
26
Table 2-7. Runoff Curve Numbers – Urban Areas.
Cover Type and Hydrologic Condition Average Percent Impervious Area1
Curve Numbers for Hydrologic Soil Groups
A B C D
Fully developed urban areas (vegetation established)
Open space (lawns, parks, golf courses, cemeteries, etc.)2
Poor condition (grass cover <50%) 68 79 86 89
Fair condition (grass cover 50% to 75%) 49 69 79 84
Good condition (grass cover > 75%) 39 61 74 80
Impervious areas:
Paved parking lots, roofs, driveways, etc. (excluding right-of-way)
98 98 98 98
Streets and roads:
Paved; curbs and storm drains (excluding right-of-way)
98 98 98 98
Paved; open ditches (including right-of-way) 83 89 92 93
Gravel (including right-of-way) 76 85 89 91
Dirt (including right-of-way) 72 82 87 89
Urban districts:
Commercial and business 85% 89 92 94 95
Industrial 72% 81 88 91 93
Residential districts by average lot size:
1/8 acre or less (town houses) 65% 77 85 90 92
1/4 acre 38% 61 75 83 87
1/3 acre 30% 57 72 81 86
1/2 acre 25% 54 70 80 85
1 acre 20% 51 68 79 84
2 acres 12% 46 65 77 82
Developing urban areas
Newly graded areas (pervious areas only, no vegetation)
77 86 91 94
Idle lands (curve numbers [CNs] are determined using cover types similar to those in Table 2-9).
Average runoff condition and initial abstraction such as surface storage, interception and infiltration prior to runoff are assumed to be 20% of the potential maximum retention, Ia = 0.2S.
1 The average percentage of impervious area shown was used to develop the composite CNs. Other assumptions are as follows: impervious areas are directly connected to the drainage system, impervious areas have a CN of 98, and pervious areas are considered equivalent to open space in good hydrologic condition. If the impervious area is not connected, the SCS method has an adjustment to reduce the effect.
2 CNs shown are equivalent to those of pasture. Composite CNs may be computed for other combinations of open space cover type.
Source: TR-55

City of Lincoln Drainage Criteria Manual Update
Project No.020-1827 May 2021
27
Table 2-8. Cultivated Agricultural Land.
Cover Description Curve Numbers for Hydrologic Soil Groups
Cover Treatment1 Type Hydrologic Condition2 A B C D
Fallow Bare soil - 77 86 91 94
Crop residue Poor 76 85 90 93
Cover (CR) Good 74 83 88 90
Row straight row (SR) Poor 72 81 88 91
Crops Good 67 78 85 89
SR + CR Poor 71 80 87 90
Good 64 75 82 85
Contoured (C) Poor 70 79 84 88
Good 65 75 82 86
C + CR Poor 69 78 83 87
Good 64 74 81 85
Contoured & Terraced (C&T) Poor 66 74 80 82
Good 62 71 78 81
C&T + CR Poor 65 73 79 81
Good 61 70 77 80
Small grain (SR) Poor 65 76 84 88
Good 63 75 83 87
SR + CR Poor 64 75 83 86
Good 60 72 80 84
C Poor 63 74 82 85
Good 61 73 81 84
C + CR Poor 62 73 81 84
Good 60 72 80 83
C&T Poor 61 72 79 82
Good 59 70 78 81
C&T + CR Poor 60 71 78 81
Good 58 69 77 80
Close-seeded SR Poor 66 77 85 89
or broadcast Good 58 72 81 85
Legumes or C Poor 64 75 83 85
Rotation Good 55 69 78 83
Meadow C&T Poor 63 73 80 83
Good 51 67 76 80
Average runoff condition and initial abstraction such as surface storage, interception and infiltration prior to runoff are assumed to be 20% of the potential maximum retention, Ia = 0.2S.
1 Crop residue cover applies only if residue is on at least 5 percent of the surface throughout the year.
2 Hydrologic condition is based on a combination of factors that affect infiltration and runoff, including (a) density and canopy of vegetative areas; (b) amount of year-round cover; (c) amount of grass or closed-seeded legumes in rotations; (d) percentage of residue cover on the land surface (good > 20 percent); and (e) degree of roughness.
Poor: Factors impair infiltration and tend to increase runoff. Good: Factors encourage average and better than average infiltration and tend to decrease runoff.
Source: TR-55

City of Lincoln Drainage Criteria Manual Update
Project No.020-1827 May 2021
28
Table 2-9. Other Agricultural Lands.
Cover Description Curve Numbers for Hydrologic Soil
Group
Cover type Hydrologic condition
A B C D
Pasture, grassland, or range-continuous forage for grazing1
Poor 68 79 86 89
Fair 49 69 79 84
Good 39 61 74 80
Meadow – continuous grass, protected from grazing and generally mowed for hay
30 58 71 78
Brush – brush-weed-grass mixture with brush the major element2
Poor 48 67 77 83
Fair 35 56 70 77
Good 330 48 65 73
Woods – grass combination orchard or tree farm)4
Poor 57 73 82 86
Fair 43 65 76 82
Good 32 58 72 79
Woods5
Poor 45 66 77 83
Fair 36 60 73 79
Good 430 55 70 77
Farmsteads – buildings, lanes, driveways, and surrounding lots
59 74 82 86
Average runoff condition and initial abstraction such as surface storage, interception and infiltration prior to runoff are assumed to be 20% of the potential maximum retention, Ia = 0.2S.
1 Poor: < 50 percent ground cover or heavily grazed with no mulch Fair: 50 to 75 percent ground cover and not heavily grazed
Good: > 75 percent ground cover and lightly or only occasionally grazed
2 Poor: < 50 percent ground cover Fair: 50 to 75 percent ground cover Good: > 75 percent ground cover
3 Actual curve number (CN) is less than 30; use CN = 30 for runoff computations.
4 CNs shown were computed for areas with 50 percent grass (pasture) cover. Other combinations of conditions may be computed from CNs for woods and pasture.
5 Poor: Forest litter, small trees and brush are destroyed by heavy grazing or regular burning. Fair: Woods grazed but not burned, and some forest litter covers the soil. Good: Woods protected from grazing, litter and brush adequately cover soil.
Source: TR-55

City of Lincoln Drainage Criteria Manual Update
Project No.020-1827 May 2021
29
Table 2-10. Conversion from Average Antecedent Moisture Conditions to Dry and Wet Conditions.
Curve Number (CN) for Average Conditions
Corresponding CNs
Dry Wet
100 100 100
95 87 98
90 78 96
85 70 94
80 63 91
75 57 88
70 51 85
65 45 82
60 40 78
55 35 74
50 31 70
45 26 65
40 22 60
35 18 55
30 15 50
25 12 43
15 6 30
5 2 13
Source: USDA Soil Conservation Service TP-149 (SCS-TP-149) 1973.

City of Lincoln Drainage Criteria Manual Update
Project No.020-1827 May 2021
30
Table 2-11. Rainfall Groups for Antecedent Soil Moisture Conditions during Growing and Dormant Seasons.
Antecedent Conditions Growing Season 5-day Dormant Season 5-day
Condition Description Antecedent Rainfall Antecedent Rainfall
Dry
An optimum condition of watershed soils, where soils are dry but not to the wilting point and when satisfactory plowing or cultivation takes place
Less than 1.4 in. Less than 0.5 in.
Average The average case for annual floods
1.4 – 2.1 in. 0.5 – 1.1 in.
Wet
When a heavy rainfall, or light rainfall and warm temperatures, have occurred during the five days before a given storm
Over 2.1 in. Over 1.1 in.
Source: Soil Conservation Service
Table 2-12. Composite Curve Number Calculations.
Group A Group B Group C Group D Group E
Land Use Curve Number
Area % of Total Curve Number
Composite Curve Number (Column B x Column D)
Composite curve numbers for a drainage area can be calculated by entering the required data into a spreadsheet (see this exhibit for column headings): The composite curve n