2-dimensional (2-d) visual devices home – … sense/adobe reader/do not open...
TRANSCRIPT

2-DIMENSIONAL (2-D) VISUALDEVICES HOME – PRESENTATION OPTIONS
Graphic organizers
Graphic organizers are two-dimensional visual tools that are often excellentdevices for communicating important ideas. The graphics can be used to bothshow the organization of ideas and how they are related. Generally, there arethree types of graphic organizers: (i) those that depict the organizationalstructure of the information; (ii) mind maps, and (iii) phenomena maps.
There are four common ways that the organization of information can bestructured: (a) Hierarchical, (b) Cause/effect, (c) Compare/contrast, and (d)Sequence.
Cause/effectHierarchial SequenceCompare/contrast
Hierarchic
Hierarchical graphic organizers show the relationships between supra-ordinate, co-ordinate, and sub-ordinate ideas. In other words, hierarchicgraphics depict the overall-all topic, the main ideas associated with the topic,and the essential supporting details for each main idea. Hierarchic structuresmay appear as a traditional web, frame, or flow chart.

Titanic example:
The examples below illustrate how the same hierarchic information can bedepicted using either a web or a frame.

Titanic example:
This example shows how a hierarchic frame can be used to depict acharacter analysis.
Cause/effect
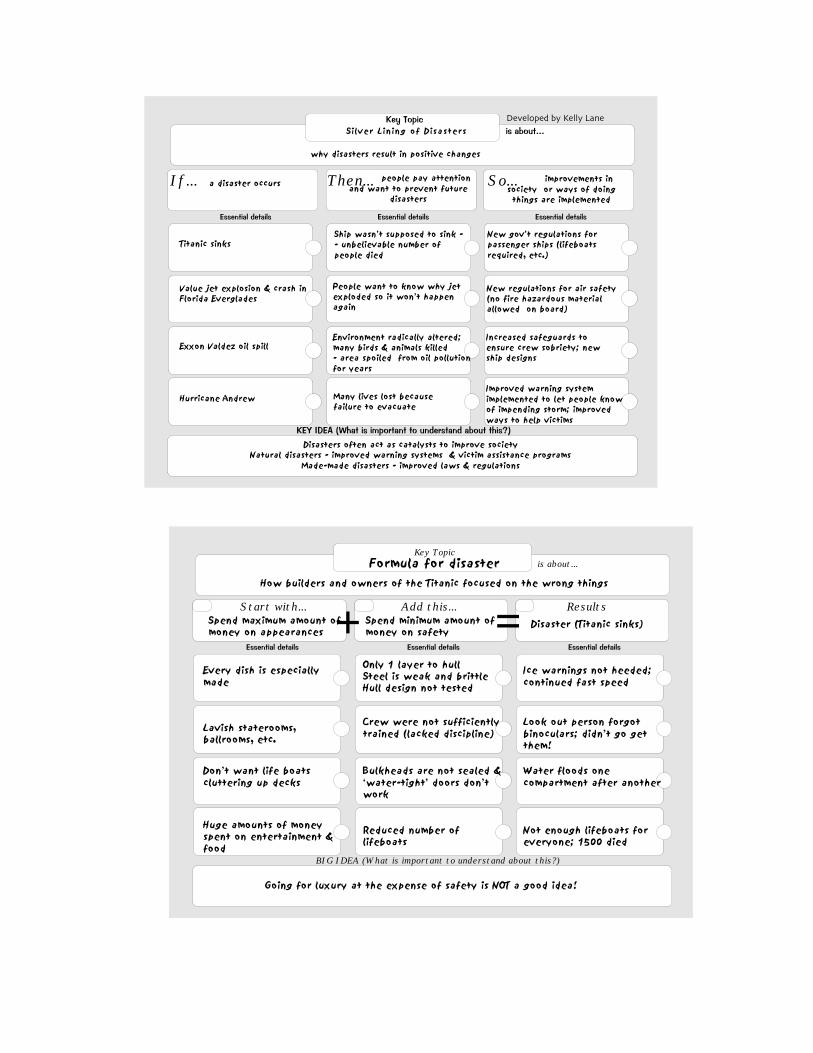
Cause/effect is the second common information structure; it depicts causalrelationships between ideas. A series of webs that flow from one to another isone way to show a cause effect relationship. Hierarchic frames can be readilyadapted to shows these as well. Key words depicting the causal relationshipshould be used on the graphic because they greatly enable the audience tounderstand the relationship being visually depicted. Example key wordsinclude:
When (this happens)... Then (this happens)... Because (or So)...
If (this occurs)... Then (this happens)... Because (or So)...
Start with... Add (or subtract) this... Result is...
KEY IDEA (What is important to understand about this?)
Key Topic
is about...
If... Then... So...
BIG IDEA (What is important to understand about this?)
Key Topicis about...
Start with... Add this... Results + =

Compare/contrastCompare/Contrast is the third common way to structure information. Keyideas being compared can be depicted visually using either a Venn diagramor some form of frame. In the examples below, notice how the Venn diagramdepicts relatively simple comparisons between two concepts.
Titanic example:

Venn diagrams are limited, however, because hierarchical information (mainideas and supporting details) cannot be readily depicted on them. Frames,however, can depict a comparison of main ideas and sub-topics, and as aresult, can communicate considerably more information in a structuredmanner so that the audience can readily understand it. Most tables or chartsalso compare ideas. Tables generally compare numerical data and somedepict changes over time, whereas graphs always show changes over time insome manner.
Titanic example:
KEY IDEA? (What is important to understand about this?)
What is the whole thing about?
Main ideas

Sequence
There are two types of sequences: (a) linear sequence; and (b) cycles. Thefirst example depicts linear sequence frame and the second is an example ofa cycle.
What is this whole idea about?
What are the main things that happened?
Key Idea? What’s important to understand about this?
Developed by Kelly Lane

Mind Maps
Mind maps visually depict important ideas, and they are usually mnemonicallyenhanced with symbols or pictures to help the audience understand keyideas. While they may include components that depict any of the four basicinformation structures, they do not necessarily do so. They are open in thesense that each mind map is different -- there is no set or established formatto follow. Any creative idea for depicting an idea on the graphic that shows itsrelationship to other ideas can be used.

Titanic example:
The example below illustrates a mind map depicting key facts associatedwith the Titanic diaster.
Steerage Class
2nd Class
1st Class 23%21%
68%
“Glad I’m 1st class so I’m close to lifeboats!”
“Hey! Unlock the gates! We can’t get out!”
76% died
Steerage
55% died
2nd class 1st class
39% died
LifeboatsWow! The iceberg is nearly invisible!stayed in
upper decks
Thin hull, poor quality steel, 1 layer
Rudder too small to turn ship rapidly Not a long tear, rather series of pin holes

Phenomena maps
Phenomena maps depict the critical features associated with commonpatterns of phenomena rather than patterns of information. Here, studentsuse a ‘boiler-plate’ or blank reformatted mind-map representing a particularpattern of phenomena and simply plug into the form the information they wishto communicate. For example, anytime something changes, it is the result ofsome form of tension, or series of tensions, that build to a point to where areaction to the tension takes place. The reaction, if sufficient in magnitude,will produce noticeable changes. These changes, in turn, act as new ‘spin-off’tensions like a ripple effect. This phenomena can be depicted graphically on a‘Tension/Reaction Phenomena Map,’ as illustrated below.
Titanic example: Sources of Tension
Reaction Actions
Critical Tension Pivotal Event?
BIG IDEA (What’s important to understand about this?)
Resultsor
Changes
Spin-off Tensions or Issues
Hit an iceberg
Fast speed
Failure to the heed warnings
Moon less, starless night- --iceberg nearly invisible
No binoculars in crow’s nest
Invincible cockiness
Lack of Lifeboats!
No control of events -- disorganization
Survival instincts took over for many -- People panicked (jumped overboard, fought, argued).
Approximately 1,500 lives were lost.
Many lifeboats empty or nearly empty.
792 were saved.
Tension: Ill feelings toward rich.
Conflict: Famous & rich people were given special treatment (saved vs. dead)
Issue: Why weren’t there enough lifeboats? (luxury vs. safety)
Some bravely & calmly faced death.Some collected loved ones to face death together.
Some sacrificed themselves so others could live..
Some simply couldn’t believe it was happening.
Some desperately wanted to escape, but were locked in.
Titanic is Sinking!
* Nothing manmade is ever “FOOL-PROOF” - must always take precautions.
* Class system can result in extreme unfairness to those without $$

The Yin/Yang pattern is a different example of phenomena that can bedepicted visually. The basic phenomena is that events, regardless of whetherthey are perceived positively or negatively, also produce opposite outcomes.
Titanic example:
The example below shows that while the sinking of the Titanic wasconsidered a disaster due to the great loss of life and wealth, the ‘disaster’also produced a number of very positive outcomes.
KEY IDEA! What is important to understand about this?
is about...
NE
GATIV
E S OPS
IIT V
ES

Surface Maps
Surface maps include road maps, marine charts, topographical maps,population distribution maps, climate maps, and any common map used todepict features of a given area.
Titanic example:
The Titanic team might have developed a surface map depicting the Titanicintended route, and the approximate location of its sinking. Additionalinformation on the map might be air and water temperature along variouspoints of the Titanic’s course.
Posters
Students often enjoy designing posters and this technique can be verydesirable because students tend to intuitively consider the communicationgoals and the audience needs. They must use critical thinking skills tocarefully consider the important ideas to be communicated in a precisemanner and incorporate creative thinking and artistic skills to design a posterwhich effectively communicates the key ideas in a manner that provokesinterest in the audience. Once students have designed the poster, theyshould be asked to explain the ideas on the poster and the thinking behindthe poster design.
Students should be encouraged to design posters for different audiences andwith varying communication goals. For example, the Titanic team mightdesign two different posters. One is targeted at the elite wealthy to encouragethem to purchase tickets for the maiden voyage to be part of the grand party,while another might be targeted at less fortunate persons who might beconsidering immigration to America, but need to be persuaded to give up aconsiderable portion of their limited funds to purchase a ticket.
Titanic example:

Drawings or paintings
A good picture communicates a 1,000 words. Students can illustrateimportant events, people, processes, or concepts via pictures. Like posters,students should be asked to explain how the picture illustrates importantideas and their thinking behind the design of the picture.
Titanic example:
A student might design a picture of two Titanic life boats, floating side by sideamong chips of ice. To depict the chaos of the abandon-ship process, onelifeboat might be depicted as totally overloaded, while the other has only afew individuals in it. The picture might demonstrate the characteristics of thesurvivors (i.e., relative percent of women vs. men, vs. children, as well as thetype and class of passenger such as percent of crew vs. first classpassengers, etc. who found places in lifeboats).
Photographs
A collection of photographs related to the topic can also enhance the qualityof a presentation. Remember that students should be expected to explainwhat the pictures show, why the particular pictures they selected to sharewere chosen, and how the pictures tie in with one of the key ideas of theirpresentation.
Titanic example:
The Titanic team planned on selecting a series of Titanic pictures from booksand magazines and scanning them onto a disk so that they could beincorporated into a Power-point presentation. A less ambitious team mightsimply have photocopied the pictures and created a display of them as partof their presentation.

Collage
A collage of an array of pictures can be designed to illustrate important ideas.The overall collage should reflect a central theme so that all of the picturesrelate in some way, and students should be expected to explain theme andhow the pictures illustrate it.
Titanic example:
One of the key ideas the Titanic team choose to communicate concerned theimportance of government regulations. A potential collage the team mighthave developed could have been series of pictures of various things in ourworld where government regulation is a necessary function to protect society.For example, the collage might include pictures of sinking ships to illustratethe need for maritime safety regulations, a picture of an endangered speciesand one of factories spewing pollution to illustrate the need for governmentaction to protect our environment. The collage might also contain a picture ofa pill bottle to illustrate the need to ensure that drugs are thoroughly testedbefore being allowed on the market and the need to limit access to somedrugs, and so forth.
Metaphor clip-art
Students who are not artistically inclined can nevertheless communicate keyideas using pictures as metaphors for key ideas. The pictures might be foundin magazines and clipped out, or digital clip-art can be used as well. Thepicture should be a metaphor of a key idea. To select a metaphoric picture,the essential elements of a key idea should be identified initially, and then apicture should be found that has features relating in some way to at leastsome of these key elements. When sharing the metaphoric picture during thepresentation, the student should explain why the picture is a good metaphor.
Titanic example:
A student could find a picture to serve as a metaphor for the characteristicsof the ‘”unsinkable” Molly Brown -- a thoroughly likable, boisterous, sassy,newly-rich survivor who originally was a middle class woman who marriedsomeone who struck it rich with a gold mine. The student might find a picturein a magazine of a “souped-up” ‘57 Chevy with mag wheels, racing stripe,roll-tuck leather seats, and so forth. During the presentation, the studentwould explain that picture would be a good metaphor for Molly Brown
because originally, the ‘57 Chevy was just a plain car designed for theaverage person, but now it is worth a great deal of money as a collector’sitem. It is souped-up nature shows how something plain can be transformedinto something that looks very expensive, but underneath the glitter is still theoriginal plain car. Nonetheless, there was something about the ‘57 Chevythat was really sassy and appealing. Thus, the picture of the ‘57 Chevyserves as a good metaphor for Molly Brown because of their sharedcharacteristics.
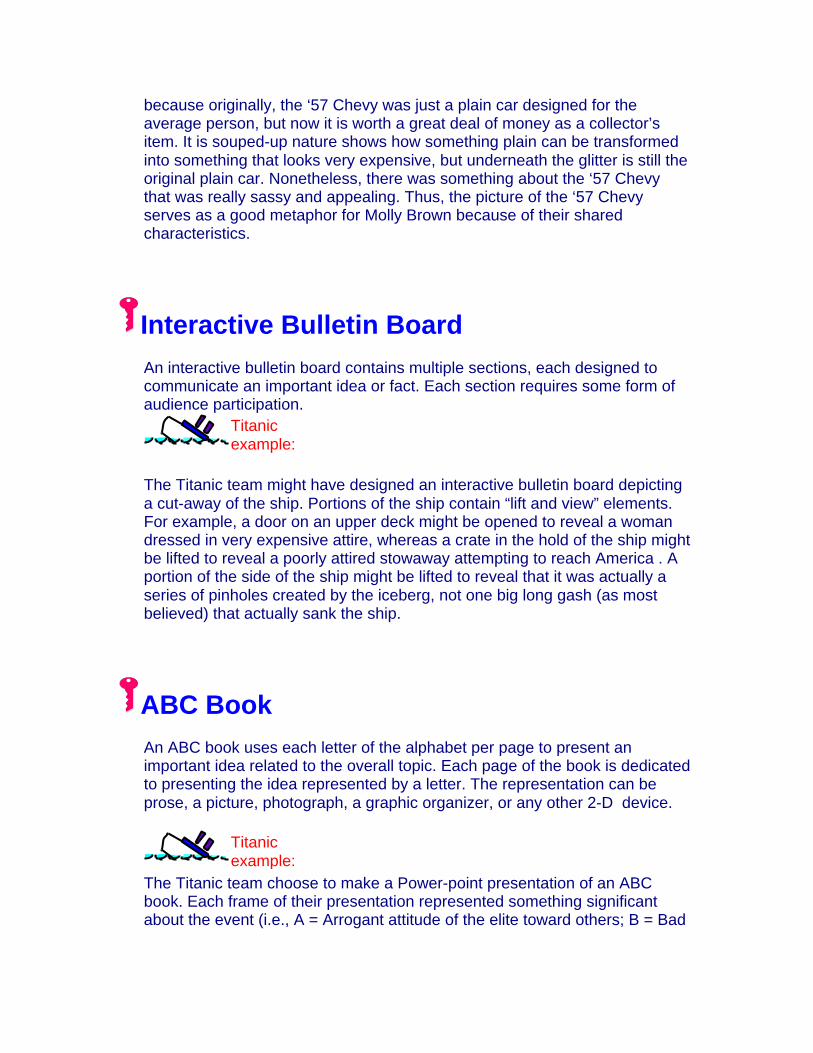
Interactive Bulletin Board
An interactive bulletin board contains multiple sections, each designed tocommunicate an important idea or fact. Each section requires some form ofaudience participation.
Titanic example:
The Titanic team might have designed an interactive bulletin board depictinga cut-away of the ship. Portions of the ship contain “lift and view” elements.For example, a door on an upper deck might be opened to reveal a womandressed in very expensive attire, whereas a crate in the hold of the ship mightbe lifted to reveal a poorly attired stowaway attempting to reach America . Aportion of the side of the ship might be lifted to reveal that it was actually aseries of pinholes created by the iceberg, not one big long gash (as mostbelieved) that actually sank the ship.
ABC Book
An ABC book uses each letter of the alphabet per page to present animportant idea related to the overall topic. Each page of the book is dedicatedto presenting the idea represented by a letter. The representation can beprose, a picture, photograph, a graphic organizer, or any other 2-D device.
Titanic example:
The Titanic team choose to make a Power-point presentation of an ABCbook. Each frame of their presentation represented something significantabout the event (i.e., A = Arrogant attitude of the elite toward others; B = Bad

preparation of crew to deal with emergencies; C = Captain wanted to slowdown, but Star Line owner wouldn’t let him, etc.).
Slide show, Power Point, or Hypertext presentation)
A slide show is similar to an ABC book in that each of the important ideas tobe communicated has its own ‘page,’ ‘slide.’ or ‘card.’ A slide show can useold technology (i.e., using actual photographic slides presented with a slideprojector or using overhead transparencies) or new technology such a multi-media or presentation programs (i.e., Powerpoint or HyperCard) to presentimportant ideas. Ideally, each slide communicate an important idea using adifferent format. For example, one slide communicates an idea by depicting aweb, the next slide shows a photograph, the third shows a famous quote, andso forth.HOME – PRESENTATION OPTIONS