2 computer vision: mar 2000 - university of washington
TRANSCRIPT
Chapter 6
Color and Shading
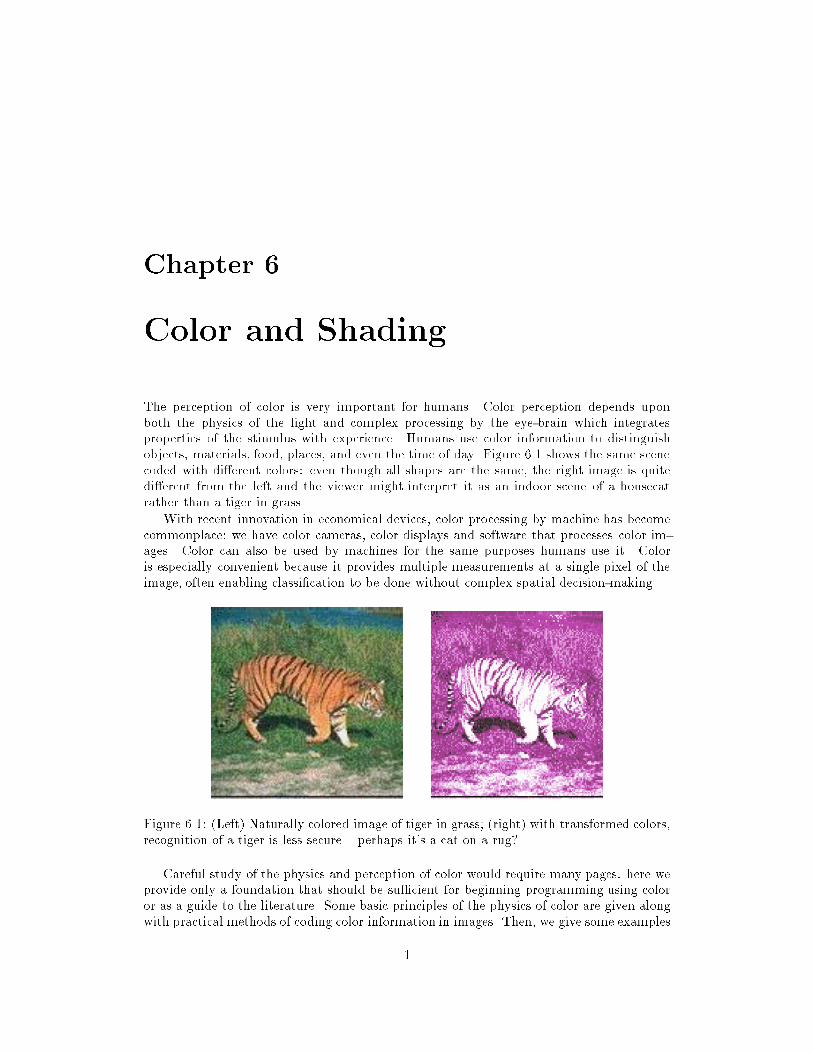
The perception of color is very important for humans. Color perception depends uponboth the physics of the light and complex processing by the eye-brain which integratesproperties of the stimulus with experience. Humans use color information to distinguishobjects, materials, food, places, and even the time of day. Figure 6.1 shows the same scenecoded with di�erent colors: even though all shapes are the same, the right image is quitedi�erent from the left and the viewer might interpret it as an indoor scene of a housecatrather than a tiger in grass.
With recent innovation in economical devices, color processing by machine has becomecommonplace: we have color cameras, color displays and software that processes color im-ages. Color can also be used by machines for the same purposes humans use it. Coloris especially convenient because it provides multiple measurements at a single pixel of theimage, often enabling classi�cation to be done without complex spatial decision-making.
Figure 6.1: (Left) Naturally colored image of tiger in grass; (right) with transformed colors,recognition of a tiger is less secure { perhaps it's a cat on a rug?
Careful study of the physics and perception of color would require many pages: here weprovide only a foundation that should be su�cient for beginning programming using coloror as a guide to the literature. Some basic principles of the physics of color are given alongwith practical methods of coding color information in images. Then, we give some examples
1

2 Computer Vision: Mar 2000
and methods for using color in recognizing objects and segmenting images.
We also study the shading of objects, which depends not just on the color of objectsand the light illuminating them, but also on many other factors. These factors include theroughness of surfaces, the angles made between the surface and both the light sources andthe viewer, and the distances of the surface from both the light sources and the viewer. Colorand shading, important elements of art for centuries, are also important for interpreting ascene by computer vision algorithms.
6.1 Some Physics of Color
Electromagnetic radiation with wavelength � in the range of between about 400 and 700nanometers stimulates human neurosensors and produces the sensation of color. (Fig-ure 6.2). A nanometer is 10�9 meter: it is also referred to as a millimicron. For bluelight, 400�10�9meters per wave means 2:5�106waves per meter or 25000 waves per cm.The speed of light in a vacuum is 3 � 108m=sec, which is equivalent to a frequency of0:75� 1015 blue light waves per second. This frequency is one one thousandth of that forX-rays and one billion times that of broadcast radio waves.
For the rest of this chapter, we refer to wavelength or frequency only in the context ofthe qualitative color it produces. Machines can detect radiation well beyond the range ofhuman neurosensors; for example, short ultraviolet waves and extremely short X-rays canbe detected by special devices. Also, long infrared waves can be detected by many solidstate cameras, and very long radio waves can be detected by a radio receiver. Science andengineering have developed many devices to sense and transduce pixel measurements intothe visible spectrum: the X-ray machine and IR satellite weather scanner are two commonexamples.
wavelength λ (nanometers)
blue
400 800600
green redultraviolet infrared
radiowaves
X-rays
visible light
Figure 6.2: Visible part of the electromagnetic spectrum.
Exercise 1
Suppose a piece of paper is 0.004 inches thick. What is its thickness in terms of the equivalentnumber of waves of blue light?

Shapiro and Stockman 3
surface element
optical axis
Nsurfacenormal
Z
irradianceradiance
θ
reflectancesurface
OBJECT
CAMERA
sensor element
point source ofillumination
Figure 6.3: Light energy from a source re ects from an object surface and irradiates a sensorelement.
6.1.1 Sensing Illuminated Objects
Figure 6.3 shows light from a point source illuminating an object surface. As a result ofthe illuminating energy interacting with molecules of the object surface, light energy, orradiance, is emitted from the surface, some of which irradiates, or stimulates, a sensorelement in a camera or organism's eye. The sensation, or perception, of an object's colordepends upon three general factors:
� the spectrum of energy in various wavelengths illuminating the object surface,
� the spectral re ectance of the object surface, which determines how the surface changesthe received spectrum into the radiated spectrum,
� the spectral sensitivity of the sensor irradiated by the light energy from the object'ssurface.
An object that is \blue" has a surface material that appears blue when illuminated withwhite light.
1 Definition White light is composed of approximately equal energy in all wavelengths
of the visible spectrum.
This same object should appear violet if illuminated by only red light. A blue car underintense (white) sunlight will become hot to the touch and radiate energy in the IR range,which cannot be seen by the human eye but can be seen by an IR camera.
6.1.2 Additional Factors
In addition to the three major factors given above, there are several complicating factors inboth physics and human perception. Surfaces vary in specularity, that is, how much they act

4 Computer Vision: Mar 2000
like a mirror. Matte surfaces re ect energy equally in all directions. The energy or intensityof radiation depends upon distance { surface elements farther from a point source of whitelight will receive less energy than closer surface elements. The e�ect is similar betweenthe radiating object and the sensor elements. As a result, image intensities received fromthe same surface material might be nonuniform due to the nonuniform distances along theimaging rays. The orientation � of the surface element relative to the source is even moreimportant than distance in determining the energy re ected toward the sensor. These issuesare discussed in more detail toward the end of this chapter.
Exercise 2 variation of intensity with distance
Point your computer's camera perpendicularly at a sheet of uniform white paper that isilluminated from an incandescent bulb o� to one side. Record the image and study theimage intensities. How much variation is there? Is there a systematic decrease of intensityas the distance from some brightest pixel increases?
Exercise 3 variation of intensity with surface normal
Repeat the above experiment using a spherical volleyball rather than a at sheet of paper.Record the image and study the image intensities. Report on the variations and regularities.
6.1.3 Sensitivity of Receptors
Actual receptors react only to some wavelengths and are more sensitive to certain wave-lengths than to others. Figure 6.4 shows sample sensitivity curves. Three of the curvescorrespond to three di�erent kinds of cones in the human eye containing di�erent chemicalpigments sensitive to di�erent wavelengths. The curve marked human1 corresponds to atype of cone that is mildly sensitive to blue light between 400 and 500 nm. The curve markedhuman2 corresponds to cones that are very sensitive to green light and mildly sensitive toshorter wavelengths of blue and longer wavelengths of red. The brain fuses the responses
from a local neighborhood of several cones to produce the perception of any visible color.It is somewhat remarkable that only three kinds of receptors are needed to do this, eventhough there are an in�nite number of possible wavelengths of light. Many other seeing ani-mals have only one or two types of receptors and perhaps perceive less rich color as a result.Solid state sensing elements usually have good sensitivity above the range for humans. It'simportant to remember this, since sometimes as the workday warms up, a machine visionsystem will see a scene di�erently from what a human operator sees. This is primarily dueto the di�erent sensitivity to IR radiation.
Exercise 4 favorite colorDo you have a favorite color? Is so, what is it? Why is it your favorite? Ask 3 other peoplewhat their favorite color is. Assuming you have multiple answers, how can you explain itgiven the known physics of color?

Shapiro and Stockman 5
400 500 600 700 800
wavelength (nanometers)
sensitivity
human 1
human 2 human 3
solid state
Figure 6.4: Comparison of relative sensitivities of 3 human pigments in cones and solid statesensor element.
6.2 The RGB Basis for Color
Using only three types of receptors, humans can distinguish among thousands of colors; amore exact number is subject to argument. The trichromatic RGB (red-green-blue) encod-ing in graphics systems usually uses three bytes enabling (28)3 or roughly 16 million distinctcolor codes. To be precise, we say 16 million codes and not 16 million colors because humanscannot actually perceive that many distinct colors. Machines can distinguish between anypair of di�erent bit encodings, but the encodings may or may not represent di�erences thatare signi�cant in the real world. Each 3-byte or 24-bit RGB pixel includes one byte foreach of red, green, and blue. The order in which each appears in memory can vary; order isirrelevant to theory but important for programming. Display devices whose color resolutionmatches the human eye are said to use true color. At least 16 bits are needed: a 15-bitencoding might use 5 bits for each of R,B,G, while a 16-bit encoding would better modelthe relatively larger green sensitivity using 6 bits.
The encoding of an arbitrary color in the visible spectrum can be made by combiningthe encoding of three primary colors (RGB) as shown in Figure 6.5. Red:(255,0,0) andgreen:(0,255,0) combined in equal amounts create yellow:(255,255,0). The amount of eachprimary color gives its intensity. If all components are of highest intensity, then the colorwhite results. Equal proportions of less intensity create shades of grey:(c,c,c) for any con-stant 0 < c < 255 down to black:(0,0,0). It is often more convenient to scale values in therange 0 to 1 rather than 0 to 255 when making decisions about color in our algorithms: useof such a range is device-independent.
The RGB system is an additive color system because colors are created by adding compo-nents to black:(0,0,0). This corresponds well to RGB displays (monitors) which have threetypes of phosphors to emit light. Three neighboring elements of phosphor corresponding toa pixel are struck by three electron beams of intensity c1, c2 and c3 respectively: the human

6 Computer Vision: Mar 2000
RGB CMY HSI
RED (255, 0, 0) ( 0,255,255) (0.0 , 1.0, 255)
YELLOW (255,255, 0) ( 0, 0,255) (1.05, 1.0, 255)
(100,100, 50) (155,155,205) (1.05, 0.5, 100)
GREEN ( 0,255, 0) (255, 0,255) (2.09, 1.0, 255)
BLUE ( 0, 0,255) (255,255, 0) (4.19, 1.0, 255)
WHITE (255,255,255) ( 0, 0, 0) (-1.0, 0.0, 255)
GREY (192,192,192) ( 63, 63, 63) (-1.0, 0.0, 192)
(127,127,127) (128,128,128) (-1.0, 0.0, 127)
( 63, 63, 63) (192,192,192) (-1.0, 0.0, 63)
...
BLACK ( 0, 0, 0) (255,255,255) (-1.0, 0.0, 0)
Figure 6.5: Di�erent digital trichromatic color encoding systems. It is often more convenientto scale values in the range 0 to 1 when making decisions in algorithms. HSI values arecomputed from RGB values using Algorithm 1: H 2 [0:0; 2�), S 2 [0:0; 1:0] and I 2 [0; 255].Byte codings exist for H and S.
eye integrates their luminance to perceive \color":(c1, c2, c3). The light of 3 wavelengthsfrom a small region of the CRT screen is thus physically added or mixed together.
Suppose that a color sensor encodes a pixel of a digital image as (R;G;B), where eachcoordinate is in the range [0; 255], for example. The computations shown in Equation 6.1 areone way to normalize image data for interpretation by both computer programs and peopleand for transformation to other color systems as discussed below. Imagine a color camerastaring at a scene with variations in illumination; for example, object surface points are atvarying distances from illumination sources and may even be in shadow relative to some ofthe light sources. An algorithm to aggregate green pixels corresponding to the image of acar would perform poorly unless the normalization for intensity were done �rst.
intensity I = (R + G + B)=3 (6.1)
normalized red r = R=(R + G + B)
normalized green g = G=(R + G + B)
normalized blue b = B=(R + G + B)
Using the normalization of Equation 6.1, the normalized values will always sum to 1.There are alternative normalizations; for instance, we could use max(R;G;B) as the divisorrather than the average RBG value. By using r + g + b = 1, the relationship of coordinatevalues to colors can be conveniently plotted via a 2D graph as in Figure 6.6. Pure colors

Shapiro and Stockman 7
1/3 1
1
1/3white
blue red
green
g
r
pink
gold
Figure 6.6: Color triangle for normalized RGB coordinates. The blue ('b') axis is out of thepage perpendicular to the 'r' and 'g' axes. Thus, the triangle is actually a slice through thepoints [1,0,0], [0,1,0] and [0,0,1] in 3D. The value for blue can be computed as b = 1� r� g
for any pair of r-g values shown in the triangle.
are represented by points near the corners of the triangle. For example, a \�re-engine-red"will be near the lower right corner with coordinates (1,0) and a \grass-green" will be atthe top with coordinates (0,1) while \white" will be at the centroid (1/3,1/3). In Fig-ure 6.6, the blue ('b') axis is out of the page perpendicular to the 'r' and 'g' axes, and thusthe triangle is actually a slice through the points [1,0,0], [0,1,0] and [0,0,1] in 3D. The valuefor blue can be computed as b = 1�r�g for any pair of r-g values shown inside the triangle.
Exercise 5 experimenting with color codes
Aquire an RGB color image and view it with some image tool. Exchange the green and bluebytes and report on the results. Double all and only the low blue values and report on theresults.
6.3 Other Color Bases
Several other color bases exist which have special advantages relative to devices that pro-duce color or relative to human perception. Some bases are merely linear transformationsof others and some are not.
8 Computer Vision: Mar 2000
Blue
(0,0,0)
(0,0,1)(0,1,1)
(0,1,0)
(1,0,0) (1,1,0)
(1,0,1) (1,1,1)
black
white
cyan
greyRed
Greenmagenta
yellow
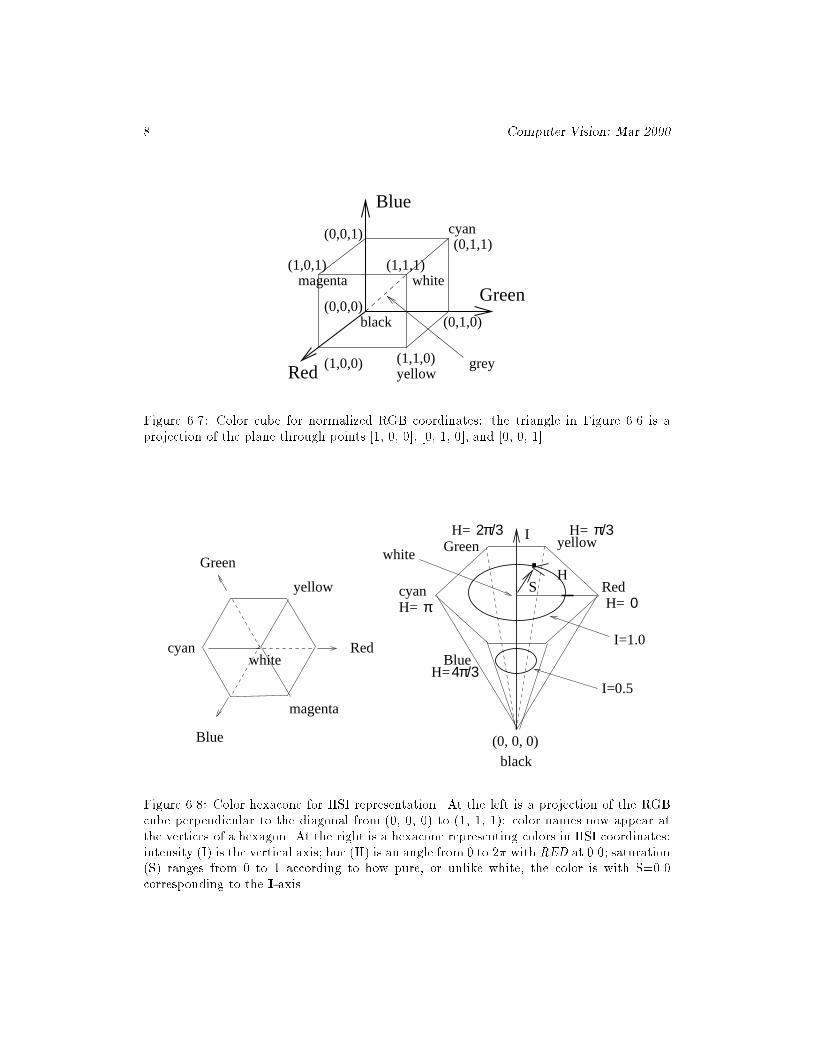
Figure 6.7: Color cube for normalized RGB coordinates: the triangle in Figure 6.6 is aprojection of the plane through points [1, 0, 0], [0, 1, 0], and [0, 0, 1].
white
H
black(0, 0, 0)
Redcyan
Green yellow
I=0.5
I=1.0
H=
H=
H=
H= 0
π/32π/3
π
Blue
Red
Green .I
S
magenta
cyan
yellow
white
H=4π/3Blue
Figure 6.8: Color hexacone for HSI representation. At the left is a projection of the RGBcube perpendicular to the diagonal from (0, 0, 0) to (1, 1, 1): color names now appear atthe vertices of a hexagon. At the right is a hexacone representing colors in HSI coordinates:intensity (I) is the vertical axis; hue (H) is an angle from 0 to 2� with RED at 0.0; saturation(S) ranges from 0 to 1 according to how pure, or unlike white, the color is with S=0.0corresponding to the I-axis.
Shapiro and Stockman 9
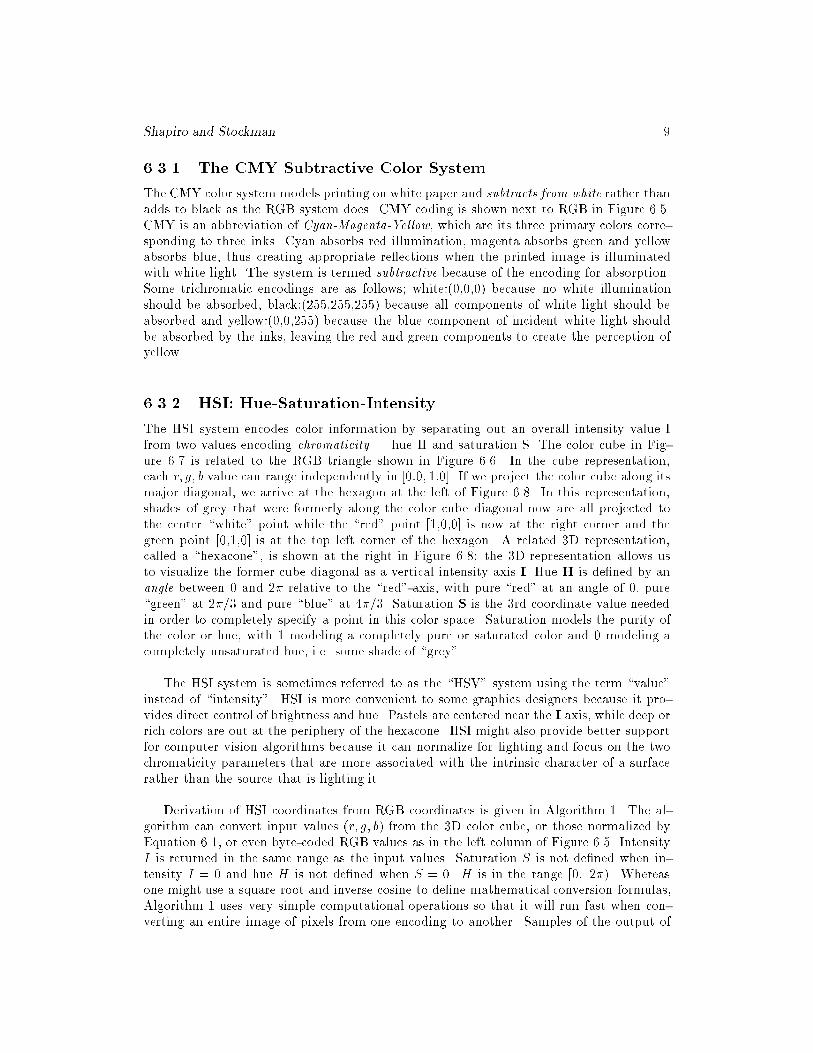
6.3.1 The CMY Subtractive Color System
The CMY color system models printing on white paper and subtracts from white rather thanadds to black as the RGB system does. CMY coding is shown next to RGB in Figure 6.5.CMY is an abbreviation of Cyan-Magenta-Yellow, which are its three primary colors corre-sponding to three inks. Cyan absorbs red illumination, magenta absorbs green and yellowabsorbs blue, thus creating appropriate re ections when the printed image is illuminatedwith white light. The system is termed subtractive because of the encoding for absorption.Some trichromatic encodings are as follows; white:(0,0,0) because no white illuminationshould be absorbed, black:(255,255,255) because all components of white light should beabsorbed and yellow:(0,0,255) because the blue component of incident white light shouldbe absorbed by the inks, leaving the red and green components to create the perception ofyellow.
6.3.2 HSI: Hue-Saturation-Intensity
The HSI system encodes color information by separating out an overall intensity value Ifrom two values encoding chromaticity | hue H and saturation S. The color cube in Fig-ure 6.7 is related to the RGB triangle shown in Figure 6.6. In the cube representation,each r; g; b value can range independently in [0:0; 1:0]. If we project the color cube along itsmajor diagonal, we arrive at the hexagon at the left of Figure 6.8. In this representation,shades of grey that were formerly along the color cube diagonal now are all projected tothe center \white" point while the \red" point [1,0,0] is now at the right corner and thegreen point [0,1,0] is at the top left corner of the hexagon. A related 3D representation,called a \hexacone", is shown at the right in Figure 6.8: the 3D representation allows usto visualize the former cube diagonal as a vertical intensity axis I. Hue H is de�ned by anangle between 0 and 2� relative to the \red"-axis, with pure \red" at an angle of 0, pure\green" at 2�=3 and pure \blue" at 4�=3. Saturation S is the 3rd coordinate value neededin order to completely specify a point in this color space. Saturation models the purity ofthe color or hue, with 1 modeling a completely pure or saturated color and 0 modeling acompletely unsaturated hue, i.e. some shade of \grey".
The HSI system is sometimes referred to as the \HSV" system using the term \value"instead of \intensity". HSI is more convenient to some graphics designers because it pro-vides direct control of brightness and hue. Pastels are centered near the I axis, while deep orrich colors are out at the periphery of the hexacone. HSI might also provide better supportfor computer vision algorithms because it can normalize for lighting and focus on the twochromaticity parameters that are more associated with the intrinsic character of a surfacerather than the source that is lighting it.
Derivation of HSI coordinates from RGB coordinates is given in Algorithm 1. The al-gorithm can convert input values (r; g; b) from the 3D color cube, or those normalized byEquation 6.1, or even byte-coded RGB values as in the left column of Figure 6.5. IntensityI is returned in the same range as the input values. Saturation S is not de�ned when in-tensity I = 0 and hue H is not de�ned when S = 0. H is in the range [0; 2�). Whereasone might use a square root and inverse cosine to de�ne mathematical conversion formulas,Algorithm 1 uses very simple computational operations so that it will run fast when con-verting an entire image of pixels from one encoding to another. Samples of the output of

10 Computer Vision: Mar 2000
Algorithm 1 are given at the right in Figure 6.5.
Conversion of RGB encoding to HSI encoding.
R,G,B : input values of RGB all in range [0,1] or [0,255];I : output value of intensity in same range as input;S : output value of saturation in range [0,1];H : output value of hue in range [0,2�), -1 if S is 0;R,G,B,H,S,I are all oating point numbers;
procedure RGB to HSI( in R,G,B; out H,S,I)fI := max ( R, G, B );min := min ( R, G, B );if (I � 0.0) then S := (I - min )/I else S := 0.0;if (S � 0.0) then f H := -1.0; return; g\compute the hue based on the relative sizes of the RGB components"
di� := I - min;\is the point within +/- 60 degrees of the red axis?"if (r = I) then H := (�=3)*(g - b)/di�;\is the point within +/- 60 degrees of the green axis?"else if (g = I) then H := (2 � �=3) + �=3 *(b - r)/di�;\is the point within +/- 60 degrees of the blue axis?"else if (b = I) then H := (4 � �=3) + �=3 *(r - g)/di�;if (H � 0.0) H := H + 2�;g
Algorithm 1: Conversion of RGB to HSI.
Exercise 6
Using Algorithm 1, (a) convert the RGB code (100,150,200) into an HSI code and (b) convertthe rgb code (0.0, 1.0, 0.0) to HSI.
Returning to Figure 6.6, we see how HSI values relate to the color triangle. Hue isrelated to the dominant wavelength of the light and corresponds approximately to a pointon the sides of the triangle in Figure 6.6 with the lower values of � near 400 nm startingat the origin and increasing along the g � axis to about 520 nm and further increasingtoward 800 nm down along the hypotenuse. Hue corresponds to the angle from the centroidcorresponding to \white" toward some point (r, g) on a side of the triangle. The H and Svalues for 50% saturated gold is midway between the points marked \white" and \gold" inFigure 6.6. Figure 6.6 is an approximation to the painters color palette.
Figure 6.9 shows the transformation of an image by changing its saturation. The originalinput image is at the left. The center image is the result of decreasing the saturation S of allindividual pixels by 20% and the right image is the result of a 20% increase in S. Relative

Shapiro and Stockman 11
Figure 6.9: (Left) Input RGB image; (center) saturation S increased by 40%; (right) satu-ration S decreased by 20%. (Photo by Frank Biocca.)
to our experience, colors in the center image look washed out while those in the right imageappear overdone. It is important to note that hue H is unchanged in the three images andshould thus be a reliable feature for color segmentation despite variations in intensity ofwhite light under which a machine vision system might have to operate.
Exercise 7
Develop an algorithm to convert r,g,b color coordinates in [0; 1] to H,S,I using the followingapproach based on analytical geometry. Construct a perpendicular from point [r; g; b] to thecolor cube diagonal through [0; 0; 0] to [1; 1; 1] and compute H,S,I accordingly.
6.3.3 YIQ and YUV for TV signals
The NTSC television standard is an encoding that uses one luminance value Y and twochromaticity values I and Q; only luminance is used by black and white TVs, while all threeare used by color TVs. An approximate linear transformation from RGB to YIQ is given inEquation 6.2. In practice, the Y value is encoded using more bits than used for the valuesof I and Q because the human visual system is more sensitive to luminance (intensity) thanto the chromaticity values.
luminance Y = 0:30R + 0:59G + 0:11B (6.2)
R� cyan I = 0:60R � 0:28G � 0:32B
magenta � green Q = 0:21R � 0:52G + 0:31B
YUV encoding is used in some digital video products and compression algorithms suchas JPEG and MPEG. The conversion of RGB to YUV is as follows.
Y = 0:30R + 0:59G + 0:11B (6.3)
U = 0:493 � (B � Y )
V = 0:877 � (R � Y )

12 Computer Vision: Mar 2000
YIQ and YUV have better potential for compression of digital images and video thando other color encoding schemes, because luminance and chrominance can be coded usingdi�erent numbers of bits, which is not possible with RGB.
Exercise 8 color code conversionSuppose a color camera encodes a given pixel in RGB as (200,50,100), where 255 is thehighest (most energy) value. (a) What should be the equivalent triple in the HSI system?(b) What should be the equivalent triple in the YIQ system?
Exercise 9
Is the transformation from RGB to YIQ invertible? If so, compute the inverse.
Exercise 10 recoding images
Assuming that you have a display and software to view an RGB image, perform the followingexperiment. First, create an HSI image such that the upper right quarter is saturated red,the lower left corner is saturated yellow, the upper left quarter is 50% saturated blue and thelower right quarter is 50% saturated green. Invert the RGB to HSI conversion of Algorithm 1and convert the HSI image to RGB. Display the image and study the colors in the 4 imagequarters.
6.3.4 Using Color for Classi�cation
The color of a pixel contains good information for classifying that pixel in many applica-tions. In Section 6.5 a color model for human skin color is described that goes a long waytoward �nding a human face in a color image. Confusion is possible, however. For example,pixels from a brown cardboard box can pass the skin color test and region shape mightbe needed to distinguish a polyhedral box face from an elipsoidal human face. Figure 6.10shows the result of extracting \white regions" of an image by passing pixels that are close tosome sample pixel from training. Sample pixels were obtained from the symbols on the sign.Several unwanted regions are also formed by other white objects and by specular re ections.Character recognition algorithms could recognize many of the characters and discard mostof the unwanted components.
In general, interpretation of the color of an individual pixel is error prone. The imageat the left in Figure 6.9 was taken with a ash from the camera and some of the facesof the pineapple chunks appear white because of specular re ection (described below inSection 6.6.3). A classi�er that broadens the de�nition of yellow to include these whitepixels is also likely to include pixels from specular re ections o� a blue cup, for instance.Interpetation problems occur in particular regions of the color space: when saturation isclose to zero computation and interpretation of hue is unreliable and when intensity is lowinterpretation of saturation is also unreliable.

Shapiro and Stockman 13
Figure 6.10: \White pixels" are segmented from the color image at the left. Individualconnected components of white pixels are arbitrarily labeled by a coloring algorithm asdecribed in Chapter 3. (Analysis contributed by David Moore.)
Exercise 11
Show that conversion from RGB to HSI is unstable when either saturation or intensity isclose to 0 by performing the following experiments. Implement Algorithm 1 as a program.(a) Convert the RGB codes (L+ �LR; L+ �LG; L+ �LB) to HSI for L large and �LX 2 f-2,-1, 1, 2g. Are the values of H consistent? (b) Repeat this experiment for L small (about10) and � as above. Are the values for S consistent?
6.4 Color Histograms
A histogram of a color image can be a useful representation of that image for the purposeof image retrieval or object recognition. A histogram counts the number of pixels of eachkind and can be rapidly created by reading each image pixel just once and incrementingthe appropriate bin of the histogram. Retrieval of images from image databases using colorhistograms is treated in Chapter 8. Color histograms are relatively invariant to translation,rotation about the imaging axis, small o�-axis rotations, scale changes and partial occlusion.Here, we sketch the method of color histogram matching originally proposed by Swain andBallard (1991) for use in object recognition.
A simple and coarse method of creating a histogram to represent a color image is toconcatenate the higher order two bits of each RGB color code. The histogram will have26 = 64 bins. It is also possible to compute three separate histograms, one for each color,and just concatenate them into one. For example, separate RGB histograms quantized into16 levels would yield an overall k = 48 bin histogram as used by Jain and Vailaya (1996).Two color images and histograms derived from them are shown in Figure 6.4.
The intersection of image histogram h(I) and model histogram h(M ) is de�ned as thesum of the minimum over all K corresponding bins as denoted in Equation 6.4. The inter-section value is normalized by dividing by the number of pixels of the model to get a matchvalue. This match value is a measure of how much color content of the model is present

14 Computer Vision: Mar 2000
0
100
200
300
400
500
600
700
800
900
1000
0 10 20 30 40 50 60 70
"tiger.hcol"
0
200
400
600
800
1000
1200
1400
0 10 20 30 40 50 60 70
"pigs1.hcol"
Figure 6.11: Color images and their 64-bin histograms (obtained from A. Vailaya).

Shapiro and Stockman 15
in the image and is not diminished due to background pixels of the image that are not inthe model. Other similarity measures can be de�ned; for example, we could normalize thehistograms into frequencies by dividing each bin count by the total number of pixels andthen use the Euclidean distance to compare two images.
intersection(h(I); h(M )) =PK
j=1minfh(I)[j]; h(M )[j]g (6.4)
match(h(I); h(M )) =PKj=1minfh(I)[j];h(M)[j]gPKj=1 h(M)[j]
Experiments have shown that histogram match values can be good indicators of imagesimilarity under variations mentioned above and also using di�erent spatial quantizations ofthe image. Swain and Ballard also developed a backprojection algorithm which could locatea region in an image approximately the size of the model object that best matched themodel histogram. Thus, they have developed two color-based algorithms, one to recognizeif an image contains a known object and another to determine where that object is located.If images are taken under di�erent lighting conditions, then intensity should be factored out�rst. One should also consider smoothing the histograms so that a good match will still beobtained with minor shifts of the re ectance spectrum. An alternate method is to matchthe cumulative distributions rather than the frequencies themselves.
Exercise 12 matching images with permuted pixels
Suppose that given image A, we create image B by randomly permuting the locations ofthe pixels in A. (This could be done as follows. First, copy A to B. Then, for each pixel I[r,c] in B, choose pixel I[x, y] at random and swap I[r, c] with I[x, y].) What would be theresulting match value between the histograms from A and B?
Exercise 13 recognizing produce
Obtain 3 bananas, 3 oranges, 3 red apples, 3 green apples, 3 green peppers and 3 redtomatoes. For each of these six sets of produce, take three images, varying the arrangementof the 3 di�erent produce items each time. This will result in 18 images. Construct a colorhistogram for each image. Use the �rst histogram of each set to be the model (6 models inall), then compute the histogrammatch value between each of the 6 models and the 12 otherhistograms. Report the results: do your results support the possibility of a supermarketproduce recognition system to recognize produce placed on the cashier's scale?
6.5 Color Segmentation
We now describe work on �nding a face in a color image taken from a workstation cam-era. The ultimate goal of the work is better man-machine communication. An algorithm issketched which �nds the main region of the image corresponding to the user's face. First, atraining phase is undertaken to determine the nature of face pixels using samples from dif-ferent people. Figure 6.12 shows a plot of pixels (r, g) taken from di�erent images containingfaces: normalized red and green values are used as computed from Equations 6.1. Six classesof pixels are easy to de�ne by decision boundaries using the methods of Chapter 4; three

16 Computer Vision: Mar 2000
Figure 6.12: Skin color clusters obtained from training: the horizontal axis is Rnorm andthe vertical axis is Gnorm. The cluster labeled as t 4 is the primary face color, clusters t 5
and t 6 are secondary face clusters associated with shadowed or bearded areas of a face.(Figure from V. Bakic.)
of them contain face pixels, a primary class and two classes of pixels from shadows or beards.
Three major steps are used to identify the face region. The input to the �rst step isa labeled image using the labels 1, 2,...,7 which result from classi�cation according to thetraining data (label 7 is used for a pixel that is not in any of the other six classes). Themiddle images of Figure 6.13 show labeled images for two di�erent faces: most of the facepixels are correctly labeled as are most of the background pixels; however, there are manysmall areas of error. Components are aggregated and then merged or deleted accordingto their size and location relative to the major face region. First, connected componentprocessing is done as described in Chapter 3 with only pixels labeled 4, 5, or 6 as foregroundpixels. The second step selects as the face object the largest suitable component. Thisstep also discards components that are too small or too big using heuristics learned fromprocessing many examples. Typically, less than 100 components remain, the majority ofwhich are in the shadow classes. The third step discards remaining components or mergesthem with the selected face object. Several heuristics using knowledge of the human faceare applied; also, it is assumed that there is only one face in the scene. Example results areshown at the right in Figure 6.13. The program is fast enough to do these computationsroughly 30 times per second (real-time), including computing the locations of the eyes andnose, which has not been described. This example generalizes to many other problems. A

Shapiro and Stockman 17
Figure 6.13: Face extraction examples: (left) input image, (middle) labeled image, (right)boundaries of the extracted face region. (Images from V. Bakic.)
key stage is the clustering of the thousands of color codes in the original image to obtainthe labeled image with only a few labels. In the face extraction example, clusters weredecided \by hand", but sometimes automatic clustering is done. Segmentation is coveredthoroughly in Chapter 10.
6.6 Shading
There are several complicating factors in both the physics of lighting and human percep-tion. Surfaces vary in specularity, that is, how much they act like a mirror. Highly specularsurfaces re ect a ray of incident energy in a restricted cone about a ray of re ection. Matte
surfaces re ect energy equally in all directions. Thus, a surface not only has a wavelengthdependent bias in re ecting incident radiation, but it also has directional bias. Moreover,
the energy or intensity of radiation depends upon distance { surface elements farther from apoint source of white light will receive less energy than closer surface elements. The e�ect issimilar between the radiating object and the sensor elements. As a result, image intensitieswill be nonuniform due to the nonuniform distances along the imaging rays. The orientation� of the surface element relative to the source is also very important.
6.6.1 Radiation from One Light Source
Consider radiation from a single distant light source reaching an object surface as shown inFigure 6.14. Currently, there is no view position from which we observe the surface; we areonly considering how the surface is irradiated by the light source. We assume that the lightsource is far enough away so that the direction from all surface elements of the illuminatedobject to the light source can be represented by a single unit length direction vector s. Thelight energy per unit area (intensity i) that reaches each surface element Aj is proportionalto the area of the surface element times the cosine of the angle that the surface element

18 Computer Vision: Mar 2000
S
LightSource
ObjectSurface
3
A1
A2
A
C
C
1
2
C3
n3
n2
n1
s
Figure 6.14: Object surface elements Aj irradiated by light source S receive energy propor-tional to the cross section Cj = Aj cos�j presented to the source. Intensity of receivedradiation is thus i � n � s where n is the unit normal to the surface and s is the unitdirection toward the source. �j is the angle between the surface normal nj and s.
makes with the illumination direction s. The cosine of the angle is n� s, where n is the unitvector normal to the surface element Aj . Thus our mathematical model for the intensity ofradiation received by a surface element is
received i � n � s: (6.5)
The radiation received is directly proportional to the power of the light source, whichmay or may not be known. The light source may radiate energy in all directions, or may belike a spotlight radiating light only in a small cone of directions. In either case, the powerof the light source is expressed in watts per steradian, or energy per unit area of a conicalsector of a unit sphere centered at the source. This simple model for irradiating surfaceelements extends readily to curved surfaces by considering that the rectangular surface ele-ments become in�nitesimally small in the limit. The fraction of the incident radiation thata surface element re ects is called its albedo.
2 Definition The albedo of a surface element is the ratio of the total re ected illumination
to the total received illumination.
We have assumed that albedo is an intrinsic property of the surface: for some surfacesthis is not the case because the fraction of illumination re ected will vary with the directionof lighting relative to the surface normal.
6.6.2 Di�use Re ection
We now extend our model to consider the re ection from object surfaces; moreover, wemodel how the surface element appears from some viewing position V. Figure 6.15 showsdi�use or Lambertian re ection. Light energy reaching a surface element is re ected evenly

Shapiro and Stockman 19
A
A
A
1
2
3
S .
V2..1V
LightSource
View Positions
DiffuseReflectingObjectSurfaces
Figure 6.15: Di�use, or Lambertian, re ection distributes energy uniformly in all directionsof the hemisphere centered at a surface element. Thus an entire planar patch will appearto be of uniform brightness for all viewpoints from which that surface is visible.
in all directions of the hemisphere centered at that surface element. Di�use re ections oc-cur from surfaces that are rough relative to the wavelength of the light. The intensity ofthe re ected illumination is proportional to the intensity of the received illumination: theconstant factor is the albedo of the surface, which is low for dark surfaces and high for lightsurfaces.
di�use re ected i � nj � s (6.6)
3 Definition A di�use re ecting surface re ects light uniformly in all directions. As a
result, it appears to have the same brightness from all viewpoints.
The critical characteristic is that the surface element will have the same brightness whenviewed from the entire hemisphere of directions, because its brightness is independent ofthe viewer location. From Figure 6.15, surface element A1 will have the same brightnesswhen viewed from positions V1 or V2; similarly, surface A2 will also appear to be of the samebrightness when viewed from either V1 or V2. If all three surface elements are made of thesame material, they have the same albedo and thus A2 will appear brighter than A1, whichwill appear brighter than A3, due to the angles that these surfaces make with the directionof the illumination. Surface element A3 will not be seen at all from either position V1 or V2.(A surface element will not be visible if n�v < 0 where v is the direction toward the viewer.)
A convincing example of di�use re ection is given in Figure 6.16, which shows intensityof light re ected o� an egg and a blank ceramic vase. Intensities from a row of the imageare much like a cosine curve, which demonstrates that the shape of the object surface isclosely related to the re ected light as predicted by Equation 6.6.
Exercise 14
Consider a polyhedral object of di�usely re ective material such that face F directly facesa distant light source S. Another face A adjacent to F appears to be half as bright as F.What is the angle made between the normals of faces A and F?

20 Computer Vision: Mar 2000
0
50
100
150
200
250
0 50 100 150 200 250
’egg-vaseR100’
Figure 6.16: Di�use re ection from Lambertian objects | a vase and an egg | and a plotof intensities across the highlighted row. The intensities are closely related to the objectshape.
6.6.3 Specular re ection
Many smooth surfaces behave much like a mirror, re ecting most of the received illumina-tion along the ray of re ection as shown in Figure 6.17. The ray of re ection(R) is coplanarwith the normal(N) to the surface and the ray of received illumination(S), and, makes equalangles with them. A perfect mirror will re ect all of the light energy received from sourceS along ray R. Moreover, the re ected energy will have the same wavelength compositionas the received light regardless of the actual color of the object surface. Thus a red applewill have a white highlight, or twinkle, where it re ects a white light source. Equation 6.7gives a mathematical model of specular re ection commonly used in computer graphics.Equation 6.8 de�nes how to compute the re ected ray R from the surface normal and thedirection toward the source. The parameter � is called the shininess of the surface and hasa value of 100 or more for very shiny surfaces. Note that as � increases, cos�� decreasesmore sharply as � moves away from 0.
specular re ected i � (R �V)� (6.7)
R = 2N(N � (�S)) � S (6.8)
4 Definition Specular re ection is mirrorlike re ection. Light re ected o� the surface
is radiated out in a tight cone about to the ray of re ection. Moreover, the wavelength
composition of the re ected light is similar to that of the source and independent of the
surface color.
5 Definition A highlight on an object is a bright spot caused by the specular re ection
of a light source. Highlights indicate that the object is waxey, metalic, or glassy, etc.
Shapiro and Stockman 21
S
SpecularSurface
Viewer
Source
∆
∆ A
A
2
1
V.
. φ φ
S
n
R
V
Pn
n
R2
R1
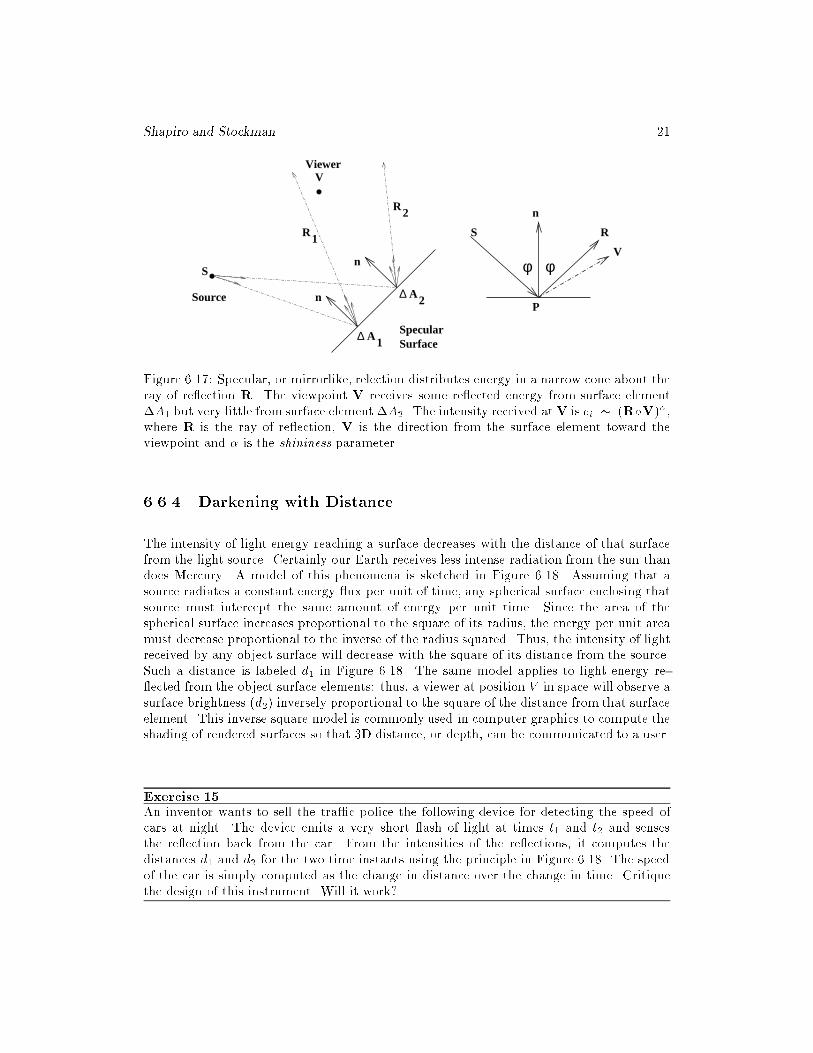
Figure 6.17: Specular, or mirrorlike, relection distributes energy in a narrow cone about theray of re ection R. The viewpoint V receives some re ected energy from surface element�A1 but very little from surface element �A2. The intensity received atV is ei � (R�V)�,where R is the ray of re ection, V is the direction from the surface element toward theviewpoint and � is the shininess parameter.
6.6.4 Darkening with Distance
The intensity of light energy reaching a surface decreases with the distance of that surfacefrom the light source. Certainly our Earth receives less intense radiation from the sun thandoes Mercury. A model of this phenomena is sketched in Figure 6.18. Assuming that asource radiates a constant energy ux per unit of time, any spherical surface enclosing thatsource must intercept the same amount of energy per unit time. Since the area of thespherical surface increases proportional to the square of its radius, the energy per unit areamust decrease proportional to the inverse of the radius squared. Thus, the intensity of lightreceived by any object surface will decrease with the square of its distance from the source.Such a distance is labeled d1 in Figure 6.18. The same model applies to light energy re- ected from the object surface elements: thus, a viewer at position V in space will observe asurface brightness (d2) inversely proportional to the square of the distance from that surfaceelement. This inverse square model is commonly used in computer graphics to compute theshading of rendered surfaces so that 3D distance, or depth, can be communicated to a user.
Exercise 15
An inventor wants to sell the tra�c police the following device for detecting the speed ofcars at night. The device emits a very short ash of light at times t1 and t2 and sensesthe re ection back from the car. From the intensities of the re ections, it computes thedistances d1 and d2 for the two time instants using the principle in Figure 6.18. The speedof the car is simply computed as the change in distance over the change in time. Critiquethe design of this instrument. Will it work?

22 Computer Vision: Mar 2000
∆ A
V
d
d
1
2
r2
S
1r
r3
Figure 6.18: The total energy radiating from a point source through any enclosing sphericalsurface is the same: thus the energy per unit area of surface, or intensity, must decreaseinversely with the square of the radius of the enclosing sphere (d1). Similarly, light energyre ecting o� a surface element must descrease in intensity with the distance (d2) from whichthat surface is viewed.
6.6.5 Complications
For most surfaces, a good re ection model must combine both di�use and specular re ec-tions. If we view an apple with a ashlight, we will actually see a reddish object with awhitish highlight on it: the reddish re ections are from di�use re ection, while the highlightis from specular re ection. Were the apple entirely specular, then we wouldn't be able toobserve most of its surface.
Often there are many light sources illuminating a scene and many more surface elementsre ecting light from these sources. We might not be able to account for all the exchangesof energy, except by saying that there is ambient light in the scene. In computer graphics,it is common to use an ambient light factor when shading a surface.
6 Definition Ambient light is steady state light energy everywhere in the scene resulting
from multiple light sources and the interre ections o� many surfaces.
Some surfaces actually emit light. These might be light bulbs or perhaps an objectthat absorbs one kind of energy and then emits it in the visible band. Such objects willre ect light as well as emit it. Finally, all of our emitting or re ecting phenomena are wave-length dependent. A source emits an entire spectrum of di�erent wavelengths (unless it is amonchromatic laser) and a surface re ects or absorbs energy in some wavelengths more thanothers. Machines can be built to be sensitive to these wavelength phenomena; for example,multispectral scanners can produce 200 values for re ection from a single surface element.For humans, however, we can summarize a sample of visible light using a combination ofonly three values, such as RGB or HSI. Computer graphics commonly describes both illu-mination and surface re ection in terms of only RGB components.

Shapiro and Stockman 23
Exercise 16
An amateur photographer took a photo of friends at the rim of the Grand Canyon just aftersunset. Although a ash was used and the images of the friends were good, the beautifulcanyon wall background was almost black. Why?
6.6.6 * Phong Model of Shading
A popular shading model used in computer graphics is the Phong shading model, whichaccounts for several phenomena; (a) ambient light, (b) di�use re ection, (c) specular re ec-tion, and (d) darkening with distance. Components (b),(c), and (d) are summed for eachseparate light source. We assume that we know the details of the surface element imagingat image point I[x; y] and the position and characteristics of all light sources. The re ectiveproperties of this surface element are represented by Kd� for di�use re ectivity and Ks�
for specular re ectivity, where Kq� is a vector of coe�cients of re ection for di�erent wave-lengths � | usually three of them for RGB.
I�[x; y] = Ia�Kd� +
MX
m=1
(1
cd2mIm�[Kd�(n � s) + Ks�(Rm �V)�]) (6.9)
Equation 6.9 uses ambient illumination Ia� and a set of M light sources Im�. The equa-tion can be thought of as a vector equation treating each wavelength � similarly. Ia� is theintensity of ambient light for wavelength �, Im� is the intensity of the light source m forwavelength �. The m� th light source is a distance dm from the surface element and makesre ection ray Rm o� the surface element.
6.6.7 Human Perception using Shading
There is no doubt that human perception of three-dimensional object shape is related toperceived surface shading. Moreover, the phenomena described account for shading thatwe perceive, although the above models of illumination and re ection are simpli�ed. Thesimpli�edmodels are of central importance in computer graphics and various approximationsare used in order to speed up rendering of lit surfaces. In controlled environments, computervision systems can even compute surface shape from shading using the above formulas: thesemethods are discussed in Chapter 13. We could, for example, compute surface normals forthe surface points shown in Figure 6.16 by calibrating our formulas. In uncontrolled scenes,such as outdoor scenes, it is much more di�cult to account for the di�erent phenomena.
6.7 * Related Topics
6.7.1 Applications
Color features make some pattern recognition problems much simpler compared to whenonly intensity, texture, or shape information are available. Color measurements are local;aggregation methods and shape analysis may not be needed. For example, as indicatedin Exercise 13, pixel level color information goes a long way in classi�cation of fruits andvegetables for automatic charging at the grocery store or for quality sorting in a distributioncenter. A second example is the creation of a �lter to remove pornographic images from the

24 Computer Vision: Mar 2000
WWW. The face detection algorithm as described above �rst detects skin color accordingto the training data: regions of skin pixels can then be aggregated and geometric relationsbetween skin regions computed. If it is probable that bare body parts �ll a signi�cant part ofthe image, then that image could be blocked. Color is useful for access to image databases,as described in Chapter 8, and for understanding of biological images taken through a mi-croscope.
6.7.2 Human Color Perception
Characteristics of human color perception are important for two reasons; �rst, the humanvisual system is often an e�cient system to study and emulate, secondly, the main goal ofgraphic and image displays is to communicate with humans. The machine vision engineeroften wants to learn how to duplicate or replace human capabilities, while the graphic artistmust learn how to optimize communication with humans.
Humans in general have biased interpretations of colors. For example, wall colors aregenerally unsaturated pastels and not saturated colors; reds tend to stimulate, while bluestend to relax. Perhaps 8% of humans have some kind of color blindness, meaning that colorcombinations should be chosen carefully for communication. In the human retina, red andgreen sensitve receptors greatly outnumber blue receptors; this is accentuated in the highresolution fovea where blue receptors are rare. As a result, much color processing occursin neurons that integrate input from the receptors. Various theories have been proposedto explain color processing in terms of processing by neurons. This higher level processingis not fully understood and human visual processing is constantly under study. The colorof single pixels of a display cannot be accurately perceived, but humans can make goodjudgements about the color of an extended surface even under variations of illumination,including illumination by only two principal wavelengths. Often, separate edge-based pro-cessing of intensity (Chapter 5) that is faster than color processing yields object recognitionbefore color processing is complete. Theories usually address how human color processingmight have evolved on top of more primitive intensity processing. The reader can pursuethe vast area of human visual perception by referring to the references and following otherreferences given there.
6.7.3 Multispectral Images
As discussed in Chapter 2, a sensor that obtains 3 color measurements per pixel is a mul-tispectral sensor. However, sensing can be done in bands of the electromagnetic spectrumthat are not perceived as color by humans; for example, in infrared bands of the spectrum.In IR bands of a satellite image, hot asphalt roads should appear bright and cold bodies ofwater should appear dark. Having multiple measurements at a single pixel is often useful forclassifying the surface imaged there using simple procedures. The scanning system can beexpensive, since it must be carefully designed in order to insure that the several frequencybands of radiation are indeed collected from the same surface element. The parameters ofMRI scanning (refer to Chapter 2) can be changed to get multiple 3D images, e�ectivelyyielding m intensities for each voxel of the volume scanned. These n measurements can beused to determine whether the voxel material is fat, blood, muscle tissue, etc. The reader

Shapiro and Stockman 25
might be alarmed to learn that it can take a full hour to obtain a 3D volume of MRI data,implying that some noise due to motion will be observed, particularly near the boundariesbetween di�erent tissues where the material element sampled is most likely to change duringthe scanning process due to small motions caused by circulation or respiration.
6.7.4 Thematic Images
Thematic images use pseudo color to encode material properties or use of space representedin an image. For example, pixels of a map or satellite image might be labeled for humanconsumption so that rivers are blue, urban areas are purple and roads are red. These are notthe natural colors recorded by sensors but communicate image content well in our culture.Weather maps might show a temperature theme with red for hot and blue for cold. Similarly,thematic images can encode surface depth, local surface orientation or geometry, texture,density of some feature or any other scalar measurement or nominal classi�cation. The twocenter images in Figure 6.13 are thematic images: the yellow, blue and purple colors are justlabels for three clusters in the real color space. It is important to remember that thematicimages do not show actual physical sensor data but rather transduced or classi�ed data forbetter visualization by a human.
6.8 References
For a detailed treatment of light and optics, one can consult the text by Hecht and Zajac(1974). Some of the treatment of practical digital encoding of color was derived fromMurrayand VanRiper (1994): the reader can consult that book for many details on the many�le formats used to store digital images. Details of the design of color display hardware,especially the shadow-mask technology for color displays, can be found in the graphics textby Foley et al (1996). The book by Levine (1985) contains the discussion of several di�erentbiological vision systems and their characteristics as devices. More detail is given in the bookby Overington (1992), which takes a technical signal processing approach. Livingston (1988)is a good start in the psychology literature. The discussion of matching color histogramswas drawn from Swain and Ballard (1991) and Jain and Vailaya (1996). More details onthe face extraction work can be found in a technical report by Bakic and Stockman (1999).Work on multispectral analysis of the brain using MRI can be found in the paper by Taxtand Lundervold (1994).
1. V. Bakic and G. Stockman (1999), Menu Selection by Facial Aspect, Proceedings ofVision Interface '99, Trois Rivieres, Quebec, Canada (19-21 May 99)
2. M. Fleck, D. Forsyth and C. Pregler (1966) Finding Naked People, Proceedings of theEuropean Conference on Computer Vision, Springer-Verlag, 593-602.
3. J. Foley, A. van Dam, S. Feiner and J. Hughes (1996) Computer Graphics: Prin-
ciples and Practice, 2nd Ed in C, Addison-Wesley.
4. E. Hecht and A. Zajac (1974) Optics, Addison-Wesley.
5. A. Jain and A. Vailaya (1996) Image retrieval using color and shape, Pattern Recog-nition, Vol 29, No. 8, 1233-1244.

26 Computer Vision: Mar 2000
6. M. Levine (1985) Vision in Man and Machine, McGraw-Hill.
7. M. Livingstone, (1988) Art, Illusion and the Visual system, Scienti�c American, Jan.1988, 78-85.
8. J. Murray and W. VanRyper (1994) Encyclopedia of Graphical File Formats,O'Reilly and Associates, Sebastopol, CA.
9. I. Overington (1992) Computer Vision: A uni�ed, biologically-inspired ap-
proach, Elsevier, Amsterdam.
10. M. Swain and D. Ballard (1991) Color Indexing, International Journal of Computervision, Vol. 7, No. 1, 11-32.
11. T.Taxt and A. Lundervold (1994)Multispectral Analysis of the Brain in Magnetic Res-
onance Imaging, in Proceedings of the IEEE Workshop on Biomedical Image Analysis,Seattle,WA (24-25 June 1994) 33-42.