2 anthropometry - world banksiteresources.worldbank.org/nutrition/resources/tool2...3 2...
TRANSCRIPT

3
2 Anthropometry
Introduction
Anthropometry—the study and technique of human body measurement—is the most commonly used method for the assessment of two of the mostwidespread nutrition problems in the world: (1) protein-energy malnutri-tion, especially in young children and pregnant women; and (2) obesity,or overweight, in all age-groups (Jelliffe and Jelliffe, 1989). Measure-ments of weight, height (or length) and, less frequently, subcutaneous fatand muscle, are the usual data collected. This chapter covers the basicindices—low birth weight, height-for-age, weight-for-height, weight-for-age, mid-upper arm circumference, body mass index—derived fromanthropometric measurements related to body size and composition, aswell as standard cut-offs for indicators, and their application to decision-making at individual and population levels.
At the individual level, anthropometry is used to assess compromisedhealth or nutrition well being, need for special services, or response to anintervention. A one-time assessment is used during emergency situationsto screen for individuals requiring immediate intervention. Under non-emergency conditions, single assessments are used to screen for entryinto health or nutrition intervention programs either as an individual or asa marker for a household or community at risk.
Trend assessments for individuals, such as periodic monitoring of weightgain in children three years and younger, are used to detect growth prob-lems, to intervene early enough to prevent growth failure, or to assess anindividual’s response to some type of intervention.
At the population level, anthropometric data from a single assessmentprovide a snapshot of current nutrition status within a community, andshould help to identify groups at risk of poor functional outcomes in termsof morbidity and mortality (Gorstein, et al., 1994). Under emergency con-ditions, these static measurements are used to identify priority areas forassistance. In non-emergency situations, one-time anthropometricassessments are used for geographic targeting and as the basis for
chap2.p65 8/20/2004, 3:19 PM3

4
resource allocation decisions. Repeat survey results allow analysis oftrends, with anthropometric data possibly serving as concurrent indica-tors of impending food shortages in the context of an early warning sys-tem, as indication of service delivery problems or successes, and as anindicator of population-based response to interventions.
Advantages
Anthropometric measurements are: (1) non-invasive and relatively eco-nomical to obtain; (2) objective; and (3) comprehensible to communitiesat large. They produce data that can be graded numerically, used tocompile international reference standards, and compared across popula-tions. They can also supply information on malnutrition to families andhealth care workers prior to the onset of severe growth failure (or exces-sive weight gain).
Disadvantages
The disadvantages of anthropometry lie in: (1) the significant potential formeasurement inaccuracies; (2) the need for precise age data in youngchildren for construction of most indices; (3) limited diagnostic relevance;and (4) debate over selection of appropriate reference data and cut-offpoints to determine conditions of abnormality (adapted from Jelliffe andJelliffe, 1989).
Selecting indicators and cut-off points
Task managers are frequently faced with decisions about which anthro-pometric data should be collected and which indices constructed for aparticular purpose. They can be used as a proxy for household poverty,to describe the overall picture of nutrition in a region or country, to deter-mine target areas for delivery of nutrition/health interventions, to monitorproject progress or to evaluate project impact (see Box 2-1). While everycontext warrants individual consideration of the range of anthropometricindicators and an evaluation of logistical constraints and the specific
chap2.p65 8/20/2004, 3:19 PM4

5
objectives of the exercise, some indicators are used frequently. For ex-ample, –2Z weight-for-age is the most common index of childhood mal-nutrition for children under 3 years. (See Annex A for a related discussionof indicator sensitivity and specificity and for an explanation of Z scores.)
It is important to note that each index delivers unique information—inchildren, weight-for-height does not substitute for height-for-age orweight-for-age, as each reflects a particular combination of biologicalprocesses. Guidance on the range of uses for each indicator and targetgroup is included in the text beginning on page 13. Refer to Annex A forsummary recommendations on survey design issues for various policy-making and program management purposes.
Box 2-1: Potential Objectives for Useof Anthropometric Indicators
• Identification of individuals or populations at risk—indicatorsmust reflect past or present risk, or predict future risk.
• Selection of individuals or populations for an intervention—indicators need to predict the benefit to be derived from theintervention.
• Evaluation of the effects of changing nutritional, health, or socio-economic influences, including interventions—indicators need toreflect response to past and present interventions.
• Excluding individuals from high-risk treatments, from employ-ment, or from certain benefits—indicators predict a lack of risk.
(WHO Expert Committee, 1995)
chap2.p65 8/20/2004, 3:19 PM5
6
Measurement issues
Weight (in grams or kilograms)
Various types of scales are available to measure the weight of a child,including spring scales (Salter) or beam balance scales. Hanging scalesare commonly used in many countries because they can be transportedeasily, can be used in almost any setting (particularly where a flat surfaceis not available) and are relatively inexpensive. Direct recording scaleshave been developed by Teaching Aids at Low Cost (TALC)1 where agrowth chart is inserted into the scale and a pointer indicates the spot onthe chart. A family member can mark the chart, which encourages par-ticipation in the growth promotion activity. Balance beam scales are com-monly used in health centers, as they need to be positioned on a flatsurface for accurate measurement and are not easily transported.
Standing beam scales are used to measure weight of adults, particularlyin health centers. UNICEF’s UNISCALE is a new nonbeam or digital scalethat allows for the calculation of both adult and infant weight. An adult’sweight is measured, then the adult accepts an infant in her/his arms onthe scale and the additional weight is automatically calculated. Standingscales (both beam and digital) must be placed on a flat horizontal sur-face. Weight is usually measured to the nearest 100 grams (see Table 2-1for available measurement tools).2
1. TALC can be contacted at PO Box 49, St. Albans, Herts, UK, AL14AX. Telephone(44 1) 727 853869, Fax (44 1) 727 846852. Information on low cost educational materi-als, books, slide sets, and newsletters is available at www.talcuk.org.2. Weighing scales can be procured through UNICEF’s supply services inCopenhagen. Contact the Customer Service Officer at telephone: (45) 35.27.35.27,Fax: (45) 35.26.94.21, email: [email protected] or [email protected], or on the web atwww.supply.unicef.dk/. UNICEF-New York telephone: 212-366-7000; fax: 212-887-7465.
chap2.p65 8/20/2004, 3:19 PM6
7
Anthropometric Assessment Tools
Height/Length (in centimeters)
Height is measured as recumbent length for the first two years of life.After the age of two, a child’s stature can be measured in the standingposition. Measurement of length requires a “Shorr-Board” or locally pro-duced length board (specifications for constructing such a board areavailable from UNICEF, CDC and others and can be constructed easily).To measure height, a fixed, non-stretchable tape measure marked by 0.5centimeter intervals (to the millimeter is desirable), a carpenter’s triangleor substitute to ensure the child’s head is at a right angle to the wall, astraight wall and an even floor surface are necessary to collect accurateheight measurements (see Table 2-1 for available measurement tools).
Arm Circumference (in centimeters)
Special tape measures (Shakir strip or insertion tape) have been devel-oped to measure arm circumference. A non-stretchable centimeter tapeor finger and thumb measurement (for children) can also be used. Mea-suring tapes will be cut and marked differently depending upon thepopulation (children or women) being measured. With the arm hangingrelaxed, the circumference at the midpoint between the shoulder andelbow is measured to the nearest 0.1 cm or the color (e.g., red indicatessevere wasting, yellow is moderate, and green signals adequate nutritionstatus) on the tape noted. See Figures 2-1 and 2-2, for more detailedinformation on measuring arm circumference.
Accuracy of these measurements is influenced by the type and conditionof the equipment and the qualifications and training of the individualtaking the measurements. The equipment should be routinely calibratedby regularly measuring something of known weight or height. Measure-ments are recorded in a health card, on a growth chart, or in anotherreporting system. Detailed instructions for taking weight, height and arm
chap2.p65 8/20/2004, 3:19 PM7

8
Tabl
e 2-
1:C
omp
aris
on o
f D
iffe
ren
t Typ
es o
f M
easu
rin
g To
ols
Acc
ura
cy/
Ad
van
tage
s an
dM
easu
rin
g To
olU
seS
ourc
eS
tan
dar
diz
atio
n D
isad
van
tage
sC
ost
Mid
-Arm
Cir
cum
-M
easu
res
the
circ
um-
UN
ICE
Fa , and
TA
LC
b :Su
bjec
t to
obse
rver
Con
veni
ent,
but
UN
ICE
F: P
ack
fere
nce
Tape
fere
nce
of th
e up
per
Tape
s as
wel
l as
erro
r, m
ay p
ull
not o
f muc
h us
eof
50
for
$ 4.
25.
(MU
AC
)ar
m to
ass
ess
curr
ent
inst
ruct
ions
for
tape
too
tigh
tin
mea
suri
ng a
rmTA
LC: $
0.2
5–nu
trit
iona
l sta
tus
mak
ing
and
usi
ngci
rcum
fere
nce
in0.
40 e
ach
thes
e av
aila
ble
child
ren
und
er th
eag
e of
one
. Exa
ctag
e of
chi
ld is
re-
quir
ed to
inte
rpre
tre
sult
s.
Sing
le B
eam
Use
d to
mea
sure
CM
Sc Wei
ghin
gA
ccur
ate
and
can
Stur
dy,
eas
y re
ad-
CM
S:‘c
linic
’ sc
ales
wei
ghts
of c
hild
ren
Equ
ipm
ent
(UK
),be
sta
ndar
diz
edab
ility
, can
be
tare
d,
$150
–300
UN
ICE
Fabu
t hea
vy a
nd n
otU
NIC
EF:
$85
.52
easi
ly p
orta
ble
Sing
le B
eam
—U
sed
to m
easu
reU
NIC
EFa , l
ocal
Acc
urat
e an
d c
anIs
eas
y to
use
, bu
t$1
5–25
free
han
ging
sca
les
wei
ght o
f chi
ldre
nm
anuf
actu
rers
be s
tand
ard
ized
slow
. Dur
able
, goo
dre
adab
ility
, but
may
not b
e ve
ry p
orta
ble.
Dia
l Spr
ing
Scal
esU
sed
to m
easu
reC
MS
(UK
)cA
ccur
ate
and
can
Stur
dy,
dur
able
, and
$35–
60w
eigh
ts o
f ver
ybe
sta
ndar
diz
edal
so p
orta
ble.
Can
be
youn
g ch
ildre
nd
iffi
cult
to r
ead
wit
han
d o
lder
chi
ldre
na
swin
ging
nee
dle
.
Ele
ctro
nic
Scal
eM
easu
res
wei
ght
UN
ICE
FaA
ccur
ate
and
Ver
y ea
sy to
use
. Can
$90
(UN
Isca
le)
of c
hild
ren
and
ad
ults
stan
dar
diz
edbe
tare
d to
mot
her’
sw
eigh
t to
mea
sure
wei
ght o
f inf
ants
.St
urd
y, d
urab
le a
ndpo
rtab
le. S
cale
nee
ds
chap2.p65 8/20/2004, 3:19 PM8

9to
be
repl
aced
whe
nba
tter
ies
are
exha
uste
d(1
0 ye
ar li
fe s
pan)
TAL
C D
irec
tM
easu
res
grow
th o
fTA
LC
bV
ery
accu
rate
and
Stur
dy,
and
hig
hly
$25
Rec
ord
ing
Scal
ech
ildre
n by
dir
ectl
yea
sily
sta
ndar
diz
able
dur
able
, eas
y to
und
er-
reco
rdin
g w
eigh
t on
stan
d (e
ven
by n
on-
a ch
ild’s
gro
wth
cha
rtlit
erat
e po
pula
tion
s).
Len
gth/
heig
htU
sed
to m
easu
reC
an b
e lo
cally
Shou
ld b
e ac
cura
teA
re s
turd
y an
dPr
ice
vari
es b
e-bo
ard
sre
cum
bent
leng
th in
man
ufac
ture
d (
in-
and
eas
y to
dur
able
, wit
h go
odtw
een
loca
llych
ildre
n un
der
the
age
stru
ctio
ns a
vaila
ble
stan
dar
diz
ere
adab
ility
. Acc
urat
em
anuf
actu
red
of 2
, and
sta
ndin
gfr
om C
DC
d a
ndm
easu
ring
may
or p
urch
ased
,he
ight
of o
lder
chi
ldre
nTA
LC
)b , and
UN
ICE
Fare
quir
e tw
o pe
ople
$10–
285
UN
ICEF
: $35
0
Wei
ght/
heig
htU
sed
to d
isti
ngui
shTA
LC
b , and
UN
ICE
FaA
ccur
acy
dep
end
sN
eed
s tw
o pe
ople
for
TALC
: $2–
7.50
,C
hart
(Thi
nnes
sbe
twee
n st
unti
ngon
the
accu
racy
for
accu
rate
mea
sur-
UN
ICE
F: N
AM
easu
re)
and
acu
te m
alnu
trit
ion.
of h
eigh
t and
wei
ght
ing.
Sub
ject
to te
arin
g.C
olor
-cod
ed to
iden
tify
mea
sure
s ta
ken
Goo
d r
ead
abili
ty a
ndnu
trit
iona
l sta
tus
from
oth
er s
ourc
espo
rtab
ility
(Sca
le, b
oard
)
Hei
ght M
easu
ring
Mea
sure
s he
ight
of
UN
ICE
FaA
ccur
ate,
and
Nee
ds
to b
e m
ount
ed$N
AIn
stru
men
t c
hild
ren
and
ad
ults
stan
dar
diz
able
on th
e w
all,
not p
ort-
able
, but
eas
y to
use
.M
easu
res
heig
ht u
pto
2 m
a. U
NIC
EF
Sup
ply
Div
isio
n, U
NIC
EF
Pla
ds,
Fre
epor
t; D
K-2
100,
Cop
enha
gen
, Den
mar
k. T
el: (
45) 3
5-27
-35-
27; f
ax (4
5) 3
5-26
-94-
21; e
-mai
l: su
pp
ly@
unic
ef.o
rg;
web
site
: ww
w.s
upp
ly.u
nice
f.dk;
or c
onta
ct U
NIC
EF
field
offi
ce: w
ww
.uni
cef.o
rg/u
ww
ide/
fo.h
tm.
b. T
each
ing
Aid
s at
Low
Cos
t (TA
LC),
PO
Box
49,
St A
lban
s, H
erts
AL1
4AX
, Eng
land
; Tel
: (44
) 017
27-8
5386
9; fa
x: (4
4) 0
1727
-846
852;
web
site
: ww
w.ta
lcuk
.org
. Pay
men
tsfro
m o
vers
eas
mus
t be
mad
e b
y 1)
Inte
rnat
iona
l mon
ey o
rder
, Nat
iona
l Giro
or U
K p
osta
l ord
er; 2
) Ste
rling
che
que
dra
wn
on U
K b
ank;
3) E
uroc
heq
ue m
ade
out i
n S
terli
ng;
4) U
S d
olla
r che
ck d
raw
n on
US
ban
k us
ing
cor
rect
rate
of e
xcha
nge;
or 5
) UN
ES
CO
cou
pon
s.c.
CM
S (U
K) W
eig
hing
Eq
uip
men
t Ltd
., 18
Cam
den
Hig
h S
treet
, Lon
don
NW
I OJH
, U.K
.; Te
l: (4
4) 0
1 38
7-20
60 o
r (44
) 020
738
3-70
30.
d. C
ente
r for
Hea
lth P
rom
otio
n an
d E
duc
atio
n of
the
Cen
ters
fo D
isea
se C
ontro
l and
Pre
vent
ion,
160
0 C
lifto
n R
d.,
NE
, Atla
nta,
GA
303
33; w
ebsi
te: w
ww
.cd
c.g
ov.
(Ad
apte
d fr
om G
riffit
hs, 1
985)
chap2.p65 8/20/2004, 3:19 PM9

10
circumference measures are provided in several other resource manuals:UNICEF: Growth Monitoring, 1986; FAO Supplementary Feeding Pro-grams, 1990; and I. Shorr, How to Weigh and Measure Children, 1986and in Annex 2 of the WHO Expert Committee Report (1995) PhysicalStatus: The Use and Interpretation of Anthropometry.
Age (in months)
Age is often the most difficult measurement to obtain. The first step is toexamine reliable birth records if available for the child. If this source isnot available, it will be necessary to estimate birth date and age. It isimportant to know the traditional calendar if age is to be imputed fromtalking with the mother. An example of a local calendar is provided inFigure 2-3. Using the triangulation method (asking information in several
Figure 2-1: Measuring Arm Circumferencewith a Tape Measure
Source: Savage-King & Burgess, 1993.
chap2.p65 8/20/2004, 3:19 PM10

11
different ways) to confirm the birth date/age of the child will improve theaccuracy of the measurement. For example, after estimating the age of achild with a local calendar compare dental eruption, height, and motordevelopment with a separately assessed child of similar age (Jelliffe andJelliffe, 1989).
International references
The current international reference, adopted by the World Health Organi-zation, uses data from the US National Center for Health Statistics (NCHS)
Figure 2-2: Measuring Arm Circumferencewith a Shakir Strip
Midpoint between tip ofshoulder and elbow
Straight arm
Source: Savage-King & Burgess, 1993.
chap2.p65 8/20/2004, 3:19 PM11

12
Figu
re 2
-3:
Sea
son
al C
alen
dar
of
a C
omm
un
ity
in T
he
Ph
ilip
pin
es
(FA
O, 1
993b
)
chap2.p65 8/20/2004, 3:19 PM12
13
as a benchmark of growth in infants and children. The NCHS compiledthe weights and heights of thousands of healthy children with referencedata derived from several sources. Information on infants from birth to 36months of age was collected between 1960–75 using a population ofmiddle-class, white, bottle-fed Americans. Data for children ages 2–18years are from the Health Examinations Survey and the National Healthand Nutrition Examination Survey (NHANES), and are representative of allsocioeconomic, ethnic, and geographical groups.
There is continuing debate about the appropriateness of these refer-ences for children in developing countries. The NCHS reference is com-posed of several different sample populations and as a result, the curvesare disjointed at 24 months. The majority of the study population wasbottle/formula fed, reflecting inadequately, the growth patterns ofbreastfed infants.3 In addition, measurements were taken at three rather
3. In 1995, the WHO Working Group on Infant Growth concluded that to adequatelyreflect growth patterns consistent with WHO feeding recommendations (i.e., exclusivebreastfeeding through 6 months, with continued breastfeeding combined with ad-equate complementary foods through two years), new growth curves based on refer-ence data from exclusively breastfed infants from a variety of countries/regions shouldbe developed. A consistent, distinct pattern of growth for infants breastfed for at least12 months emerged from an analysis of multiple, geographically diverse growth studiesby the Working Group. Typically, breastfed infants grew as or more rapidly than theNCHS-WHO reference for 2 to 3 months, but showed a relative deceleration, particu-larly in weight, from 3 to 12 months. Mean head circumference on the other hand, wasabove the NCHS-WHO median throughout the first year. In the studies that wentthrough the second year, there was a reversal of the trend, with weight-for-age, length-for-age, and weight-for-length returning toward the current NCHS-WHO referencemeans between 12 and 24 months of age. In the absence of a revision of the currentreference growth curves, health workers can easily misdiagnose thriving breastfedbabies as growth faltering, and wrongly counsel mothers to introduce solids andbreastmilk substitutes unnecessarily early on. In many environments, the risk of mor-bidity and mortality due to contaminated feeding utensils and foods is high (Dewey,et al., 1995 and WHO Working Group on Infant Growth, 1995). The new growth curvesare anticipated in late 2004 or early 2005.
chap2.p65 8/20/2004, 3:19 PM13

14
than one month intervals, which is less than ideal for characterizing theshape of the growth curve. However, various studies have shown that thegrowth standards achieved by children under 5 years of age in the NCHSreference population can be attained by children in developing countriesif they are given adequate food and a relatively clean environment.Therefore, WHO has endorsed these as a universal reference. The devel-opment of country-specific references is time consuming and costly, anduse of a global reference has the advantage of permitting cross-countrycomparisons.
Low Birth Weight (LBW)
Inadequate fetal growth (often approximated by low birth weight) is a proxyindicator of poor maternal nutritional status as well, as a predictor of risk forneonatal, infant, and young child (through at least 4 years) morbidity andmortality. There is some evidence that over the long term, growth-retardedinfants may experience permanent deficits in growth and cognitive devel-opment. Determinants of LBW include inadequate maternal protein-energyconsumption, anemia, malaria, tuberculosis, and smoking.
The newborn’s weight (in grams) is generally taken immediately afterdelivery or within the first 24 hours of life. Although weight at birth bygestational age is the best measurement (to differentiate between infantswho are small because they are pre-term and full-term infants who areunderweight), gestational age is difficult and often impossible to assessor obtain in developing country settings. Thus under most circumstances,incidence of low birth weight (defined as birth weight < 2500 gms) isassessed and used as a proxy for small for gestational age (SGA).
Table 2-2 provides a summary of currently established cut-offs for LBW inindividual newborns and for signaling when LBW is a problem of publichealth significance.
At the individual level, in order to reduce morbidity and mortality andoptimize long-term growth and performance, LBW can be used for
chap2.p65 8/20/2004, 3:19 PM14

15
Table 2-2: Recommended Cut-offs for Low Birth WeightEstimate of
Indicator Individual Newborn Population Risk
Low Birth Weight (LBW)a Birth weight < 2500gms Prevalence > 15%b
Small for GestationalAge (SGA) 10th percentile Prevalence > 20%
Chest Circumferencec < 29 cm Prevalence > 15%
a. The 1990 World Summit for Children set as an end-of-century goal the reduction in the incidenceof low birth weight to less than 10 percent. However in 2003, incidence was 14 percent (UNICEF).b. Populations with LBW prevalence of >15% (approximately twice the level of high income settings)are at risk of long-term adverse effects on childhood growth and performance.c. Not yet established as an official indicator of fetal growth.(WHO Expert Committee, 1995)
screening, diagnosis, risk referral, and surveillance purposes (WHOWorking Group on Infant Growth, 1995). At the population level, LBWinformation is used to generate population estimates of the public healthsignificance of the problem, for targeting of interventions, to stimulatepublic health action, and to monitor and evaluate health and develop-ment progress. See Table 2-3 for global LBW prevalence rates.
Keep in mind that LBW data are prone to bias for several reasons. Birthweights are generally collected in hospitals and clinics, introducing thepossibility of bias in areas with poor health care coverage and where themajority of non-emergency births occur at home.
Weight-for-age (W/A)
Weight is influenced both by height and thinness. Low W/A (underweight)is a combination indicator of height-for-age (H/A) and weight-for-height(W/H). W/A is the most commonly reported anthropometric index andused frequently for monitoring growth, identifying children at risk ofgrowth failure, and assessing the impact of intervention actions in growthpromotion programs. It is as sensitive an indicator as H/A in children
chap2.p65 8/20/2004, 3:19 PM15
16 Table 2-3: Percentage Prevalence Babies Born withLow Birth Weight (< 2500 grams)
Percent Percent PercentRegion/ Prevalence Region/ Prevalence Region/ PrevalenceCountry LBW Country LBW Country LBW
AFRICA E.EUROPE and SOUTH ASIAAngola 12 CENTRAL ASIA Bangladesh 30Botswana 10 Albania 3 India 30Burkina Faso 19 Armenia 7 Maldives 22C.A.R. 14 Azerbaijan 11 Pakistan 19Cameroon 11 Belgium 8 Sri Lanka 22Cape Verde 13 Bulgaria 10Comoros 25 Croatia 6 MIDDLE EAST andCongo, Dem. Rep. 12 Czech Republic 7 NORTH AFRICACôte d’Ivoire 17 Hungary 9 Algeria 7Eritrea 21 Kazakhastan 8 Bahrain 8Ethiopia 15 Kyrgyztan 7 Egypt 12Ghana 11 Romania 9 Iran 7Guinea 12 Russian Federation 6 Iraq 15Guinea-Bissau 22 Turkey 16 Jordan 10Kenya 11 Turkmenistan 6 Lebanon 6Lesotho 14 Morocco 11Madagascar 14 LATIN AMERICA Oman 8Malawi 16 and CARRIBEAN Saudi Arabia 11Mali 23 Antigua and Barbuda 8 Tunisia 7Mauritania 42 Argentina 7 Yemen 32Mauritius 13 Barbados 10Mozambique 14 Belize 6 EAST ASIANamibia 16 Bolivia 9 China 6Niger 17 Brazil 10 Fiji 10Nigeria 12 Chile 5 Indonesia 10Rwanda 9 Columbia 9 Korea, Rep. of 4Senegal 18 Costa Rica 7 Malaysia 10Sudan 31 Cuba 6 Mongolia 8Swaziland 9 Dominica 10 Myanmar 15Tanzania 13 Dominican Rep. 14 Papua New Guinea 11Togo 15 Ecuador 16 Philippines 20Tunisia 7 El Salvador 13 Solomon Is. 13Uganda 12 Guatemala 13 Thailand 9Zambia 10 Guyana 12 Vietnam 9Zimbabwe 11 Haiti 21
Honduras 14 TOTALSJamaica 9 Sub-Saharan Africa 14Mexico 9 Middle East andNicaragua 13 North Africa 15Panama 10 South Asia 30Paraguay 9 Latin America andPeru 11 the Caribbean 10Suriname 13 East Asia and theTrinidad/Tobago 23 Pacific 8Uruguay 8 World 16Venezuela 7 Least Developed 18
(UNICEF, 2004)
chap2.p65 8/20/2004, 3:19 PM16
17
under three years, and it has the advantage of requiring only one rela-tively simple physical measurement (i.e., weight). However, because it isdependent upon accurate age data availability, rounding of age is thefrequent cause of substantial systematic bias (Gorstein, et al, 1994).Different age groups also affect sensitivity of W/A. Among the three mostcommon indices (W/H, H/A, W/A)—while none of them have high predic-tive capacities—weight-for-age has the highest predictive ability for child-hood mortality (Pelletier, 1991).
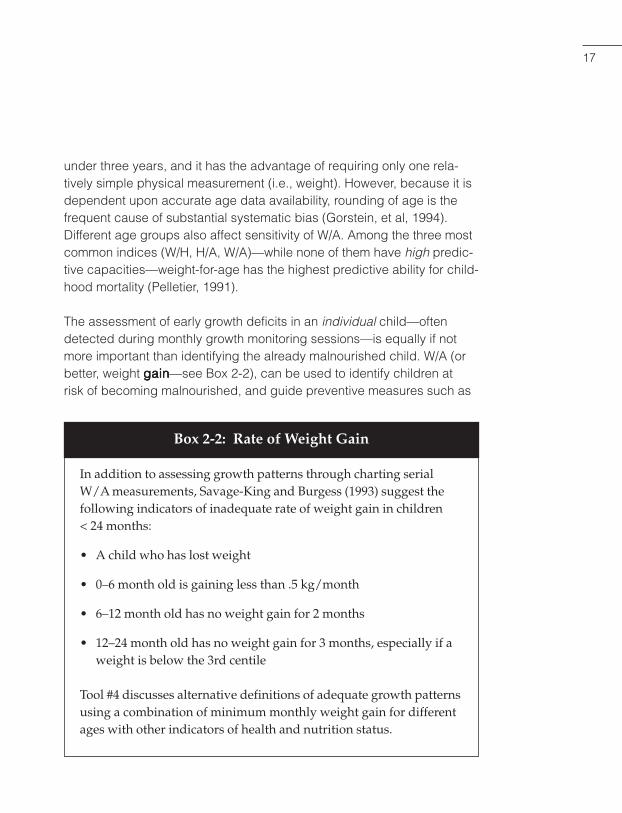
The assessment of early growth deficits in an individual child—oftendetected during monthly growth monitoring sessions—is equally if notmore important than identifying the already malnourished child. W/A (orbetter, weight gaingaingaingaingain—see Box 2-2), can be used to identify children atrisk of becoming malnourished, and guide preventive measures such as
Box 2-2: Rate of Weight Gain
In addition to assessing growth patterns through charting serialW/A measurements, Savage-King and Burgess (1993) suggest thefollowing indicators of inadequate rate of weight gain in children< 24 months:
• A child who has lost weight
• 0–6 month old is gaining less than .5 kg/month
• 6–12 month old has no weight gain for 2 months
• 12–24 month old has no weight gain for 3 months, especially if aweight is below the 3rd centile
Tool #4 discusses alternative definitions of adequate growth patternsusing a combination of minimum monthly weight gain for differentages with other indicators of health and nutrition status.
chap2.p65 8/20/2004, 3:19 PM17
18
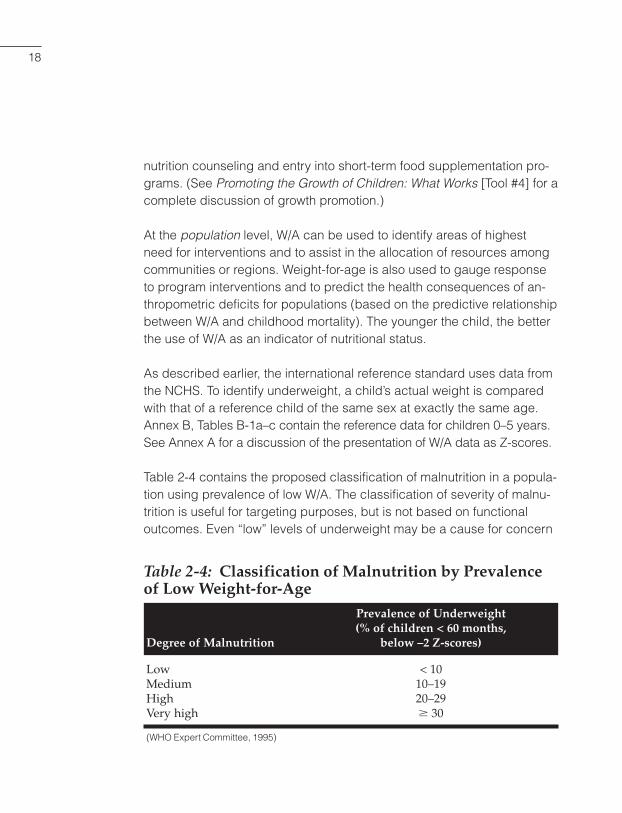
Table 2-4: Classification of Malnutrition by Prevalenceof Low Weight-for-Age
Prevalence of Underweight(% of children < 60 months,
Degree of Malnutrition below –2 Z-scores)
Low < 10Medium 10–19High 20–29Very high � 30
(WHO Expert Committee, 1995)
nutrition counseling and entry into short-term food supplementation pro-grams. (See Promoting the Growth of Children: What Works [Tool #4] for acomplete discussion of growth promotion.)
At the population level, W/A can be used to identify areas of highestneed for interventions and to assist in the allocation of resources amongcommunities or regions. Weight-for-age is also used to gauge responseto program interventions and to predict the health consequences of an-thropometric deficits for populations (based on the predictive relationshipbetween W/A and childhood mortality). The younger the child, the betterthe use of W/A as an indicator of nutritional status.
As described earlier, the international reference standard uses data fromthe NCHS. To identify underweight, a child’s actual weight is comparedwith that of a reference child of the same sex at exactly the same age.Annex B, Tables B-1a–c contain the reference data for children 0–5 years.See Annex A for a discussion of the presentation of W/A data as Z-scores.
Table 2-4 contains the proposed classification of malnutrition in a popula-tion using prevalence of low W/A. The classification of severity of malnu-trition is useful for targeting purposes, but is not based on functionaloutcomes. Even “low” levels of underweight may be a cause for concern
chap2.p65 8/20/2004, 3:19 PM18

19
because only 2.3% of children in a well-nourished population would beexpected to have W/A < –2Z scores.
Height-forHeight-forHeight-forHeight-forHeight-for-age (H/A-age (H/A-age (H/A-age (H/A-age (H/A) ) ) ) ) is a measure of cumulative linear growth and isoften influenced by long-term food shortages, chronic and frequentrecurring illnesses, inadequate feeding practices, and poverty. This indexis used primarily with children under five years of age, with low H/A com-monly not appearing before 3 months of age. Children who are short fortheir age relative to a reference standard are classified as “stunted.” Theprevalence of stunting among children generally increases with age up to24–36 months and then remains relatively constant thereafter.
For individual children, H/A is not used to monitor growth because oferrors in measurement of relatively small changes in the short-term. Inregions where there is a known high prevalence of stunting such asSouth Asia, H/A can be used to screen individual children under twoyears of age for intervention. In areas with low prevalence of low H/A,short children are more likely to be genetically short, making it inappro-priate to assume a pathological basis for low H/A or to use the index as ascreening tool. (This can often be ascertained by looking at the height ofthe child’s parents.)
At the population level the prevalence of stunting is useful for long-termplanning and policy development, for targeting a range of interventionsto a community(s), and for monitoring malnutrition at the community,regional, or national level. H/A is frequently used as a reflection of socio-economic status and equity. For example, height measurements of simi-lar age groups at intervals of years can demonstrate positive or negativesecular change within a community, region, or country. Poverty analysesoften use stunting as a nutritional indicator since it is cumulative andcannot be compensated by fatness.
To identify whether a child is stunted, his/her actual height is comparedwith that of a reference child of the same sex at exactly the same age.
chap2.p65 8/20/2004, 3:19 PM19

20
Table 2-5: Classification of Malnutrition by Prevalenceof Low Height-for-Age
Prevalence of Stunting(% of children < 60 months,
Degree of Malnutrition below –2 Z-scores)
Low < 20Medium 20–29High 30–39Very high � 40
(WHO Expert Committee, 1995)
Annex B, Tables B-2a–e contain the NCHS reference tables for H/A forchildren ages 0–60 months. Stunting data are presented as Z-scores,comparing a child or group of children with a reference population todetermine relative status. See Annex A for a full discussion of Z-scores.
To assess or estimate the prevalence of malnutrition in a population,results are presented as the prevalence of children who fall below thestandard cut-off. Table 2-5 contains the proposed classification of malnu-trition in a population using prevalence of stunting. The classification ofseverity of malnutrition is useful for targeting purposes, but is not basedon functional outcomes. Interpret “low” and “medium” with caution—only2.3% of children in well-nourished populations would be expected to fallbelow –2Z-scores, making even “low” levels of stunting cause for con-cern. All cut-offs are merely indicators of risk, not necessarily of actualmalnutrition.
WWWWWeight-foreight-foreight-foreight-foreight-for-height (W/H)-height (W/H)-height (W/H)-height (W/H)-height (W/H) measures body weight relative to height. Be-cause weight can fluctuate rapidly in children due to illness or inad-equate food intake, W/H reflects the current nutritional status of a child,with low W/H (wasting) indicating current acute malnutrition with failure togain weight or actual weight loss. However, low W/H can also be a resultof a chronic condition in some communities. Weight in individual children
chap2.p65 8/20/2004, 3:19 PM20
21
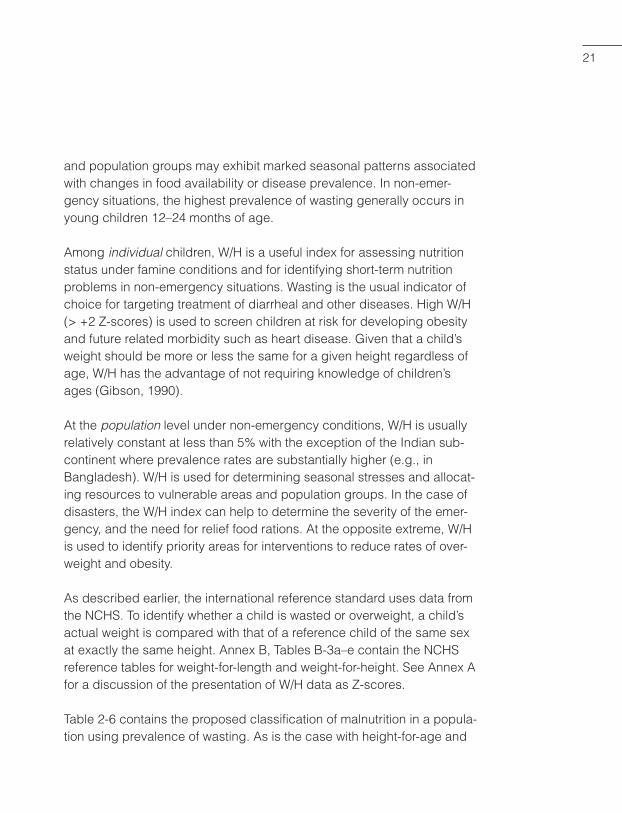
and population groups may exhibit marked seasonal patterns associatedwith changes in food availability or disease prevalence. In non-emer-gency situations, the highest prevalence of wasting generally occurs inyoung children 12–24 months of age.
Among individual children, W/H is a useful index for assessing nutritionstatus under famine conditions and for identifying short-term nutritionproblems in non-emergency situations. Wasting is the usual indicator ofchoice for targeting treatment of diarrheal and other diseases. High W/H(> +2 Z-scores) is used to screen children at risk for developing obesityand future related morbidity such as heart disease. Given that a child’sweight should be more or less the same for a given height regardless ofage, W/H has the advantage of not requiring knowledge of children’sages (Gibson, 1990).
At the population level under non-emergency conditions, W/H is usuallyrelatively constant at less than 5% with the exception of the Indian sub-continent where prevalence rates are substantially higher (e.g., inBangladesh). W/H is used for determining seasonal stresses and allocat-ing resources to vulnerable areas and population groups. In the case ofdisasters, the W/H index can help to determine the severity of the emer-gency, and the need for relief food rations. At the opposite extreme, W/His used to identify priority areas for interventions to reduce rates of over-weight and obesity.
As described earlier, the international reference standard uses data fromthe NCHS. To identify whether a child is wasted or overweight, a child’sactual weight is compared with that of a reference child of the same sexat exactly the same height. Annex B, Tables B-3a–e contain the NCHSreference tables for weight-for-length and weight-for-height. See Annex Afor a discussion of the presentation of W/H data as Z-scores.
Table 2-6 contains the proposed classification of malnutrition in a popula-tion using prevalence of wasting. As is the case with height-for-age and
chap2.p65 8/20/2004, 3:19 PM21

22
Table 2-6: Classification of Malnutrition by Prevalenceof Low Weight-for-Height
Prevalence of Wasting(% of children < 60 months,
Degree of Malnutrition below –2 Z-scores)
Low < 5Medium 5–9High 10–14Very high � 15
(WHO Expert Committee, 1995)
weight-for-age, the classification of severity of malnutrition is useful fortargeting purposes, but is not based on functional outcomes. Becauseonly 2.3% of children in well-nourished populations would be expected tofall below –2Z-scores, even “low” levels of wasting may be cause forconcern. See sections on overweight under Body Mass Index (see page26) and Adolescent Anthropometry (see page 34) for further discussionof cut-offs and population-based prevalence rates.
Mid-Upper ArMid-Upper ArMid-Upper ArMid-Upper ArMid-Upper Arm Cirm Cirm Cirm Cirm Circumfercumfercumfercumfercumference (MUAC)ence (MUAC)ence (MUAC)ence (MUAC)ence (MUAC), the measure of the diameter offat, bone, and muscle tissue of the upper arm, is an alternative index toconsider in situations where it is difficult to collect weight and heightmeasurements. For example, in settings where health workers are illiter-ate or under emergency conditions, when screening is more importantthan counseling, MUAC is useful. MUAC offers the operational advan-tages of a simple, easily portable measurement device (the arm band/tape) and the use of a single cut-off for children under five years of age(12.5 or 13.0 cm) as a proxy for low W/H or wasting. MUAC has alsobeen used as a screening device for pregnant women; because MUACis generally a stable measure throughout pregnancy, it is used as a proxyof prepregnancy weight, and therefore an indicator of risk for low birthweight babies. One type of color-coded measuring tape, the Shakir strip,is made from locally available materials and is appropriate for illiterate/
chap2.p65 8/20/2004, 3:19 PM22

23
innumerate workers; red signifies severe malnutrition, yellow is moderatemalnutrition, and green signals adequate nutrition. (See discussion onp.7 for more information on measuring tools.)
Disadvantages of the index are the large variability in MUAC measure-ments (a 0.5 cm error in MUAC has greater implications than a 0.5 cmerror in height) and the increased time/effort necessary for training andstandardization of MUAC measurements. Comparisons of MUAC with afixed cut-off and low W/H derived from the same population have demon-strated poor correlation of the two indicators when used for determiningindividual nutrition status. More children were identified as malnourishedby MUAC (false positives), with the attendant implications for diminishedcost-effectiveness of an intervention program. However, at the communitylevel, MUAC has been found to be a superior predictor of mortality risk,and thus could serve as an effective screening tool (WHO Expert Com-mittee, 1995).
At the individual level, MUAC-for-age is recommended for screeningpurposes to identify infants/children and pregnant women who need supple-mentary food or therapeutic feeding, and possibly treatment for disease.It is not recommended for assessing response to interventions (WHOExpert Committee, 1995).
At the population level, MUAC-for-age or MUAC is useful for targetingpurposes (WHO Expert Committee, 1995) including determining the se-verity of a disaster or emergency situation, the need for/type of reliefrations, and priorities for allocation of resources. Because of the highcorrelation between low MUAC and mortality in under-five’s, this index ispotentially useful for predicting the consequences of malnutrition identi-fied by anthropometric deficits in populations.
WHO Expert Committee (1995) proposed that MUAC with a fixed cut-offbe used as an additional screening tool in non-emergency situations (butnot as a substitute for weight- and height-based indices), and suggests
chap2.p65 8/20/2004, 3:19 PM23

24
Table 2-7: Classification of MUAC in Children 12–60MonthsClassification Cut-Off Value
Normal > 13.5 cmModerate wasting 12.5–13.5 cmSevere wasting < 12.5 cm
(FAO, 1993a)
that MUAC-for-age is an acceptable substitute for W/H in the context ofpopulation-level nutritional surveillance. The reference data for MUAC-for-age are based on US children aged 6 to 60 months from the NationalHealth and Nutrition Examination Surveys (NHANES). Annex B, TablesB-4a–c contain reference tables for MUAC measurements (median andstandard deviations) for boys and girls ages 6–60 months.
Table 2-7 contains the cut-offs and classifications recommended forMUAC in children ages 1 to 5 years. Cut-offs for pregnant women aredetermined on the basis of local reference data; measurements between21–23.5 cm have been used in the past to determine risk of LBW infants.
Height-for-Age in School Children
Used solely for population-level analysis, this index captures the earlierhealth and nutrition histories as well as the broader socioeconomic andenvironmental factors affecting school-age children four to six years afterthe fact. A height census is the measurement of height of all entering firstgraders at schools throughout a country. Experience in Latin America(PAHO/WHO/UNICEF, 1997) suggests that the results from a height-for-age census can be used to advocate for allocation of social programs, toidentify particularly needy geographic areas, and to plan and target pov-erty alleviation and other types of social welfare programs. Height-for-age
chap2.p65 8/20/2004, 3:19 PM24

25
in school children is not the most appropriate indicator to target indi-vidual or population level nutrition intervention strategies, but rather toadvocate for increased resources to the education sector. It is useful fortargeting school-based interventions designed to increase enrollment,promote attendance, and prevent dropouts (PAHO/WHO/UNICEF, 1997).
As with most anthropometric indicators, it is important to use the schoolheight census findings as part of a more complete set of data about thephysical, economic, and sociocultural context of a community or region.Height-for-age data will not answer questions about the determinants ofearlier poor health and nutrition conditions. The primary objective ofheight censuses is the construction of a classification scale and not ex-act prevalence estimates of height retardation in a specific population(PAHO/WHO/UNICEF, 1997).
A school census provides relatively easy access to a population, andmay well furnish greater coverage—particularly at first grade—than sur-veying health center clients. It can be implemented in a few months andis relatively cheap. The technology for obtaining the measurements issimple and inexpensive, and teachers can readily be trained to carry outthe survey. The first grade of school is often the point at which the great-est numbers of individuals of similar age from different socioeconomicbackgrounds in the country are brought together, allowing for inter-regional comparisons to be made.
It is important that age data are collected rather than making the as-sumption that all first year students are the same age. And whileschool-based data may capture high percentages of the school-agepopulation in middle-income countries, the most common source ofbias in height-for-age surveys is population coverage. Problems arerelated either to the exclusion of a large number of schools from thesampling frame because of accessibility issues, or a high percentageof children missing from school enrollments because of gender bias,
chap2.p65 8/20/2004, 3:19 PM25

26
health status, household poverty and so forth. Typically, the lack ofcoverage—generally in economically disadvantaged areas—results inunderestimation of stunting prevalence and the distortion of regionalclassification/prioritization systems.
Information on height is usually collected at the level of the individualschool. Data are presented as mean Z-scores and estimates of preva-lence of low height-for-age, stratified by sex and by age group. Ideally,local school prevalence estimates will be aggregated to correlate with acountry’s political or administrative units; the small sample sizes providedby the individual schools have the problem of large standard errors.
The Family Assistance Program/Women Head of Household Food CouponProgram (PRAF) in Honduras used an annual nationwide school nutritioncensus of all 6 to 9 year-old students entering the first grade of publicschools to improve targeting of the food coupon distribution system.
Recommended references for height-for-age values for school-age chil-dren are the NCHS/WHO data in Annex B Tables B-5a–b. For a moredetailed discussion of the height-for-age census, refer to the joint techni-cal report by PAHO/WHO/UNICEF (1997).
Body Mass Index (BMI)
BMI is defined as: (weight in kilograms)/(height in meters2). For adults indeveloping countries, anthropometry has largely been used to identifychronic energy deficiency (thinness) and at the opposite extreme, toclassify problems of obesity. BMI is highly correlated with fat mass and istherefore a reasonably good index of body energy stores as fat. As anindex of nutritional status, BMI accounts for the fact that weight is influ-enced by height and is therefore less biased by this association thanother indices.
chap2.p65 8/20/2004, 3:19 PM26

27
Chronic energy deficiency
According to WHO Expert Committee (1995), at the individual level, one-time measurement of weight or BMI in men and non-pregnant women isof limited use for predicting health risks or benefits from nutrition orhealth interventions. The degree of unintentional weight loss of an adultis a better predictor of individual morbidity and mortality risk related tolow weight or thinness. Nonetheless, the WHO Expert Committee (1995)has published BMI tables (Annex B Table B-6) and established cut-offsfor use in determining degrees of chronic energy deficiency in individu-als (see Table 2-8 ). With pregnant women, pre-pregnancy or first tri-mester BMI can be used to screen for food supplementation, and toidentify women at risk for delivery of a low birth weight or preterm infant(see page 31 for more information).
At the population level, monitoring adult nutritional status with BMI in non-emergency situations can be a useful tool for assessing nutritional orother socioeconomic deprivation. Low BMI data can be used as thebasis for targeting services to a community; a changing BMI profile maybe indicative of a population undergoing adverse social or economicchange.
Table 2-8: Proposed BMI Cut-Offs for Chronic EnergyDeficiency in an Individual AdultBMI Range Diagnosis
Chronic Energy Deficiency< 16 Grade 3 thinness (severe)16–16.9 Grade 2 thinness (moderate)17–18.4 Grade 1 thinness (mild)18.5–24.9 Normal
(WHO Expert Committee, 1995)
chap2.p65 8/20/2004, 3:19 PM27

28
Table 2-9: Adult Thinness as a Public Health ProblemPopulation prevalence BMI < 18.5 Classification
5–9% Low prevalence: warning sign,monitoring required
10–19% Medium prevalence: poor situation20–39% High prevalence: serious situation> 40% Very high prevalence: critical
situation
(WHO Expert Committee, 1995)
BMI is also a general indicator of adult health status, particularly lowBMI. Establishing a baseline picture of the BMI distribution for a popula-tion enables detection of threats to food security and the need for rapidintervention in an area undergoing either man-made or natural disasteremergency conditions. In an emergency feeding program, anthropo-metric monitoring of adults helps to discriminate between problems ofadequate supplementary food supplies and other public health inter-ventions because adults are less susceptible to epidemic infectionthan malnourished children. Adult BMI data are presumed to moredirectly reflect dietary adequacy rather than a complicated interplayof infection, appetite, feeding behaviors, and other factors that affectchild nutrition status.
Table 2-8 contains the recommended cut-offs defining varying degrees ofthinness in an individual, and Table 2-9 suggests prevalence levels signi-fying a public health problem within a population.
Overweight
Overweight (excess energy stored as fat resulting from energy intakeexceeding expenditure) is associated with increased risk of morbidity
chap2.p65 8/20/2004, 3:19 PM28

29
(e.g., coronary heart disease, diabetes mellitus, gallbladder disease,some cancers, and musculoskeletal disorders) in most populations.
BMI is used to classify individuals in terms of overweight, with furthertesting necessary to identify individual risk factors (e.g., smoking, dietaryand exercise habits, blood pressure, serum lipids, family history, etc.) forspecific types of disease. According to the World Health Report (WHO,2002), noncommunicable diseases accounted for almost 60% of theworld’s 56 million deaths in 2001. Five of the six main risk factors areclosely related to diet and physical activity.
At the population level, overweight is a sensitive indicator of energyimbalance caused by a combination of excessive energy intake andinsufficient energy expenditure. Because it is such a difficult conditionto treat, usually begins in childhood, and is already a widespread prob-lem in industrialized countries, interventions need to focus on preven-tion. Establishing needs and priorities for intervention programs isachieved through representative population surveys, with a prevalenceof BMI> 30 (or > 85 percentile) suggested as the principal indicator(WHO—Technical Report Series No. 916, 2003).
Age-specific and age-standardized proportions of the population abovea certain BMI cut-off can also be used to evaluate health promotion anddisease prevention programs in which weight control is one goal. Toevaluate interventions for prevention of overweight in populations whereprevalence of obesity is low, monitor longitudinal weight development.Efficacy of the intervention can be judged with a case-control studydesign and a follow-up period of at least five years.
Anthropometric data are less useful for targeting specific interventionsbecause of the interplay of genetics with obesity. Genetic differencesbetween populations influence the degree of risk associated with over-weight as well as the types of disease that may occur as a result of
chap2.p65 8/20/2004, 3:19 PM29

30
excess body weight. For example, it appears that abdominal fatness maybe less of a risk for cardiovascular disease and diabetes in black womenthan in white, while Asians and Mexican-Americans appeared to havehigher risks of developing non-insulin-dependent diabetes mellitus thanCaucasians of similar BMI (WHO Expert Committee, 1995).
Table 2-10 contains the recommended cut-offs defining varying degreesof overweight in an individual.
Anthropometry During Pregnancy
Anthropometric evaluation of pregnant women has the advantage ofbeing a fairly widely used, low-technology procedure which generatesinformation about the nutritional status of the mother and growth of thefetus (WHO Expert Committee, 1995).
Useful application of anthropometric data from pregnant women de-pends on the availability of resources and the likelihood of interveningto avert negative pregnancy outcomes. For instance, when limitedresources (i.e., no scales) make weight data collection impossible, shortheight or mid-upper arm circumference may be used as a screening tool.There may be over-classification of at-risk women. Setting cut-offs willsimilarly depend on availability of local resources for intervention.
Table 2-10: Classification of Overweight in Adults by BMIBMI Range (kg/m2) Classification
25–29.9 Overweight (pre-obese)30–34.9 Class I obese35–39.9 Class II obese40 and above Class III obese (extreme obesity)
(National Institutes of Health, 2004)
chap2.p65 8/20/2004, 3:19 PM30

31
The preferred indicators of pregnancy outcome are pre-pregnancyweight, body mass index (BMI) through the first 20 weeks of gestation,weight gain during pregnancy, or height. These indicators provide someassessment of risk for the woman during delivery and of potential healthproblems for the newborn child. The WHO Collaborative Study on Mater-nal Anthropometry and Pregnancy Outcomes (1995) found that anthro-pometric indicators are more strongly related to fetal growth than tocomplications of labor and delivery, although stature can be a relativelystrong predictor of delivery complications and maternal mortality.
For all of these indicators, selection of one or a combination of severalwill depend upon what is being assessed: maternal and/or infant risk ofpoor health/nutrition outcomes, selection of one or more interventions, orresponse to an intervention(s). And critically, the choice of cut-off for aparticular indicator rather than the indicator itself, may be the issue ofmost importance for determining the optimal use of maternal anthropom-etry. For example, the cut-off for BMI best suited to predict risk for intrau-terine growth retardation (IUGR) might well be lower than the BMI cut-offthat best indicates response to an intervention. The nature of the out-come (e.g., LBW, prematurity), the nature of the intervention (e.g., food oriron supplementation, reduced workload, child-spacing), the distributionof the anthropometric measurement in the population (e.g., percentage ofthe population below various cut-offs), the prevalence of the outcome,and the importance of the cause targeted for intervention relative to othercauses, will influence the selection of indicator and cut-offs.
Pre-pregnancy weight
Weight prior to pregnancy or within the first 20 weeks of pregnancy is ameasurement frequently used to indicate the need for maternal weightgain during pregnancy and to target women for supplementary feeding.It is currently the most useful screening indicator for risk of low birthweight (due to IUGR) in infants. Weight assessment after 20 weeks
chap2.p65 8/20/2004, 3:19 PM31

32
gestation is used for referring women to facilities where small for gesta-tional age (SGA) and preterm infants can receive specialized care. Popu-lation-specific cut-offs for pre-pregnancy weight should be establishedwithin the range of 40–53 kg.
Body Mass Index (BMI)
The WHO Expert Committee recommends the use of BMI with pregnantwomen for prevention of preterm delivery or referral for neonatal care inpopulations at risk of preterm delivery. Measured during the first trimester,a population-specific cut-off between 17 and 21 has moderate sensitivityand specificity for predictive purposes.
Low BMI (population-specific cut-offs) has also been used to determinewhich women should receive counseling on diet and/or supplementaryfeeding. It is important to note that there are several assumptions con-cerning causality of low BMI and the efficacy of the feeding interventionimplicit in this choice of targeting indicator:
1) Low maternal BMI is caused by chronically low energy intake and notby morbidity;
2) Low intake is caused by inadequate access to food at the householdlevel, and not by detrimental intrahousehold allocation patterns; and
3) Supplementary food will be preferentially available to pregnant and/orlactating women and will not substitute for the home diet (WHO ExpertCommittee, 1995).
Height/Stature
Height in adults is a combination of genetic potential for growth and envi-ronmental effects that influence growth. Specifically for pregnancy, it isan estimate of pelvis size and the only anthropometric measure that
chap2.p65 8/20/2004, 3:19 PM32

33
serves (with moderate accuracy) as a predictor of need for an assisteddelivery. In several studies short maternal height has been associatedwith poor growth of the fetus (intrauterine growth retardation or IUGR)and subsequently, low birth weight. Current recommendations suggestsetting population-specific cut-offs between 140–150 cm; height lessthan 145 cm is a cut-off associated with increased risk of maternal mor-tality (Krasovec and Anderson, 1991). Height should not be used to tar-get a narrow intervention such as supplementary feeding because itdoes not reflect current nutrition status, nor will it capture maternal re-sponse to feeding in most cases. Height is probably best employed as ascreening instrument in situations of limited resources, bearing in mindthat considerable misclassification of cases will result.
Weight gain during pregnancy
Although this indicator is most reflective of the pregnancy period (gener-ally 20+ weeks), its findings come at a point when intervention options forthe mother or fetus are limited. It is useful for referral for specialized laborand delivery and neonatal care, and for selecting individuals for interven-tion during lactation. Changes during pregnancy are relative to heightand to initial nutritional status; therefore some clinicians suggest that thepercentage weight gain relative to pre-pregnancy weight be used (set-ting a 15–25 percent increase as desirable) versus an absolute gain of10 kg over the course of the pregnancy. Another weight gain cut-off usedfrequently is 1 kg/month over the last two trimesters.
Mid-upper arm circumference (MUAC) may also be considered for screen-ing (not monitoring) purposes as a predictor of low birth weight, particularlyin cases where program resources limit equipment options and/or womenhave only one or very few contacts with the healthcare system during theirpregnancy. Because MUAC increases only minimally if at all during preg-nancy, it is used as a proxy for maternal pre-pregnancy and early preg-nancy weight. The disadvantages of MUAC are the possibility for
chap2.p65 8/20/2004, 3:19 PM33

34
Box 2-3: Possible Determinantsof Poor Growth during Pregnancy
Some of the pertinent issues to look at include:
• Availability and access to key foods
• Cultural perceptions of appropriate diet during pregnancy
• Estimates of physical work/energy expenditure
• Prevalence and type of maternal infections
(WHO Expert Committee, 1995 )
measurement error, the greater impact of that error for misclassification incomparison to other measurements such as weight, and the increasedeffort necessary for training and standardization of MUAC measurements.Population-specific cut-offs will need to be determined based on localreference data and availability of resources for intervention. MUAC cut-offsbetween 21–23.5 cm have been used for identification of women likely tohave LBW infants (Krasovec and Anderson, 1991).
Identification of individuals or population groups at risk for poor preg-nancy outcomes is only the first step. An assessment of possible determi-nants (see Box 2-3) will help to understand the cause of poor maternalweight gain and/or problematic fetal growth during pregnancy as well asdirect efforts at intervention.
Adolescent Anthropometry (children 10–19 years of age)
Use of anthropometry for diagnostic and screening purposes in adoles-cents is constrained primarily by the difficulty of capturing the subjects.
chap2.p65 8/20/2004, 3:19 PM34

35
And while it is a critical time for the development of many health andnutrition risks (e.g., obesity, short stature in girls), it is a pointless exerciseunless specially-targeted intervention strategies (nutrition, life skillseducation, family planning, and STDs/AIDS) prevention will be plannedand implemented.
It is important to disaggregate adolescent anthropometric data by sexbecause of the differences in size and timing of the growth spurt betweenthe sexes. Due to the transient nature of adolescent growth patterns andwide variability in timing of maturational changes, age intervals for col-lecting data should be shortened to six months (as opposed to one-yearintervals during middle childhood), for the period two years after thegrowth spurt until adult height is attained.
Height-for-age (H/A), body mass index (BMI), and BMI-for-age are themost commonly constructed indices for this population group. Weight-forheight (W/H) is no longer useful because the relationship between weightand height changes with age and maturational stage during adolescence.BMI-for-age is recommended as the best indicator during adolescence,incorporating information on age, providing continuity with adult indicators,and applicable to both underweight and overweight conditions.
Provisional references for adolescent anthropometry use NCHS data,which include standard deviations and percentiles of height and weightthrough the adolescent years. While BMI-for-age percentiles are acknowl-edged to be skewed toward higher values, they are currently recom-mended as the best option for uniform reporting purposes until other dataare compiled. H/A and BMI-for-age percentiles are presented in Annex B,Tables B-7a–b.
For individuals, stunting (H/A < –2 Z-scores) is used to identify adoles-cents who could benefit from improved nutrition or treatment of otherunderlying health problems, with the greatest impact expected forpremenarcheal girls and pre- or early pubertal boys. Particularly for girls,
chap2.p65 8/20/2004, 3:19 PM35
36
stunting is related to poor reproductive outcomes (low birth weight,cephalopelvic disproportion,5 dystocia,6 and increased risk of cesareansection and possible postmenopausal osteoporosis). Menarche in girlsand the attainment of an adult voice in boys indicates that peak staturevelocity has already occurred, and the effect of nutrition interventions onstunting will be minimal.
Thinness (low BMI-for-age) in adolescents is useful for determining needfor supplementary feeding, nutrition education, and referral to medicalcare, with a suggested cut-off of BMI-for-age < 5th percentile.
Adolescents with BMI � 85 percentile are at risk of overweight. Generally,in populations where there are large numbers of overweight individuals, itis recommended that adolescents with high BMI have additional screen-ing to identify obesity-related risk factors such as high blood pressure,family history of cardiovascular disease or diabetes mellitus.
Use of adolescent anthropometry at the population level is similar to thatfor individuals. It is helpful to determine median ages for maturationalindicators (menarche, breast and genitalia development, attainment ofadult voice) for a population in order to facilitate cross comparison withother populations after adjusting for maturational age (WHO Expert Com-mittee, 1995).
Summary statistics for thinness should be reported for targeting pur-poses (mean, SD) by age and sex groups, as well as the frequencybelow the 5th percentile of BMI-for-age. Identifying regions with a highproportion of thin adolescents will help to guide decisions about designof intervention programs and the allocation of resources. Premenarcheal
5. Cephalopelvic disproportion is a condition in which the maternal pelvis is too smallfor the size of the fetal head.6. Dystocia denotes a difficult labor due to fetal or maternal causes.
chap2.p65 8/20/2004, 3:19 PM36

37
girls and pre-pubescent boys are the at-risk groups that will derive thegreatest benefit from intervention.
To assess response to interventions directed at excess thinness amongadolescents, evaluate frequencies of BMI relative to either the NCHSreference data or local reference standards. Secular change in thinnessprevalence can be a useful indicator of overall social or economic im-provement (or decline). It is recommended that surveillance of adoles-cents (usually a component of surveillance covering other populationgroups as well) occur every five years during periods of socioeconomicchange or while programs are in progress. During periods of social up-heaval or rapid positive (or negative) change, more frequent assessmentis optimal. Ten-year intervals are sufficient otherwise (WHO Expert Com-mittee, 1995). Again, report mean and SD of BMI and frequencies of BMI-for-age < 5th percentile.
In areas where overweight is an identified problem, prevalence can beestimated by an anthropometric survey. Survey results will also assist withthe design or modification of intervention programs. Based on BMI refer-ence data (Annex B Table B-6), report frequencies of adolescents withBMI � 85 percentile, mean, median, and SD of BMI and frequency ofBMI � 30, disaggregated by age and sex.
To determine obesity (excessive body fat), the WHO Expert Committeerecommends combined use of three indices: BMI-for-age, triceps andsub scapular skinfold thicknesses (TRSKF and SSKF). BMI alone is aninexact measure of total body fat and obesity (implying knowledge ofbody composition) is limited to those adolescents both at risk of over-weight (high BMI) and characterized by high levels of subcutaneous fat(high TRSKF- and SSKF-for-age). The suggested cut-off values in Table2-11 are provisional, and are based on limited evidence of universal ap-plicability. See Tables B-8a to B-8b and B-9a to B-9b in Annex B for refer-ence percentiles of triceps and sub-scapular skinfold thicknesses foradolescents.
chap2.p65 8/20/2004, 3:19 PM37

38
Table 2-11: Proposed Cut-Off Values for AdolescentAnthropometryIndicator Indices Cut-Off Value
Stunting/low H/A H/A < –2 Z-score; 3rd percentileThinness or low BMI for age BMI for age < 5th percentileAt risk of overweight BMI for age � 85th percentileObese (simultaneous use BMI for age � 85th percentile and
of all three indicators TRSKF for age � 90 percentile andis recommended) SSKF for age � 90th percentile
(WHO Expert Committee, 1995)
chap2.p65 8/20/2004, 3:19 PM38