1_the theory and interpretation of electron energy loss near-edge fine structure
TRANSCRIPT

8/3/2019 1_The Theory and Interpretation of Electron Energy Loss Near-Edge Fine Structure
http://slidepdf.com/reader/full/1the-theory-and-interpretation-of-electron-energy-loss-near-edge-fine-structure 1/26
The Theory and Interpretationof Electron Energy LossNear-Edge Fine Structure
Peter Rez1 and David A. Muller2
1Department of Physics and School of Materials, Arizona State University, Tempe, Arizona 85287; email: [email protected]
2School of Applied and Engineering Physics, Cornell University, Ithaca, New York 14853
Annu. Rev. Mater. Res. 2008. 38:535–58
First published online as a Review in Advance on April 9, 2008
The Annual Review of Materials Research is online atmatsci.annualreviews.org
This article’s doi:10.1146/annurev.matsci.37.052506.084209
Copyright c 2008 by Annual Reviews. All rights reserved
1531-7331/08/0804-0535$20.00
Key Words
inner shell, electron microscope, X-ray absorption
Abstract
Electron energy loss fine structure near the threshold of inner-shell edgcan potentially give valuable information on bonding on an atomic scale. T
use near-edge structure it is essential to understand what factors influenboth the occupied and unoccupied local density of states in the materialinterest. Different techniques of electronic structure theory are suitable f
metals, semiconductors, and ionic materials, although some methods can applied to a wide range of systems. To extract quantitative information
bonding it is important to avoid those edges that are strongly affected by tpresence of the core hole such as cations in ionic materials.
535
Click here for quick links to
Annual Reviews content online,
including:
• Other articles in this volume
• Top cited articles
• Top downloaded articles
• Our comprehensive search
FurtherANNUAL
REVIEWS

8/3/2019 1_The Theory and Interpretation of Electron Energy Loss Near-Edge Fine Structure
http://slidepdf.com/reader/full/1the-theory-and-interpretation-of-electron-energy-loss-near-edge-fine-structure 2/26
(S)TEM: (scanning)transmission electronmicroscopy (ormicroscope)
EXAFS: extended
X-ray absorption finestructure
INTRODUCTION
The aim of electron microscopy is to determine structures and properties of defects at the atom
level. Electronic structureandbonding areas importantas atomicpositionsin determining physiproperties associated with localizeddefects. It is nowpossible with field emission microscopes [b
dedicated scanning transmission electron microscopes (STEM) and TEM/STEM instruments]acquire signals from individual atomic columns in many materials (1–4). The advent of spheri
aberration correction will improve spatial resolution and make it possible to form probes with h
widths of just over 0.1 nm (5). The electron energy loss spectrum should give useful information on the electronic states
a material. The low-loss region (up to 50 eV) is dominated by collective excitations (plasmo
(6), and although the signal is strong, interpretation is difficult because the excitation probabildepends on both valence and conduction band states. There have been some recent calculatiousing conventional density functional theory (DFT) codes that show good agreement with lo
loss spectra (7), although more sophisticated approaches taking account of excitonic effects necessary to get good agreement in the region of the band gap (8). An additional complicati
in insulators and also semiconductors is the presence of Cherenkov radiation, which can produstrong peaks in regions of the spectrum where the dielectric constant is high and the absorpti
coefficient is small (9, 10). The low-loss signals are also not localized at the atomic level, and i
possible to excite interface plasmons from distances of order 1 nm from a boundary (11). To achieve the degree of localization required for atomic resolution studies, it is necessary
use inner-shell edges. The extended fine structure, generally defined as those features starti
at 40–50 eV above threshold, is well understood and gives useful information on interatomdistances and, to a lesser extent, coordination (12, 13). Extended fine structure has not fou
much application in electron spectroscopy in the microscope for a number of reasons. The signis weak, and it is difficult to acquire data of adequate statistical precision in the time availab
which is usually constrained by drift and damage to be less than a minute. A more serious problis that in any multicomponent material the range of oscillations is limited by the appearanceanother inner-shell edge and is usually only 200–300 eV. X-ray absorption extended fine structu
(EXAFS) studies generally use inner-shell edges with binding energies of order 10 kV that prov
a range of 1000–2000 eV of fine-structure data. The near-edge region, up to 30–40 eV above threshold, often shows very strong modulatio
that can give information on electronic structure or bonding, coordination, and interatomic d
tances. Because the signal is strong, it is practical to monitor changes brought about by differelocal environments near defects. The disadvantage of near-edge structure is that there is no si
ple interpretation applicable to all edges in all materials, and calculation is sometimes requiredmake sense of the various features that are observed. The core hole in the inner shell is anoth
complication (14) and in some cases can dominate the fine structure. The fine structure then givmore information about the excitation process rather than the ground-state electronic structu
of the material of interest.Previous reviews have approached near-edge structure calculation from a theoretical persp
tive and have emphasized theory and an organization based on the level of approximation (15–1 This review has a different structure that is based on the nature of the material and emphasizes t
different approaches that have been successful in metals, semiconductors, and covalent and ioninsulators. In the absence of core-hole effects, the inner-shell near-edge structure represents tangular-momentum-resolved unoccupied density of states at a given atomic site. The first secti
therefore reviews different methods of calculating the density of states to provide a backgroufor the ensuing discussion, which is divided into sections on metals, semiconductors, and covale
536 Rez · Muller
8/3/2019 1_The Theory and Interpretation of Electron Energy Loss Near-Edge Fine Structure
http://slidepdf.com/reader/full/1the-theory-and-interpretation-of-electron-energy-loss-near-edge-fine-structure 3/26
EELS: electronenergy lossspectroscopy
and ionic insulators. Core-hole effects are most significant for the cations of ionic materials (18).
In metals (19) and many anions (20, 21) their effect can be largely neglected, and the measuredspectrum represents a ground-state property. Where possible it is advisable to use such edges be-cause quantitative inferences on electronic structure can then be made from a measured electron
energy loss spectroscopy (EELS) spectrum.
THEORETICAL BACKGROUND
The probability of exciting an inner-shell electron is low enough that it happens only once for agiven shell in a typical TEM specimen and can therefore be treated by first-order perturbation
theory. Assuming the fast electron states can be represented as plane waves, the differential crosssection, which is the probability of scattering into a solid-angle element d into an energy range
dE , is given by
d 2 I
d dE =
4γ 2
a20
f | exp(i q.r ) |i
q 2
2
, 1.
where a0 is the Bohr radius, γ is a relativistic correction factor, q is the scattering wave vector of the
incident electron q = k f − k i , |i represents the initial core level state, | f represents the ejectedelectron state in the conduction band of the solid, and r is the coordinate of the atomic electron
excited. In practice, most energy loss spectra are recorded under conditions in which q.r < 1 anddipole scattering dominates. The final-state angular momentum l is then given by l = l ± 1,
where l is the initial-state angular momentum. If an average over all directions of the scattering wave vector is taken (22–24), it is possible to separate the differential cross section into a product
of atomic-like matrix element terms m L that vary slowly with energy, and angular-momentum-resolved densities of states ρ L( E ) that represent the near-edge fine structure.
d 2 I
d dE =
4γ 2
a20
[|m L+1|2ρ L+1( E ) + |m L−1|
2ρ L−1( E )], 2.
where m L±1 = f L±1|r |i L. The separation is not unique, and the density of states is not uniquely
defined. This can have significant consequences when one is comparing experimental spectra with
theory or attempting to measure charge transfers (25). A more sophisticated analysis, given inthe appendix, shows how the scattering wave vector can select different orbitals in anisotropicmaterials (26). If the symmetry at the site of the excited atom is lower than orthorhombic, the
strict separation implied by Equation 2 no longer applies, and there is a possibility of mixing of the contribution from different orbitals (24).
For K shell excitations (or any excitation from an s subshell), only transitions to p states of angular momentum 1 + 1 are possible. In general, transitions in which the angular momentum
quantum number changes by both plus and minus one should be considered. In the case of L23 (2 p)transitions there are contributions to the near-edge structure from both s and d local densities of
states, although the s contribution is negligible for transition elements because the matrix elementis so much less than the corresponding matrix element for transitions to d states. For p-block
elements such as Al and Si, both the s and d densities make significant contributions. The problem of calculating near-edge structure then reduces to selecting a method of
electronic-structure calculation that gives the relevant local angular-momentum-projected den-
sity of states. All modern methods for determining electronic structure rely on DFT to simplify the many-electron Schr odinger equation and instead solve for a ground-state charge density, n(r ),
which is expressed as a sum of orthonormal functions.
n(r ) =
ψ∗i (r )ψi (r ). 3.
www.annualreviews.org • Electron Energy Loss Near-Edge Fine Structure 537
8/3/2019 1_The Theory and Interpretation of Electron Energy Loss Near-Edge Fine Structure
http://slidepdf.com/reader/full/1the-theory-and-interpretation-of-electron-energy-loss-near-edge-fine-structure 4/26
LDA: local density approximation
GGA: generalizedgradientapproximation
The many-electron Schr odinger equation becomes the Kohn-Sham equations (27),−
h2
2m∇2 +
N α=1
Z αe2
4πε0 |r − R α|+
e 2
4πε0 |r − r |d 3r +
δ E XC [n(r )]
δn(r )
ψi = εi ψi ,
where the second term represents the contribution from the nuclei; the third term, called t
Hartree energy, describes the direct Coulomb interactions between electrons; and the fourterm is the exchange and correlation energy, which is a functional (a function of a function)
the electron density. Although superficially the Kohn-Sham equations resemble a series of onelectron Schr odinger equations, they are in fact the exact solution to the many-electron problefor the ground state.
In practice, densities of states are calculated by first calculating the self-consistent Kohn-Shground-state charge density. A potential is constructed according to Equation 4, and the ener
eigenvalues and eigenfunctions are then determined. The density of states can be calculated eitfrom the band structure or by using Greens function methods. A theoretical objection to th
procedure is that the Kohn-Sham equations are valid only for the occupied ground state. Usithem to calculate eigenvalues and eigenvectors that are identified as wave functions for unoccup
states is a leap of faith that ultimately can be justified only by agreement with experiment. Theralso the practical detail of how to calculate the exchange and correlation energies. In most calc
lations it is assumed that the electron density varies slowly enough that the exchange-correlatiterm for the solid can be replaced by the corresponding value for a free-electron gas with the sam
local density—the local density approximation (LDA). Corrections can be added by considerithe gradients of the electron density (the generalized gradient approximation, or GGA), but t
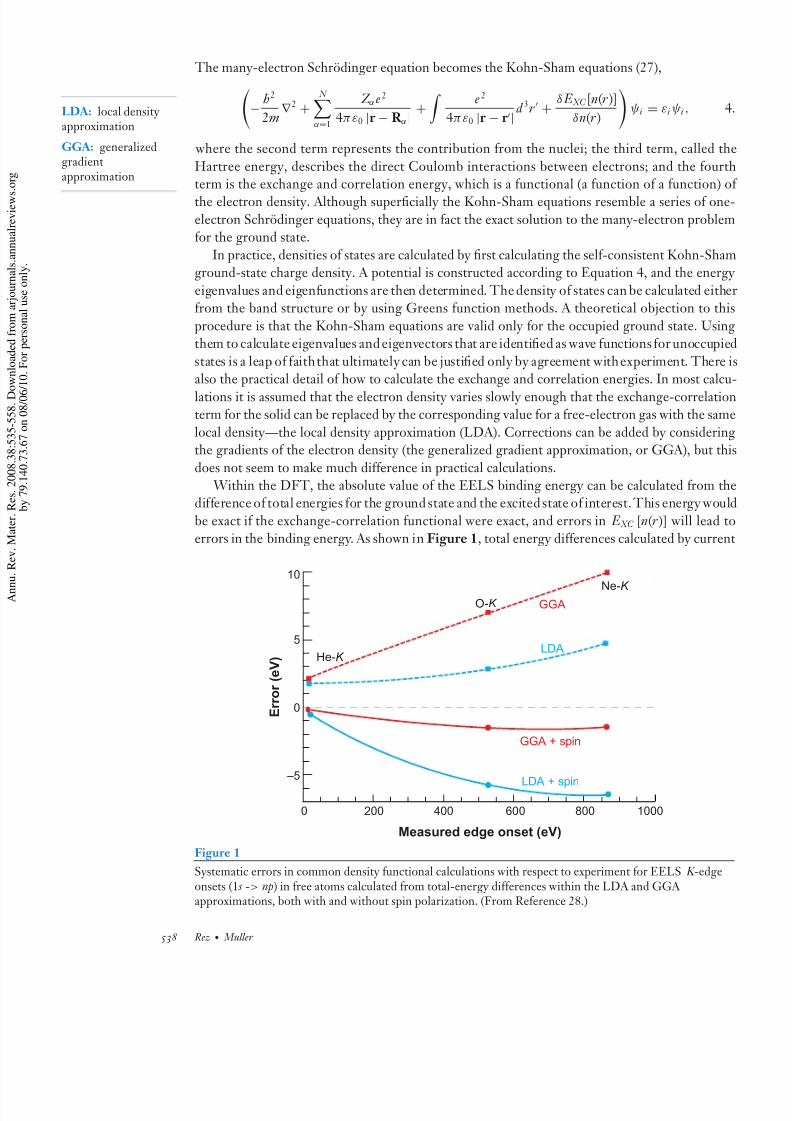
does not seem to make much difference in practical calculations. Within the DFT, the absolute value of the EELS binding energy can be calculated from t
difference of total energies for the ground state and the excited state of interest. This energy wou
be exact if the exchange-correlation functional were exact, and errors in E XC [n(r )] will leaderrors in the binding energy. As shown in Figure 1, total energy differences calculated by curre
E r r o r ( e V )
10
5
0
–5
2000
Measured edge onset (eV)
400 600 800 1000
He-K
O-K GGANe-K
LDA
GGA + spin
LDA + spin
Figure 1
Systematic errors in common density functional calculations with respect to experiment for EELS K -edgeonsets (1 s -> np) in free atoms calculated from total-energy differences within the LDA and GGA approximations, both with and without spin polarization. (From Reference 28.)
538 Rez · Muller

8/3/2019 1_The Theory and Interpretation of Electron Energy Loss Near-Edge Fine Structure
http://slidepdf.com/reader/full/1the-theory-and-interpretation-of-electron-energy-loss-near-edge-fine-structure 5/26
(L)MTO: (linearizemuffin tin orbital
FLAPW: full-potential linearizedaugmented plane wa
density functional calculations can predict core-level EELS onsets to a precision of 1–5 eV. Most
of the error is in the treatment of exchange and correlation at the core hole. Because the core holeis strongly localized, these errors have very little environmental dependence. As a consequence,relative core-level shifts for the same species of atom in different systems can be calculated quite
precisely, even when the absolute binding energy cannot be calculated (28). The total-energy-difference approach is computationally demanding because a new self-
consistent calculation is required for every excited state. This can be reduced slightly by the
use of Slater’s transition-state rule, for which the eigenvalue difference between initial and finalstates in a single self-consistent calculation with a half core hole will give a result within a fractionof an electron volt to the total-energy-difference calculation (29–31). This approach will rigor-
ously describe the full EELS spectrum only if it is rerun self-consistently for every final state, not just the onset energy.
Because it is so challenging to calculate the true total energies, it is desirable to have a way of calculating energy differences from the Kohn-Sham eigenvalues. It can be shown that the
Kohn-Sham eignevalues are the first derivatives of the total energy E tot with respect to occupationnumber ni , e.g., ∂ E to t
∂ni = εi , and the eigenvalue difference is only the leading term in a Taylor
series expansion of the EELS excitation (29, 30). As a consequence, the core-level shift can bepredicted from the difference between the initial and final ground-state Kohn-Sham eigenvalues,
provided that the local environments for the atoms are similar. A rough criterion for predicting theerror in core-level shifts estimated from ground-state eigenvalues is that the electronegativities of
the environments being compared be similar—roughly a 1-eV error for every 0.25 difference inelectronegativity of the neighboring atom for the O- K edge (28). As an example, this rule suggeststhat the ground-state eigenvalues are a poor predictor of the core-level shift for Si atoms at the
Si-SiO2 interface because the neighboring Si atoms are systematically replaced by oxygen (with a1.54 electronegativity difference per Si = O substitution). However, the ground-state eigenvalues
should be a good approximation for the O- K core-level shift because each oxygen atom always hastwo Si nearest neighbors. It is only their second neighbors that change.
The practical difficulties of solving the Kohn-Sham equations all stem from the deep potential wells from the positively charged nuclei. Techniques that work well for spherically symmetric
Coulomb potentials are notwell suited to the relativelyflat potentials that characterize the bondingbetween atoms. There are two general approaches to overcoming this difficulty.
Oneway is to partition the material into atomic-like spheres aroundthe atom sites called muffintins, and an interstitial region in between. The Kohn-Sham equations are then solved separately
in the two regions (augmentation), and the solutions are matched on the boundary. If plane wavesare used for the interstitial region, it is an augmented plane wave (APW) method (32); spherical
waves form the basis of the muffin tin orbital (MTO) (33) method. A problem with augmentationis that it is potentially very expensive computationally because a large matrix must be diagonalizedfor a number of energies. Andersen’s (33) linearization scheme circumvents this problem, but the
linearization approximation is valid for only a small range of energies about the linearization point(generally the center of the valence band), and results more than approximately 10 eV above the
Fermi level should not be trusted. A solution is to solve with different energy panels with differentlinearization points or by the judicious addition of local orbitals (34).
Augmentation methods are called full potential when the interstitial potential is expanded asa Fourier series. In contrast, the potential is assumed to be a constant (flat) potential between
the atomic muffin tin spheres. Putting all these developments together gives the full-potentiallinearized augmented plane wave method (FLAPW), which is available as the Wien package (32).
Hebert (35) has recently published a comprehensive review of how to use the Wien package forEELS fine-structure calculations.
www.annualreviews.org • Electron Energy Loss Near-Edge Fine Structure 539
8/3/2019 1_The Theory and Interpretation of Electron Energy Loss Near-Edge Fine Structure
http://slidepdf.com/reader/full/1the-theory-and-interpretation-of-electron-energy-loss-near-edge-fine-structure 6/26
FEFF: F EFFective
XANES: X-ray absorption near-edgestructure
(TD)DFT:
(time-dependent)density functionaltheory
A solution could be constructed by assuming that the muffin tins are scattering centers
electron waves. The strength of the scattering is given by phase shifts in a partial wave expansioand the propagation from one site to the next is represented by a Greens function (36, 37). Tprocedure has been very popular in near-edge structure theory because it corresponds to spheri
wave EXAFS in the single scattering limit (38, 39). In the original cluster Greens function thories, potentials were constructed by simply overlapping atomic potentials without any attem
at reaching self-consistency to account for charge redistribution resulting from bonding. To co
struct the Greens function representing the fine structure, a matrix of dimension N ∗
l , where Nthe number of atoms in the cluster and l the number of partial waves, must be inverted. In earl versions of the F EFFective (FEFF) code, selection criteria were used to eliminate many of t
scattering paths (38); in the X-ray absorption near-edge structure (XANES) code, the clusterdivided into shells, and scattering within a shell (intrashell scattering) is treated separately fro
scattering between the shells (intershell scattering) (37). The latest version of the FEFF co(FEFF8) (40) allows for self-consistent calculation of the potential and also does a full mat
inversion for all scattering among atoms within an inner cluster. One very special feature of versions of FEFF is that they use either a Dirac-Hara or a Hedin-Lundquist expression for t
exchange correlation for the excited state rather than rely on ground-state expressions. When uto calculate electronic structure of a solid, as opposed to a cluster, the Greens function techniq
is known as the KKR (Korringa-Kohn-Rostoker) method. Moreno et al. (41) recently publisha review of the application of FEFF to EELS fine-structure calculations, along with much useinformation on practical difficulties.
The other main approach to dealing with the problems caused by the deep Coulomb potetials from the nuclei is based on replacing these potentials by other slowly varying potentia
called pseudopotentials, that give eigenfunctions of the same energy. Instead of oscillating rapidthe wave function becomes nodeless in the region of the ion core. The simplest way to der
pseudopotentials is to orthogonalize plane waves in the vicinity of the nucleus to the core statPseudopotential codes are usually based on a plane wave expansion of the wave function (4
which means that the appropriate angular-momentum-resolved densities of states at a particusite have to be projected from the wave function. The popular VASP code has this feature (4
There are pseudopotential methods based on atomic orbital expansions (44), but the expansifor final states is incomplete at high energies above threshold. A significant advantage of pla
wave pseudopotential methods is that they can easily be generalized to account for interatomforces and can be used to determine minimum-energy structures of defects.
A calculation using one of the standard techniques of solid-state physics will not produunoccupied states appropriate for an excited atom with a hole in a core level. The Greens functi
cluster methods are best suited to take into account the core hole. Frequently it can be assumthat a core hole is equivalent to increasing the nuclear charge by one (the Z + 1 approximatio The only way to account properly for core holes within the framework of one of the standa
solid-state codes is to use a supercell with the excited atom at the center. Even these approachare an approximation and, if anything, tend to exaggerate the effects of the core hole. There h
been much research in the past few years on improved descriptions of the way the electronsthe solid respond to the presence of a core hole, either starting from the Bethe-Salpeter equatio
describing interactions of electron hole pairs (45), or using time-dependent density functiontheory (TDDFT) as a way of describing the frequency response (46) of the system. In we
screened systems such as metals or anions in ionic materials, core holes have little effect at ∼1-energy resolution, and it is quite acceptable to use the density of states from standard solid-sta
codes.
540 Rez · Muller

8/3/2019 1_The Theory and Interpretation of Electron Energy Loss Near-Edge Fine Structure
http://slidepdf.com/reader/full/1the-theory-and-interpretation-of-electron-energy-loss-near-edge-fine-structure 7/26
METALS
Core holes in metals are well screened because, by definition, charge moves freely. It is there-
fore perfectly acceptable to use the density of states from standard solid-state-physics codes tounderstand features in the near-edge structure. Free-electron metals are uninteresting from a
fine-structure point of view. The total density of states is parabolic with a few minor features,owing to Van Hove singularities, where a Brillouin zone boundary is reached at a particular en-
ergy (see Figure 2 a for Al). It is very doubtful that such small features would be observed in the
average EELS experiment. Now let us make a decomposition in terms of states of different angularmomentum. As the energy increases, states of higher angular momentum dominate (Figure 2b).Returning to Equation 2, the differential cross section representing the measured EELS spectrum
D O S ( e e V – 1 )
I n t e n s i t y ( a r b . u n i t s )
0.6
0.4
0.2
0
0.3
0.2
0.1
0
Energy loss (eV)
60 65 70 75 80 85
Experiment
Simulation
AI DOS
Free electron
b
a
c
Energy (eV) –10 –5 0 5 10 15
s
p
d
D
O S ( e e V – 1 )
Figure 2
(a) Total density of states (DOS) for Al. (b) Contributions from final states of s , p, and d symmetry to the totalDOS and the corresponding s , p, and d states for a free-electron gas. (c ) Theoretical and experimental Al L23
edge.
www.annualreviews.org • Electron Energy Loss Near-Edge Fine Structure 541
8/3/2019 1_The Theory and Interpretation of Electron Energy Loss Near-Edge Fine Structure
http://slidepdf.com/reader/full/1the-theory-and-interpretation-of-electron-energy-loss-near-edge-fine-structure 8/26
is a combination of matrix elements and angular-momentum-resolved densities of states. The
L23 edge given as Figure 2c is a combination of transitions to s states near threshold and a brodelayed maximum at approximately 12 eV from transitions to d states.
The transition metals are very different because the d band dominates the density of stat
The band fills up as the atomic number increases. The best way to understand the behaviortransition metals is to use a tight-binding framework and appeal to the moments theorem
Cyrot-Lackmann that uses a local real-space picture to explain features in the density of sta
(47). The pth moment on site I is defined as
μ p I =
∞−∞
( E − ε I ) p n I ( E )dE ,
μ p I =
I 1, I 2− I p−1
( H − εi ) I , I 1( H − εi ) I 1, I 2
. . . ( H − εi ) I p−1, I .
The band width is related to the overlap integral
μ2 I =
I = I
| H I , I |2,
where H I , I
is the nearest-neighbor hopping integral. The closer the atoms are pushed togethor the less well bound the atomic d state, or the greater the number of nearest neighbors, t wider the band is. This trend can be seen in a plot of d band width against atomic numb
In the Cyrot-Lackmann picture this is the second moment of the density of states. The thmoment is a measure of the skewness of the density of states, and the fourth moment determin
whether the density of states is bimodal or unimodal. It can unambiguously be stated, using tCyrot-Lackmann theorem, that the width of the band is determined by nearest neighbors o
and that the magnitude of any dip at the center of the band is controlled by second neareneighbors.
Generally, alterations to the shape of bands caused by hybridization are far more importthan the miniscule charge transfers that take place in these systems. A particularly good example
the NiAl system (25), for which hybridization between Ni d and Al p orbitals creates a pseudogthat increases in size as the proportion of Al increases (Figure 3). The d density of states on theprogresses from a broad band with the Fermi level near the top of the band, to a narrow peak w
extended tails with the Fermi level lying in the extended tail (Figure 4). This can be interpreas a manifestation of the increase in the fourth moment. The shape of the energy loss spectru
(Figure 5) can easily be predicted if one remembers that the Ni L23 energy loss spectrum is local d density of states and that it changes from a sharp white in pure Ni to a more rounded sha
in NiAl. These ideas can be used to relate the observed changes in the EELS spectrum to changin cohesion brought about by B segregation to Ni-rich boundaries in Ni3 Al. Because the core h
is well screened and has negligible effect on the spectrum, one can go further and actually measuthe change in cohesive energy directly. The first moment is the average energy with respect to t
center of the band and is, by definition, zero.
0 =
E F
−∞
(ε − εd )nd (ε) +
∞ E F
(ε − εd )nd (ε) .
The first moment can be decomposed as two terms: The first term is the bond or cohesienergy, and the second term a moment of the unoccupied states or energy loss spectrum. Chan
in the second term as a probe is moved across a defect can then be used to estimate changes in tfirst term or cohesive energy (48). Although this procedure can give useful qualitative trends
542 Rez · Muller

8/3/2019 1_The Theory and Interpretation of Electron Energy Loss Near-Edge Fine Structure
http://slidepdf.com/reader/full/1the-theory-and-interpretation-of-electron-energy-loss-near-edge-fine-structure 9/26
s D
O S ( e – e V – 1 a t o m – 1 )
D e cr e a si n gNi c o or d
i n a t i on
151050 –5 –10
Energy (eV)
0
0.2
0.4
0.6
0.8
1
Ni s DOS
Al s DOS
Ni sNi
Al sNi3 Al
NiAl Al s
Ni s
Ni s
Al s
Ni3 Al
NiAl
Al
Figure 3
Al density of states (DOS) for Ni, Al, NiAl, and Ni3 Al, showing the formation of a pseudogap due to s -d hybridization. The pseudogap on the s state becomes more pronounced as it acquires more nearestneighbors with strong, narrow d states. (From Reference 25, with permission.)
is not very accurate because it relies on careful normalization above threshold to ensure that themoment of the unoccupied states converges.
COVALENT INSULATORS AND SEMICONDUCTORS
Concepts such as covalency and ionicity are useful for describing the qualitative chemical behaviorof elements but are very difficult to define quantitatively. There is no universal definition of what
constitutes charge transfer on forming a solid. Clearly, summing charges in muffin tin spheresdoes not work because the charge transfer is dependent on the sphere radii. Furthermore, there is
www.annualreviews.org • Electron Energy Loss Near-Edge Fine Structure 543

8/3/2019 1_The Theory and Interpretation of Electron Energy Loss Near-Edge Fine Structure
http://slidepdf.com/reader/full/1the-theory-and-interpretation-of-electron-energy-loss-near-edge-fine-structure 10/26
N i d
D O S
Energy (eV)
50 –5
Ni
Ni3 Al
NiAl
NiAl3
Fermi level
Figure 4
Layer Korringa-Kohn-Rostoker (LKKR) calculation of Ni d density of states (DOS) for NiAl3, NiAl, Ni3
and Ni. From Reference 72.
always the possibility of charge transfer to and from the interstitial region. Eventaking overlapp
Wigner-Seitz spheres that completely fill the unit cell results in arbitrary charges associated w
the atomic constituents, because the ratio of the radii is a free parameter. The general idea thbonds are highly directional in covalent materials with a buildup of charge between the atomsstill very useful.
The important semiconductors are all based on tetrahedral coordination arising from sp3 h
bridization along the bonding directions. The elemental semiconductors Si and Ge have the amond structure, whereas compound semiconductors such as GaAs and InP have the zincblen
structure. The simplest interpretation is then based on a tight-binding picture, with the transitiofrom the inner shell going to the antibonding states. This interpretation will not give all the fi
details of the variation of the fine structure but is useful in setting a general framework for an ysis. Graphite is a good example of the power of this approach. There are strong sp2-hybridiz
σ bonds between the atoms in a given sheet, with weaker π bonds between the sheets (Figure
The near-edge structure consists of a sharp peak arising from transitions to π
∗
states, followby the broader peak from σ∗ transitions (4, 49). Similar ideas can be used to explain features
related compounds such as hexagonal BN.
Near-edge structure studies can only be used selectively with semiconductors; for higherelements only L23 edges, which give information mainly on the physically uninteresting d stat
are accessible. In Si the Si L23 is very conveniently available at approximately 100 eV. This edga combination of s states near threshold and d states beyond approximately 5 eV, so any attem
to match experiment should compare with an appropriately weighted combination of these sta
544 Rez · Muller

8/3/2019 1_The Theory and Interpretation of Electron Energy Loss Near-Edge Fine Structure
http://slidepdf.com/reader/full/1the-theory-and-interpretation-of-electron-energy-loss-near-edge-fine-structure 11/26
G . O . S
( e
– e V – 1 a t o m – 1 )
M or eNi -A
l b on d s
0.2
0.1
0
0.2
0.1
0
0.2
0.1
0
0.3
Energy (eV)
50 –5 10 15
Ni
Ni3 Al
NiAlMeasured
Calculated
Figure 5
Simulated Ni L3 spectra (Ni d density of states above the Fermi level) compared with experiment for NiAl,
Ni3 Al, and Ni. G.O.S. denotes generalized oscillator strength.
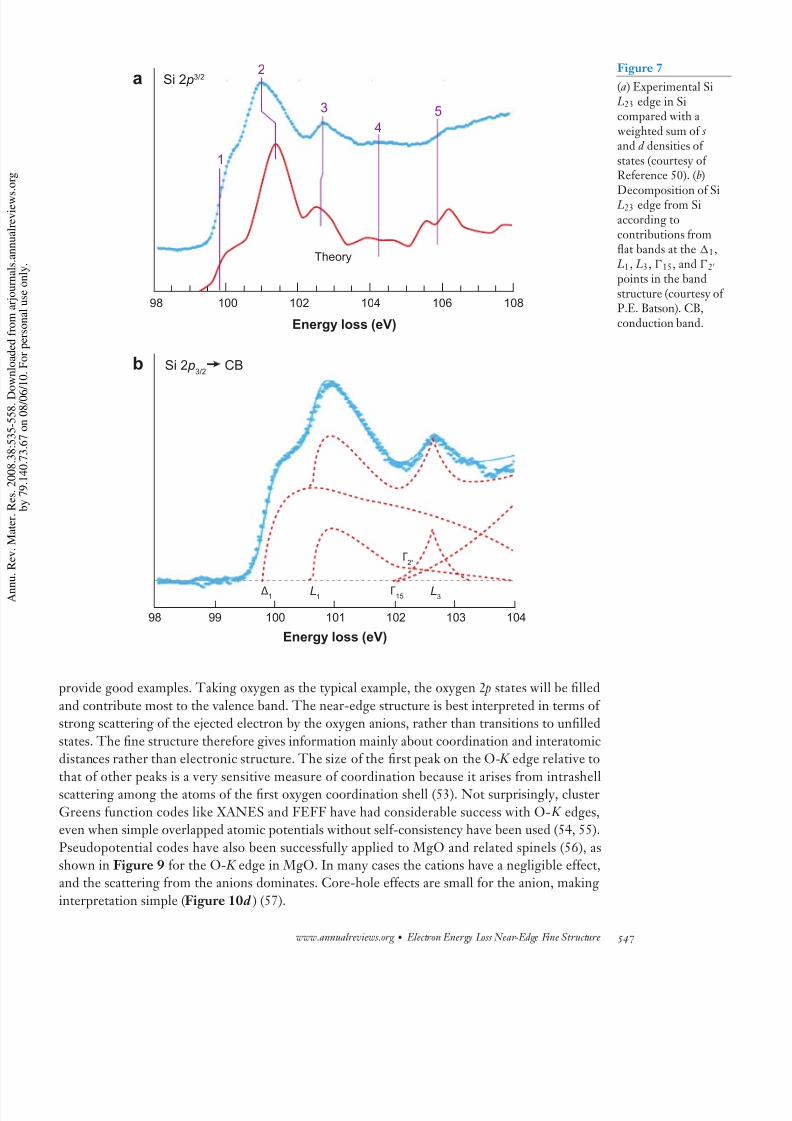
(50) (Figure 7 a). Of course, most of the bonding (and antibonding) states are p like and are not
accessible by dipole transitions.In most semiconductor studies it is desirable to relate the near-edge structure to features in
the band structure. Calculated band structures are an important first step, and for semiconduc-tors pseudopotential methods give excellent results, although FLAPW calculations can be just as
www.annualreviews.org • Electron Energy Loss Near-Edge Fine Structure 545

8/3/2019 1_The Theory and Interpretation of Electron Energy Loss Near-Edge Fine Structure
http://slidepdf.com/reader/full/1the-theory-and-interpretation-of-electron-energy-loss-near-edge-fine-structure 12/26
275 280 285 290 295 300 305 310
Energy loss (eV)
20
15
10
5
0
C o u n t s ( × 1 0 – 3 )
15
16
17
18
∏* σ*
0.7 eV
293 294 295
Energy loss (eV)
C o u n t s ( × 1 0 – 3 )
Figure 6Experimentally measured C- K edge from graphite, showing the π
∗ and σ∗ peaks. Because the π
∗ and σ∗
bonds have orthogonal orientations, the ratio of π ∗ to σ∗ is very sensitive to the sample orientation and th
optical conditions. Recorded on a 100-kV VG-STEM with ∼10-mrad convergence angle and ∼2-mradcollection angle.
effective. The density of states is in general given by
n( E ) =
S n ( E )
1
|∇ E n|
d S
4π3,
which means that peaks come from flat regions of the band structure. Batson (1) has identified t
first three Si L23 fine-structure peaks with the contributions from flat parts of the band structu
(Figure 7b) and has shown how these peaks change in Si/Ge alloys.Ceramics such as BN, SiC, and the transition-metal carbides and nitrides are also examp
of covalent insulators. The fine structures have been successfully simulated through the useboth pseudoatomic orbital (51) and the FEFF8 cluster Greens function code for the light-elem
ceramics (see Figure 8 for Feff8 calculation of the B- K edge in BN) and both FLAPW and FEFfor the carbon edge in the transition-metal carbides (34). Self-consistency is important to achie
good agreement with experiment. The core hole has a measurable effect close to threshold in many covalent materials. In Si
discrepancy between the ground-state calculation and the experimental result is noticeable with0.1 eV of threshold. The effects are more significant in diamond, for which a distinct exciton
peak is observed (52), and in the transition metal carbides there are some noticeable effects o
core hole within 1–2 eV of threshold.
IONIC INSULATORS
Strongly ionic materials are often thought of as being bound solely by the balance of electrosta
forces and can be described as an array of spherical ions in a simple structure such as rocksor CsCl. Oxides are the most common ionic materials, although fluorides and chlorides a
546 Rez · Muller
8/3/2019 1_The Theory and Interpretation of Electron Energy Loss Near-Edge Fine Structure
http://slidepdf.com/reader/full/1the-theory-and-interpretation-of-electron-energy-loss-near-edge-fine-structure 13/26
Energy loss (eV)
100 102 10498 99 101 103
98 100 102 104 106 108
Energy loss (eV)
a
b
1
2
3
4
5
Theory
Δ1 L1 Γ15 L3
Si 2 p3/2
Si 2 p3/2
CB
Γ2'
Figure 7
(a) Experimental Si L23 edge in Sicompared with a weighted sum of s and d densities of states (courtesy of Reference 50). (b)
Decomposition of Si L23 edge from Siaccording tocontributions fromflat bands at the 1,
L1, L3, 15, and 2
points in the bandstructure (courtesy oP.E. Batson). CB,conduction band.
provide good examples. Taking oxygen as the typical example, the oxygen 2 p states will be filled
and contribute most to the valence band. The near-edge structure is best interpreted in terms of strong scattering of the ejected electron by the oxygen anions, rather than transitions to unfilled
states. The fine structure therefore gives information mainly about coordination and interatomicdistances rather than electronic structure. The size of the first peak on the O- K edge relative to
that of other peaks is a very sensitive measure of coordination because it arises from intrashellscattering among the atoms of the first oxygen coordination shell (53). Not surprisingly, cluster
Greens function codes like XANES and FEFF have had considerable success with O- K edges,even when simple overlapped atomic potentials without self-consistency have been used (54, 55).
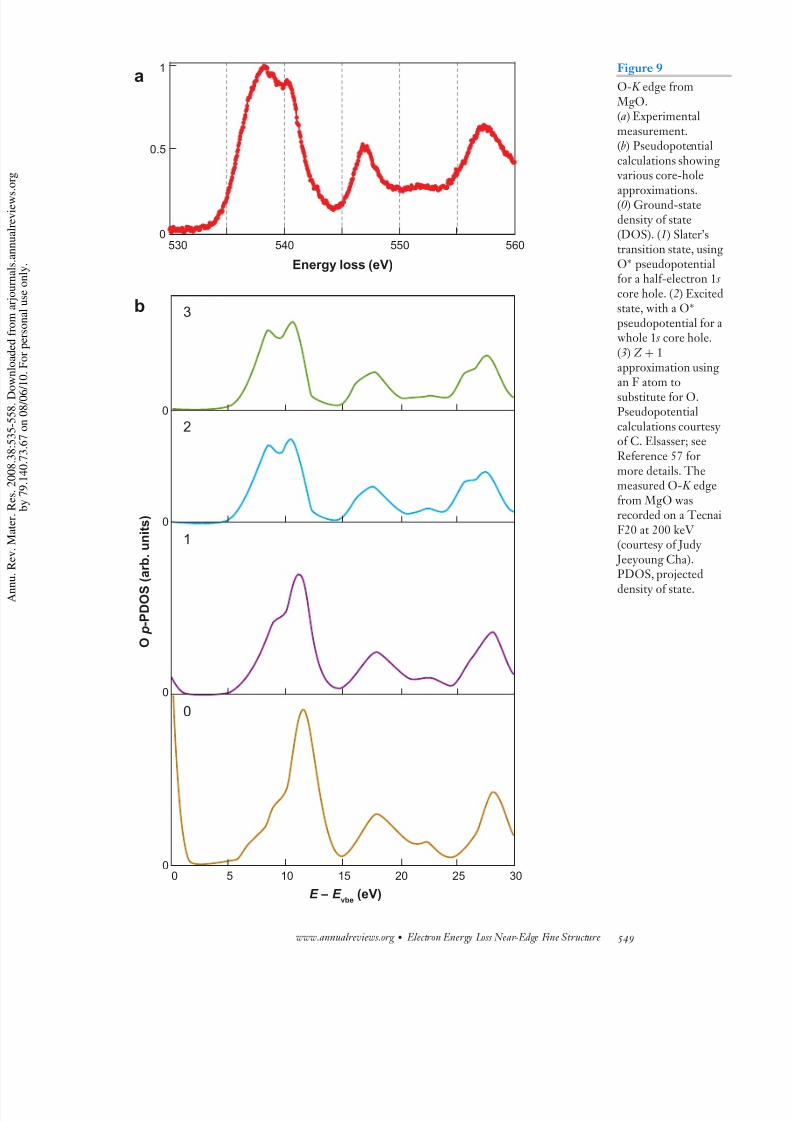
Pseudopotential codes have also been successfully applied to MgO and related spinels (56), asshown in Figure 9 for the O- K edge in MgO. In many cases the cations have a negligible effect,and the scattering from the anions dominates. Core-hole effects are small for the anion, making
interpretation simple (Figure 10d ) (57).
www.annualreviews.org • Electron Energy Loss Near-Edge Fine Structure 547

8/3/2019 1_The Theory and Interpretation of Electron Energy Loss Near-Edge Fine Structure
http://slidepdf.com/reader/full/1the-theory-and-interpretation-of-electron-energy-loss-near-edge-fine-structure 14/26
170 180 190 200 210 220 230 240
Energy (eV)
1
0
N o r m a l i z e d a
b s o r p t i o n
2
3
4
5
6
7
8
250
Data
μ
μ0
Figure 8 Multiple scattering calculation of the B- K edge in cubic BN (line marked μ ), using the FEFF code compar with experimental measurements (dots ). The line marked μ 0 is the calculated spectrum that would have beexpected from an isolated atom. The near-edge and extended fine structures can be considered asmodulations superimposed on the atomic result (courtesy of J.J. Rehr; see Reference 40).
The picture for the cation edge is very different. Once again, strong multiple scattering amothe anions dominates, giving a near-edge structure that is mainly related to structure. Howev
this time the core hole has a very significant effect, especially on the strength of the first pea within 5–10 eV of threshold (see Figure 10 for Si in SiO2). It is absolutely essential to inclu
core holes in the calculation, and the cluster Greens function methods do this without difficul
For band structure methods, large supercells are needed (57, 58). A simple interpretation wousuggest that the core hole deepens the potential on the cation, allowing for a more compact sta with appropriate p-like symmetry that has a greater overlap with the 1 s inner-shell level and
also lower in energy. This would both shift the peak to lower energies and increase the peak siRemoval of a 1 s electron from a very light element such as Li would appear to make a grea
difference than removing a 1 s electron from a heavier element, leading to a greater core-heffect (18).
Most compounds are neither covalent nor ionic but are a combination of the two. The fi
structure shows features that can be understood if both models are used. There is oftenan extendstructure that is best interpreted in terms of EXAFS or ejected electron scattering and a regi
closer to threshold that is best explained in terms of molecular orbitals or tight binding. T
fine structure of the various oxides of TiO2 provides some excellent examples (59, 60). The thpeaks at 9 eV, 14 eV, and 18 eV above the threshold of the O- K edge arise from ejected electrscattering. The sharp doublet at threshold, which also appears on the Ti L23 edge, comes fro
transitions to the t 2 g and, e.g., molecular orbitals that are a result of hybridization of titaniumand oxygen p orbitals.
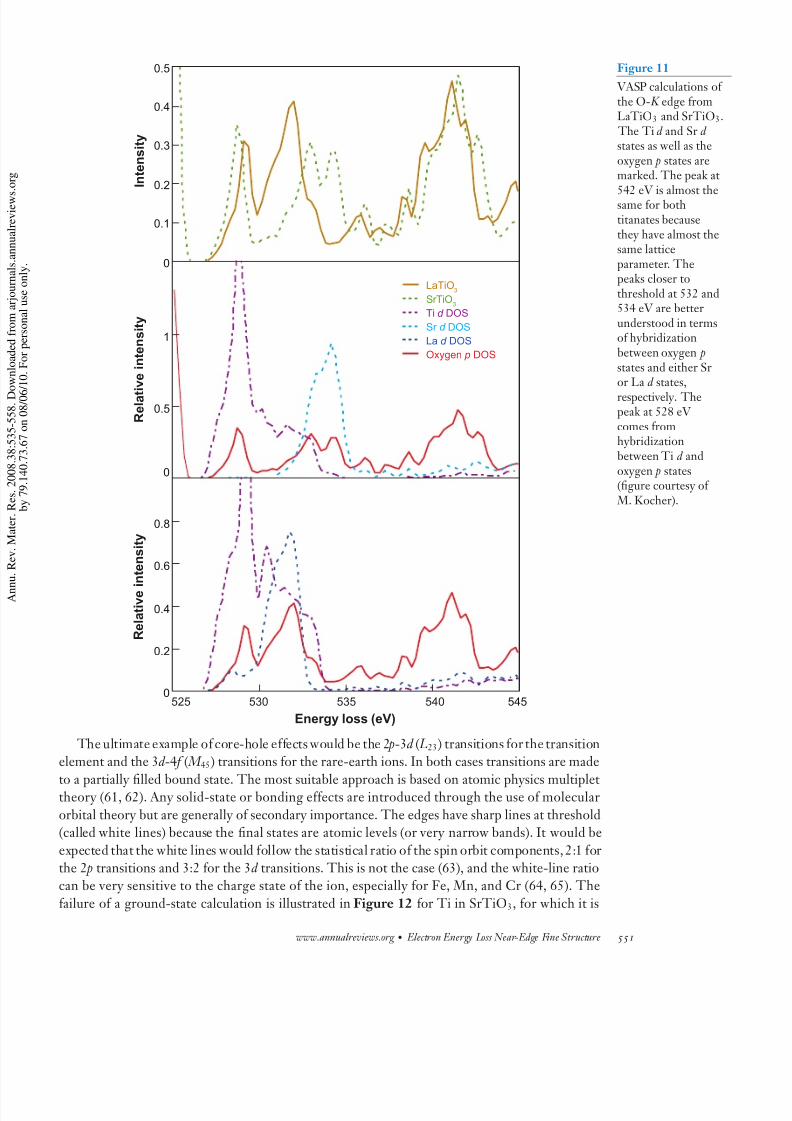
Another example is the differences in the O- K edge spectra from LaTiO3 and SrTiO3. Becauthe lattice parameters are almost identical, the peaks at 542 eV from ejected electron scattering
very similar. The subtle 1-eV difference is a manifestation of the extreme sensitivity of extend
548 Rez · Muller
8/3/2019 1_The Theory and Interpretation of Electron Energy Loss Near-Edge Fine Structure
http://slidepdf.com/reader/full/1the-theory-and-interpretation-of-electron-energy-loss-near-edge-fine-structure 15/26
0 5 10 15 20 25 30
E – E vbe
(eV)
0
0
0
0
a
b
1
0.5
0
O
p - P D O S
( a r b . u n i t s )
3
2
1
0
Energy loss (eV)
530 540 550 560
Figure 9
O- K edge from MgO.(a) Experimentalmeasurement.(b) Pseudopotentialcalculations showing various core-hole
approximations.(0) Ground-statedensity of state(DOS). (1) Slater’stransition state, usinO∗ pseudopotentialfor a half-electron 1 score hole. (2) Excitestate, with a O∗
pseudopotential for whole 1 s core hole.(3) Z + 1approximation usingan F atom tosubstitute for O.Pseudopotentialcalculations courtesyof C. Elsasser; seeReference 57 formore details. Themeasured O- K edgefrom MgO wasrecorded on a TecnaF20 at 200 keV (courtesy of Judy Jeeyoung Cha).PDOS, projected
density of state.
www.annualreviews.org • Electron Energy Loss Near-Edge Fine Structure 549
8/3/2019 1_The Theory and Interpretation of Electron Energy Loss Near-Edge Fine Structure
http://slidepdf.com/reader/full/1the-theory-and-interpretation-of-electron-energy-loss-near-edge-fine-structure 16/26
Energy (eV)
0 10 20 30 40
I n t e
n s i t y
0.2
0.15
0
b
a
0.1
0.05
2.4
2
1.6
1.2
0.8
0.4
0
p - D O S ( e E V – 1 )
Z + 1
Z
Experiment
Edge
onset
0 5 10 15 20
Energy (eV)
1
2
3
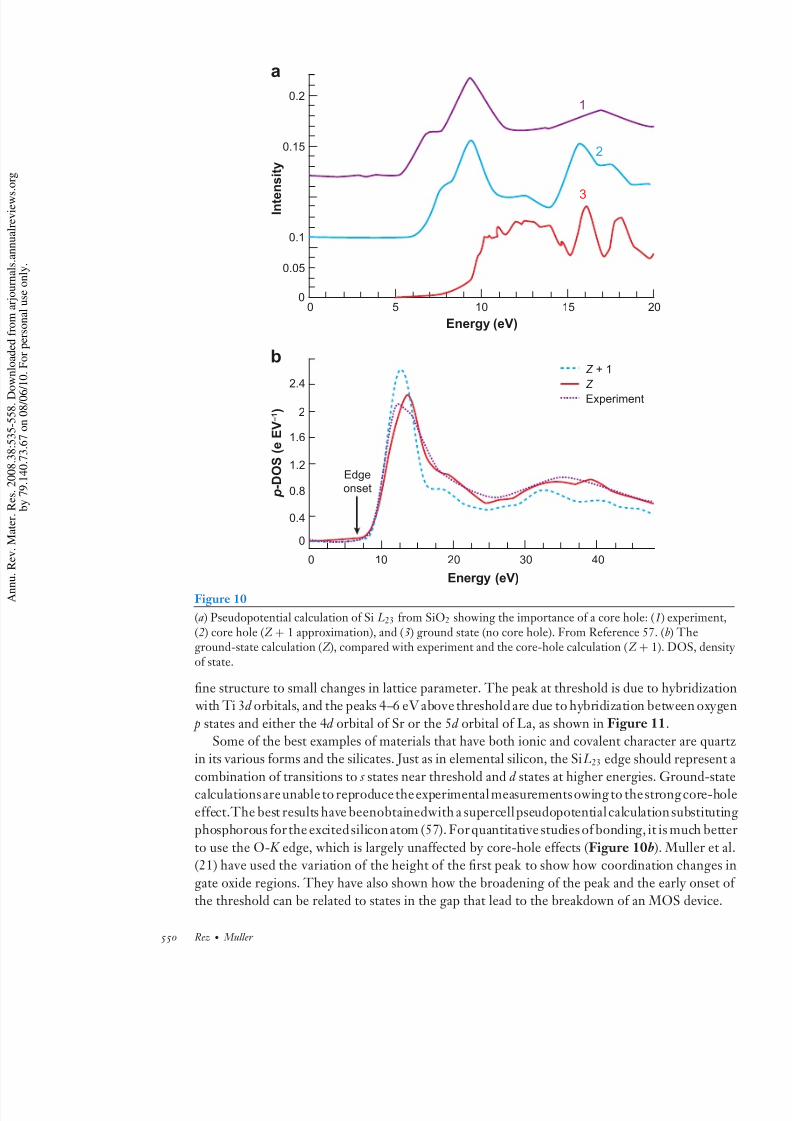
Figure 10
(a) Pseudopotential calculation of Si L23 from SiO2 showing the importance of a core hole: (1) experimen(2) core hole (Z + 1 approximation), and (3) ground state (no core hole). From Reference 57. (b) Theground-state calculation (Z ), compared with experiment and the core-hole calculation (Z + 1). DOS, denof state.
fine structure to small changes in lattice parameter. The peak at threshold is due to hybridizati with Ti 3d orbitals, and the peaks 4–6 eV above threshold are due to hybridization between oxyg
p states and either the 4d orbital of Sr or the 5d orbital of La, as shown in Figure 11.Some of the best examples of materials that have both ionic and covalent character are qua
in its various forms and the silicates. Just as in elemental silicon, the Si L23 edge should represencombination of transitions to s states near threshold and d states at higher energies. Ground-stcalculationsareunable to reproduce theexperimental measurementsowing to thestrong core-h
effect.The best results have beenobtainedwith a supercellpseudopotentialcalculation substitutphosphorous for the excitedsilicon atom (57). For quantitative studies of bonding, it is much bet
to use the O- K edge, which is largely unaffected by core-hole effects (Figure 10b). Muller et(21) have used the variation of the height of the first peak to show how coordination changes
gate oxide regions. They have also shown how the broadening of the peak and the early onsetthe threshold can be related to states in the gap that lead to the breakdown of an MOS device
550 Rez · Muller
8/3/2019 1_The Theory and Interpretation of Electron Energy Loss Near-Edge Fine Structure
http://slidepdf.com/reader/full/1the-theory-and-interpretation-of-electron-energy-loss-near-edge-fine-structure 17/26
0
0.1
0.2
0.3
0.4
0.5
0
0.5
1
0
0.2
0.4
0.6
0.8
I n t e n s i t y
R e l a t i v e i n t e n s i t y
R e l a t i v e i n t e n s i t y
545540535530525
Energy loss (eV)
Oxygen p DOS
Sr d DOS
La d DOS
Ti d DOS
LaTiO3
SrTiO3
Figure 11
VASP calculations othe O- K edge fromLaTiO3 and SrTiO3
The Ti d and Sr d states as well as theoxygen p states aremarked. The peak at
542 eV is almost thesame for bothtitanates becausethey have almost thesame latticeparameter. Thepeaks closer tothreshold at 532 and534 eV are betterunderstood in termsof hybridizationbetween oxygen pstates and either Sror La d states,respectively. Thepeak at 528 eV comes fromhybridizationbetween Ti d andoxygen p states(figure courtesy of M. Kocher).
The ultimate example of core-hole effects would be the 2 p-3d ( L23) transitions for the transitionelement and the 3d -4 f ( M 45) transitions for the rare-earth ions. In both cases transitions are made
to a partially filled bound state. The most suitable approach is based on atomic physics multiplettheory (61, 62). Any solid-state or bonding effects are introduced through the use of molecular
orbital theory but are generally of secondary importance. The edges have sharp lines at threshold(called white lines) because the final states are atomic levels (or very narrow bands). It would be
expected that the white lines would follow the statistical ratio of the spin orbit components, 2:1 forthe 2 p transitions and 3:2 for the 3d transitions. This is not the case (63), and the white-line ratiocan be very sensitive to the charge state of the ion, especially for Fe, Mn, and Cr (64, 65). The
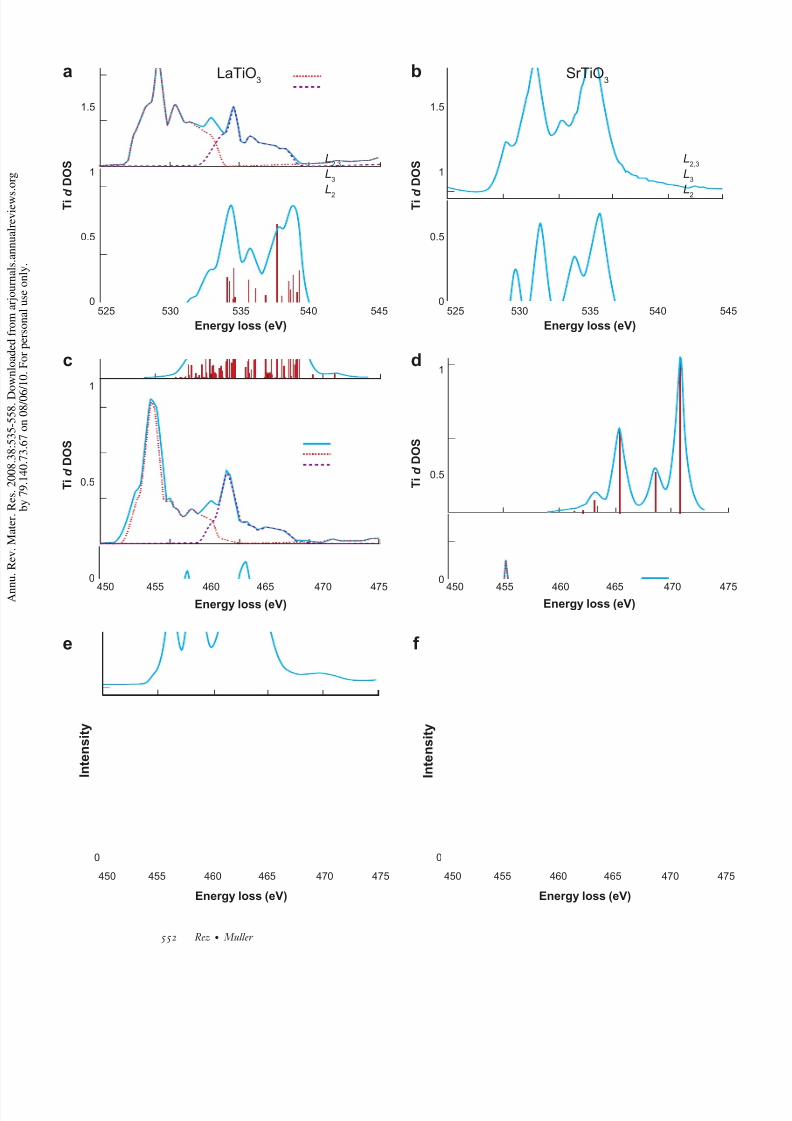
failure of a ground-state calculation is illustrated in Figure 12 for Ti in SrTiO3, for which it is
www.annualreviews.org • Electron Energy Loss Near-Edge Fine Structure 551
8/3/2019 1_The Theory and Interpretation of Electron Energy Loss Near-Edge Fine Structure
http://slidepdf.com/reader/full/1the-theory-and-interpretation-of-electron-energy-loss-near-edge-fine-structure 18/26
a
c
e
I n t e n s i t y
T i d
D O S
0
1
0.5
0
b
d
f
I n t e n s i t y
0
T i d
D O S
1
0.5
0
1.5
525 530 535 540 545
Energy loss (eV)
T i d
D O S
1
0.5
0
1.5
T i d
D O S
1
0.5
0
525 530 535 540
Energy loss (eV)
Energy loss (eV) Energy loss (eV)450 455 460 465 470 475 450 455 460 465 470
Energy loss (eV)Energy loss (eV)
450 455 460 465 470 475 450 455 460 465 470
SrTiO3
LaTiO3
L2
L3
L2,3
L2
L3
L2,3
552 Rez · Muller
8/3/2019 1_The Theory and Interpretation of Electron Energy Loss Near-Edge Fine Structure
http://slidepdf.com/reader/full/1the-theory-and-interpretation-of-electron-energy-loss-near-edge-fine-structure 19/26
0
Energy loss (eV)
705 710 715 720 725 730
0
0.05
0.1
0.15
0.2
0.25
0.1
0.2
0.3
0.4
I n t e n s i t y
I n t e n s i t y
Fe2+
Fe3+
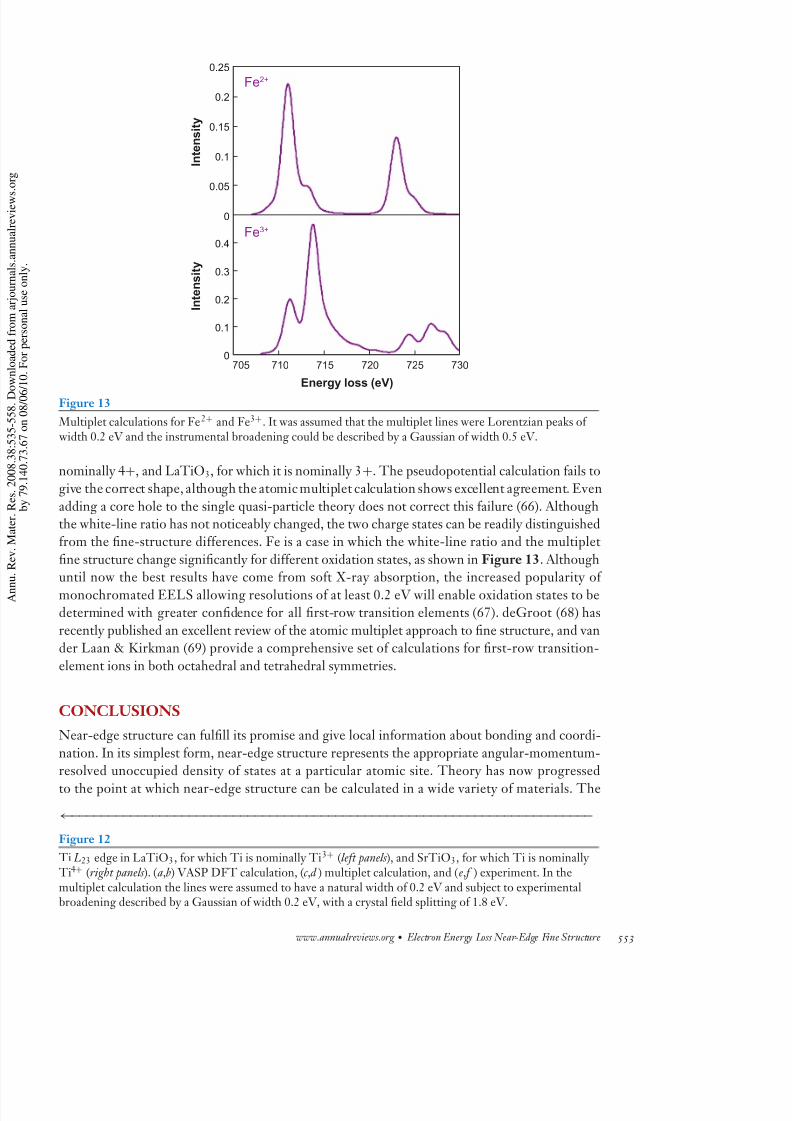
Figure 13
Multiplet calculations for Fe2+ and Fe3+. It was assumed that the multiplet lines were Lorentzian peaks of width 0.2 eV and the instrumental broadening could be described by a Gaussian of width 0.5 eV.
nominally 4+, and LaTiO3, for which it is nominally 3+. The pseudopotential calculation fails togive the correct shape, although the atomic multiplet calculation shows excellent agreement. Even
adding a core hole to the single quasi-particle theory does not correct this failure (66). Althoughthe white-line ratio has not noticeably changed, the two charge states can be readily distinguishedfrom the fine-structure differences. Fe is a case in which the white-line ratio and the multiplet
fine structure change significantly for different oxidation states, as shown in Figure 13. Althoughuntil now the best results have come from soft X-ray absorption, the increased popularity of
monochromated EELS allowing resolutions of at least 0.2 eV will enable oxidation states to bedetermined with greater confidence for all first-row transition elements (67). deGroot (68) has
recently published an excellent review of the atomic multiplet approach to fine structure, and vander Laan & Kirkman (69) provide a comprehensive set of calculations for first-row transition-
element ions in both octahedral and tetrahedral symmetries.
CONCLUSIONS
Near-edge structure can fulfill its promise and give local information about bonding and coordi-
nation. In its simplest form, near-edge structure represents the appropriate angular-momentum-resolved unoccupied density of states at a particular atomic site. Theory has now progressed
to the point at which near-edge structure can be calculated in a wide variety of materials. The
←−−−−−−−−−−−−−−−−−−−−−−−−−−−−−−−−−−−−−−−−−−−−−−−−−−−−−−−−−−−−−−−−−−−−−−−
Figure 12
Ti L23 edge in LaTiO3, for which Ti is nominally Ti3+ (left panels ), and SrTiO3, for which Ti is nominally Ti4+ (right panels ). (a,b) VASP DFT calculation, (c ,d ) multiplet calculation, and (e, f ) experiment. In themultiplet calculation the lines were assumed to have a natural width of 0.2 eV and subject to experimentalbroadening described by a Gaussian of width 0.2 eV, with a crystal field splitting of 1.8 eV.
www.annualreviews.org • Electron Energy Loss Near-Edge Fine Structure 553

8/3/2019 1_The Theory and Interpretation of Electron Energy Loss Near-Edge Fine Structure
http://slidepdf.com/reader/full/1the-theory-and-interpretation-of-electron-energy-loss-near-edge-fine-structure 20/26
LCAO: linearcombination of atomicorbitals
ingredients of a successful calculation include a core hole and self-consistent potentials to take a
count of electronic structure due to changes in bonding. Not all effects are equally important incases, and although Greens function methods with self-consistent potentials that include the cohole (FEFF8) can handle a large variety of problems, there are still cases in which pseudopotent
methods give results that more closely match experiment. Simple tight binding [LCAO (lincombination of atomic orbitals)] or molecular orbital methods can provide a useful framework
interpreting the gross changes in near-edge structure.
Quantitative analysis of near-edge structure is confined to those cases in which core-hoeffects are minimal, such as metals and the anions of ionic materials. In transition metals, changin the cohesive energy can be calculated from the spectrum through the use of the first mome
For anions in ionic materials the height of the first peak arising from intrashell scattering, whcompared withotherhigher-energypeaks,can give useful information on coordination. Just as w
extended fine structure, small shifts in the positions of the higher-energy peaks 20–40 eV abothreshold can give useful information on changes in interatomic distances. In semiconducto
the near-edge structure can be related to points in the band structure and changes monitorednear-atomic resolution.
Electron probes of atomic dimensions and high-resolution energy loss spectroscopy can shlight on the important materials problems of bonding at a local scale, especially when th
techniques are combined with suitable electronic-structure calculations.
APPENDIX
Because the excitation takes place at a particular atom, it is mathematically most convenient
use a spherical polar coordinate system. In general, the scattering cross section can be writtas a product of terms representing the excitation of the atomic inner shell and the multip
elastic scattering (dynamical diffraction) of the incoming and outgoing fast electrons. Becauthe characteristic scattering angle for inner shells with binding energies less than approximat
1 kV is much less than a typical Bragg angle, the processes are separable, and selecting any Braspot will produce almost identical spectra. Assuming that the energy loss is small compared w
the beam energy and that dipole transitions dominate, the differential cross section becomes
d 2 I
d dE =
4γ 2
3a20πq 2
⎡⎣
l m
l =l m=m
Y lm −m
q
Y lm−m
q l 1 l
0 0 0
2
φl m (ε)| r |φlm 2
+l m
l =l
m=m
Y lm −m
q
Y lm−m
q l 1 l
0 0 0
l 1 l
0 0 0
×
l 1 l
−m m − m m
l 1 l
−m m − m m
× (−1)m−m (2l + 1) (2l + 1) φl m (ε)| r |φlm φl m (ε)| r |φlm
⎤⎦,
where the Y lm(q) are spherical harmonics for wave vector q, the terms in brackets are Wign3 j symbols, φ lm is the inner-shell wave function characterized by quantum numbers l and m, aφ l m (ε) are the final-state wave function, including any solid-state effects, with quantum numb
l m. The first term is identical to Equation 2 and allows for transitions from orbitals pointi
554 Rez · Muller

8/3/2019 1_The Theory and Interpretation of Electron Energy Loss Near-Edge Fine Structure
http://slidepdf.com/reader/full/1the-theory-and-interpretation-of-electron-energy-loss-near-edge-fine-structure 21/26
in different directions (the orientation effect) (26), and the second term contains the cross terms
mentioned by Nelheibel et al. (24). The orientation effect means that the relative magnitudeof fine-structure features such as the π
∗ and σ∗ peaks in graphite will depend on the tilt of the
specimen. It can be shown that there is a “magic angle” at which the relative height of orientation-dependent features becomes independent of tilt (70). This angle is quite small (approximately 1mrad for C- K at 200 kV), and in practice most EELS spectra are recorded with larger collection
angles for which contributions from in-plane bonds dominate. At high accelerating voltages and
small angles (less than the characteristic angle mentioned above), there will be an additionalcontribution owing to excitation of transversely polarized virtual photons (71). This will give anadditional term in Equations 1, 2, and A1 when the electromagnetic interaction is treated in the
Coulomb approximation gauge. In anisotropic materials the strict separation between the directelectrostatic interactions giving Equations 1, 2, and A1 and the virtual photon excitation no longer
applies, and it is preferable to relativistically correct the scattering wave vector, which is equivalentto working in the Lorentz gauge (72).
DISCLOSURE STATEMENT
The authors are not aware of any biases that might be perceived as affecting the objectivity of this
review.
ACKNOWLEDGMENT
We thank Prof. Dilano Saldin for helping to verify Equation A1.
LITERATURE CITED
1. Batson PE. 1993. Simultaneous STEM imaging and electron energy-loss spectroscopy with atomic-
column sensitivity. Nature 366:727–28
2. Browning ND, Chisholm MF, Pennycook SJ. 1993. Atomic-resolution chemical analysis using a scanning
transmission electron microscope. Nature 366:143–46
3. Browning ND, Chisholm MF, Pennycook SJ. 2006. Corrigendum: Atomic resolution chemical analysisusing a scanning transmission electron microscope. Nature 44:235
4. Muller DA, Tzou Y, Raj R, Silcox J. 1993. Mapping of sp2 and sp3 states of carbon at subnanometre spatial
resolution. Nature 366:725–27
5. Krivanek OL, Delby N, Lupini AR. 1999. Towards sub- ˚ A electron beams. Ultramicroscopy 78:1–11
6. The definitive
reference for EELS in
electron microscopy.
6. Egerton RF. 1986. Electron Energy Loss Spectroscopy in the Electron Microscope. New York: Plenum
7. Keast VJ. 2005. Ab initio calculations of plasmons and interband transitions in the low-loss electron
energy-loss spectrum. J. Electron Spectrosc. 143:99–106
8. Benedict LX, Shirley EL, Bohn RB. 1998. Optical absorption of insulators and the electron hole interac-
tion: ab initio calculation. Phys. Rev. Lett. 80:4514–17
9. Chen CH, Silcox J, Vincent R. 1975. Electron energy losses in silicon, bulk and surface plasmons and
Cerenkov radiation. Phys. Rev. B 12:64–71
10. Stoger-Pollach M, Franco H, Schattschneider P, Lazar S, Schaffer B, et al. 2006. Cerenkov losses: a limitfor bandgap determination and Kramers Kronig analysis. Micron 37:396–402
11. Muller DA, Silcox J. 1995. Delocalization in inelastic scattering. Ultramicroscopy 59:195–213
12. Teo BK, Joy DC. 1981. EXAFS Spectroscopy, Techniques and Applications . New York: Plenum13. Comprehensive
review of X-ray
absorption fine
structure and the use
the FEFF code.
13. Rehr JJ, Albers RC. 2000. Theoretical approaches to x-ray absorption fine structure. Rev. Mod.
Phys. 72:621–54
14. Weijs PJW, Czyzyk MT, van Acker JF, Speier W, Goedkoop JB, et al. 1990. Core-hole effects in the X
ray-absorption spectra of transition-metal silicides. Phys. Rev. B 41:11899–910
www.annualreviews.org • Electron Energy Loss Near-Edge Fine Structure 555

8/3/2019 1_The Theory and Interpretation of Electron Energy Loss Near-Edge Fine Structure
http://slidepdf.com/reader/full/1the-theory-and-interpretation-of-electron-energy-loss-near-edge-fine-structure 22/26
15. Rez P, Bruley J, Brohan P, Payne M, Garvie LAJ. 1995. Review of methods for calculating near ed
structure. Ultramicroscopy 59:159–67
16. Rez P, Alvarez JR, Pickard CJ. 1999. Calculation of near edge structure. Ultramicroscopy 78:175–83
17. Keast VJ, Scott AJ, Brydson R, Williams DB, Bruley J. 2001. Electron energy loss near edge structure
tool for the investigation of electronic structure on the nanometer scale. J. Microsc. 203:135–75
18. Gao S-P, Pickard CJ, Payne MC, Zhu J, Yuan J. 2008. Theory of core-hole effects in 1 s core-le
spectroscopy of the first-row elements. Phys. Rev. B 77:115122
19. Muller DA, Subramanian S, Batson PE, Sass SL, Silcox J. 1995. Near atomic scale studies of electro
structure at grain boundaries in Ni3 Al. Phys. Rev. Lett. 75:4744–4720. de Groot FMF, Grioni M, Fuggle JC, Ghijsen J, Sawatzky GA, Petersen H. 1989. Oxygen 1 s x-r
absorption edges of transition-metal oxides. Phys. Rev. B 40:5715–23
21. Probably the most
significant application
of EELS fine stucture.
Showed the limits of
MOS devices, “the end
of the road.”
21. Muller DA, Sorsch T, Moccio S, Baumann FH, Evans-Lutterodt K, Timp G. 1999. The electro
structure at the atomic scale of ultrathin gate oxides. Nature 399:758–61
22. Muller JE, Willkins JW. 1984. Band structure approach to the X-ray spectra of metals. Phys. Rev
29:4331–48
23. Mathematical
description of near-edge
structure in terms of
Greens functions. 23. Saldin DK.1987. The theory of electron energy loss near-edge structure. Philos. Mag. B 56:515–
24. Excellent
comprehensive theory
of fine structure.
24. Nelheibel M, Louf P-H, Schattschneider P, Blaha P, Schwarz K, Jouffrey B. 1999. Theory
orientation sensitive near edge fine structure core level spectroscopy. Phys. Rev. B 59:12807–1
25. Muller DA, Singh DJ, Silcox J. 1998. Connections between the electron energy loss spectra, the lo
electronic structure, and the physical properties of a material: a study of nickel aluminium alloys. P
Rev. B 57:8181–20226. Leapman RD, Fejes PL, Silcox J. 1983. Orientation dependence of core edges from anisotropic mater
determined by inelastic scattering of fast electrons. Phys. Rev. B 28:2361–7327. The original paper
introducing DFT. 27. Kohn W, Sham LJ. 1965. Self consistent equations including exchange and correlation effec
Phys. Rev. 140:1133A–38A
28. Hamann DR, Muller DA. 2002. Absolute and approximate calculations of electron energy loss sp
troscopy edge thresholds. Phys. Rev. Lett. 89:126404
29. Janak JF. 1978. Proof that ∂ E /∂ni = εi in density-functional theory. Phys. Rev. B 18:7165–68
30. Slater JC. 1963. The Quantum Theory of Molecules and Solids: The Self Consistent Field for Molecules and Sol
New York: McGraw Hill
31. Paxton AT, Craven AJ, Gregg JM, McComb DW. 2003. Bandstructure approach to near edge structu
J. Microsc. 210:35–44
32. Original paper on
the Wien code.
32. Blaha P, Schwarz K, Sorantin P, Trickey SB. 1990. Full-potential, linearized augmented pla wave programs for crystalline systems. Comput. Phys. Commun. 59:399–415
33. Anderson OK. 1975. Linear methods in band theory. Phys. Rev. B 12:3060–83
34. Some of the best
calculations of carbon
and nitrogen edgesusing FLAPW and
FEFF in transition-
metal carbides and
nitrides.34. Scott AJ, Brydson R, MacKenzie M, Craven AJ. 2001. Theoretical investigations of the ELN
of transition metal carbides for the extraction of structural and bonding information. Phys. Rev
63:245105
35. Practical hints for
using Wien for EELS
fine-structure
calculations.
35. Hebert C. 2007. Practical aspects of running the Wien2k code for electron spectroscopy. Mic
38:12–28
36. Rehr JJ, Albers RC, Zabinsky SI. 1992. High-order multiple scattering calculations of X-ray absorpt
fine structure. Phy. Rev. Lett. 69:3397–400
37. Durham PJ, Pendry JB, Hodges CH. 1982. Calculation of X-ray absorption near-edge structure, XAN
Comput. Phys. Commun. 25:193–205
38. Mustre de Leon J, Rehr JJ, Zabinsky SI, Albers RC. 1991. Ab initio curved wave X-ray absorption fistructure. Phys. Rev. B 44:4146–56
39. Zabinsky SI, Rehr JJ, Ankudinov A, Albers RC, Eller MJ. 1995. Multiple scattering calculations of X-
absorption spectra. Phys. Rev. B 52:2995–3009
40. FEFF8 isintroduced, with some
applications.
40. Ankudinov AL, Ravel B, Rehr JJ, Conradson SD. 1998. Real space multiple scattering calculati
and interpretation of x-ray absorption near edge structure. Phys. Rev. B 58:7565–7641. Provides practical
hints for using FEFF8
for EELS fine structure.41. Moreno MS, Jorissen K, Rehr JJ. 2007. Practical aspects of electron energy loss spectrosco
(EELS) calculations using FEFF8. Micron 38:1–11
556 Rez · Muller
8/3/2019 1_The Theory and Interpretation of Electron Energy Loss Near-Edge Fine Structure
http://slidepdf.com/reader/full/1the-theory-and-interpretation-of-electron-energy-loss-near-edge-fine-structure 23/26
42. The definitive
review of more mode
plane wave
pseudopotential
methods.
42. Payne MC, Teter MP, Allan DC, Arias TM, Joanopoulos JD. 1992. Iterative minimization tech-
niques for ab initio total-energy calculations: molecular dynamics and conjugate gradients. Rev.
Mod. Phys. 64:1045–97
43. The paper that fir
describes the VASP
code.
43. Kresse G, Furthmuller J. 1996. Efficient iterative schemes for ab initio total-energy calculations
using a plane-wave basis set. Phys. Rev. B 54:11169–86
44. Sankey OF, Niklewski DJ. 1989. Ab initio multicenter tight-binding model for molecular-dynamics sim-
ulations and other applications in covalent systems. Phys. Rev. B 40:3979–95
45. Shirley EL. 1998. Ab initio inclusion of electron-hole attraction: application to X-ray absorption and
resonant inelastic X-ray scattering. Phys. Rev. Lett. 80:794–9746. Zangwill A, Soven P. 1980. Density-functional approach to local-field effects in finite systems: photoab-
sorption in the rare gases. Phys. Rev. A 21:1561–72
47. Cyrot-Lackmann F.1968. Sur le calculde la cohesion et de la tension superficialle des metaux de transition
par une methode de liasons forts. J. Phys. Chem. Solids 29:1235–43
48. Muller DA. 1998. Simple model for relating EELS and XAS spectra of metals to changes in cohesive
energy. Phys. Rev. B 58:5989–95
49. Leapman RD, Silcox J. 1979. Orientation dependence of core edges in electron-energy-loss spectra from
anisotropic materials. Phys. Rev. Lett. 42:1361–64
50. Weng X, Rez P, Batson PE. 1990. Single electron calculations for the Si L2,3 near edge structure. Solid
State Commun. 74:1013–15
51. Weng X, Rez P, Sankey OF. 1989. Pseudo-atomic-orbital band theory applied to electron-energy-loss
near-edge structures. Phys. Rev. B 40:5694–70452. Morar JF, Himpsel FJ, Hollinger G, Hughes G, Jordan JL. 1985. Observation of a C-1 s core exciton in
diamond. Phys. Rev. Lett. 54:1960–63
53. Rez P, Weng X, Ma H. 1991. The interpretation of near edge structures. Microsc. Microanal. Microstruct.
2:143–51
54. Weng X, Rez P. 1989. Multiple scattering approach to near edge structures in electron energy loss
spectroscopy of alkaline earths. Phys. Rev. B 39:7405–12
55. Lindner T, Sauer H, Engel W, Kambe K. 1986. Near-edge structure in electron-energy-loss spectra of
MgO. Phys. Rev. B 33:22–24
56. Kostlmeier S, Elsasser C, Meyer B. 1999. Ab initio analysis of electron energy loss spectra for complex
oxides. Ultramicroscopy 80:145–51
57. Justifies the negleof core-hole effects in
the Muller et al. (21)
paper on gate oxides.
57. Neaton JR, Muller DA, Ashcroft NW. 2000. Electronic properties of the Si/SiO2 interface from
first principles. Phys. Rev. Lett. 85:1298–30158. Kostlmeier S. 2001. Success and limits of common final state approximations. Ultramicroscopy 86:319–24
59. de Groot FMF, Faber J, Michiels JJM, Czyzyk MT, Abbate M, Fuggle JC. 1993. Oxygen 1 s X-ray
absorption of tetravalent oxide: a comparison with single particle calculations. Phys. Rev. B 48:2074–80
60. Rez P, Maclaren JM, Saldin DK. 1997. Application of the layer Korringa-Kohn-Rostoker method to the
calculation of near edge structure in X-ray absorption and electron energy loss spectroscopy. Phys. Rev. B
57:2621–27
61. KurataH, Lefevre E, Colliex C, Brydson R. 1993. Electron-energy-loss near-edgestructures in theoxygen
K -edge spectra of transition metal oxides. Phys. Rev. B 47:13763–68
62. Multiplet theory
introduced for
rare-earth M 45 edges
62. Thole BT, van der Laan G, Fuggle JC, Sawatzky GA, Karnatak RC, Esteva J-M. 1985. 3d x-ray-
absorption lines and the 3d 94 f n +1 multiplets of the lanthanides. Phys. Rev. B 32:5107–18
63. First paper showin
anomalous effects at
transition-metal L
edges.
63. Leapman RD, Grunes LA. 1980. Anomalous L3 / L2 white-line ratios in the 3d transition metals.
Phys. Rev. Lett. 45:397–40164. Kurata H, Colliex C. 1993. Electron energy-loss core edge structures in manganese oxides. Phys. Rev. B
47:2102–8
65. Paterson JH, Krivanek OL. 1990. ELNES of 3d transition-metal oxides II. Variations with oxidation state
and crystal structure. Ultramicroscopy 32:319–25
66. Ogasawara K, Iwata T, Koyama Y, Ishii T, Tanaka I, Adachi H. 2001. Relativistic cluster calculation of
ligand-field multiplet effects on cation L2,3 x-ray-absorption edges of SrTiO3, NiO, and CaF2. Phys. Rev.
B 64:115413
www.annualreviews.org • Electron Energy Loss Near-Edge Fine Structure 557

8/3/2019 1_The Theory and Interpretation of Electron Energy Loss Near-Edge Fine Structure
http://slidepdf.com/reader/full/1the-theory-and-interpretation-of-electron-energy-loss-near-edge-fine-structure 24/26
67. Radtke G, Lazar S, Botton GA. 2006. High resolution EELS investigation of the electronic structure
ilmenites. Phys. Rev. B 74:15511768. Excellent review on
multiplet theory applied
to transition-element
L23 edges and
rare-earth M 45 edges.
68. de Groot FMF. 2005. Multiplet effects in X-ray spectroscopy. Coord. Chem. Rev. 249:31–63
69. Comprehensive
compendium of first-row
transition-element L23
white lines calculated
for different charge
states in both
octahderal and
tetrahedral symmetry.
Always look here before
you do a calculation to
avoid repeating it!
69. van der Laan G, Kirkman IW. 1992. The 2 p absorption spectra of 3d transition metal compou
in tetrahedral and octahedral symmetry. J. Phys. Condens. Matter 4:4189–204
70. Jouffrey B, Schattschneider P, HebertC. 2004. Themagic angle:a solvedmystery. Ultramicroscopy 102:
66
71. Fano U. 1956. Differential inelastic scattering of relativistic charged particles. Phys. Rev. 102:385–87
72. Schattschneider P, Hebert C, Franco H, Jouffrey B. 2005.Anisotropic relativistic crosssectionsfor inelaelectron scattering, and the magic angle. Phys. Rev. B 72:045142
73. Alvarez JR, Rez P. 2001. Calculation of electronic properties of boundaries in Ni3 Al. Acta Mater . 49:7
802
558 Rez · Muller

8/3/2019 1_The Theory and Interpretation of Electron Energy Loss Near-Edge Fine Structure
http://slidepdf.com/reader/full/1the-theory-and-interpretation-of-electron-energy-loss-near-edge-fine-structure 25/26
Annual Review
Materials Rese
Volume 38, 200Contents
Low- and High-Temperature Wetting: State of the Art
Wetting and Molecular Dynamics Simulations of Simple Liquids
J. De Coninck and T.D. Blake p p p p p p p p p p p p p p p p p p p p p p p p p p p p p p p p p p p p p p p p p p p p p p p p p p p p p p p p p p p p p p p p p 1
Dynamics of Wetting from an Experimental Point of View
John Ralston, Mihail Popescu, and Rossen Sedevp p p p p p p p p p p p p p p p p p p p p p p p p p p p p p p p p p p p p p p p p p p p
23 Anisotropy of Wetting
Dominique Chatain p p p p p p p p p p p p p p p p p p p p p p p p p p p p p p p p p p p p p p p p p p p p p p p p p p p p p p p p p p p p p p p p p p p p p p p p p p p 45
Wetting and Roughness
David Qu´ er´ e p p p p p p p p p p p p p p p p p p p p p p p p p p p p p p p p p p p p p p p p p p p p p p p p p p p p p p p p p p p p p p p p p p p p p p p p p p p p p p p p p p p 71
Wetting and Dewetting of Complex Surface Geometries
Stephan Herminghaus, Martin Brinkmann, and Ralf Seemann p p p p p p p p p p p p p p p p p p p p p p p p p 101
Modeling of Wetting in Restricted Geometries
Kurt Binder p p p p p p p p p p p p p p p p p p p p p p p p p p p p p p p p p p p p p p p p p p p p p p p p p p p p p p p p p p p p p p p p p p p p p p p p p p p p p p p p p p 123
Wetting Phenomena in Nanofluidics
M. Rauscher and S. Dietrich p p p p p p p p p p p p p p p p p p p p p p p p p p p p p p p p p p p p p p p p p p p p p p p p p p p p p p p p p p p p p p p p 143
Interfacial Segregation Effects in Wetting Phenomena
Paul Wynblatt p p p p p p p p p p p p p p p p p p p p p p p p p p p p p p p p p p p p p p p p p p p p p p p p p p p p p p p p p p p p p p p p p p p p p p p p p p p p p p p 173
High-Temperature Wetting and the Work of Adhesion
in Metal/Oxide Systems
Eduardo Saiz, Rowland M. Cannon, and Antoni P. Tomsia p p p p p p p p p p p p p p p p p p p p p p p p p p p p p p 197
Wetting and Prewetting on Ceramic Surfaces
Jian Luo and Yet-Ming Chiang p p p p p p p p p p p p p p p p p p p p p p p p p p p p p p p p p p p p p p p p p p p p p p p p p p p p p p p p p p p p
227
Wetting in Soldering and Microelectronics
T. Matsumoto and K. Nogi p p p p p p p p p p p p p p p p p p p p p p p p p p p p p p p p p p p p p p p p p p p p p p p p p p p p p p p p p p p p p p p p p p 251
Segregation Phenomena at Thermally Grown Al2O3 /Alloy Interfaces
P.Y. Hou p p p p p p p p p p p p p p p p p p p p p p p p p p p p p p p p p p p p p p p p p p p p p p p p p p p p p p p p p p p p p p p p p p p p p p p p p p p p p p p p p p p p p p 275
ix

8/3/2019 1_The Theory and Interpretation of Electron Energy Loss Near-Edge Fine Structure
http://slidepdf.com/reader/full/1the-theory-and-interpretation-of-electron-energy-loss-near-edge-fine-structure 26/26
Current Interest
Combinatorial Materials Sciences: Experimental Strategies
for Accelerated Knowledge Discovery
Krishna Rajan p p p p p p p p p p p p p p p p p p p p p p p p p p p p p p p p p p p p p p p p p p p p p p p p p p p p p p p p p p p p p p p p p p p p p p p p p p p p p
Bamboo and Wood in Musical Instruments
Ulrike G.K. Wegst p p p p p p p p p p p p p p p p p p p p p p p p p p p p p p p p p p p p p p p p p p p p p p p p p p p p p p p p p p p p p p p p p p p p p p p p p
Controlled Patterning of Ferroelectric Domains: Fundamental
Concepts and Applications
Dongbo Li and Dawn A. Bonnell p p p p p p p p p p p p p p p p p p p p p p p p p p p p p p p p p p p p p p p p p p p p p p p p p p p p p p p p p
Crystal Chemistry of Complex Perovskites: New Cation-Ordered
Dielectric Oxides
P.K. Davies, H. Wu, A.Y. Borisevich, I.E. Molodetsky, and L. Farber p p p p p p p p p p p p p p p p
Formation and Properties of Quasicrystals
D.V. Louzguine-Luzgin and A. Inouep p p p p p p p p p p p p p p p p p p p p p p p p p p p p p p p p p p p p p p p p p p p p p p p p p p
Integral Textile Ceramic Structures
David B. Marshall and Brian N. Cox p p p p p p p p p p p p p p p p p p p p p p p p p p p p p p p p p p p p p p p p p p p p p p p p p p p
Mechanical Behavior of Metallic Glasses: Microscopic Understanding
of Strength and Ductility
Mingwei Chen p p p p p p p p p p p p p p p p p p p p p p p p p p p p p p p p p p p p p p p p p p p p p p p p p p p p p p p p p p p p p p p p p p p p p p p p p p p p p
Recent Developments in Irradiation-Resistant Steels
G.R. Odette, M.J. Alinger, and B.D. Wirth p p p p p p p p p p p p p p p p p p p p p p p p p p p p p p p p p p p p p p p p p p p p
Trends in the Development of New Mg Alloys
M. Bamberger and G. Dehmp p p p p p p p p p p p p p p p p p p p p p p p p p p p p p p p p p p p p p p p p p p p p p p p p p p p p p p p p p p p p
The Theory and Interpretation of Electron Energy Loss Near-Edge
Fine Structure
Peter Rez and David A. Muller p p p p p p p p p p p p p p p p p p p p p p p p p p p p p p p p p p p p p p p p p p p p p p p p p p p p p p p p p p
Transmission Electron Microscopy of Multilayer Thin Films
Amanda K. Petford-Long and Ann N. Chiaramonti p p p p p p p p p p p p p p p p p p p p p p p p p p p p p p p p p p p p
Index
Cumulative Index of Contributing Authors, Volumes 34–38p p p p p p p p p p p p p p p p p p p p p p p p
Errata
An online log of corrections to Annual Review of Materials Research articles may b
found at http://matsci.annualreviews.org/errata.shtml