19a cash management models -...
TRANSCRIPT

ww
w.m
cgra
wh
illco
nn
ect.
ca
Figure 19A.1
Cash balances for the Golden Socks Corporation
Starting cash:C= $1,200,000
$600,000 = C/2
Ending cash: 0
0 1 2 3 4
Average cash
Weeks
The Golden Socks Corporation starts at Time 0 with cash of $1,200,000. The balance drops to zero by the second week. The average cash balance is C/2 5 $1,200,000/2 5 $600,000 over the period.
19A Cash Management Models
The BAT ModelThe Baumol-Allais-Tobin (BAT) model is a classic means of analyzing the cash management problem. We illustrate how this model can be used to actually establish the target cash balance. It is a straightforward model and very useful for illustrating the factors in cash management and, more generally, current asset management.
To develop the BAT model, suppose the Golden Socks Corporation starts at Time 0 with a cash balance of C 5 $1.2 million. Each week, outflows exceed inflows by $600,000. As a result, the cash balance drops to zero at the end of Week 2. The average cash balance is the beginning balance ($1.2 million) plus the ending balance ($0) divided by 2, or ($1.2 million 1 $0)/2 5 $600,000 over the two-week period. At the end of Week 2, Golden Socks replaces its cash by depositing another $1.2 million.
As we have described, the cash management strategy for Golden Socks is very simple and boils down to depositing $1.2 million every two weeks. This policy is shown in Figure 19A.1. Notice how the cash balance declines by $600,000 per week. Since we bring the account up to $1.2 million, the balance hits zero every two weeks. This results in the sawtooth pattern displayed in Figure 19A.1.
Implicitly, we assume the net cash outflow is the same every day and it is known with certainty. These two assumptions make the model easy to handle. We indicate what happens when they do not hold in the next section.
If C were set higher, say, at $2.4 million, cash would last four weeks before the firm would have to sell marketable securities, but the firm’s average cash balance would increase to $1.2 million (from $600,000). If C were set at $600,000, cash would run out in one week and the firm would have to replenish cash more fre-quently, but its average cash balance would fall from $600,000 to $300,000.
Because transaction costs must be incurred whenever cash is replenished (for example, the brokerage costs of selling marketable securities), establishing large initial balances lowers the trading costs connected with cash management. However, the larger the average cash balance, the greater is the opportunity cost (the return that could have been earned on marketable securities).
ros69760_appendix_19A.indd Page 1 3/5/10 6:07:57 PM user-f467ros69760_appendix_19A.indd Page 1 3/5/10 6:07:57 PM user-f467 /Users/user-f467/Desktop/5-3 Gurmeet/Ross/Users/user-f467/Desktop/5-3 Gurmeet/Ross

ww
w.m
cgra
wh
illco
nn
ect.
ca
To determine the optimal strategy, Golden Socks needs to know the following three things:
F 5 The fixed cost of making a securities trade to replenish cashT 5 The total amount of new cash needed for transaction purposes over the relevant planning
period, say, one yearR 5 The opportunity cost of holding cash; the interest rate on marketable securities
With this information, Golden Socks can determine the total costs of any particular cash balance policy. It can then determine the optimal cash balance policy.
THE OPPORTUNITY COSTS To determine the opportunity costs of holding cash, we have to find out how much interest is forgone. Golden Socks has, on average, $C/2 in cash. This amount could be earning interest at rate R. So the total dollar opportunity costs of cash balances are equal to the average cash balance multiplied by the interest rate:
Opportunity costs 5 (C/2) 3 R [19A.1]
For example, the opportunity costs of various alternatives are given here assuming that the interest rate is 10 percent:
InitialCash Balance
AverageCash Balance
OpportunityCost (R 5 0.10)
C C/2 (C/2) 3 R$4,800,000 $2,400,000 $240,000 2,400,000 1,200,000 120,000 1,200,000 600,000 60,000 600,000 300,000 30,000 300,000 150,000 15,000
In our original case where the initial cash balance is $1.2 million, the average balance is $600,000. The interest we could have earned on this (at 10 percent) is $60,000, so this is what we give up with this strategy. Notice that the opportunity cost increases as the initial (and average) cash balance rises.
THE TRADING COSTS To determine the total trading costs for the year, we need to know how many times Golden Socks has to sell marketable securities during the year. First, the total amount of cash dis-bursed during the year is $600,000 per week or T 5 $600,000 3 52 weeks 5 $31.2 million. If the initial cash balance is set at C 5 1.2 million, Golden Socks would sell $1.2 million of marketable securities T/C 5 $31.2 million/$1.2 million 5 26 times per year. It costs F dollars each time, so trading costs are given by:
$31.2 million/$1.2 million 3 F 5 26 3 F
In general, the total trading costs are given by:
Trading costs 5 (T/C) 3 F [19A.2]
In this example, if F were $1,000 (an unrealistically large amount) the trading costs would be $26,000.We can calculate the trading costs associated with some different strategies as follows:
Total Amount ofDisbursements
during Relevant Period
InitialCash
Balance
TradingCosts
(F 5 $1,000)
T C (T/C) 3 F$31,200,000 $4,800,000 $ 6,500 31,200,000 2,400,000 13,000 31,200,000 1,200,000 26,000 31,200,000 600,000 52,000 31,200,000 300,000 104,000
2 Fundamentals of Corporate Finance, 7th Canadian Edition
ros69760_appendix_19A.indd Page 2 3/5/10 6:07:58 PM user-f467ros69760_appendix_19A.indd Page 2 3/5/10 6:07:58 PM user-f467 /Users/user-f467/Desktop/5-3 Gurmeet/Ross/Users/user-f467/Desktop/5-3 Gurmeet/Ross
ww
w.m
cgra
wh
illco
nn
ect.
ca
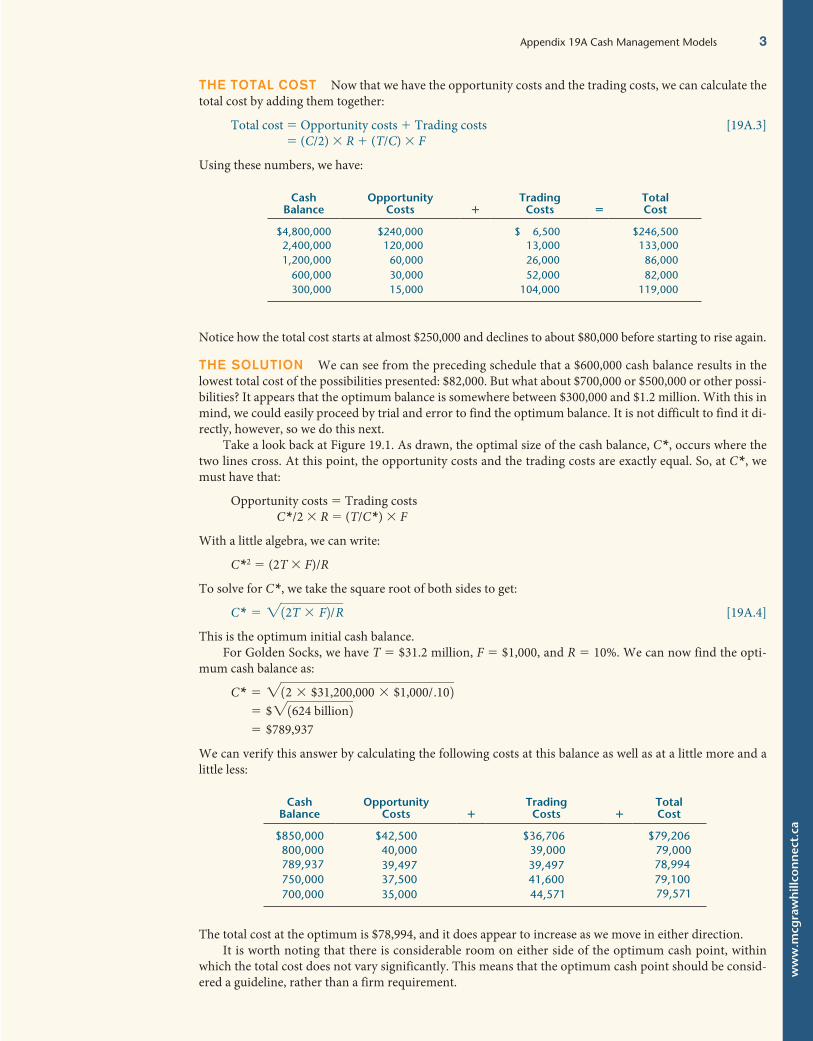
THE TOTAL COST Now that we have the opportunity costs and the trading costs, we can calculate the total cost by adding them together:
Total cost 5 Opportunity costs 1 Trading costs [19A.3]5 (C/2) 3 R 1 (T/C) 3 F
Using these numbers, we have:
CashBalance
OpportunityCosts 1
TradingCosts 5
TotalCost
$4,800,000 $240,000 $ 6,500 $246,500 2,400,000 120,000 13,000 133,000 1,200,000 60,000 26,000 86,000 600,000 30,000 52,000 82,000 300,000 15,000 104,000 119,000
Notice how the total cost starts at almost $250,000 and declines to about $80,000 before starting to rise again.
THE SOLUTION We can see from the preceding schedule that a $600,000 cash balance results in the lowest total cost of the possibilities presented: $82,000. But what about $700,000 or $500,000 or other possi-bilities? It appears that the optimum balance is somewhere between $300,000 and $1.2 million. With this in mind, we could easily proceed by trial and error to find the optimum balance. It is not difficult to find it di-rectly, however, so we do this next.
Take a look back at Figure 19.1. As drawn, the optimal size of the cash balance, C*, occurs where the two lines cross. At this point, the opportunity costs and the trading costs are exactly equal. So, at C*, we must have that:
Opportunity costs 5 Trading costs C*/2 3 R 5 (T/C*) 3 F
With a little algebra, we can write:
C*2 5 (2T 3 F)/R
To solve for C*, we take the square root of both sides to get:
C* 5 212T 3 F2/R [19A.4]
This is the optimum initial cash balance.For Golden Socks, we have T 5 $31.2 million, F 5 $1,000, and R 5 10%. We can now find the opti-
mum cash balance as:
C* 5 212 3 $31,200,000 3 $1,000/.102 5 $21624 billion2 5 $789,937
We can verify this answer by calculating the following costs at this balance as well as at a little more and a little less:
CashBalance
OpportunityCosts 1
TradingCosts 1
TotalCost
$850,000 $42,500 $36,706 $79,206 800,000 40,000 39,000 79,000 789,937 39,497 39,497 78,994 750,000 37,500 41,600 79,100 700,000 35,000 44,571 79,571
The total cost at the optimum is $78,994, and it does appear to increase as we move in either direction.It is worth noting that there is considerable room on either side of the optimum cash point, within
which the total cost does not vary significantly. This means that the optimum cash point should be consid-ered a guideline, rather than a firm requirement.
Appendix 19A Cash Management Models 3
ros69760_appendix_19A.indd Page 3 3/5/10 6:07:58 PM user-f467ros69760_appendix_19A.indd Page 3 3/5/10 6:07:58 PM user-f467 /Users/user-f467/Desktop/5-3 Gurmeet/Ross/Users/user-f467/Desktop/5-3 Gurmeet/Ross

ww
w.m
cgra
wh
illco
nn
ect.
ca
The Mi l le r–Or r Model : A More Genera l ApproachWe now describe a cash management system designed to deal with cash inflows and outflows that fluctuate randomly from day to day. With this model, we again concentrate on the cash balance; in contrast to the BAT model, we assume this balance fluctuates up and down randomly and that the average change is zero.
4 Fundamentals of Corporate Finance, 7th Canadian Edition
THE BASIC IDEA Figure 19A.2 shows how the system works. It operates in terms of an upper limit to the amount of cash (U*) and a lower limit (L), and a target cash balance (C*). The firm allows its cash bal-ance to wander around between the lower and upper limits. As long as the cash balance is somewhere be-tween U* and L, nothing happens.
When the cash balance reaches the upper limit (U*), as it does at point X, the firm moves U* 2 C* dollars out of the account and into marketable securities. This action moves the cash balance down to C*. In the same way, if the cash balance falls to the lower limit (L), as it does at point Y, the firm sells C* 2 L worth of securities and deposits the cash in the account. This action takes the cash balance up to C*.
EXAMPLE 19A.1: The BAT Model
The Vulcan Corporation has cash outflows of $100 per day, seven days a week. The interest rate is 5 percent, and the fixed cost of replenishing cash balances is $10 per transaction. What is the optimal initial cash balance? What is the total cost?
The total cash needed for the year is 365 days 3 $100 5 $36,500. From the BAT model, the optimal initial balance is:
C* 5 212T 3 F 2yR5 22 3 $36,500 3 $10y.055 2$14.6 million 5 $3,821
The average cash balance is $3,821/2 5 $1,911, so the op-portunity cost is $1,911 3 .05 5 $96. Since we need $100 per day, the $3,821 balance lasts $3,821/$100 5 38.21 days. We need to resupply the account 365/38.21 5 9.6 times, so the trading (order) cost is $96. The total cost is $192.
The BAT model is possibly the simplest and most stripped-down sensible model for determining the optimal cash posi-tion. Its chief weakness is that it assumes steady, certain cash outflows. We next discuss a more involved model designed to deal with these problems.
Figure 19A.2
The Miller-Orr model Cash
L
TimeX Y
C*
U*
U* is the upper control limit. L is the lower control limit. The target cash balance is C*. As long as cash is between L and U*, no transaction is made.
ros69760_appendix_19A.indd Page 4 3/5/10 6:07:58 PM user-f467ros69760_appendix_19A.indd Page 4 3/5/10 6:07:58 PM user-f467 /Users/user-f467/Desktop/5-3 Gurmeet/Ross/Users/user-f467/Desktop/5-3 Gurmeet/Ross
ww
w.m
cgra
wh
illco
nn
ect.
ca
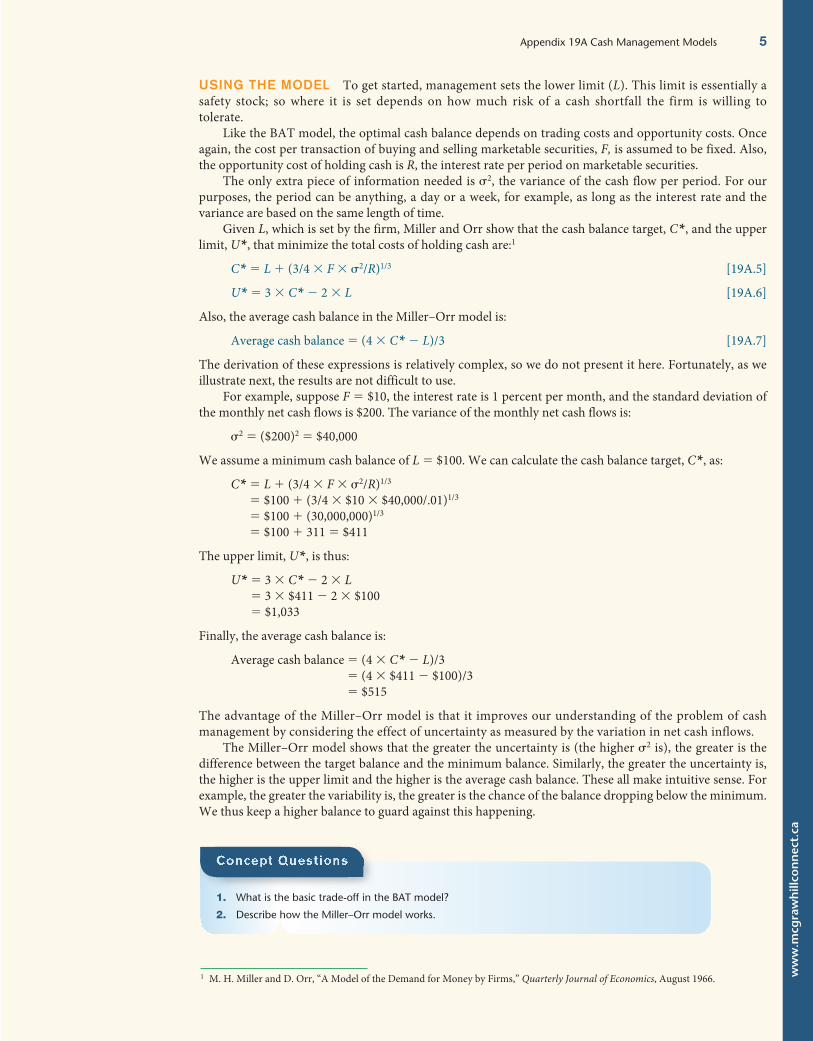
USING THE MODEL To get started, management sets the lower limit (L). This limit is essentially a safety stock; so where it is set depends on how much risk of a cash shortfall the firm is willing to tolerate.
Like the BAT model, the optimal cash balance depends on trading costs and opportunity costs. Once again, the cost per transaction of buying and selling marketable securities, F, is assumed to be fixed. Also, the opportunity cost of holding cash is R, the interest rate per period on marketable securities.
The only extra piece of information needed is s2, the variance of the cash flow per period. For our purposes, the period can be anything, a day or a week, for example, as long as the interest rate and the variance are based on the same length of time.
Given L, which is set by the firm, Miller and Orr show that the cash balance target, C*, and the upper limit, U*, that minimize the total costs of holding cash are:1
C* 5 L 1 (3/4 3 F 3 s2/R)1/3 [19A.5]
U* 5 3 3 C* 2 2 3 L [19A.6]
Also, the average cash balance in the Miller–Orr model is:
Average cash balance 5 (4 3 C* 2 L)/3 [19A.7]
The derivation of these expressions is relatively complex, so we do not present it here. Fortunately, as we illustrate next, the results are not difficult to use.
For example, suppose F 5 $10, the interest rate is 1 percent per month, and the standard deviation of the monthly net cash flows is $200. The variance of the monthly net cash flows is:
s2 5 ($200)2 5 $40,000
We assume a minimum cash balance of L 5 $100. We can calculate the cash balance target, C*, as:
C* 5 L 1 (3/4 3 F 3 s2/R)1/3
5 $100 1 (3/4 3 $10 3 $40,000/.01)1/3
5 $100 1 (30,000,000)1/3
5 $100 1 311 5 $411
The upper limit, U*, is thus:
U* 5 3 3 C* 2 2 3 L5 3 3 $411 2 2 3 $1005 $1,033
Finally, the average cash balance is:
Average cash balance 5 (4 3 C* 2 L)/35 (4 3 $411 2 $100)/35 $515
The advantage of the Miller–Orr model is that it improves our understanding of the problem of cash management by considering the effect of uncertainty as measured by the variation in net cash inflows.
The Miller–Orr model shows that the greater the uncertainty is (the higher s2 is), the greater is the difference between the target balance and the minimum balance. Similarly, the greater the uncertainty is, the higher is the upper limit and the higher is the average cash balance. These all make intuitive sense. For example, the greater the variability is, the greater is the chance of the balance dropping below the minimum. We thus keep a higher balance to guard against this happening.
1. What is the basic trade-off in the BAT model?
2. Describe how the Miller–Orr model works.
Appendix 19A Cash Management Models 5
1 M. H. Miller and D. Orr, “A Model of the Demand for Money by Firms,” Quarterly Journal of Economics, August 1966.
ros69760_appendix_19A.indd Page 5 3/5/10 6:07:59 PM user-f467ros69760_appendix_19A.indd Page 5 3/5/10 6:07:59 PM user-f467 /Users/user-f467/Desktop/5-3 Gurmeet/Ross/Users/user-f467/Desktop/5-3 Gurmeet/Ross
ww
w.m
cgra
wh
illco
nn
ect.
ca
Appendix Rev iew Prob lem and Se l f - Tes tA.1 The BAT Model Given the following information, calculate the target cash balance using the BAT
model:
Annual interest rate 12% Fixed order cost $100 Total cash needed $240,000
What are the opportunity cost of holding cash, the trading cost, and the total cost? What would these be if $15,000 were held instead? If $25,000 were held?
Answer s to Appendix Se l f - Tes t P rob lemA.1 From the BAT model, we know that the target cash balance is:
C* 5 212T 3 F2/R5 212 3 $240,000 3 1002/.125 2$400,000,0005 $20,000
The average cash balance will be C*/2 5 $20,000/2 5 $10,000. The opportunity cost of holding $10,000 when the going rate is 12 percent is $10,000 3 .12 5 $1,200. There will be $240,000/20,000 5 12 orders during the year, so the order cost, or trading cost, is also 12 3 $100 5 $1,200. The total cost is thus $2,400.
If $15,000 is held, then the average balance is $7,500. Verify that the opportunity, trading, and total costs in this case are $900, $1,600, and $2,500, respectively. If $25,000 is held, these numbers are $1,500, $960, and $2,460, respectively.
Appendix Quest ions and Prob lemsA.1 Changes in Target Cash Balances Indicate the likely impact of each of the following on a company’s
target cash balance. Use the letter I to denote an increase and D to denote a decrease. Briefly explain your reasoning in each case:
a. Commissions charged by brokers decrease. b. Interest rates paid on money market securities rise. c. The firm’s credit rating improves. d. The cost of borrowing increases. e. Direct fees for banking services are established.A.2 Using the BAT Model Given the following information, calculate the optimal cash balance using the
BAT model:
Annual interest rate 6% Fixed order cost $25 Total cash needed $8,500
How do you interpret your answer?A.3 Opportunity versus Trading Costs White Whale Corporation has an average daily cash balance of
$1,300. Total cash needed for the year is $43,000. The interest rate is 5 percent, and replenishing the cash costs $8 each time. What are the opportunity cost of holding cash, the trading cost, and the total cost? What do you think of White Whale’s strategy?
A.4 Costs and the BAT Model Debit and Credit Bookkeepers needs a total of $16,000 in cash during the year for transactions and other purposes. Whenever cash runs low, it sells $1,500 in securities and transfers the cash in. The interest rate is 5 percent per year, and selling securities costs $25 per sale.
a. What is the opportunity cost under the current policy? The trading cost? With no additional calculations, would you say that Debit and Credit keeps too much or too little cash? Explain.
b. What is the target cash balance derived using the BAT model?
Basic (Questions
A1–A10)
Basic (Questions
A1–A10)
6 Fundamentals of Corporate Finance, 7th Canadian Edition
ros69760_appendix_19A.indd Page 6 3/5/10 6:07:59 PM user-f467ros69760_appendix_19A.indd Page 6 3/5/10 6:07:59 PM user-f467 /Users/user-f467/Desktop/5-3 Gurmeet/Ross/Users/user-f467/Desktop/5-3 Gurmeet/Ross
ww
w.m
cgra
wh
illco
nn
ect.
ca
Appendix 19A Cash Management Models 7
A.5 Determining Optimal Cash Balances The All Day Company is currently holding $690,000 in cash. It projects that over the next year its cash outflows will exceed cash inflows by $140,000 per month. How much of the current cash holdings should be retained, and how much should be used to increase the company’s holdings of marketable securities? Each time these securities are bought or sold through a broker, the company pays a fee of $500. The annual interest rate on money market securities is 5.7 percent. After the initial investment of excess cash, how many times during the next 12 months will securities be sold?
A.6 Interpreting Miller–Orr Econoline Crush Inc. uses a Miller–Orr cash management approach with a lower limit of $43,000, an upper limit of $125,000, and a target balance of $80,000. Explain what each of these points represents; then explain how the system will work.
A.7 Using Miller–Orr Slap Shot Corporation has a fixed cost associated with buying and selling market-able securities of $40. The interest rate is currently .021 percent per day, and the firm has estimated that the standard deviation of its daily net cash flows is $70. Management has set a lower limit of $1,500 on cash holdings. Calculate the target cash balance and upper limit using the Miller–Orr model. Describe how the system will work.
A.8 Interpreting Miller–Orr Based on the Miller–Orr model, describe what will happen to the lower limit, the upper limit, and the spread (the distance between the two) if the variation in net cash flow grows. Give an intuitive explanation for why this happens. What happens if the variance drops to zero?
A.9 Using Miller–Orr The variance of the daily cash flows for the Pele Bicycle Shop is $890,000. The opportunity cost to the firm of holding cash is 7 percent per year. What should the target cash level and the upper limit be if the tolerable lower limit has been established as $160,000? The fixed cost of buying and selling securities is $300 per transaction.
A.10 Using BAT All Night Corporation has determined that its target cash balance if it uses the BAT model is $2,700. The total cash needed for the year is $28,000, and the order cost is $10. What interest rate must All Night be using?
ros69760_appendix_19A.indd Page 7 3/5/10 6:08:00 PM user-f467ros69760_appendix_19A.indd Page 7 3/5/10 6:08:00 PM user-f467 /Users/user-f467/Desktop/5-3 Gurmeet/Ross/Users/user-f467/Desktop/5-3 Gurmeet/Ross