1999 annual research report
TRANSCRIPT

1999 ANNUAL RESEARCH REPORT
THE PENNSYLVANIA STATE UNIVERSITY
CENTER FOR TURFGRASS SCIENCE

TABLE OF CONTENTS
PageDisclaimer ............................................................................................................................ 11999 In-Kind Support ........................................................................................................... 21999 Financial Support ......................................................................................................... 3
SOIL MODIFICATION
Evaluation of the Agronomic and Sports Turf Quality of a Modular Turf SystemOver Blacktop.................................................................................................................... 4
The Effects of Crumb Rubber on the Density and Surface Hardnessof Perennial Ryegrass....................................................................................................... 17
MANAGEMENT
A Procedure to Evaluate Golf Shoe Tread Types................................................................. 20Cultivar Development and Extreme Temperature Tolerance
of Greens-type Poa annua L. ........................................................................................... 23Creeping Bentgrass Morphogenis and Competition............................................................. 27Loss of Greens-Grade Containing Fertilizers Due to Mowing ............................................. 28
FUNGICIDE AND FERTILIZER EVALUATIONS – NUTRIENT REQUIREMENTS
Evaluation of Fungicides for Control of Gray Leaf Spot on aPerennial Ryegrass Fairway ................................................................................................ 37Evaluation of Fungicides for Control of Pythium Foliar Blight ........................................... 40Control of Pythium Foliar Blight on Perennial Ryegrass ..................................................... 42Evaluation of Fungicides for Control of Dollar Spot on a Putting Green ............................. 44Control of Brown Patch with Fungicides............................................................................. 46Applications of MacroSorb Foliar to Improve the Quality of a Putting Green...................... 48Evaluation of Slow Release N Fertilizers on Creeping Bentgrass Fairways ......................... 49The Effect of Varying Rates of Iron Products on Creeping Bentgrass.................................. 53Manganese Requirements of Annual Bluegrass and Creeping Bentgrass ............................. 55The Effects of PCNB Formulation, Rate, and Application Timing
on Putting Green Injury, Dollar Spot, and Annual Bluegrass Encroachment..................... 61
INSECTICIDE EVALUATIONS
Summer Management of Hairy Chinch Bug with DeltaGard, Dursban, Scimitar,Talstar, and Tempo Formulations on Established Fescue.................................................. 67
Annual Bluegrass Weevil Suppression with Formulations of Chlorpyrifos,DeltaGard, and Scimitar................................................................................................... 69
Evaluation of Mach 2, Merit, and Conventional Formulations for ResidualSuppression of White Grubs on Home Lawns ..................................................................... 71

HERBICIDE AND PGR EVALUATIONS
Response of Kentucky Bluegrass and Perennial Ryegrass to the Applicationof Proxy Under Reduced Light Conditions ..................................................................... 73
Spring Overseeding of Creeping Bentgrass After a Late SummerPre-Emergence Application............................................................................................ 77
Seedhead Suppression of Annual Bluegrass....................................................................... 79Seedhead Suppression of Annual Bluegrass on a Putting Green......................................... 81Control of Poa Annua in a Stand of Kentucky Bluegrass ................................................... 83Poa Annua Control Using Summer Applications of Prograss............................................. 85Late Summer Poa Annua Pre-emergence Application ....................................................... 86Post-Emergence Control of Broadleaf Weeds .................................................................... 87Pre-Emergence Crabgrass Control Study........................................................................... 90Post-Emergence Control of Crabgrass at the Two to Three Leaf Growth Stage.................. 92Post-Emergence Control of Crabgrass at the Two to Three Tiller Growth Stage ................ 94Pre-Stress Conditioning of Perennial Ryegrass with PGRs ................................................ 96Evaluation of a New Plant Growth Regulator on Creeping Bentgrass ................................ 98Re-Rooting of Four Varieties of Creeping Bentgrass After Applications
of Bensulide and Dithiopyr............................................................................................100Phytotoxicity Screening of Dimension and Different Rates of Bensulide
on Four Cultivars of Creeping Bentgrass .......................................................................103
LEARNING RESOURCES
Web-Accessible Learning Resource Development............................................................105
DISCLAIMER
This publication reports pesticide use in research trials, and these uses may not conform to thepesticide label. These reported uses are not provided as recommendations. It is always theresponsibility of the pesticide applicator, by law, to follow current label directions for thespecific pesticide being used.
No endorsement is intended for products mentioned, nor is lack of endorsement meant forproducts not mentioned. The authors and the Pennsylvania State University assume no liabilityresulting from the use of pesticide applications detailed in this report.

2
1999 SUPPORTERS OF THE CENTER FOR TURFGRASS SCIENCE
IN-KIND SUPPORT
AgrEvo PBI GordonAmerican Cyanamid Penn State Golf CoursesAquatrols, Inc. PickseedBASF Pure Seed Testing, Inc.Bayer Ransomes AmericaBest Sand Rhone PoulencBush Hog Rohm & HaasD.M. Boyd Company Seed Research of Oregon, Inc.Dow AgroSciences Seedway, Inc.E. H. Griffith, Inc Sporting Valley SodEagle Golf and Landscape Products, Inc. State College Elks Country ClubEarth & Turf Company Steiner / Dave Heath AssociatesFerris Tee-2-Green CorporationFinch Turf Equipment The Pennsylvania Turfgrass CouncilGandy Company The Scotts CompanyGowan Three Rivers FordHummer Turfgrass Systems Toftrees Country ClubJacobsen ToroJohn Deere TrionKrigger & Company, Inc. TriStar Soil, Inc.Kuhn Farm Machinery, Inc. True Line, Inc.Lebanon-Seaboard Corporation Turfco Manufacturing, Inc.Millcreek Manufacturing Company Turf PartnersMilorganite Division - MMSD Turf ProMinolta Corporation Ty-Crop Turf Equipment, Inc.Montco U. S. SilicaNittany Six Hole Golf Course United Horticultural SupplyNovartis Zeneca Professional ProductsNutra Max

1999 SUPPORTERS OF THE CENTER FOR TURFGRASS SCIENCE
FINANCIAL SUPPORT
Aimcor Monsanto CompanyAllied - Signal MontcoA*DEC Communications Moyer & Sons, Inc.Agrevo USA Company National Turfgrass Evaluation ProgramAmer ican Cyanamid New Penn Golf Cars / EZ-Go TextronAmvac Chemica l Corporat ion North West PA GCSAAquatrols Corporation of America NovartisBASF Nutra MaxBayer Corporat ion PBI GordonBethesda C.C. Pennick Arrimour Golf, Inc.Cherry Hills C.C. Philadelphia Area GCSADow AgroSciences Pocono Turfgrass AssociationDowningtown C.C. Pro TurfDuPont Nylon Pursell IndustriesEarth Works Pursell TechnologiesFinch Turf Equipment Rhone PoulencFisher & Son Co., Inc. Rohm & HaasFMC Seeds, Inc.Forse Design Tee-2-Green CorporationGeorge Ley Company Textron Turf CareGolf Course Superintendents Association The Pennsylvania Turfgrass Council, Inc.of America The Toro CompanyGowan Company The Scotts CompanyGri f f in Corporat ion Tomen Inc. AgroKuhn Farm Machinery, Inc. Turf PartnersHummer Turfgrass Systems Uniroyal Chemical CompanyLawn & Golf Company United States Golf AssociationLebanon Seaboard Corporation U. S. Army, CRRELLesco, Inc. U. S. SilicaLehigh C.C. / John Chassard Zeneca Professional Products

Evaluation of the Agronomic and Sports Turf Quality of aModular Turf System Installed over Black Top
A.S. McNitt, P.J. Landschoot,Department of Agronomy
A.R. Leonard - Supt. of Grounds, Philadelphia Eagles
The desire to provide a safer playing surface and still allow numerous and varied eventsin a stadium has led to the development of portable fields. As these systems become a viableoption, a stadium can hold non-sporting events on pavement or artificial turf. When natural turfis desired, the portable field is installed over the artificial turf as individual modules.
In this study we wanted to evaluate the agronomic and playing surface quality of themodular turf system GrassTiles™ . We wanted to compare tiles installed over blacktop with tilesinstalled over a traditional sand-based root-zone.
Materials and Methods
On September 2, 1997, Hummer Sport Turf Inc. of Lancaster, PA delivered fifteenturfgrass modules (tiles) to the Joseph Valentine Turfgrass Research Center, University Park,PA. The tiles are shown in Fig. 1 – 3. Each 7’ x 7’ x 2.25” tile was grown in a container. The soilmix in the container consisted of a USGA specified sand:peat mix. In addition to the sand andpeat, various rates of DuPont Shredded Carpet filaments were incorporated into the root-zonemix prior to turfgrass establishment.
Fig. 1. Removing tile from container. Fig. 2. Area prepared for tile installation.

Fig. 3. Tile being installed over sand base.
The amount of DuPont Shredded Carpet in each treatment tile is shown in Table 1. ThePVOH treatment is a chemical developed by DuPont and included in the root-zone in an attemptto increase the rate of turfgrass recovery after stress. Each treatment was replicated three timesfor a total of 15 treatment tiles.
Table 1. List of treatments for Experiment 1.
Treatment Rate of Fibers--(% weight)--
Control 0%DuPont Shredded Carpet 1%DuPont Shredded Carpet 1% with P.V.O.H.DuPont Shredded Carpet 3%DuPont Shredded Carpet 5%
The tiles were installed over blacktop with an approximately 0.25 inch drainage matbetween the blacktop and the tile root-zone. The experiment was given basic maintenanceincluding mowing, watering, and fertilization. The experiment was given no special attention.
On Sept. 3, 1997 we began to impose wear on the treatments tiles. Wear was applied witha Brinkman Wear Machine (Cockerham and Brinkman, 1989). The wear machine was pulledwith a Steiner model 420 tractor equipped with a dual turf tire package in order to minimize weardue to the tractor tires. The machine was driven over the tiles using five passes three times perweek. Cockerham and Brinkman (1989) estimate that two passes with their wear machine isequivalent to a NFL game at the 40-yard line between the hash marks. Wear ended for the seasonon Nov. 18, 1997. In 1998 wear began on April 15 and ended Aug. 17. Typically, wear wasapplied regardless of weather conditions.

Data Collection
Soil Physical Properties
Soil bulk density - The soil physical properties measured in this experiment include, soilbulk density and soil water content.
Soil bulk density data were derived from measurements of soil total density andvolumetric water content taken with a Troxler 3400-B series surface moisture/density gauge.
Playing Surface Quality
Surface Hardness- Surface hardness was measured using a Clegg impact soil tester (CIT)equipped with a 2.25 kg hammer (Rogers and Waddington, 1989). The average of six hardnessmeasurements on each subplot was used to represent the hardness value of the subplot.
Traction- Linear traction measurements were taken using PENNFOOT (McNitt et al.,1996, 1997) configured with a loading weight of 121.8 kg and a high-top molded shoe.The traction values reported are the average of three traction measurements recorded on eachsubplot.
Turfgrass Density- Turfgrass density was rated visually, and density was recorded on ascale of zero to five using half units. Zero represents a plot with no turfgrass present and fiverepresents 100% turfgrass cover and no visible root-zone mix. A rating of 3.0 represents anacceptable turfgrass density in the center of a high school football field. The visual rating tookinto account both percent turfgrass cover and density of tillers.
Divoting- At the end of the study, divot size was measured on each treatment sub-plot.Divots were created using a weighted pendulum attached to the three-point hitch of a tractor. Atthe end of the pendulum the head of a golf club pitching wedge was attached. The height of thewedge, relative to the treatment surface was controlled with an adjustable metal pad. The pad canbe set at different heights and when the three-point hitch is lowered the pad rests on the soilsurface. During these experiments the depth was set to 15 mm.
The pendulum was released from a horizontal position. The pendulum is weighted with a76 kg lead weight. After the pitching wedge cuts through the soil surface, the maximum lengthand width of each divot was measured.
EXPERIMENT 2 – GROW-IN
On May 10, 1998, Hummer Sport Turf Inc. of Lancaster, PA delivered twelve turfgrassmodules (tiles) to the Joseph Valentine Turfgrass Research Center, University Park, PA. Thetiles were the same as those described in Experiment 1 and shown in Fig. 1 – 3. The soil mix inthe container consisted of a USGA specified sand:peat mix. In addition to the sand and peat,various rates of DuPont Shredded Carpet filaments were incorporated into the root-zone mixprior to turfgrass establishment.
The amount of DuPont Shredded Carpet in each treatment tile is shown in Table 2. Eachtreatment was replicated three times for a total of 12 treatment tiles. The tiles were arranged in arandomized complete block design. The tiles were installed over eight inches of a 90% sand 10%peat (v:v) USGA specified root-zone. This mix was underlain by six inches of USGA specified

drainage gravel that included corrugated PVC drainpipe. The experiment was given basicmaintenance including mowing, watering, and fertilization.
Table 2. List of treatments for Experiment 2.
Treatment Rate of Fibers--(% weight)--
Control 0%DuPont Shredded Carpet 3%DuPont Shredded Carpet 3% with P.V.O.H.DuPont Shredded Carpet 5%
On June 1, 1998 we split the block with two levels of wear. The two levels were no wearand wear equaling 7.5 NFL games per weak. Wear was applied with a Brinkman Wear Machine(Cockerham and Brinkman, 1989). The wear machine was pulled with a Steiner model 420tractor equipped with a dual turf tire package in order to minimize wear due to the tractor tires.The machine was driven over the high wear subplots with five passes three times per week. Wearended for the season on Oct. 15, 1998. Typically, wear was applied regardless of weatherconditions.
Data Collection
Soil physical property and surface playing quality data was collected on two rating dates(July 3, 1998 and Oct. 14, 1998).
Data collection followed the procedures described in Experiment 1. Divot data wascollected on Oct. 15, 1998.
Rating Dates and Statistical Analysis
The turfgrass density rating and the means of the three soil bulk densities, three soil watercontents, three traction, six surface hardness measurements, and three divot sizes were analyzedusing the analysis of variance and Fisher’s Least Significant Difference (lsd) test at the 0.05level. A lsd was not calculated when the F ratio was not significant at the 0.05 level.
RESULTS
EXPERIMENT 1
Soil Bulk Density
The results for the soil bulk density values are listed in Table 3. The control, DuPont ShreddedCarpet 1% and 1% with PVOH had soil bulk densities that were not different on either ratingdate. The DuPont Shredded Carpet 3% had a lower soil bulk density than the control or the 1%

treatments on both rating dates. The DuPont Shredded Carpet 5% had a soil bulk density valuethat was lower than all other treatments on both rating dates.
Table 3. Mean soil bulk density values for treatments in Experiment 1.
Treatment Nov. 14, 1997 July 3, 1998------------------(g/cc)----------------
Control 1.22 1.37DuPont Shredded Carpet 1% 1.21 1.35DuPont Shredded Carpet 1% with P.V.O.H. 1.21 1.35DuPont Shredded Carpet 3% 1.12 1.21DuPont Shredded Carpet 5% 1.09 1.15--------------------------------------------------------------------------------------------------------lsd (0.05) 0.11 0.04
Soil bulk density values increased for all treatments as wear increased. The DuPontShredded Carpet 3% and 5% had lower soil bulk density values than the other treatments on bothrating dates. The difference between soil bulk density values for these treatments was greater onthe second rating date, indicating that the differences between treatment bulk density valuesincreased with increasing wear. Low soil bulk density typically translates into lower resistanceto root penetration and greater rooting.
Soil Water Content
Soil water content differences due to treatments are shown in Table 4. There were nosignificant differences between soil water contents caused by treatments on either rating date.The difference in soil water contents between rating dates should be noted. During the Nov. 14,1997 rating date all surface playing quality measurements were taken while the soil watercontent was high. On the July 3, 1998 rating date the playing quality measurements were takenwhile the soil water was very low. Thus the playing quality measurements reflect a variety ofplaying condition extremes.
Table 4. Mean soil water content for treatments in Experiment 1.
Treatment Nov. 14, 1997 July 3, 1998---------------(% by vol.)-------------
Control 28.8 9.2DuPont Shredded Carpet 1% 29.4 9.8DuPont Shredded Carpet 1% with P.V.O.H. 29.7 11.2DuPont Shredded Carpet 3% 27.1 9.0DuPont Shredded Carpet 5% 27.3 10.7---------------------------------------------------------------------------------------------------------lsd (0.05) NS NS
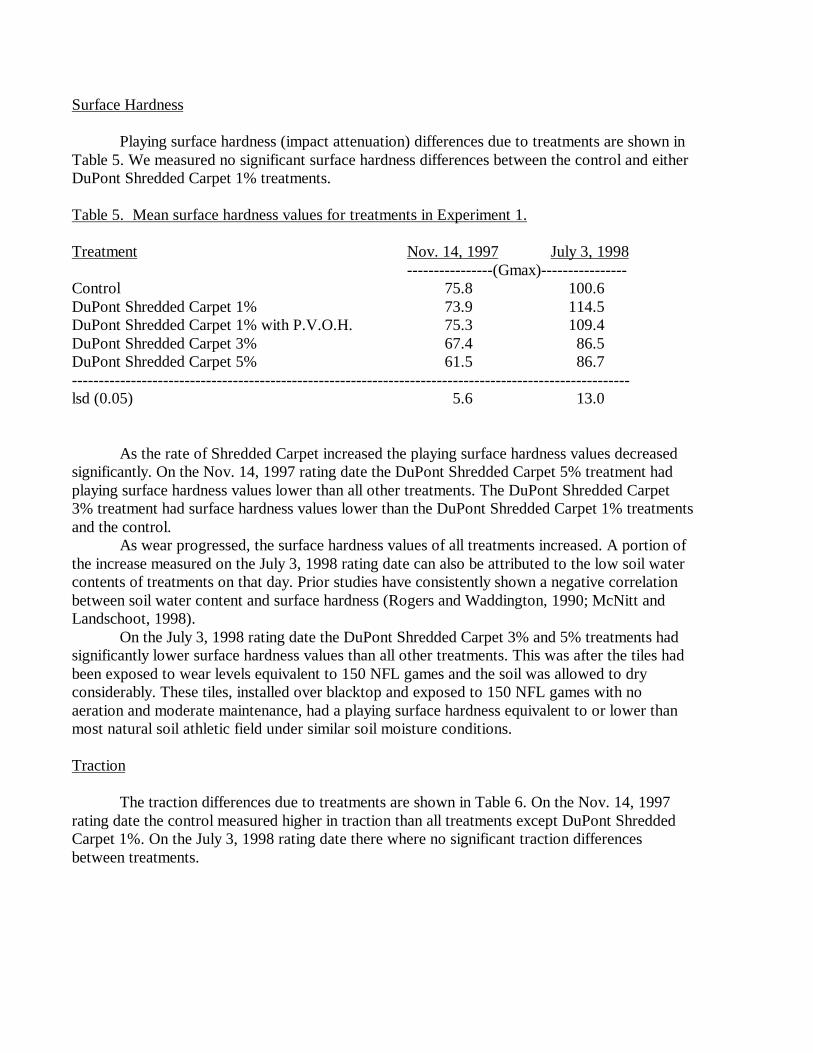
Surface Hardness
Playing surface hardness (impact attenuation) differences due to treatments are shown inTable 5. We measured no significant surface hardness differences between the control and eitherDuPont Shredded Carpet 1% treatments.
Table 5. Mean surface hardness values for treatments in Experiment 1.
Treatment Nov. 14, 1997 July 3, 1998----------------(Gmax)----------------
Control 75.8 100.6DuPont Shredded Carpet 1% 73.9 114.5DuPont Shredded Carpet 1% with P.V.O.H. 75.3 109.4DuPont Shredded Carpet 3% 67.4 86.5DuPont Shredded Carpet 5% 61.5 86.7--------------------------------------------------------------------------------------------------------lsd (0.05) 5.6 13.0
As the rate of Shredded Carpet increased the playing surface hardness values decreasedsignificantly. On the Nov. 14, 1997 rating date the DuPont Shredded Carpet 5% treatment hadplaying surface hardness values lower than all other treatments. The DuPont Shredded Carpet3% treatment had surface hardness values lower than the DuPont Shredded Carpet 1% treatmentsand the control.
As wear progressed, the surface hardness values of all treatments increased. A portion ofthe increase measured on the July 3, 1998 rating date can also be attributed to the low soil watercontents of treatments on that day. Prior studies have consistently shown a negative correlationbetween soil water content and surface hardness (Rogers and Waddington, 1990; McNitt andLandschoot, 1998).
On the July 3, 1998 rating date the DuPont Shredded Carpet 3% and 5% treatments hadsignificantly lower surface hardness values than all other treatments. This was after the tiles hadbeen exposed to wear levels equivalent to 150 NFL games and the soil was allowed to dryconsiderably. These tiles, installed over blacktop and exposed to 150 NFL games with noaeration and moderate maintenance, had a playing surface hardness equivalent to or lower thanmost natural soil athletic field under similar soil moisture conditions.
Traction
The traction differences due to treatments are shown in Table 6. On the Nov. 14, 1997rating date the control measured higher in traction than all treatments except DuPont ShreddedCarpet 1%. On the July 3, 1998 rating date there where no significant traction differencesbetween treatments.

Table 5. Mean traction values for treatments in Experiment 1.
Treatment Nov. 14, 1997 July 3, 1998----------------(Newtons)-------------
Control 1419 1405DuPont Shredded Carpet 1% 1360 1459DuPont Shredded Carpet 1% with P.V.O.H. 1396 1378DuPont Shredded Carpet 3% 1336 1373DuPont Shredded Carpet 5% 1356 1349--------------------------------------------------------------------------------------------------------lsd (0.05) 48 81
Traction differences between treatments were generally small. This indicates that the addition ofthe DuPont Shredded Carpet does not increase or decrease traction. These results coupled withthe results of other studies (McNitt et al., 1997) show no evidence of an increased trippinghazard due to the addition of Shredded Carpet.
Turfgrass Quality
The turfgrass quality ratings for treatments are shown in Table 7. There were nosignificant turfgrass quality differences between treatments on either rating date. The thirdcolumn in the table shows the amount of recovery observed two weeks after wear treatments hadstopped. While the DuPont Shredded Carpet 1% with PVOH had the highest recovery rating, thedifference was not statistically significant compared to the other treatments.
Table 7. Turfgrass Visual Ratings (5 = most dense, 0 = least dense) in Experiment 1.
Treatment Nov. 14, 1997 July 3, 1998 Recovery------------------------(5 - 0)------------------
Control 4.2 2.6 0.1DuPont Shredded Carpet 1% 3.8 2.9 0.2DuPont Shredded Carpet 1% with P.V.O.H. 4.1 2.9 0.7DuPont Shredded Carpet 3% 4.0 3.0 0.5DuPont Shredded Carpet 5% 3.9 3.1 0.5---------------------------------------------------------------------------------------------------------lsd (0.05) NS NS NS
The important thing to note in the data in Table 7 is that all treatments showed highquality turf on the Nov. 14, 1997 rating date after the equivalent of over 70 NFL games. Evenafter 150 NFL games all the treatments were at or very close to an acceptable rating of 3.0. Thisdata demonstrates that this modular system can more than adequately sustain quality turfgrassunder extreme wear conditions with only a 2.25 inch root-zone depth.

Divoting
The divot testing was performed once at the end of the study due to the destructive natureof the test. The divot dimensions for treatments are listed in Table 8.
Table 8. Divot width and length for treatments in Experiment 1.
Treatment Width Length -------------(cm)-------------Control 9.4 27.2DuPont Shredded Carpet 1% 8.1 13.2DuPont Shredded Carpet 1% with P.V.O.H. 8.1 14.7DuPont Shredded Carpet 3% 7.9 11.9DuPont Shredded Carpet 5% 7.4 10.7--------------------------------------------------------------------------------------------------lsd (0.05) 0.8 5.6
The control had divots that were larger than any treatment containing DuPont ShreddedCarpet. The divot length for the control was essentially double in size compared to treatmentscontaining Shredded Carpet. The divot width is controlled to some degree by the width of theclub head and less dramatic differences were measured in this dimension. A trend was evident,with increasing concentrations of Shredded Carpet resulting in smaller divot width. Thesedifferences were not statistically significant between varying rates of Shredded Carpet but thecontrol had divot widths larger than any other treatments.
These results are in general agreement with the results found by McNitt et al. 1996,where the addition of DuPont Shredded Carpet reduced divot size by half compared to thecontrol.
EXPERIMENT 2 – GROW-IN
Soil Bulk Density
The results for the soil bulk density values are listed in Table 9. All treatments containingDuPont Shredded Carpet measured lower in soil bulk density than the control. This was the casefor both the no wear and high wear subplots. DuPont Shredded Carpet 5% measured lower insoil bulk density than any other treatment under all wear levels on both rating dates. The DuPontShredded Carpet 3% with PVOH had a higher bulk density than the DuPont Shredded Carpet 3%on both rating dates after wear was applied and on the second rating date under the no weartreatments.

Table 9. Mean soil bulk density values for treatments in Experiment 2.
No High No HighTreatment Wear Wear Wear Wear
---------------(g/cubic cm)--------------Control 1.25 1.55 1.21 1.30DuPont Shredded Carpet 3% 1.08 1.32 1.08 1.13DuPont Shredded Carpet 3% with P.V.O.H. 1.13 1.37 1.07 1.18DuPont Shredded Carpet 5% 1.04 1.25 1.03 1.08---------------------------------------------------------------------------------------------------------lsd (0.05) .03 .03 .03 .03
As the rate of DuPont Shredded Carpet increased the soil bulk density decreased. Theseresults are similar to the results for Experiment 1 and show that when exposed to wear there islittle gained in soil bulk density reduction from placing the tiles over 8 inches of sand. There is amuch greater reduction in soil bulk density by the addition of at least 3% DuPont ShreddedCarpet by weight.
Soil water content
Soil water content differences due to treatments are shown in Table 10. The treatmentscontaining DuPont Shredded Carpet contained less water than the control on the first rating date,over both wear levels. While the differences are small they are significant and show a differencebetween growing in the tiles and placing them over blacktop. In the overlay study (Experiment1), there was no differences in water contents due to treatments. When the tiles were placed over8 inches of sand (Experiment 2), the tiles held a few percent less water if they contained theDuPont Shredded Carpet. This may be due to the lower soil bulk density creating greater aerationporosity in the treatments containing DuPont Shredded Carpet. By the second rating date, aftermore wear was applied there was no difference in soil water content due to treatments.
Table 10. Mean soil water content values for treatments in Experiment 2.
No High No HighTreatment Wear Wear Wear Wear
----------------(% by vol.)---------------Control 14.8 14.8 6.2 7.3DuPont Shredded Carpet 3% 12.7 12.7 7.1 7.7DuPont Shredded Carpet 3% with P.V.O.H. 12.9 12.4 7.0 7.9DuPont Shredded Carpet 5% 11.8 11.8 7.0 7.6---------------------------------------------------------------------------------------------------------lsd (0.05) 1.3 1.3 NS NS

Surface hardness
Surface hardness differences due to wear are listed in Table 11. On the first rating dateunder the no wear level, no surface hardness differences between treatments were measured. Onthe high wear level plots the DuPont Shredded Carpet 5% treatment had lower surface hardnessvalues than all other treatments. There was no significant difference between the control and theDuPont Shredded Carpet 3% or 3% with PVOH.
Table 11. Mean surface hardness values for treatments in Experiment 2.
No High No HighTreatment Wear Wear Wear Wear
-------------------(g/cc)------------------Control 65.7 86.9 74.2 85.6DuPont Shredded Carpet 3% 64.3 85.0 74.3 83.7DuPont Shredded Carpet 3% with P.V.O.H. 66.2 84.6 74.7 80.0DuPont Shredded Carpet 5% 63.1 78.9 70.3 69.8---------------------------------------------------------------------------------------------------------lsd (0.05) NS 3.0 4.2 4.2
On the second rating date, after approximately 37.5 NFL games of wear, the DuPontShredded Carpet 5% treatment had lower surface hardness values than all other treatments. TheDuPont Shredded Carpet 3% with PVOH also had a lower surface hardness value than thecontrol. Under the no wear level few differences were measured. The DuPont Shredded Carpet5% treatment had a statistically lower surface hardness value than the DuPont Shredded Carpet3% with PVOH. This difference is relatively small and of little practical significance.
Comparing the values obtained when the tiles are installed over 8 inches of sand versusover blacktop, we see that the tiles over blacktop did have slightly higher surface hardness valuesafter 150 NFL games. For instance the DuPont Shredded Carpet 3% treatment had a surfacehardness value of 86.5 over blacktop and 83.7 over sand, while the DuPont Shredded Carpet 5%treatment had a surface hardness value of 86.7 over blacktop and 69.8 over sand. After 75 NFLgames, the tiles installed over blacktop had surface hardness values lower than newly installedartificial turf (typically mid seventies) and after 150 games and under dry soil moisture conditionthe tiles installed over blacktop had surface hardness values that would be considered in thenormal range for a natural turfgrass playing field that was low in soil moisture (mid eighties).
Traction
Traction differences due to treatments are shown in Table 12. There were few differencesmeasured. On the October 14, 1998 rating date, the DuPont Shredded Carpet 5% treatment had astatistically higher traction value than the control under the no wear level. There is little evidenceto suggest a significant change in traction due to the presence of DuPont Shredded Carpet.

Table 12. Mean linear traction values for treatments in Experiment 2.
No High No HighTreatment Wear Wear Wear Wear
----------------(Newtons)----------------Control 1495 1343 1433 1370DuPont Shredded Carpet 3% 1465 1290 1460 1370DuPont Shredded Carpet 3% with P.V.O.H. 1465 1314 1440 1400DuPont Shredded Carpet 5% 1414 1349 1486 1405---------------------------------------------------------------------------------------------------------lsd (0.05) NS NS 35.8 NS
Turfgrass Quality
The turfgrass quality data for treatments in Experiment 2 are listed in Table 13. Therewere few significant differences in quality between treatments. On the October 14, 1998 ratingdate both 3% treatments had higher turfgrass quality than either the control or the DuPontShredded Carpet 5% treatment.
Table 13. Turfgrass Visual Ratings (5 = most dense, 0 = least dense) for treatments inExperiment 2.
No High No HighTreatment Wear Wear Wear Wear
-------------------(5 - 0)-------------------Control 5 3.1 5 2.0DuPont Shredded Carpet 3% 5 3.1 5 2.5DuPont Shredded Carpet 3% with P.V.O.H. 5 2.8 5 2.3DuPont Shredded Carpet 5% 5 3.3 5 2.0----------------------------------------------------------------------------------------------------------lsd (0.05) NS 0.3
While the tiles performed well in Experiment 2, the turfgrass quality ratings at the end ofthe study were lower than those at the end of Experiment 1. Both experiments received onlymoderate maintenance. I believe that Experiment 2 received inadequate water at times, whichreduced the turfgrass quality. We observed that the grow-in study (Experiment 2) required morewater than the overlay study (Experiment 1). Had Experiment 2 received more water, theturfgrass quality results may have been different. Nevertheless, these results indicate the ease ofgrowing a quality playing surface using just the tiles and a drain pad over a hard surface. To oursurprise the tiles installed over the blacktop required equal or at times less maintenance than thetiles installed over 8 inches of a USGA specified sand.

Divoting
The divot testing was done once at the end of the study due to the destructive nature ofthe test. The divot lengths for treatments in Experiment 2 are listed in Table 14.
For the high wear level subplots, the control had divots that were larger than anytreatment containing DuPont Shredded Carpet. The divot length for the control averaged 50%greater in length than the other treatments. Under the no wear level, the control had divot lengthsgreater than the DuPont Shredded Carpet 3% treatment on the July 3, 1998 rating date.
These results are in general agreement with the results from Experiment 1 and thosefound by McNitt et al. 1996, where the addition of DuPont Shredded Carpet, at a 3% rate,reduced divot size by half compared to the control.
Table 14. Divot length for treatments in Experiment 2.
No High No HighTreatment Wear Wear Wear Wear --------------------(cm)--------------------Control 6.6 16.0 9.2 11.4DuPont Shredded Carpet 3% 5.4 10.2 8.6 8.5DuPont Shredded Carpet 3% with P.V.O.H. 6.2 9.2 8.4 7.6DuPont Shredded Carpet 5% 6.2 8.9 9.2 7.1----------------------------------------------------------------------------------------------------------lsd (0.05) 1.1 1.1 NS 2.5
Summary
These results demonstrate that the modular system containing DuPont Shredded Carpetreduces soil bulk density, reduces surface hardness, and reduces divoting, while maintainingequivalent traction characteristics. This study compared tiles installed over blacktop with tilesinstalled over an eight-inch root-zone. We did not find major differences in soil physicalcharacteristics or playing surface quality between the two installation procedures. This studydemonstrates that with proper maintenance, the tile system, containing at least 3% DuPontShredded Carpet, can provide a quality playing surface using either of the two installationprocedures.

Bibliography
Cockerham, S.T. and D.J. Brinkman. 1989. A simulator for cleated-shoe sports traffic on turfgrass research plots.California Turfgrass Culture. 39(3 & 4):9-10.
McNitt, A.S., P.J. Landschoot, and J.L. Keller. 1997. Evaluation of an athletic field root-zone amended with DuPontshredded carpet. Submitted to: DuPont Nylon. 21 pp.
McNitt, A.S. and P.J. Landschoot. 1998. The effects of soil inclusions on soil physical properties and athletic fieldplaying surface quality. Submitted to: DuPont Nylon, NIKE, Inc., and SportGrass, Inc., 45 pp.
McNitt, A. S., D. V. Waddington, and R. O. Middour. 1996. Traction measurement on natural turf. In Earl F.Hoerner (ed.) Safety in American Football. ASTM STP 1305. American Society for Testing Materials. pp. 145-155.
McNitt, A. S., R. O. Middour, and D. V. Waddington. 1997. Development and evaluation of a method to measuretraction on turfgrass surfaces. Journal of Testing and Evaluation. JTEVA, Vol. 25, no. 1. pp. 99-107.
Rogers III, J.N. and D.V. Waddington. 1989. The effect of cutting height and verdure on impact absorption andtraction characteristics in tall fescue turf. J. Sports Turf Res. Inst. 65:80-90.
Rogers III, J.N. and D.V. Waddington. 1990. Effects of management practices on impact absorption and shearresistance in natural turf. p. 136-146. In R.C. Schmidt et al. (ed.) Natural and artificial playing fields: characteristicsand safety features. ASTM STP 1073. ASTM, Philadelphia, PA.
The Effects of Crumb Rubber on the Density and Surface Hardness ofPerennial Ryegrass
G. W. Hamilton, Department of AgronomyPenn State University
Funding Sources: Niche Recycling
Introduction
Applications of crumb rubber to turfgrass sites has been identified as a positive practicewhich can increase wear tolerance of turf under wear stress. Rogers et al. (1998) reported thatcrumb rubber topdressings increased turf cover and had other positive effects on a Kentuckybluegrass-perennial ryegrass turf which was subjected to simulate traffic.
The objective of this study was to evaluate the crumb rubber provided by NicheRecycling as a material for topdressing turfgrass sites to increase turfgrass wear tolerance.
Materials and Methods
The experimental site was a perennial ryegrass (var. SR4200) grown on a Hagerstownsilt-loam soil at the Valentine Turfgrass Research Center in University Park, PA. The site wasmowed at 0.5 inches three times per week and clippings were returned. The plots received 3 lbsof nitrogen per 1,000 sq ft in 1998. The turf was irrigated as needed to provide adequate growth.The experimental area did not receive any pesticide applications or cultivation treatments.
The crumb rubber used (supplied by Niche Recycling) had a bulk density of 32 lbs/cubicft. Treatments (1/8, 1/4, 3/8 inches deep) were individually weighed and applied by hand. Theplots were not mowed for a few days following crumb rubber applications. Plots were 4 by 6 ftand arranged in a randomized complete block design with three replications. Applications weremade on July 6 and September 4, 1998.
Traffic simulation was done using a Brinkman Wear Simulator (Figure 1). TheBrinkman simulates traffic by using dual rollers with welded bolts (to mimic cleats) protrudingfrom the rollers surfaces. The rollers turn at different speeds to create a shearing action to causewear to the turf. Theoretically, two passes with the Brinkman simulates the traffic of one NFLfootball game inside of the hash marks at the 40 yard line, although it does not take divoting intoconsideration. Five passes were made on the plots every Monday and Friday to simulate fivegames per week.
Visual turf density ratings and Clegg impact measurements were made on September 4,30, and November 23. The September ratings were 58 and 84 days after the first application ofcrumb rubber. The November 23 rating was 54 days after the second application of crumbrubber.
Visual density ratings were done on a scale of 1 to 10, with 10 being full turf coverageand 1 being bare ground. Surface hardness characteristics were measured with a Clegg ImpactHammer. The Clegg consists of a missile which is dropped through a guide tube and measuresthe maximum deceleration (Gmax) of the missile upon impacting the surface.

Figure 1. Brinkman Wear Simulator
The higher the Gmax value, the higher the surface hardness. Five drops of the hammerwere done on each plot on each rating date.
All data was subjected to analysis of variance procedures. Treatment means wereseparated on each rating date using the Least Significant Difference test with p = 0.05.
Results and Discussion
Visual densities were the lowest for the rating dates 54 and 58 days after the first andsecond crumb rubber applications, respectively (Table 1). There were no statistical differencesbetween treatments on any of the three rating dates.
Table 1. Turfgrass densities for a perennial ryegrass turf treated with crumb rubber.
Treatment Depth 9/4/98 9/30/98 11/23/98(in)
Crumb Rubber 0.125 6.2 a* 8.0 a 6.8 aCrumb Rubber 0.250 6.5 a 8.8 a 7.3 aCrumb Rubber 0.375 6.5 a 8.7 a 6.7 aUntreated Control 0.00 5.8 a 8.2 a 6.3 a*Treatments within the same column followed by the same letter are not statistically different according to the Least Significant Difference test with p = 0.05.
There were statistical differences on the September 4 and November 23 ratings dates forsurface hardness (Table 2). On September 4, the 0.125 and 0.25 inch treatments hadsignificantly higher surface hardness values as compared to the untreated controlled. The 0.375inch treatment also had significantly high surface hardness values as compared to the control onthe November 23 rating.

Table 2. Clegg impact values (Gmax) of a perennial ryegrass turf treated with crumb rubber.Treatment Depth 9/4/98 9/30/98 11/23/98
(in)
Crumb Rubber 0.125 88.5 a* 78.3 a 87.1 aCrumb Rubber 0.250 83.4 ab 83.3 a 83.8 aCrumb Rubber 0.375 75.9 bc 78.7 a 83.6 aUntreated Control 0.00 72.2 c 74.1 a 70.7 b*Treatments within the same column followed by the same letter are not statistically different according to the Least Significant Difference test with p = 0.05.
A possible reason for not seeing any differences between treatments may be that thecrumb rubber is too coarse or may not have been worked in to a position that can provide crownprotection. Rogers et al. observed that the size of the crumb rubber and the time for the crumbrubber to become effective is very important in crumb rubber performance. The crumb rubberprovided by Niche recycling was very coarse as compared to the crumb rubber that iscommercially available (Figure 2). The crumb rubber used in this study may become moreeffective in the following season.
Figure 2. 1 gram of Crown III crumb rubber (left) as compared to 1 gram of Niche Recycling rubber (right).
Conclusions
The crumb rubber applied twice at depths of 0.125, 0.25, and 0.375 inches did not haveany significant effect on the density of a perennial ryegrass turf under simulated traffic. Thecrumb rubber treatments did significantly increase the surface hardness of the turf on two of thethree rating dates.
Due to the large size of the crumb rubber used in this study, the benefits of providingimproved turf performance may not be noticeable until the season following the application.

20
A Procedure to Evaluate Golf Shoe Tread Types
G. W. Hamilton, Department of AgronomyPenn State University
Funding Sources: Etonic Corporation
Introduction
The golf course industry has quickly accepted and encouraged the prohibition of metalspikes from golf courses. This exclusion of metal spikes is driven by a reduction of wear anddamage on the golf course and in the clubhouse.
To fill the demand for alternative spikes, shoe companies have aggressively developedand marketed numerous spike and outsole designs. Unfortunately, there has not been a lot ofresearch devoted to evaluating the effects that the new designs have on turfgrass quality, andmore importantly, putting quality.
The objective of this study was to develop a procedure which could be used to evaluatethe effect of golf shoe tread type on putting quality.
Materials and Methods
Three significantly different sole designs were used for this study to provide the bestchance to create putting quality variation. The shoes used were conventional metal spikes (FootJoy 98891), Womens Difference with DS-1 spikes (Etonic 8510), and Womens Stable Lites withmolded soft- spike outsole (Etonic 8995).
The experimental site was located in University Park, PA. Two different areas were usedfor the study. One area had a rootzone comprised of native silt loam soil with a 3 to 4-inch layerof topdressing sand on the top (i.e., “push-up” style) and the other rootzone was an all sandrootzone. The turf composition on both areas was a mixture of Penncross creeping bentgrass andannual bluegrass maintained daily at 5/32 of an inch.
Plots were 2 by 15 ft and arranged in a randomized complete block design with fivereplications. A mechanical putter was built to roll the ball across the plot after traffic wasapplied. The putter minimized variability in ball roll and was almost 100% accurate. The putterwas set at one end of a plot and 10 balls were rolled over the middle of the plot to determine theaverage stopping position of the balls. A putting green cup was placed on the average stoppingposition. A few more balls were rolled to ensure that the cup position was accurate. A hole wasthen cut with a cup cutter at the location, and the cup was installed. Care was taken not to walkon or disturb the ball roll path during the installation process.
Ten balls were rolled without any traffic being applied to serve as a control. Treatmentswere applied at five traverse intervals by simulating putting with a person wearing the treatmentshoes. The person would begin by standing in front of the mechanical putter and addressing theball. The ball was then putted from the adjacent plot towards the cup in the treatment plot. Theperson then turned and walked towards the cup, retrieved the ball, and returned towards theputter to repeat the process (equaling two traverses). Care was given to vary the traffic acrossthe plot and to simulate normal walking and turning as much as possible.

21
Once the five traverses were applied, ten more ball rolls were made and number of puttsmade were recorded. Ninety traverses of traffic were applied in total. Data was analyzed usingrepeated measures analysis of variance using the mixed procedure of SAS.
The experimental sites were also characterized for organic matter content and surfacehardness. Organic matter content was determined for the top ½ and 1 inch of the profile. Soilsamples were removed with a ½ by 3 inch soil profiler. Ten samples at each depth wereremoved from each site. Samples were oven-dried at 102oC for 24 hours to remove moisture.The dried samples were weighed and put in a muffle furnace at 700oC for 12 hours to burn off allof the organic matter. The remaining inorganic matter was weighed, and organic matter contentwas calculated.
Surface hardness measurements were done with a Clegg Impact tester. The Cleggconsists of a missile that is dropped through a guide tube. The missile contains an accelerometerthat measures the peak deceleration (Gmax) as the missile impacts the surface. Gmax valuesincrease as surface hardness increases.
Results and Discussion
There were significant differences for percentage of putts made between tread types onboth rootzones. On the “push-up” style rootzone (Figure 1) there were significant differencesbetween all three tread types (Table 1). The Foot Joy 98891 decreased the percentage of puttsmade the most, followed by Etonic 8510, and the shoe affecting putting the least was Etonic8995. On the all sand
Figure 1. Percentage of putts made on a "push-up" style rootzone.
0
20
40
60
80
100
0 10 20 30 40 50 60 70 80 90
Traverses
% o
f Put
ts M
ade
Foot-Joy98891Etonic 8510
Etonic 8995Clegg Impact=90g's1/2"OM Content=15%1"OM Content=10%

22
rootzone (Figure 2), the two Etonic shoes affected putting the same and significantly less thanthe metal spike shoe (Table 1).
The organic matter contents of both rootzones were very similar at both sampling depths(Figures 1 and 2). The Clegg Gmax values were different for the two rootzones, 90 g’s and 63g’s for the push-up and all sand rootzones, respectively. The surface hardness differences maybe a good indication as to why the results varied between rootzones.
Table 1. Averages of putts made for three different tread types on two different rootzones.Treatment “Push-Up” Style Rootzone All Sand Rootzone
--------------------------- % of Putts Made ----------------------------
Foot Joy 98891 (metal) 60 a* 47 aEtonic 8510 (DS-1) 75 b 71 bEtonic 8995 (outsole) 88 c 72 b*Means within the same column followed by the same letter are not statistically different at p =0.05.
Conclusions
The mechanical putter and procedure developed in this study appear to be appropriate toevaluate the effects of shoe tread type on putting quality. Significant differences between threedifferent tread types were observed on two different rootzone mixes. More research should beconducted on other rootzones to evaluate the procedure under different conditions.
Figure 2. Percentage of putts made on an all sand rootzone.
0102030405060708090
100
0 10 20 30 40 50 60 70 80 90
Traverses
% o
f Put
ts M
ade
Foot-Joy98891Etonic 8510
Etonic 8995Clegg Impact=63g's1/2"OM Content=15%1"OM Content=8%

Cultivar Development and Extreme Temperature Tolerance of Greens-typePoa annua L.
David R. Huff, Roy Knupp, Rhonda Witmer, Kim Dobson, Eric Lyons, and George HamiltonDepartment of Agronomy, Penn State University
Introduction
Annual bluegrass (Poa annua L.) makes up a large portion of the putting surfaces in manyregions of the US and Canada. Given its wide-spread occurrence in the golf industry, there iscurrently a need for high quality, commercially available sources of greens-type P. annua for use inconstructing, renovating, and maintaining P. annua golf greens. Greens-type P. annua actually hasmany characteristics that make it enviable as a putting surface. Typically, greens-type Poa hashigh shoot densities, an upright growth habit that lacks grain, and aggressively inhabits golf greensmaintained at extremely close (<1/8 inch) mowing heights. A severe agronomic disadvantage ofPoa annua L. is its susceptibility to extreme temperature stress. This project will seek to developtechniques to screen large numbers of germplasm accessions for tolerances to extremetemperatures and coverage by sheets of ice, and thereby attempt to aid the breeding program toimprove the adaptation of greens-type Poa annua cultivars within regions of intended use. Thepurpose of this research is not to replace creeping bentgrass as a putting surface but rather to offeran alternative to those golf courses where P. annua is simply a better choice.
I. Breeding and Cultivar Development: Progress, Results, and Observations
Germplasm Collection and Evaluation: The germplasm collections from southern California(Industry Hills GC) and northern California (California Club GC, San Francisco Club GC, andOlympic Club) were entirely destroyed by an unidentified disease in our greenhouse this summer.My plans are to recollect from these regions as I believe this event was a greenhouse problem andmight not have necessarily manifested itself under field grown conditions. Last year's germplasmcollection from Oregon and Washington (a total of 279 selections) was established as solid sod inthe experimental Poa green at the Valentine Research Facility. Color, density, overall quality, anddollar spot disease ratings were collected from these strains this fall.
Additional evaluation plots were seeded in the fall of 1999. To date most of our evaluationplots have been established as solid sod grown in the greenhouse. This seeded trial is the project'sfirst fully seeded trial and the first established on a USGA spec green. The fall 99 evaluation trialconsists of 16 entries with three replications. Plot size is approximately 4'x6'.
An interesting observation was made concerning nematode resistance in the field whilecollecting at the California Club GC. The nematode Anguina pacificae creates a very seriousproblem for Poa greens in northern California. At two major infestations, I noticed where thenematodes were apparently avoiding particular strains. I collected samples from each of two ofthese strains however, these strains were lost along with the rest of the California collection. I'm

looking forward to revisiting these and other sites during the spring of 2000 when this pacific coastshoot gall nematode disease is active to further investigate the potential of biological control.
I have assembled a team of researchers to aid me in the investigation of alternative controlstrategies of the pacific coast shoot gall nematode. Dr. Mary Ann Bruns is a soil microbialecologist and Norm Conrad is an extension specialist who teaches short-courses in nematology.Our intention to is assay various commercial products for biological control and to determine ifany mechanism of resistance or differential tolerance exists in any of the local strains of Poaannua. To aid us in this work, we are currently preparing a grant proposal for consideration bythe Northern California Golf Association and/or the Northern California Golf CourseSuperintendents Association.
Regional Testing: It is my intention to place increased emphasis on regional testing. Numerousindividuals have made offers to establish and maintain golf green plots of this project's selectedstrains of Poa annua. This past summer, seed of three selections were sent to Jim Ross at OldsCollege for a Fall 99 establishment. As additional seed becomes available from these and otherpromising selections, I will begin to work with more and more cooperators for testing andevaluations. In the future, representative cooperators will be identified within specific regionsacross the USA and Canada who are willing to evaluate our elite strains of greens-type Poa annua:
Seed Production and Increase: Much of our work this fall was focused on generating seedincrease for future regional testing and evaluation purposes. The spring 1999 seed harvest ofselected strains was relatively good despite having a major snow mold infection of our seedproduction plots. In September 99 seed of three selected accessions were sown into seedproduction plots approximating 1,200 sq. ft each. An additional four accessions were sown intoplots approximately 400 sq. ft each, an additional three accessions were sown into plots 60 sq. fteach, and an additional six accessions went into plots 30 sq. ft each. Although seed yield isstrongly dependent on the accession, we expect the larger plots to yield between six and eight lbs.of seed.
As spring 2000 will be our largest scale seed harvest to date, we are still consideringadditional options for the best method of harvesting greens-type Poa seed. In any event, weshould have plenty of seed for regional testing purposes for several of the selected accessions.One regional test generally requires about 60 grams of seed for three plots of size 4'x6'.
Numerous small seed production plots were also established in the fall of 1999 for a largenumber of additional accessions originating from Long Island, NY. Several of these strains lookquite promising including one with excellent field resistance to dollar spot. This is the first groupof accessions entering into our modified cultivar development scheme, which includes an earlyphase of seed increase.
Genetic Identification and Manipulation of Polyhaploids: Poa annua's evolutionary history(allopolyploidy) suggests that the observed sexual sterility of particular strains is likely due to thegenetic state of these accessions being sterile dihaploids (plants derived from an unfertilized,reduced egg). The results of our previous research suggest that we are capable of manipulatingthe ploidy level of such sterile dihaploids, and in doing so, are able to restore their ability to setviable seed. We are continuing our efforts researching the genetics of our experimental dihaploidsas well as to apply our new found knowledge to a wider array of sterile Poa annuas exhibiting highquality. I expect our work in the manipulation of polyhaploids to become an intregal part of thebreeding program, enabling us to make greater progress in understanding the evolutionary events

that occur on golf greens involving Poa annua and eventually allowing us to better identify andmanipulate agronomically important traits in the species.
II. Extreme Temperature Tolerance: Progress, Results, and Observations
Assessing the relative low-temperature tolerance among ecotypes (Laval): This part of theproject is performed in collaboration with Julie Dionne, Horticultural Research Center, LavalUniversity and Dr. Yves Castonguay, Agriculture Canada Research Center in Ste-Foy. Previousresults from the Laval group demonstrated that differences in low-temperature tolerance existamong Poa accessions. In the upcoming future, they will begin to examine the molecular basis ofcold tolerance differences. I will continue to work with the Laval group and supply them withinteresting and contrasting plant materials.
Assessing the relative survival of Poa and bentgrass given a cycling of freeze-thawconditions: Last year's results suggested that neither Poa nor bentgrass was capable of survivingmultiple freeze-thaw cycles and that survival progressively decreased as the number of freeze-thawcycles increased. Our attempt this year to confirm this result was inconclusive as the experimentfailed due to the plants becoming desiccated in the growth chamber. At this point, I am uncertainif this aspect of the project will continue due to limited time and resources.
Determining the artificial conditions for assessing heat tolerance among ecotypes: InSeptember 1999 Rhonda Witmer was hired to assist in the field and greenhouse aspects of thebreeding program. In addition, Rhonda has been performing the heat tolerance testing using alinear gradient sand heat bench. She has completed upgrades of the linear gradient sand heatbench and begun testing various greens-type Poas and bentgrass. I look forward to veryinteresting data and results in the future.
Determining the artificial conditions necessary for assessing ice coverage tolerance amongecotypes: Our attempts to directly evaluate differential ice coverage tolerance among Poas hasnot been successful. Mr. George Hamilton has taken on this part of the project as his Ph.D.dissertation. George is focusing on those environmental conditions that induce and reverse thehardening process. He has discovered a critical temperature difference between bentgrass and Poaduring the hardening process and will continue to evaluate exposure times and response to daylength to conclude his hardening experiments. Once completed, George will begin to examine theeffects of ice coverage using a variety of hardening and de-hardening treatments.
Examining the root dynamics of ecotypes throughout the seasons and during periods ofextreme temperature stress: Graduate student Eric Lyons, a National Science FoundationFellow in Penn State's Root Biology program, has begun to research the root dynamics of greens-type Poa annua for his Ph.D. The purpose of his study will be to understand the rootingcharacteristics of different ecotypes throughout the entire year, while concentrating on times ofextreme temperature stress (heat and cold). His study will examine characteristics of Poa annuaroot systems during cold acclimation, throughout the winter, and continue during spring rootinitiation to determine the ability of the root system to survive cold temperatures. Root mass,depth, viable length, and root fate will be assessed during the fall, winter, spring, and summer

seasons in order to fully assess the root dynamics of contrasting Poa ecotypes. We will alsoattempt to correlate root dynamic parameters with plant survival and performance in times ofextreme temperature stress to enable us to more efficiently evaluate our greens-type Poa annuagermplasm resources. To this end, we built a 5,000 sq.ft. experimental USGA spec green tospecifically study roots and in August sent Eric to work with Dr. B. Huang at Kansas StateUniversity. whose lab group performs similar research on bentgrass.

Creeping Bentgrass Morphogenesis and Competition
A. J. TurgeonDepartment of Agronomy
1. Creeping bentgrass morphogenesis.
In cooperation with an undergraduate student, Jay Keller, we have documented--through anextensive series of photomicrographs--the growth and development of three creepingbentgrass cultivars: Penncross (low-density, prostrate-growing), Pennlinks (medium-density,upright-growing), and Penn G2 (high-density, upright-growing). This was done to gain aclearer understanding of the morphogenetic basis for the performance of these cultivars in thefield. Currently, we are beginning a new series of morphogenetic investigations using threeselections of annual bluegrass, including two perennial types and a wild, annual type.
2. Creeping bentgrass-annual bluegrass competition.
A field study was initiated in 1997 to study the competitive relationship between 10 annualbluegrass selections and three creeping bentgrass cultivars under two mowing heights. At thehigher (7/16 inch) mowing height simulating fairway culture, most annual bluegrassselections essentially disappeared, reflecting the superior competitive ability of the creepingbentgrass at that height. At the lower (1/8 inch) height simulating greens culture, however,some annual bluegrass selections expanded their coverage while others contracted, comparedwith the 4-inch-diameter plugs used for initial establishment. Finally, the three creepingbentgrasses varied slightly in their competitive ability, based on the average size of annualbluegrass plugs; the most competitive was Penn A-4 while Pennlinks was least competitive.

Loss of Greens-Grade Potassium Containing Fertilizers Due to Mowing
C. F. Mancino, Associate Professor – Turf/Soil ScienceD. M. Petrunak, Research TechnicianD. Wilkinson, Undergraduate Student
Department of Agronomy, Penn State University
Introduction
Potassium is found in relatively large levels within the turfgrass plant. This macro-nutrient has been associated with disease, drought, heat and cold tolerance of the plant, as wellimproved wear tolerance of turf (Beard, 1973; Turner and Hummel, 1992). Potassium can beprovided to the plant in large enough quantities by soils containing appreciable amounts of clay.However, sandy soils are often used as the medium for growing fine turf because these soils areresistant to compaction and have good internal drainage characteristics. Specific guidelines havebeen developed for the construction of artificial sand: peat turfgrass rootzone mixes (USGA,1993). At the same time, sandy soils and sand:peat rootzone mixes tend to be low in moistureand nutrient retention and, as a result, have low amounts of available potassium. Under theseconditions the use of potassium fertilizers by turf managers can be quite extensive and isconsidered to be 1.5 to 4 kg K2O/acre/yr (3 to 8 lbs./1000sq.ft. /yr.) split into 4 to 6 applicationsfor bentgrass and bermudagrass putting greens (Beard, 1982).
The fate of potassium in agricultural soils includes adsorption to cation exhange sites,fixation by certain types of clay minerals, absorption by plants, leaching from sandy soils, runoff,and erosion (Brady, 1990). In turf the loss of potassium by runoff and erosion are probablyminimal because of dense and perennial nature of the turf stand. Leaching could be a mode ofloss when the turf is grown under sandy soil conditions. A unique means of potassium loss froma turfgrass site could be the removal of fertilizer potassium with turf clippings during routinemowing, especially from low cut turf found on golf course putting greens, bowling greens, tenniscourts, cricket pitches and other sites where mowing heights may be < 6 mm. Mancino andHornstein (2000) reported that N loss from greens-grade granular fertilizers (SGN of 100 to 140)applied to a putting green (4 mm height of cut) could range from 7.5 to >30 % of the applied N,depending on the particular fertilizer. Work by Woolhouse (1973; 1974) found total mowerfertilizer N loss to range from 17.1 to 20.9% from a perennial ryegrass sward maintained at a4.76 mm height of cut.
The purpose of this study was to determine how much fertilizer potassium would be lostduring routine mowing of a ‘Pennlinks’ creeping bentgrass putting green receiving potassiumfertilizer applied at two typical rates of application.
Materials and Methods
Two mower loss studies were conducted at the Valentine Turfgrass Research Facility atThe Pennsylvania State University, University Park. The study was conducted on a well-established ‘Pennlinks’ creeping bentgrass (Agrostis palustris Huds.) putting green having asand-based rootzone mixture. This site was uniform in appearance with good turf density and100% groundcover. Turf was maintained at a mowing height of 3.97 mm and mowed five days

per week (Monday through Friday). Fertilization, irrigation and pest management practices onthe green were performed as needed to maintain an acceptable putting surface prior to treatmentinitiation. Granular K fertilizer treatments (Table 1) were applied on 30 June 1999 and clippingswere collected from 2 days after treatment (DAT) through 9 DAT (9 July). Treatments wereapplied again on 14 July 1999 and clippings collected from 2 DAT through 9 DAT (23 July1999). All treatments were applied at 2.48 and 4.96 g K m-2. Fertilizers were hand applied witha small glass shaker jar with perforated lid following mowing.
Turf was irrigated with 6.4 mm of water immediately following treatment application.Mowing and clipping collection was skipped the day after treatment (DAT), but was collected 2DAT through 9 DAT. Following the first fertilizer treatment application, and due to droughtconditions, irrigations (6.4 mm) were applied on 1 July, 6 July, and 8 July. No additionalirrigation was applied after the second fertilizer application, but rain fell on 19 July (<2.5 mm),21 July (12.7 mm), and 22 July (7.62 mm). In effect, both studies received about 25.4 mm ofwater over about a nine-day period. A rain cover was not used during the study because previouswork by the authors had shown us that the fertilizers would stick to the dew that collected on theunderside of the cover.
Fertilizers used in this study are shown in Table 1. Clipping collection began on 2 DATand continued every day until no more granular fertilizer could be seen in the clipping collectionbasket. A walk-behind reel mower set to cut at 3.97 mm was used. Clippings from each plotwere bagged and oven-dried at 60 C for 48 hours. The weight of the granular fertilizer in theclippings was determined by oven-drying the clipping sample (24 hr at 60 C) and then blowingthe clippings out of the fertilizer with a small pneumatic seed cleaner (New Brunswick GeneralSheet Metal Works Seed Blower, model 1070-1, New Brunswick, NJ). The fertilizer granuleswere then weighed. We estimated % K loss by multiplying the weight of the fertilizer by itslabel K content.Both studies were arranged in a completely randomized block design with four replications pertreatment. Individual plots were 0.9 m x 2.4 m. Fertilizer treatment effects on daily and totalfertilizer and K loss were determined using SAS ANOVA and LSD (p=0.05) (SAS Institute,1994).
Results and Discussion
Study 1: The greatest amount of fertilizer loss occurred with the first mowing (2 DAT)(Table 2). Losses ranged from less than 0.5% to almost 18% of applied fertilizer dependingupon the treatment. Fertilizer recovered in clippings was greatest with the UHS Signaturetreatment at the high application rate. Loss from the Signature treated plots receiving the lowerapplication rate was equivalent, on a weight basis, to the Lebanon Isotek treatment at the higherrate of application. However, when loss was expressed as % applied fertilizer, much morematerial was lost from the Signature treated plots than the Isotek treated plots.
A decrease in application rate had the overall effect of decreasing the weight of materialrecovered by the mower for all treatments except the two Lesco products. The recovery of thesetwo fertilizers in mowing clippings was very low compared to the other treatments and rate didnot influence how much of this fertilizer, either on a weight or percentage basis, was recoveredwith the clippings. The % loss of Signature and Isotek went up as application rate went downwhile % loss of the Contec fertilizer remained the same. Mowing removal of the two Lescoproducts did not occur after this clipping collection.

During the second mowing (3 DAT), as with the first mowing (2 DAT), the greatest Kand fertilizer losses occurred with UHS Signature and represented between 3% and 4% of theapplied material. Unlike the first mowing, the higher rate of Signature resulted in a higherpercentage of loss at the second mowing. Isotek and Contec fertilizer losses were between 1.3%and 2.5% of applied fertilizer with more loss, on a weight basis, occurring with the Isotekfertilizer.
At the high rate of application, mowing loss continued through the sixth mowing (7DAT) for UHS Signature treated plots, the eighth mowing (9 DAT) for Isotek, and the fourthmowing (5 DAT) for Contec (Table 2). When applied at the lower application rate these lossesdid not occur after the third mowing (4 DAT) for Signature and Contec, and the fifth mowing (6DAT) for Isotek.
As with daily loss, total K and fertilizer loss was greatest for UHS Signature at the higherrate of application (Table 2). However, on a percentage basis, more K and fertilizer was lostfrom Signature at the lower application rate and represented 5.5% of applied K and 22% of theapplied fertilizer. Total mowing loss of the Isotek and Contec ranged from about 1 to 2 % ofapplied K, and 5 to 10 % of the applied fertilizer. . The two Lesco materials had losses of lessthan 1% of applied K or fertilizer. Application rate had an effect on the total amount (on a weightbasis) of Isotek and Contec fertilizer removed due to mowing, but essentially had no effect onthe % K and fertilizer lost from these products. Application rate had no effect on the totalamounts of Lesco treatments being lost.
Study 2: Results from Study 2 agreed with those of Study 1. The second studyconfirmed that a majority of the fertilizer lost due to mowing occurred at the first mowing andthat loss at 2 DAT was greatest with the higher application rate of all the treatments except thetwo Lesco products. As in Study 1, the loss of the Lesco products was very low and equalregardless of rate. Once again Signature resulted in the largest amount of loss for eachapplication rate. Loss decreased with each progressive mowing and, as in Study 1, no Lescoproduct was detected beyond the first mowing.
When comparing Study 1 and Study 2 for the number of mowings in which each fertilizerwas detected, Signature at the high rate, and Isotec and Contec at the low rate were detected inone extra mowing for Study 2. Signature at the low rate was detected in three additionalmowings, and Contec at the high rate was detected in two additional mowings for Study 2. Incontrast, Isotek at the high rate was found in two less mowings in Study 2.
Total loss data for Study 2 is in very close agreement with Study 1 with the greatestdifference being only 383 mg/m2 for Isotek at the high application rate. Both studies confirmedthat these losses represented from well below 1% to about 22% of the applied fertilizer.
Mowing loss of the fertilizers used in this study appears to be only slightly related to thesize of the materials tested (Table 1). The two Lesco products, which had the smallest size, alsohad the lowest loss (Tables 2 and 3). However, loss from the Contec and Isotek fertilizers wereconsiderably less than the Signature fertilizer, even though Signature was slightly finer thanContec and considerably finer than Isotek. Signature also had a higher bulk density than Contec,1.12 g/cc vs. 1.02 g/cc. Perhaps this should have aided in moving the Signature deeper into theturf canopy, but apparently did not have that effect.
The findings from these studies indicate that mowing loss of fertilizer can be a significantform of loss for certain fertilizers applied to putting greens if the clippings are removed from thegreen. Obviously, a finer grade of granular fertilizer will help the material work its way down

into the turf canopy. Increasing the water-solubility of the material would also be beneficial byallowing the turf manager to more easily irrigate the material into the canopy. Other importantcultural practices could include verticutting prior to fertilization to make the canopy less dense.Mowing without clipping removal would also allow more time for the material to move into thecanopy. However, not all greens-grade materials can retain their nutrient release characteristicsif damaged by mowing. The loss of granular fertilizers with clipping collection is an importantproblem that needs to be addressed if higher density bentgrass cultivars and lower heights of cutare used on putting greens.
References:Beard, J.B. 1973. Turfgrass Science and Culture. Prentice-Hall, Inc. EnglewoodCliffs, NJ.
Beard, J.B. 1982. Turf Management for Golf Courses. Macmillan Publishing, New York, NY.
Brady, N.C. 1990. The nature and properties of soils (10th ed.). Macmillan Publishing, NewYork, NY.
Mancino, C.F., and C.J. Hornstein. Fertilizer nitrogen loss due to putting green mowing. CropScience (submitted).
Turner, T.R., and N.W. Hummel, Jr. 1992. Nutritional requirements and fertilization. P. 385 –439. In D.V. Waddington, R.N. Carrow, and R.C. Shearman (eds.) Turfgrass – AgronomyMonograph no. 32. ASA, CSSA, and SSSA, Madison, WI.
USGA. 1993. USGA recommendations for putting green construction. USGA Green SectionRecord, Golf House, NJ.
Woolhouse, A.R. 1973. An assessment of the effectiveness of a slow release nitrogen fertilizeron sports turf. J. Sports Turf Res. Inst. 49:8-20.
Woolhouse, A.R. 1974. Further assessment of the effectiveness of a slow release nitrogenfertilizer on sports turf. J. Sports Turf Res. Inst. 50:34-46.
SAS Institute. 1994. The SAS system for Windows. Release 6.10. SAS Inst., Cary, NC.

Table 1. Greens grade K-containing granular fertilizers used in mowing loss study.
% SGN †
Fertilizer % K2O 100 140 200 280 Manufacturer
Lesco Matrix 1 28 75 25 0 0 Lesco, Inc., Rocky River, OH
Lesco Matrix 2 22 75 25 0 0 Lesco, Inc., Rocky River, OH
Scotts Contec 26 60 40 0 0 The Scotts Co., Marysville, OH
Lebanon Isotek 22 2 49 47 2 Lebanon Seaboard Corp., Lebanon, PA
UHS Signature 30 67 33 0 0 United Horticultural Supply, Denver, CO
† % SGN = Percent fertilizer held on size grade number screens with 1.0, 1.4, 2.0, and2.8 mm openings.

Table 2. Fertilizer and potassium losses due to mower pick up 2-9 days after fertilizer application (1 st run).
2 DAT 3 DAT 4 DAT 5 DAT 6 DAT Product Rate mg K/m2 mg fert/m2 mg K/m2 mg fert/m2 mg K/m2 mg fert/m2 mg K/m2 mg fert/m2 mg K/m2 mg fert/m2
(g/m2) (%) (%) (%) (%) (%) (%) (%) (%) (%) (%) UHS Signature 4.86 489.1 a 1964.3 a 196.9 a 790.8 a 82.6 a 331.6 a 12.7 b 51.0 b 12.7 b 51.0 b15-0-30 2.5 10.05 1.01 4.04 0.42 1.70 0.06 0.26 0.06 0.26
UHS Signature 2.43 438.3 a 1760.2 ab 101.6 b 408.2 b 50.8 b 204.1 b 0.0 e 0.0 c 0.0 d 0.0 c15-0-30 4.48 17.98 0.78 3.13 0.52 2.08 0 0 0 0
Lebanon Isotek 4.86 265.5 b 1454.1 b 74.5 c 408.2 b 37.3 b 204.1 b 18.6 a 102.0 a 18.6 a 102.0 a11-3-22 0.99 5.42 0.28 1.52 0.14 0.76 0.07 0.38 0.07 0.38
Lebanon Isotek 2.43 144.4 cd 790.8 c 60.6 c 331.6 bc 13.8 c 102.0 c 9.3 d 51.0 b 9.3 c 51.0 b11-3-22 1.08 5.9 0.46 2.47 0.14 0.76 0.07 0.38 0.07 0.38
Scotts Contec 4.86 165.2 c 765.3 c 66.1 c 306.1 c 21.9 c 102.0 c 11.0 c 51.0 b 0.0 d 0.0 c13-2-26 0.73 3.38 0.29 1.35 0.10 0.45 0.05 0.22 0 0
Scotts Contec 2.43 82.6 d 382.7 d 33.0 d 153.1 d 10.8 cd 51.0 cd 0.0 e 0.0 c 0.0 d 0.0 c13-2-26 0.73 3.38 0.29 1.35 0.10 0.45 0 0 0 0
Lesco 4.86 9.3 e 51.0 e 0.0 e 0.0 e 0.0 d 0.0 d 0.0 e 0.0 c 0.0 d 0.0 c12-0-22 0.03 0.19 0 0 0 0 0 0 0 0
Lesco 2.43 9.3 e 51.0 e 0.0 e 0.0 e 0.0 d 0.0 d 0.0 e 0.0 c 0.0 d 0.0 c12-0-22 0.07 0.38 0 0 0 0 0 0 0 0
Lesco 4.86 11.9 e 51.0 e 0.0 e 0.0 e 0.0 d 0.0 d 0.0 e 0.0 c 0.0 d 0.0 c5-0-28 0.06 0.24 0 0 0 0 0 0 0 0
Lesco 2.43 11.9 e 51.0 e 0.0 e 0.0 e 0.0 d 1.0 0.0 e 1.0 0.0 d 1.05-0-28 0.11 0.49 0 0 0 0 0 0 0 0

Table 2. Continued.
7 DAT 8 DAT 9 DAT Total Product Rate mg K/m2 mg fert/m2 mg K/m2 mg fert/m2 mg K/m2 mg fert/m2 mg K/m2 mg fert/m2
(g/m2) (%) (%) (%) (%) (%) (%) (%) (%) UHS Signature 4.86 12.7 b 51.0 b 0.0 b 0.0 b 0.0 b 0.0 b 806.7 a 3239.8 a15-0-30 0.06 0.26 0 0 0 0 4.11 16.57
UHS Signature 2.43 0.0 c 0.0 c 0.0 b 0.0 b 0.0 b 0.0 b 565.3 b 2270.4 b15-0-30 0 0 0 0 0 0 5.52 22.14
Lebanon Isotek 4.86 16.3 a 89.3 a 7.0 a 38.3 a 4.7 a 25.5 a 442.5 c 2423.5 b11-3-22 0.06 0.33 0.02 0.14 0.1 0.1 1.65 9.03
Lebanon Isotek 2.43 0.0 c 0.0 c 0.0 b 0.0 b 0.0 b 0.0 b 237.6 d 1301.0 c11-3-22 0 0 0 0 0 0 1.78 9.7
Scotts Contec 4.86 0.0 c 0.0 c 0.0 b 0.0 b 0.0 b 0.0 b 264.3 d 1224.5 c13-2-26 0 0 0 0 0 0 1.17 5.4
Scotts Contec 2.43 0.0 c 0.0 c 0.0 b 0.0 b 0.0 b 0.0 b 121.1 e 561.2 d13-2-26 0 0 0 0 0 0 1.07 4.95
Lesco 4.86 0.0 c 0.0 c 0.0 b 0.0 b 0.0 b 0.0 b 9.3 e 51.0 e12-0-22 0 0 0 0 0 0 0.03 0.19
Lesco 2.43 0.0 c 0.0 c 0.0 b 0.0 b 0.0 b 0.0 b 9.3 e 51.0 e12-0-22 0 0 0 0 0 0 0.07 0.38
Lesco 4.86 0.0 c 0.0 c 0.0 b 0.0 b 0.0 b 0.0 b 11.9 e 51.0 e5-0-28 0 0 0 0 0 0 0.06 0.24
Lesco 2.43 0.0 c 0.0 c 0.0 b 0.0 b 0.0 b 0.0 b 11.9 e 51.0 e5-0-28 0 0 0 0 0 0 0.11 0.49
Means within a column followed by the same letter are not significantly different, LSD, p = 0.05.

Table 3. Potassium and fertilizer losses due to mower pick up 2-9 days after fertilizer application (2nd run).
2 DAT 3 DAT 4 DAT 5 DAT 6 DAT Product Rate mg K/m2 mg fert/m2 mg K/m2 mg fert/m2 mg K/m2 mg fert/m2 mg K/m2 mg fert/m2 mg K/m2 mg fert/m2
(g/m2) (%) (%) (%) (%) (%)
UHS Signature 4.86 527.2 a 2117.3 a 82.6 a 331.6 a 44.5 a 178.6 a 38.1 a 153.1 a 25.4 102.0 a15-0-30 10.83 1.7 0.91 0.78 0.52
UHS Signature 2.43 419.2 b 1683.7 b 50.8 b 204.1 b 38.1 a 153.1 ab 25.4 b 102.0 b 12.7 51.0 b15-0-30 17.2 2.09 1.57 1.04 0.52
Lebanon Isotek 4.86 335.4 c 1836.7 ab 37.3 c 204.1 b 18.6 b 102.0 bc 18.6 c 102.0 b 9.3 51.0 b11-3-22 6.85 0.76 0.38 0.38 0.19
Lebanon Isotek 2.43 181.7 e 994.9 c 37.3 c 204.1 b 14.0 b 76.5 c 9.3 d 51.0 c 9.3 51.0 b11-3-22 7.42 1.2 0.57 0.38 0.38
Scotts Contec 4.86 258.7 d 1199.0 c 22.0 d 102.0 c 22.0 b 102.0 bc 22.0 bc 102.0 b 11.0 51.0 b13-2-26 5.28 0.45 0.45 0.45 0.22
Scotts Contec 2.43 137.6 e 637.8 d 22.0 d 102.0 c 11.0 bc 51.0 cd 11.0 d 51.0 c 0 0.0 c13-2-26 5.62 0.9 0.45 0.45 0
Lesco 4.86 2.3 e 12.8e 0.0 e 0.0 d 0.0 c 0.0 d 0.0 e 0.0 d 0 0.0 c12-0-22 0.05 0 0 0 0
Lesco 2.43 4.7 e 25.5 e 0.0 e 0.0 d 0.0 c 0.0 d 0.0 e 0.0 d 0 0.0 c12-0-22 0.19 0 0 0 0
Lesco 4.86 3.0 e 12.8 e 0.0 e 0.0 d 0.0 c 0.0 d 0.0 e 0.0 d 0 0.0 c5-0-28 0.06 0 0 0 0
Lesco 2.43 11.9 e 51.0 e 0.0 e 0.0 d 0.0 c 0.0 d 0.0 e 0.0 d 0 0.0 c5-0-28 0.49 0 0 0 0
continued on next page

Table 3. Continued.
7 DAT 8 DAT 9 DAT Total Product Rate mg K/m2 mg fert/m2 mg K/m2 mg fert/m2 mg K/m2 mg fert/m2 mg K/m2 mg fert/m2
(g/m2) (%) (%) (%) (%) (%) (%) (%) (%)
UHS Signature 4.86 12.7 51.0 a 12.7 a 51.0 a 0.0 a 0.0 a 743.2 a 2984.7 a15-0-30 0.26 0.26 0 15.26
UHS Signature 2.43 12.7 51.0 a 0.0 b 0.0 b 0.0 a 0.0 a 559.0 b 2244.9 b15-0-30 0.52 0 0 22.93
Lebanon Isotek 4.86 9.3 51.0 a 0.0 b 0.0 b 0.0 a 0.0 a 428.6 c 2346.9 b11-3-22 0.19 0 0 8.75
Lebanon Isotek 2.43 9.3 51.0 a 0.0 b 0.0 b 0.0 a 0.0 a 260.9 e 1428.6 c11-3-22 0.38 0 0 10.65
Scotts Contec 4.86 11.0 51.0 a 0.0 b 0.0 b 0.0 a 0.0 a 346.8 d 1607.1 c13-2-26 0.22 0 0 7.07
Scotts Contec 2.43 0 0.0 b 0.0 b 0.0 b 0.0 a 0.0 a 181.7 f 841.8 d13-2-26 0 0 0 7.42
Lesco 4.86 0 0.0 b 0.0 b 0.0 b 0.0 a 0.0 a 2.3 g 12.8 e12-0-22 0 0 0 0.05
Lesco 2.43 0 0.0 b 0.0 b 0.0 b 0.0 a 0.0 a 4.7 g 25.5 e12-0-22 0 0 0 0.19
Lesco 4.86 0 0.0 b 0.0 b 0.0 b 0.0 a 0.0 a 3.0 g 12.8 e5-0-28 0 0 0 0.06
Lesco 2.43 0 0.0 b 0.0 b 0.0 b 0.0 a 0.0 a 11.9 g 51.0 e5-0-28 0 0 0 0.49
Means within a column followed by the same letter are not significantly different, LSD, p = 0.05.

Evaluation of Fungicides for Control of Gray Leaf Spot on a PerennialRyegrass Fairway, 1999
Wakar Uddin, Assistant ProfessorMichael D. Soika, Research Support Technologist
Department of Plant Pathology
Introduction
Gray leaf spot (Pyricularia grisea) has become an important disease on perennialryegrass (Lolium perenne) golf course fairways in the Mid-Atlantic region and the Mid-West.This study was conducted at the Willow Hollow Golf Course, Leesport (Berks County), PA, on athree-way blend of perennial ryegrass. The objective was to evaluate various fungicides andfungicide mixtures for effectiveness of suppression of gray leaf spot.
Materials and Methods
The study was conducted on the 18th fairway of the Willow Hollow Golf Course. Thesoil pH was 5.5. The test plots were mowed three times per week at 0.75 inch cutting height.The experimental area was treated with Dimension 1EC at 1.1 fl oz per 1000 sq ft on 20 Apr forcontrol of crabgrass. On 28 Apr Primo 1EC was applied at the rate of 0.75 fl oz per 1000 sq ft.On 28 May the experimental area was fertilized (21-3-14) with 1.2 lbs nitrogen per 1000 sq ft.Merit 75WP was applied on 2 Jun at 6.4 oz per acre for insect control. On 23 Jul and 13 Augrespectively, ProStar 70WP (2.1 oz per 1000 sq ft) and Subdue Maxx 2MC (1.0 fl oz per 1000 sqft) were applied for control of brown patch and Pythium foliar blight. Treatment plots, 3 ft x 12ft, were arranged in a randomized complete block design with four replications. Fungicides wereapplied with a CO2-powered boom sprayer using TeeJet 8004 nozzles at 40 psi, in waterequivalent to 2 gal per 1000 sq ft. Treatment applications were begun on 6 July, and continuedon a 14-day interval through September, unless otherwise noted in table. On 23 August theexperimental area was inoculated with a spore suspension of P. grisea, and covered with apolyethylene sheet to maintain leaf wetness and reduce radiational-cooling over night. The testarea was then allowed to grow to a two-inch height, and maintained at that height throughSeptember. Disease severity was evaluated on 14 and 29 September. Data were subjected toanalysis of variance, and mean values were separated using the Waller-Duncan k-ratio test(P=0.05).

Results and Discussion
Environmental conditions were conducive for disease development during earlySeptember, and disease incidence was high. In this study, Chipco Triton, the Polyoxorim Znhigh rate applied on a 28-day interval, as well as the 4 oz rate of Polyoxorim Zn did not provideany significant level of control. In the 14 September evaluation, Compass at the 0.2 and 0.25 ozrates, three triazole fungicides (Lynx, Bayleton, and Banner Maxx) tank-mixed with DaconilUltrex, the Heritage + Daconil Ultrex combination, and Daconil Ultrex were providing excellentcontrol of Gray Leaf Spot. By 29 September, the same treatments were providing good control,as were as the Heritage treatments. Daconil Ultrex, alone or in combination with otherfungicides, provided excellent control throughout the study, including the Lynx + Daconil Ultrexcombination in which the Daconil Ultrex rate was 1.82 oz.

Table. Evaluation of Fungicides for Control of Gray Leaf Spot on a Perennial Ryegrass Fairway
Disease Incidence1
Treatment, formulation, and product rate per 1000 sq ft 14 Sep 29 Sep
Chipco Triton 1.67SC 0.50 fl oz 7.5 ab2 7.3 a2
Confidential3 8.3 a 7.3 aPolyoxorim Zn 2.25WP 8.0 oz4, 5 6.5 bc 6.8 abChipco Triton 1.67SC 1.00 fl oz 6.8 abc 6.3 abcConfidential3 7.5 ab 5.8 a-dUntreated check 7.3 abc 5.3 b-eConfidential3 2.0 fgh 4.8 c-fPolyoxorim Zn 2.25WP 4.0 oz4 5.8 c 4.8 c-fPolyoxorim Zn 2.25WP 4.0 oz + Latron CS-7 L 0.25 % V/V4 4.0 d 4.5 defConfidential3 3.0 def 4.0 efgCompass 50WG 0.15 oz 2.3 efg 3.8 efgPolyoxorim Zn 2.25WP 8.0 oz4 4.0 d 3.5 fghLynx 45WP 1.11 oz5 3.5 def 3.5 fghCompass 50WG 0.20 oz 1.0 ghi 2.5 ghiHeritage 50WG 0.40 oz5 4.0 d 2.5 ghiHeritage 50WG 0.40 oz 4.0 d 2.5 ghiCompass 50WG 0.25 oz 1.0 ghi 2.0 hiHeritage 50WG 0.20 oz 3.8 de 1.8 iBanner Maxx 1.24MC 1.00 fl oz + Daconil Ultrex 82.5WG 3.67 oz 0.5 hi 1.0 iLynx 45WP 0.56 oz + Daconil Ultrex 82.5WG 3.67 oz 0.0 i 1.0 iBayleton 50WP 0.50 oz + Daconil Ultrex 82.5WG 3.67 oz 0.0 i 1.0 iBayleton 50WP 1.00 oz + Daconil Ultrex 82.5WG 3.67 oz 0.0 i 1.0 iHeritage 50WG 0.20 oz + Daconil Ultrex 82.5WG 3.67 oz 0.0 i 1.0 iLynx 45WP 0.56 oz + Daconil Ultrex 82.5WG 1.82 oz 0.0 i 1.0 iDaconil Ultrex 82.5WG 3.67 oz 0.0 i 0.0 i 10-10 visual rating scale, where 0=no disease, 1=10% plot necrotic, and 10=100% plot necrotic,mean of four replications.2Means within column followed by the same letter do not significantly differ according to theWaller-Duncan k-ratio test (P=0.05).3Treatment information not available.4Treatment not applied after 31 Aug.5Treatment applied on a 28-day interval (6 Jul, 3 and 31 Aug).

Evaluation of Fungicides for Control of Pythium Foliar Blight, 1999
Wakar Uddin, Assistant ProfessorMichael D. Soika, Research Support Technologist
Department of Plant Pathology
Introduction
Fungicides were evaluated to determine effectiveness of control of Pythium foliar blight.The study was conducted at the Landscape Management Research Center, University Park, PA,on perennial ryegrass (Lolium perenne, ‘Pennfine’), maintained under golf course fairwaymanagement conditions.
Materials and Methods
The test area was mowed three times per week at 0.75 inches throughout the growingseason. The soil was Hagerstown silt loam with soil pH of 6.9. Turfgrass was fertilized on 18May with 1.0 lb nitrogen (Scotts 31-3-10) per 1000 sq ft, 10 Jun with 1.0 lb nitrogen (Nutralene40-0-0) per 1000 sq ft, and on 21 Jun with 0.5 lb nitrogen (urea 46-0-0) per 1000 sq ft. LescoBenomyl 50WP was applied at the rate of 2.0 oz per 1000 sq ft on 22 Jun and 3 Jul for control ofbrown patch. Trimec Classic 3.32EC (1.5 fl oz per 1000 sq ft) was applied on 22 Jun for controlof broadleaf weeds. Treatment plots, 3 ft x 7 ft, were arranged in a randomized complete blockdesign with three replications. Preventive treatments were applied on 5 Jul with a CO2-poweredboom sprayer using TeeJet 8004 nozzles at 40 psi, in water equivalent to 2 gal per 1000 sq ft.On 7 Jul, two days after treatment (DAT), the experimental turf area was enclosed in a 30 ft x 48ft polyethylene greenhouse to minimize radiational cooling. The test area was then inoculatedwith a mycelial suspension of a 6-isolate pool of Pythium aphanidermatum. Curative treatmentswere applied on 9 Jul, two days after inoculation. During the experiment, the greenhouse wasvented during daylight hours to maintain a temperature range of 85° to 95°F, and closed at nightAn internal intermittent misting system provided continuous high relative humidity and leafsurface wetness. On 16 Jul the blighted turf was assessed. Data were subjected to analysis ofvariance, and the mean values were separated by Duncan’s New Multiple Range Test (P=0.05).
Results and Discussion
Throughout the experiment, conditions were conducive for infection and diseasedevelopment, therefore resulting in high disease severity. The curative application of Banol,Quell, and the two experimental treatments AEB066752 provided better than 68% control underthe heavy disease pressure in this experiment. The curative treatment of AEB066752 providedgreater than 83% control.

Table. Evaluation of Fungicides for Control of Pythium Foliar Blight, 1999
Disease Severity1
Treatment, formulation, and product rate per 1000 sq ft 16 Jul
Untreated Check 10.00 a2
Banol 6SL 1.0 fl oz 7.17 abSubdue Maxx 2MC 1.0 fl oz 5.17 bcBanol 6SL 2.0 fl oz 5.08 bcQuell L 1.0 fl oz + Koban 30WP 5.8 oz 4.83 bcHeritage 50WG 0.4 oz 4.50 bcBanol 6SL 2.0 fl oz3 3.17 cQuell L 1.0 fl oz 2.67 cAEB066752 F 4.0 fl oz 2.17 cAEB066752 F 4.0 fl oz3 1.67 c 10-10 visual rating scale, where 0=no disease, 1=10% plot blighted, and 10=100% blighted,mean of three replications.2Means within column followed by the same letter do not significantly differ according toDuncan’s New MRT (P=0.05).3Treatment applied as a curative application 9 Jul.

Control of Pythium Foliar Blight on Perennial Ryegrass, 1999
Wakar Uddin, Assistant ProfessorMichael D. Soika, Research Support Technologist
Department of Plant Pathology
Introduction
The use of fungicides is an important means of contolling Pythium foliar blight. Thestudy was conducted at the Valentine Turfgrass Research Center, University Park, PA, onperennial ryegrass (Lolium perenne, ‘Pennfine’), maintained under golf course fairwaymanagement conditions. It consisted of two separate experiments, conducted in conjunction witheach other, to evaluate fungicide effectiveness and length of control under severe infectionpressure.
Materials and Methods
The two experiments in this study were conducted on perennial ryegrass maintainedunder golf course fairway management conditions, and mowed three times per week at 0.5 inchcutting height. The soil was Hagerstown silt loam with a soil pH of 7.0. The experimental areawas fertilized on 17 May with 1.0 lb nitrogen (Scotts 31-3-10) per 1000 sq ft, 10 June with 1.0 lbnitrogen (Nutralene 40-0-0) per 1000 sq ft, and on 21 June with 0.5 lb nitrogen (urea 46-0-0) per1000 sq ft. Lesco Benomyl 50WP (2.0 oz/1000 sq ft) was applied on 22 June and 2 July forcontrol of brown patch. Trimec Classic 3.32EC (1.5 fl oz per 1000 sq ft) was applied on 15 Junefor control of broadleaf weeds. Treatment plots, 3 ft x 7 ft, were arranged in a randomizedcomplete block design with three replications. In both experiments, fungicides were applied on 3Jul with a CO2-powered boom sprayer using TeeJet 8004 nozzles at 40 psi, in water equivalent to2 gal per 1000 sq ft. On 4 July turf in Experiment 1 was enclosed in a 30 ft x 48 ft polyethylenegreenhouse to reduce radiational cooling. An internal intermittent misting system providedcontinuous high relative humidity throughout the experiment. The greenhouse was ventedduring daylight hours to maintain a temperature range of 85° to 95°F. Vents were closed duringthe night. On 8 July, 5 days after treatment (DAT), disease severity was assessed in Experiment1. On 10 July (7 DAT), the turf area of Experiment 2 was enclosed in a 30 ft x 48 ftpolyethylene greenhouse, inoculated with a 6-isolate pool of Pythium aphanidermatum, and wasmaintained as described above for Experiment 1. On 16 July (13 DAT) disease severity inExperiment 2 was assessed. Data were subjected to analysis of variance, and the mean valueswere separated using the Waller-Duncan k-ratio Test (P=0.05).

Results and Discussion
In the first experiment (5 DAT), the two Compass plus Subdue Maxx combinationtreatments, and the Subdue Maxx treatment were providing excellent control of Pythium foliarblight. In the second experiment (13 DAT), none of the fungicides provided satisfactory control;however, the high rate Banol treatment was significantly different from the untreated check. Itshould be noted that conditions in the greenhouses, such as continuous leaf surface wetness, highrelative humidity, and warm temperature, were highly conducive for infection by P.aphanidermatum, and subsequent disease development. The disease severity was extremely highthroughout both of the experiments.
Table. Control of Pythium Foliar Blight on Perennial Ryegrass, 1999
Disease Severity1
Experiment 12 Experiment 23
Treatment, formulation, and rate of product/1000 sq ft 8 Jul 16 Jul
Untreated Check 9.77 a4 10.00 a4
Compass 0.7 MC 0.85 fl oz + Subdue Maxx 2 MC 0.5 fl oz 0.50 cd 9.93 aCompass 50 WG 0.15 oz + Subdue Maxx 2 MC 0.5 fl oz 0.33 d 9.93 aSubdue Maxx 2 MC 1.0 fl oz 0.33 d 9.50 abHeritage 50 WG 0.4 oz 4.43 b 9.33 abBanol 6 SL 1.3 fl oz 3.67 bc 8.00 abAliette Signature 80 WG 4.0 oz 3.17 bcd 8.00 abBanol 6 SL 2.0 fl oz 2.83 bcd 7.50 b 10-10 visual rating scale where 0=no disease, 1=10% plot necrotic, and 10=100% plot necrotic,mean of three replications.2Treatments were applied 3 Jul. Disease severity was evaluated 8 Jul, five days after treatmentapplication.3Treatments were applied 3 Jul. Disease severity was evaluated 16 Jul, 13 days after treatmentapplication.4Within a column, means followed by the same letter do not significantly differ according toWaller-Duncan k-ratio test (P=0.05).

Evaluation of Fungicides for Control of Dollar Spot on a Putting Green, 1999
Wakar Uddin, Assistant ProfessorMichael D. Soika, Research Support Technologist
Department of Plant Pathology
Introduction
The use of fungicides for managing dollar spot (Sclerotinia homoeocarpa) on golfcourses is a commonly used practice to maintain high quality playing surfaces. This study wasconducted at the Valentine Turfgrass Research Center, University Park, PA, on a creepingbentgrass (Agrostis Palustris, ‘Penncross’) green. The study included various fungicides, rates,and/or application intervals to investigate control strategies and fungicide efficacy.
Materials and Methods
The experiment was conducted on creeping bentgrass maintained under golf course greensmanagement conditions, mowed at 0.16 inch cutting height. The soil was a modified sandy clayloam with a soil pH of 7.0. The test area was fertilized on 19 May with 1.0 lb nitrogen (Lebanon28-7-14) per 1000 sq ft. Treatment plots, 3 ft x 11 ft, were arranged in a randomized completeblock design with three replications. Treatments were applied with a CO2-powered boom sprayer,using TeeJet 8004 nozzles, at 40 psi, in water equivalent to 2 gal per 1000 sq ft. Applications weremade on 9 and 23 June, and 7 and 21 July, except as noted in the table. The experimental turf areawas inoculated on 18 June, nine days after the first treatment application, by hand-broadcasting S.homoeocarpa-infested ryegrains, at the rate of 20-30 grains per sq ft. A mixture of five isolates ofS. homoeocarpa was used in the inoculation. Disease incidence was evaluated on 7, 14, 21, and 28July, and 5 August. Data were subjected to analysis of variance, and the mean values wereseparated by Waller-Duncan k-ratio test (P=0.05).
Results and Discussion
Dollar spot disease incidence was moderate and consistent during the experiment. Fore80WP applied on a 14-day interval did not provide effective dollar spot control in thisexperiment. By the 5 August evaluation, most of the treatments in this study were providingexcellent control of dollar spot. The 0.556 oz rate of Lynx, the 0.6 oz rate of Eagle, and the half-rate (1.8 oz) of Daconil Ultrex (applied every seven days) provided complete control of dollarspot throughout the study.

Table. Evaluation of Fungicides for Control of Dollar Spot on a Putting Green, 1999
Dollar Spot Incidence1
Treatment, formulation, and rate per 1000 sq ft 7 Jul 14 Jul 21 Jul 28 Jul 5 Aug
Untreated Check 4.7 a2 2.0 a2 2.3 b2 3.2 ab2 3.7 a2
Fore 80WP 8.0 oz 3.9 a 1.3 b 3.2 a 3.8 a 3.6 aBanner Maxx 1.24ME 0.5 fl oz 0.3 cd 0.0 c 0.1 d 2.3 abc 0.7 bDaconil Ultrex 82.5WG 3.83 oz 0.0 d 0.0 c 0.4 d 0.2 d 0.6 bcCleary 3336 4.5F 1.0 fl oz 0.1 d 0.0 c 0.0 d 0.2 d 0.3 b-eGX-611 6F 4.2 fl oz 0.0 d 0.0 c 0.1 d 0.0 d 0.2 cdeBayleton 25DF 0.5 oz 0.4 cd 0.1 c 0.0 d 1.2 bcd 0.1 deEagle 40WP 1.04 oz 0.6 cd 0.0 c 0.0 d 0.0 d 0.0 eChipco 26GT 2SC 3 fl oz 0.2 cd 0.0 c 0.3 d 0.0 d 0.0 eDaconil Ultrex 82.5WG 3.8 oz 0.1 d 0.0 c 0.1 d 0.0 d 0.0 eEagle 40WP 0.5 oz 0.0 d 0.1 c 0.0 d 0.0 d 0.0 eLynx 45WP 0.278 oz 0.1 d 0.0 c 0.0 d 0.0 d 0.0 eLynx 45WP 0.556 oz 0.0 d 0.0 c 0.0 d 0.0 d 0.0 eEagle 40WP 0.6 oz 0.0 d 0.0 c 0.0 d 0.0 d 0.0 eDaconil Ultrex 82.5WG 1.85 oz 0.0 d 0.0 c 0.0 d 0.0 d 0.0 e 1Values represent number of infection centers per square foot, mean of three sub-samples foreach of three replications.2Means within a column followed by the same letter do not significantly differ according to theWaller-Duncan k-ratio test (P=0.05).3Treatment applied on a 21-day interval (9 and 30 Jun, and 21 Jul).4Treatment applied on a 28-day interval (9 Jun and 7 Jul).5Treatment applied on a 7-day interval (9, 16, 23, 30 Jun, and 7, 14, and 21 Jul).

Control of Brown Patch with Fungicides, 1999
Wakar Uddin, Assistant ProfessorMichael D. Soika, Research Support Technologist
Department of Plant Pathology
Introduction
Brown Patch (Rhizoctonia solani) can be a serious disease on golf courses during warmand humid periods of summer. This study was conducted at the Valentine Turfgrass ResearchCenter, University Park, PA on colonial bentgrass maintained under golf course fairwaymanagement conditions. The objective of the study was to evaluate various fungicides,fungicide rates and/or application intervals, and tank-mixtures for effectiveness in controllingbrown patch.
Materials and Methods
The experiment was conducted on colonial bentgrass (Agrostis tenuis, ‘Bardot’) mowedthree times per week at 0.5 inch cutting height. The soil was Hagerstown silt loam with a soilpH of 6.4. The test area was fertilized on 19 May with with 1.0 lb nitrogen (Lebanon 28-7-14)per 1000 sq ft, and on 11 June with 1.0 lb nitrogen (Nutralene 40-0-0) per 1000 sq ft. Treatmentplots, 3 ft x 8 ft, were arranged in a randomized complete block design with three replications.Treatments were applied with a CO2-powered boom sprayer, using TeeJet 8004 nozzles, at 40psi, in water equivalent to 2 gal per 1000 sq ft. Applications were made on 28 June, 12, and 26July, unless otherwise noted in the table. Hot and dry weather conditions prevailed throughoutthe test period, and disease severity was moderate. Brown patch incidence was variablethroughout the experimental area. Disease severity was greatest in early July, with 46% of theuntreated check plots blighted. By the end of July less than 15% of the untreated checks plotswere blighted. Treatment plots were evaluated on 9, 19, and 26 July. Data were subjected toanalysis of variance, and the mean values were separated by the Waller-Duncan K-ratio Test(P=0.05).
Results and Discussion
In the 9 July evaluation, when disease severity was greatest, 15 of the 18 treatments wereproviding control significantly different from the untreated check. On 19 July, only DaconilWeatherstik and the Heritage treatments were significantly better than the untreated check plots,despite the lower disease pressure. In the 26 July evaluation all treatments, except two of thethree Eagle treatments, were providing control significantly different from the check, although,only 13% of the check plots were infected at that time. Two Heritage treatments providedcomplete control of brown patch throughout the experiment.

Table. Control of Brown Patch with Fungicides, 1999
Disease Severity1
Treatment, formulation, and product rate per 1000 sq ft 9 Jul 19 Jul 26 Jul
Eagle 40WP 1.0 oz2 0.87bc3 0.83abc3 1.67a3
Untreated Check 4.60a 1.83ab 1.33abEagle 40WP 0.6 oz 2.17bc 0.67abc 1.00bDaconil Weatherstik 6F 4.0 fl oz 1.40bc 0.00c 0.25cEagle 40WP 0.5 oz 1.33bc 0.20bc 0.23cBanner Maxx 1.24MC 2.0 fl oz4 2.00bc 1.50abc 0.20cBayleton 50WP 0.5 oz4 4.50a 2.17a 0.20cDaconil Ultrex 82.5WG 3.8 oz 1.83bc 0.33bc 0.17cGX-611 6F 4.2 fl oz 2.00bc 0.20bc 0.17cCompass 50 WG 0.15 oz + Banner Maxx 1.24MC 1.0 fl oz4 1.07bc 0.67abc 0.17cChipco 26GT 2SC 3.0 fl oz4 1.33bc 1.17abc 0.03cCleary’s 3336 F 4.5F 2.0 fl oz 1.60bc 0.20bc 0.03cProStar 70WP 1.5 oz4 2.43ab 1.17abc 0.00cCompass 0.15 oz + Banner Maxx 1.0 fl oz + Primo Maxx 0.2 fl oz4 1.00bc 0.53abc 0.00cHeritage 50WG 0.4 oz2 0.07c 0.17c 0.00cHeritage 50WG 0.2 oz4 0.10c 0.00c 0.00cHeritage 50WG 0.2 oz 0.00c 0.00c 0.00cHeritage 50WG 0.4 oz5 0.00c 0.00c 0.00c 10-10 visual rating scale, where 0=no disease, 1=10% plot blighted, and 10=100% plot blighted,mean of three replications.2Treatment applied on 28-day interval (28 Jun only).3Within column, means followed by the same letter do not significantly differ according toWaller-Duncan k-ratio test (P=0.05).4Treatment applied on a 21-day interval (28 Jun and 19 Jul).5Treatment applied on a 35-day interval (28 Jun).

Applications of MacroSorb Foliar to Improve the Quality of a Putting Green
Dr. T. L. Watschke and J. A. BorgerDepartment of Agronomy
Introduction
This study was conducted on the eighteenth putting green at the Penn State White GolfCourse in State College PA. The objective of the study was to evaluate the effect of MacroSorbFoliar applications on the quality of a mixed Poa annua/creeping bentgrass putting green locatedin an area of relatively dense tree canopy shade. This green had a history of reduced quality as thestress of summer growing conditions occurred.
Methods and Materials
This study was a randomized complete block design with three replications. All of thetreatments were applied on May 4, 1999 using a three foot CO2 powered boom sprayer calibratedto deliver 40 gpa using two, flat fan, 6504 nozzles at 40 psi. Treatments were applied every tendays (10 DAT) or every fourteen days (14 DAT). There were a total of six applications for the 10DAT cycle and four in the 14 DAT cycle.
Results and Discussion
Turf quality was rated five times during the duration of the experiment (Table ). At notime was turf quality found to be different whether treated with MacroSorb Foliar or not. The1999 season was unusual in the sense of being very dry with many days with abundant sunlight.Such conditions (particularly sunlight) are uncharacteristic for central Pennsylvania, which usuallyhas a significant number of cloudy days, which intensifies turf quality problems in shadedlocations.
Table Quality ratings taken in 1999 of a shaded Poa annua/creeping bentgrass putting green. Arating scale of 0 – 10 was used where 0 = poorest, 7 = acceptable, and 10 = best.
Treatment Form Rate Timing (---------------Quality-------------) (oz/M) 5-4 6-1 7-7 8-3 9-1MACROSORB FOLIAR L 2 14 DAT 8.0 9.0 9.0 9.0 9.0CHECK 8.0 9.0 9.0 9.0 9.0MACROSORB FOLIAR L 2 10 DAT 8.0 9.0 9.0 9.0 9.0

Evaluation of Slow Release N Fertilizers on Creeping Bentgrass Fairways
C.F. Mancino, Associate Professor – Turf/Soil ScienceD.M. Petrunak, Research Technician
Department of Agronomy
Introduction
The objective of this study was to evaluate the performance of several experimental polymer-coated slow release fertilizers in comparison to industry standards. Slow release fertilizers havethe advantage of a longer-lived color response with little danger of burn damage that can occurwith quick release fertilizers. However, some slow release materials may require six weeks ormore before the desired turf response occurs. The desire is to produce a PCU having a quicker Nrelease property, but still provide good slow-release characteristics.
Materials and Methods
Treatments were applied on 27 May 99 at a rate of 1lb N/1000 ft2. Nitrogen treatments areshown in Table 1. The study site received approximately 0.5” of water after application oftreatments. The study was conducted on an established stand of ‘Penneagle’ creeping bentgrassmaintained at 0.5” height of cut. The area was mowed three times per week with clippingsremoved from the site to prevent cross contamination of treatments. The study was arandomized complete block design with four replications, with individual plots measuring 3’ x8’.
The turf was evaluated weekly for color beginning at 1 week after treatment (WAT) andcontinuing until 14 WAT. Color was evaluated on a 1-9 scale with 1 being brown, 9 beingexcellent, and 6 indicating acceptable color. Color data were subjected to analysis of varianceand Fisher’s Least Significant Difference for mean separation.
Results and Discussion
At 1 WAT, urea and PolyS produced significantly better color than all other fertilizers. Alltreatments except Polyon, Exp 43-0-0A, and the unfertilized control produced turf of acceptablecolor.
At 2 WAT, urea, PolyS, Exp 41-0-0A, and Trikote produced turf of very good color. Ureatreated plots continued to have the best color, although it was not significantly better than PolyS,Exp 41-0-0A, and Trikote. All treatments had significantly better color than the control. Alltreatments except IBDU, Polyon, and the control produced turf of acceptable color.
Three weeks after treatment, urea again produced the highest color rating, but was notsignificantly different from PolyS, Trikote, and Exp 41-0-0C. Only IBDU and the unfertilizedcontrol had color ratings below an acceptable level. In general, color ratings improved only

slightly between 2 and 3 WAT. Color ratings for Polyon increased above an acceptable level at3 WAT and continued to improve steadily until 9 WAT. Polyon usually requires about two tothree weeks to improve turf color. Its effect usually lasts an additional six weeks.
Only the unfertilized turf had unacceptable color at 4 WAT. However, the color rating forNitroform (6.00) was not significantly different from the control (5.50). Nitroform is highlydependent upon soil moisture, temperature, and microbial activity for N release. Color ratings forIBDU, a water dependent fertilizer, began to improve to acceptable levels at 4 WAT andcontinued to increase for several weeks.
At 5 WAT, Exp 41-0-0C and Exp 41-0-0B produced excellent color, having color ratings of8.00. IBDU, Nitroform, and the control were the only treatments with a color rating of less than7. Nitroform, with a color rating of 6.38, was significantly different from all other treatments, aswas the control with a rating of 5.75.
All treatments, including the control, increased in color at 6 WAT. Eleven of the 15treatments had a color rating of 8 or above. All treatments had very good color. The color of theNitroform treated plots increased significantly and continued to improve until reaching peakcolor at 9 WAT.
At 7 WAT, the unfertilized control had significantly lower color than all other treatments.Exp 41-0-0A, Nutralene, urea, and PolyS produced equal color ratings which were significantlybetter than Nitroform. However, the color rating for the Nitroform treated plots was still verygood. Even the unfertilized controls had good color ratings. The peak color rating for urea andExp 41-0-0A occurred at 7 WAT. The peak color for PolyS treated plots began at 7 WAT andcontinued through 9 WAT.
Polyon, Exp 43-0-0A, and PolyS produced the best color at 8 WAT. At this point, alltreatments had very good to excellent color. The unfertilized control was the only treatment witha color rating of less than 8. The peak color rating occurred at 8 WAT for Exp 41-0-0C, andbegan at 8 WAT and continued through 9 WAT for Exp 43-0-0A and Polyon.
Peak color occurred at 9 WAT for Trikote, Exp 41-0-0B, Nutralene, Methex 40, PolyPlus,Milorganite, IBDU, Nitroform, and the unfertilized control. Ten treatments, including IBDU,Exp 41-0-0B, Exp 43-0-0A, Methex 40, Polyon, Nutralene, urea, PolyS, Trikote, andMilorganite, had a color rating of 8.5. All treatments, including the control, produced excellentcolor.
At 10 WAT, color ratings decreased for all treatments, although overall, color was still good.Ten treatments had a color rating of 8.0.
Color continued to decrease at 11 WAT. All treatments except the control had very similarcolor ratings. Milorganite produced significantly higher color than Nitroform and theunfertilized control. Most treatments were not significantly different from one another. From12-14 WAT, color ratings began to level off as fertilizers were depleted. At 14 WAT, there wereno significant differences in color ratings between treatments, and all plots had acceptable color.
Overall, the best average color rating was produced by PolyS, followed by urea, Trikote, andExp 41-0-0B. The unfertilized control had an average color rating of 6.53, which wassignificantly lower than all other treatments. Nitroform produced the second lowest averagecolor rating, which is not unexpected considering its slow release properties.
Of the four experimental fertilizers, Exp 41-0-0A produced the quickest color response,having a rating of 7.63 two weeks after fertilizer application. Exp 41-0-0A also produced peakcolor soonest, but not until 7 WAT, while the others produced peak color at 8 or 9 WAT. Theaverage (overall) color ratings produced by the four experimental fertilizers were not

significantly different from one another. However, Exp 41-0-0A, Exp 41-0-0B, and Exp 41-0-0C had significantly higher color ratings than Polyon.
Early in the study, the color of some of the plots was not uniform. Uneven color appearedapproximately two weeks after application and continued until approximately 5 WAT. Thissituation was most pronounced with Exp 43-0-0A, Polyon, and PolyPlus and may have been dueto the low rate of application combined with the high nitrogen content of the fertilizer.

Table 1. Influence of 14 fertilizer treatments on the color of creeping bentgrass 1-14 weeks after application. Color1 Treatment2 Average 3 Jun 10 Jun 18 Jun 25 Jun 1 Jul 8 Jul 14 Jul 22 Jul 30 Jul 5 Aug 13 Aug 19 Aug 26 Aug 2 SepUrea 7.79 ab 8.00 a 8.00 a 8.00 a 7.88 ab 7.88 ab 8.25 ab 8.50 a 8.38 a 8.50 a 8.00 a 7.00 ab 7.00 abc 6.88 ab 6.88 aPolyS 7.81 a 7.75 a 7.88 a 7.88 ab 7.75 ab 7.75 abc 8.38 a 8.50 a 8.50 a 8.50 a 8.00 a 7.13 ab 7.38 a 7.00 a 7.00 aTrikote 7.61 abc 6.38 cd 7.63 ab 7.75 abc 7.75 ab 7.63 abcd 8.13 ab 8.38 ab 8.38 a 8.50 a 8.00 a 6.88 abc 7.00 abc 7.13 a 7.00 aExp 41-0-0 B 7.59 bc 6.25 cd 7.13 cd 7.25 cd 7.88 ab 8.00 a 8.38 a 8.38 ab 8.38 a 8.50 a 8.00 a 7.00 ab 7.13 abc 7.00 a 7.00 aExp 41-0-0 C 7.56 c 6.13 cde 6.88 cd 7.63 abcd 8.00 a 8.00 a 8.13 ab 8.25 ab 8.38 a 8.25 abc 7.88 ab 7.00 ab 7.25 ab 7.00 a 7.00 aExp 41-0-0 A 7.51 cd 6.38 cd 7.63 ab 7.38 bcd 7.63 abc 7.75 abc 8.25 ab 8.50 a 8.25 ab 8.13 bc 7.75 b 7.00 ab 7.00 abc 7.00 a 6.88 aNutralene 7.48 cd 7.25 b 6.88 cd 6.63 ef 7.13 cde 7.25 def 8.38 a 8.50 a 8.38 a 8.50 a 7.75 b 7.13 ab 7.13 abc 7.00 a 6.88 aMethex 40 7.46 cde 7.25 b 6.75 de 7.13 de 6.75 ef 7.25 def 8.00 abc 8.25 ab 8.38 a 8.50 a 8.00 a 7.13 ab 7.13 abc 7.00 a 6.88 aPolyPlus 7.41 cde 6.50 c 7.25 bc 7.13 de 7.13 cde 7.25 def 8.13 ab 8.38 ab 8.00 b 8.38 ab 8.00 a 6.88 abc 6.88 bc 6.88 ab 6.88 aExp 43-0-0 A 7.42 cde 5.63 fg 6.38 ef 7.13 de 7.63 abc 7.78 abc 7.88 abc 8.25 ab 8.50 a 8.50 a 8.00 a 7.00 ab 7.25 ab 7.00 a 7.00 aMilorganite 7.32 def 6.13 cde 6.38 ef 6.63 ef 7.00 def 7.13 ef 7.75 bcd 8.25 ab 8.38 a 8.50 a 8.00 a 7.25 a 7.13 abc 7.13 a 6.88 aPolyon 7.25 efg 5.75 efg 5.63 g 6.38 f 7.13 bcd 7.38 cde 8.00 abc 8.38 ab 8.50 a 8.50 a 8.00 a 7.00 ab 7.00 abc 6.88 ab 6.75 aIBDU 7.13 fg 6.00 def 5.63 g 5.63 gh 6.50 fg 6.88 f 8.13 ab 8.38 ab 8.38 a 8.50 a 7.88 ab 7.13 ab 7.00 abc 7.00 a 6.88 aNitroform 7.06 g 6.50 c 6.00 fg 6.13 fg 6.00 gf 6.38 g 7.50 cd 8.13 b 8.25 ab 8.38 ab 8.00 a 6.75 bc 7.13 abc 6.88 ab 6.88 aControl 6.54 h 5.50 g 5.13 h 5.25 h 5.50 h 5.75 h 7.25 d 7.50 c 7.63 c 8.00 c 7.38 c 6.50 c 6.75 c 6.63 b 6.75 a
1 Turf color is rated on a 1-9 scale with 1 = brown, 6 = acceptable, and 9 = dark green. Average values are the average of 14 weekly ratings.2 Treatments were applied on 27 May 99 at a rate of 1 lb N/1000 ft2.Means followed by the same letter are not significantly different, Fisher’s Least Significant Difference, p = 0.05.

The Effect of Varying Rates of Iron Products on Creeping Bentgrass
C. F. Mancino, Associate Professor – Turf/Soil ScienceD. M. Petrunak, Research Technician – Turf/Soil Science
Department of Agronomy
Introduction
The use of iron in promoting color in turfgrass has benefits because iron applications canincrease color without an undesirable increase in clipping production, which can occur withexcessive applications of nitrogen. However, application of certain forms or rates of iron canproduce phytotoxicity on the turf for brief periods of time. The objective of this study was toevaluate several forms of iron at varying rates for turf color and phytotoxicity of bentgrass grownunder fairway conditions. A second objective was to evaluate an experimental, organic granulariron source that is a by-product of the drinking water treatment process.
Materials and Methods
Iron treatments (Table ) were applied on 6 August 99 at rates of 0.4, 0.8, and 1.2 lb Fe/1000ft2. Since the iron humate product contained 4% N, 10% K, and 2% Mn, equivalent amounts ofurea, MnSO4 monohydrate, and K2SO4 were added to the other treatments to balance the amountof those nutrients applied in the iron humate treatments. In addition, there were three treatmentscontaining only N, Mn, and K at rates equivalent to the N, Mn, and K levels in the different Fetreatments. All treatments were applied using a CO2 powered sprayer at 4 gal/1000 ft2, exceptthe iron humate treatments, which were applied as a granular material. The study site waswatered briefly prior to treatment application so that treatments were applied to wet turf. Inaddition, the site was watered for approximately 30 minutes following treatment application toreduce the potential for phytotoxicity.
The study was conducted on an established stand of ‘Penneagle’ creeping bentgrassmaintained at a 0.5” height of cut. The area was mowed three times per week with clippingsremoved from the site to prevent cross contamination of treatments. The soil type was aHagerstown silt loam. The study was a randomized complete block design with threereplications, with individual plots measuring 3’ x 8’.
The turf was evaluated for color 3 days after treatment (DAT) application and then weeklyfor the next five weeks. Color was evaluated on a 1-9 scale with 1 = brown, 6 = acceptable, and9 = dark green. Color data were subjected to analysis of variance and LSD for mean separation.
Results and Discussion
For the color rating 3 DAT, all the Fe EDTA treatments, as well as all the iron sulfatetreatments, had color ratings well below acceptable due to phytotoxicity from the irontreatments. Iron sulfate turned the turf a dark grey to black color while the Fe EDTA treated turfwas brown and had more of a burnt appearance. All other treatments, including the unfertilizedcontrol, had acceptable color ratings and were not significantly different.
At the 17 August rating (9 DAT), the high rate of iron humate produced very good color, asdid the medium and high rates of iron sulfate, which had recovered from the prior phytotoxicity.Of the treatments which had unacceptable color the previous week, only the medium and low

rates of Fe EDTA still had unacceptable color and were slightly brown. All other treatments hadbetter than acceptable color, except the unfertilized control.
Color ratings either leveled off or continued to improve the following week (16 DAT). Themedium and high rates of iron sulfate produced the highest color ratings, but the were notsignificantly different from the high and medium rates of iron humate, the low rate of ironsulfate, and the high rate of N, Mn and K alone. All treatments produced turf of acceptablecolor.
At 24 DAT, the best turf color was produced by the high rate of iron humate, followed by themedium rate of iron humate, the high rate of N, Mn, and K alone, and all three rates of ironsulfate. However, all treatments had acceptable color, with most having good color.
There were no significant differences in turf color due to treatment at 32 or 37 DAT. Therewas a slight decrease in color for all treatments between the last two ratings.
The best overall color was produced by the high rate of iron humate. The medium and lowrates of iron humate and all rates of N, Mn, and K alone all produced overall color ratings of 7.0or above. All rates of iron sulfate and the high rate of iron EDTA produced better thanacceptable color ratings. The medium and low rates of iron EDTA produced the lowest overallcolor ratings. However, this is due in part to very low color ratings 3 DAT.
The high rate of iron humate produced very good turf within 11 days of application. None ofthe iron humate treatments produced any burning, which would be an asset for a turf manager.Although the other iron treatments did recover completely from the phytotoxicity, there was aperiod of time when these plots exhibited very unacceptable color.
Table. Color ratings of creeping bentgrass treated with three rates of three iron-containingproducts. Treatment Rate Color1 (lb/1000 ft2) 9 Aug 17 Aug 24 Aug 31 Aug 8 Sep 13 Sep Mean Fe humate 1.2 7.0 a 7.8 a 7.5 ab 8.0 a 7.5 a 7.0 a 7.5 aFe humate 0.8 6.8 a 6.8 de 7.3 abc 7.5 abc 7.5 a 7.0 a 7.2 bFe humate 0.4 6.7 a 7.0 cde 7.0 bcd 7.2 bcd 7.3 a 6.8 a 7.0 bFe EDTA2 1.2 2.7 b 6.5 e 7.0 bcd 7.2 bcd 7.3 a 7.0 a 6.3 deFe EDTA 0.8 2.2 bc 5.8 f 6.8 cd 7.2 bcd 7.3 a 7.0 a 6.1 efFe EDTA 0.4 2.2 bc 5.5 f 6.7 d 6.8 cd 7.2 a 7.0 a 5.9 fFeSO4 1.2 1.3 d 7.5 abc 7.7 a 7.7 ab 7.5 a 7.0 a 6.4 cdFeSO4 0.8 1.5 cd 7.7 ab 7.7 a 7.5 abc 7.3 a 7.0 a 6.4 cdFeSO4 0.4 1.8 cd 7.2 bcd 7.5 ab 7.3 abc 7.5 a 7.0 a 6.4 cdN+Mn+K 0.4 7.0 a 6.7 de 7.0 bcd 7.0 bcd 7.5 a 7.0 a 7.0 bN+Mn+K 1.2 7.0 a 6.8 de 7.3 abc 7.5 abc 7.5 a 7.0 a 7.2 bN+Mn+K 0.8 6.8 a 6.8 de 7.0 bcd 7.2 bcd 7.5 a 6.8 a 7.0 bControl - 6.5 a 5.8 f 6.7 d 6.5 d 7.2 a 6.8 a 6.6 c 1 Turf color is rated on a 1 to 9 scale with 1 = brown, 6 = acceptable, and 9 = dark green.2 Fe EDTA was in chelated form.Mean values are the average of 6 weekly color ratings.Means within a column followed by the same letter are not significantly different, LSD, p = 0.05.

Manganese Requirements of Annual Bluegrass and Creeping Bentgrass
Xia Xu-Graduate StudentDr. Charles F. Mancino-Associate Professor of Turf/Soil Science
Department of Agronomy
Introduction
Annual bluegrass and creeping bentgrass are two major components of cool-season turfgrass species on golf course putting greens, although annual bluegrass is oftenconsidered a very troublesome weed. Many genotypes of annual bluegrass are found ongreens. Some genotypes are prolific seedhead producers while others flower infrequentlyor not at all. Their tolerance to very low mowing height and persistence make annualbluegrasses a very good and competitive turfgrass species on greens.
Because annual bluegrass has long been treated as a weed, the main problemencountered in managing annual bluegrass on greens is the lack of information on itsnutritional requirements. Studies found that high levels of nitrogen, phosphorous,possibly potassium, and low levels of sulfur encourage annual bluegrass growth.However, we do not know what the micronutritional requirements of annual bluegrass areand how they compare with those of creeping bentgrass. Understanding the micronutrientrequirements of annual bluegrass will help turf managers and scientists to develop abalanced fertilizer program to facilitate annual bluegrass growth or prevent its invasionon creeping bentgrass putting greens.
Manganese is an essential plant micronutrient. It serves as an activator ofnumerous enzymes, is a constituent of chlorophyll, and is involved in photosynthesis. Anadequate and continuing supply of Mn is essential to turf color and growth. Excessive orinadequate Mn, however, may cause turfgrass injury.
Manganese deficiency occurs on a wide range of soil types and can be the resultof low Mn levels or low Mn availability, especially in a calcareous or high pH soil.Incidence and severity of Mn deficiencies are manifested by wear stress, environmentalstress, frequent clipping removal, occurrence of pests, and high soil nitrogen andpotassium content. Deficiency symptoms in turfgrass include striped yellowish leaves(chlorosis) and slow growth.
Manganese toxicities are most commonly encountered in strongly acid soils(pH<5.5) but can occur at a pH higher than 5.5 in poorly drained or compacted soils,where reducing conditions favor production of divalent Mn. In addition, use of effluentirrigation water, Mn-containing fungicide, or organic fertilizers such as sewage sludgeand poultry manure can also add excessive amounts of Mn into turf soil, which may leadto Mn toxicity on greens, especially in high rainfall areas. Toxicity is usually expressedfirst in leaves with little observable effect on roots except in severe cases.
A rate of 25-150 mg Mn kg-1 on a dry weight basis has been reported to sufficientfor turfgrass. However, this value is an average and does not represent levels at whichdeficiency or toxicity will occur. Plant species, cultivars, genotypes, and evendevelopmental stages may differ considerably in their ability to acquire Mn and their

tolerance to excess Mn. It would be difficult to make fertilizer recommendations untilthese levels are better defined.
The objectives of this research are to determine the color and growth response ofthree frequently ands three infrequently flowering genotypes of annual bluegrass andthree parents of creeping bentgrass to varying levels of Mn, and to determine ifinterspecific or intraspecific difference exists in their Mn requirements.
Materials and Methods
A greenhouse sand culture experiment was used in this study. BB, BR, and BWwere the three parents of ‘Penncross’ creeping bentgrass. 11G-2, 18G-1, and 18G-2represented the three genotypes of frequently flowering annual bluegrass while 9G-1, 9G-6, and 11G-6 were the three genotypes of infrequently flowering annual bluegrass. Theplant materials were a kind gift of Dr. David Huff. The annual bluegrass was collectedfrom golf course putting greens at Oakmont Country Club in Pennsylvania.
All strains were vegetatively propagated under greenhouse conditions in potsfilled with 80% sand:20% peat mixture to ensure the genetic purity of individual strains.Tillers were washed of sand and transplanted to cones (4 cm in diameter x 22.5 cm inlength) filled with white sand (U. S. Silica, particle size 0.15 to 1.0 mm, Mapleton, PA).
By the time of establishment (about six weeks), plants were clipped to about 1-2centimeter one day before the Mn treatments were applied. Treatments began whenplants were irrigated by hand with half-strength Hoagland's nutrient solution (pH 5.5-6.0)every other day. MnCl2-Mn in Hoagland’s nutrient solution at 0, 0.1, 0.2, and 5 mg l-1
rates in Experiment 1 and 0, 10, 20, and 50 mg Mn l-1 in Experiment 2 was applied toplants for three weeks.
The treatment of Mn and genotypes were factorially arranged in split-plots withina completely randomized block design with four replications. The temperature of thegreenhouse was maintained at 250 C during the day and 150 C at night. No artificial lightwas used throughout the experimental period.
Turf leaf color was evaluated on a one (brown) to nine (excellent dark green)scale with six being acceptable green color. Color was rated three weeks after Mntreatments began or when acute deficiency or phytotoxicity symptoms appeared. Plantgrowth was measured by shoot fresh weight, shoot dry weight, and root dry weight.Shoot fresh weight was recorded three weeks after the Mn treatments. Dry weights weredetermined after samples were dried in an oven at 800 C for 48 hours. Dried plant tissuewas ground through a 40 mesh sieve. Plant tissue total Mn was abstracted by acid-ashingprocedure. Plant tissue Mn content was obtained by Flame Atomic AbsorptionSpectrophotometer.
Results and Discussion
Turf color. Withholding Mn in nutrient solution (control) gave annualbluegrass and creeping bentgrass plants an interveinal chlorosis appearance on youngerleaves in both experiments (Figure 1). Application of Mn alleviated deficiency symptomsat each level tested with increasing concentrations in nutrient solution up to 5 mg l-1 in
the Experiment 1. A rate of 0.1 and 0.2 mg Mn l-1 was enough to produce acceptable leafcolor for both annual bluegrass and creeping bentgrass. Excellent leaf color was observedat 5 mg Mn l-1 treatment. Leaf color among genotypes within species at the same levelsof Mn tested was not significant at this point.
In Experiment 2, higher rates of Mn in nutrient solution were applied to annualbluegrass and creeping bentgrass. Although no inter- and intraspecific differences existedfor exhibiting Mn deficiencies, annual bluegrass and creeping bentgrass do differ in theirability to withstand Mn phytotoxicities. A 10 mg Mn l-1 application rate caused annualbluegrass leaf tip burn (dieback), but no toxicity symptoms were observed in creepingbentgrass until the Mn concentration in nutrient solution reached 20 mg Mn l-1.However, the two flowering types of annual bluegrass responded to Mn similarly.
Turf shoot growth. After three weeks, application of Mn at 0.1, 0.2, and 5 mgl-1 rates significantly increased annual bluegrass and creeping bentgrass shoot growthcompared to untreated controls in Experiment 1. However, the highest shoot growth didnot always correspond to the highest Mn concentration applied. A depressed plant shootgrowth was obvious at higher Mn application rates in the Experiment 2. Along with theleaf tip burn, shoot growth was significantly reduced by 50 mg Mn l-1 application rates inboth species (Figure 2).
Shoot dry weight was not significantly different among creeping bentgrass,frequently and infrequently flowering annual bluegrass at low Mn application rate inExperiment 1. However, these differences between species became clear at higher Mnapplication rates (>10 mg Mn l-1) in Experiment 2. The three parents of creepingbentgrass produced greater shoot dry weight than annual bluegrass at each level of Mntested. Shoot dry weight of the two flowering types of annual bluegrass was about thesame. Again, there was no difference in shoot dry weight among the six genotypes ofannual bluegrass and three parents of creeping bentgrass.
Root production. It should be noted that application of Mn at low rates hadno significant effect on root dry weight production (Figure 3). Root dry weightproduction was significantly higher than untreated controls at higher levels of Mn appliedGreater root growth was observed in creeping bentgrass than in annual bluegrass but wassame between frequently and infrequently flowering annual bluegrass in Experiment 2.
Unlike shoot growth, root production in creeping bentgrass was not limited byhighest Mn application rate. There was no significant difference in root production withinspecies although interspecific difference was significant.
Plant tissue Mn content. In Experiment 1, we found that ‘Penncross’creeping bentgrass and two flowering types of annual bluegrass tended to have similarMn concentration in their shoot tissue at each level of Mn tested (Figure 4). Manganeseconcentration in shoot tissue increased from an average low of 10.6 mg kg-1 to anaverage high of 136.5 mg kg-1 as the Mn application rate in nutrient solution increasedfrom 0 to 5 mg Mn l-1. Manganese levels in deficient shoot tissue were about 10.6 mgkg-1 on a dry weight basis and were associated with yellowish leaf color and low shoot
and root growth. Maximum shoot and root production was obtained when shoot tissueMn concentration reached 136.5 mg kg-1.
In Experiment 2, differences in shoot tissue Mn concentration were observedbetween creeping bentgrass, frequently and infrequently flowering annual bluegrass.When the same level of Mn was applied, annual bluegrass tended to have a higher shoottissue Mn content than creeping bentgrass (Figure 4). Annual bluegrass took up more Mnthan creeping bentgrass at the same level of applied Mn. Annual bluegrass and creepingbentgrass appear to differ in their sensitivity to applied Mn.
Creeping bentgrass needed a higher Mn application rate (20 mg Mn l-1) toachieve toxic symptoms similar to annual bluegrass (10 mg Mn l-1). Manganeseconcentration in toxic shoot tissue was 749.1 mg kg-1 for annual bluegrass and 787.0 mgkg-1 for creeping bentgrass. Differences between species in sensitivity to Mn toxicityappear to be largely related to differences in their uptake of Mn rather than differences ininternal Mn requirements.
Since annual bluegrass had a much higher Mn concentration than creepingbentgrass at the same level of applied Mn, especially at high Mn application rates makingMn fertilizer recommendation may be difficult. We cannot manage annual bluegrass byMn fertilization in the same manner as creeping bentgrass although we can use planttissue analysis to predict the plant Mn status. By apply the same amount of Mn, we maycreate Mn deficiency in creeping bentgrass while causing annual bluegrass toxicity.
Conclusion
The results of this study indicate that Mn deficiency and toxicity in annualbluegrass and creeping bentgrass have a significant effect on leaf color and plant shootgrowth. Shoot growth is more affected than root production. Manganese fertilizationshould be kept in an moderate range and plant shoot tissue Mn should be in a range of 10to 136 mg/kg on dry weight basis.
There is a significant difference between annual bluegrass and creeping bentgrassin their ability to tolerate high levels of Mn. Creeping bentgrass can tolerate higherexternal Mn concentrations than annual bluegrass, due in part to the higher growth rate ofcreeping bentgrass.
Plant tissue analysis provides a suitable tool for predicting the likelihood of Mntoxicity in annual bluegrass and creeping bentgrass. However, using plant tissue analysisto manage Mn in annual bluegrass and creeping bentgrass greens is difficult because ofinterspecific differences in growth and Mn requirements. Low Mn application rates mightbe an efficient management strategy in promoting both annual bluegrass and creepingbentgrass color and growth but is less effective at high rates. Toxicity can easily result ifMn is applied at high rates in annual bluegrass. Care should be taken in managingcreeping bentgrass/annual bluegrass putting greens using Mn as a nutrient.

Figure 1: Turf leaf color
0
1
2
3
4
5
6
7
8
9
10
0 10 20 30 40 50 60
Mn concentration (mg/l)
CBFFSF
Figure 2: Shoot growth in response to Mn
0
0.2
0.4
0.6
0.8
1
1.2
1.4
0 10 20 30 40 50 60
Mn concentration (mg/l)
Sho
ot d
ry w
eigh
t (g)
CBFFSF

Figure 3: Root production
0
0.5
1
1.5
2
2.5
3
3.5
0 10 20 30 40 50 60
Mn concentration (mg/l)
Roo
t dry
wei
ght (
g)
CBFFSF
Figure 4: Mn effect on shoot tissue Mn content
-500
0
500
1000
1500
2000
0 10 20 30 40 50 60
Mn concentration (mg/L)
Sho
ot ti
ssue
Mn
(mg/
kg)
CBFFSF

The Effects of PCNB Formulation, Rate, and Application Timing on PuttingGreen Injury, Dollar Spot, and Annual Bluegrass Encroachment
P.J. Landschoot and B.S. ParkDepartment of Agronomy
Funding Sources: Greater Pittsburgh GCSA, Northwestern Pennsylvania GCSA, and ThePennsylvania Turfgrass Council
Introduction
PCNB (pentachloronitrobenzene) is one of the oldest fungicides used on golf courses.Although it is used widely for the control of snow mold diseases, PCNB has been blamed for avariety of turf problems ranging from phytotoxicity to enhancing non-target diseases. Despitereports of turfgrass damage following applications of PCNB, very little research has beenconducted on the combined effects of formulation, rate, and application timing on injury tocreeping bentgrass/annual bluegrass putting greens. The objective of this study was to determinethe influence of PCNB formulation, rate, and timing of applications on turfgrass injury, non-targetdiseases, and annual bluegrass encroachment on a creeping bentgrass/annual bluegrass puttinggreen.
Materials and Methods
This experiment was conducted at the Joseph Valentine Turfgrass Research Center inUniversity Park on a sand-based putting green composed of a 20-year-old stand of ‘Penncross’creeping bentgrass (85 to 90%) and annual bluegrass (10 to 15%). The experiment began in thefall of 1996 and was conducted over three growing seasons. The test area received 3.0 lbsnitrogen/1000 ft2/yr, split into four equal applications (one in late spring, two during the summer,and one in early fall). The test area was not fertilized from 3 weeks prior to the fall PCNBapplication until after the final injury rating was taken in spring. During 1997, plots were aeratedmid-June - after the final injury rating was collected. In 1998 and 1999, the plots were aerated inlate summer. Aeration was performed with a Toro Greens Aerator (model 09100) using 0.75-inch-diameter by 4.75-inch-long tines on 2.25 inch centers. Cores were removed with a coreharvester and the holes were filled with a 80% sand:20% peat (v:v) topdressing mix. The turfwas mowed at 5/32 inch and greens were irrigated whenever necessary to prevent stress.
Two formulations of PCNB, Turfcide 400 4F and Turfcide 10G, were applied at threedifferent rates corresponding to the half, full, and 2X maximum label rates for pink and gray snowmold (Table 1). The 2X rate was included to represent what may happen in case of an applicationoverlap. A Chipco 26019 Flo/Daconil Ultrex combination and an untreated control were includedin the test for comparison with the PCNB treatments (Table 1).
Three application timings were used in the test: a late fall (applied December 1, 1996,November 20, 1997, and November 18, 1998); late winter (March 12, 1997, February 14, 1998,and February 18, 1999) before the turf came out of winter dormancy; and a spring application(April 26, 1997, April 7, 1998, and April 8, 1999) applied just after uniform spring green-up.Some treatments were applied only in late fall, some were applied in both late fall and late winter,

some were applied in late fall and spring, and the remainder were applied in late fall, late winter,and spring. Rates and application timings for each treatment are listed in Tables 2 and 3.
Table 1. The amount of product and active ingredient applied for each fungicide product andformulation.
Turfcide 400 4F*Half rate: 6 fl oz product/1000 ft2 0.19 lb ai/1000 ft2
Full rate: 12 fl oz product/1000 ft2 0.38 lb ai/1000 ft2
2X rate: 24 fl oz product/1000 ft2 0.76 lb ai/1000 ft2
Turfcide 10G*Half rate: 5 lb product/1000 ft2 0.5 lb ai/1000 ft2
Full rate: 10 lb product/1000 ft2 1.0 lb ai/1000 ft2
2X rate: 20 lb product/1000 ft2 2.0 lb ai/1000 ft2
Chipco 26019 Flo and Daconil UltrexFull rate: 8 fl oz and 8 oz product/1000 ft2 0.13 lb ai and 0.41 lb ai/1000 ft2
*The amount of active ingredient applied differs between Turfcide formulations. This is due to the fact thathigher amounts of active ingredient are sometimes required for granular PCNB to be as effective incontrolling snow mold diseases as sprayable forms.
Granular treatments were applied by hand using shaker jars and liquid formulations wereapplied in 2 gallons water/1000 ft2 with a small plot sprayer equipped with 8004 flat fan nozzles at32 psi.
The experimental design was a randomized complete block design with three replications pertreatment. Ratings of turfgrass injury were based on a scale of 0 to 9, with 0 = no visible injuryand 9 = severe injury (complete loss of green color). Ratings were taken when differences amongtreatments became apparent. Turfgrass injury ratings were taken on May 1 and June 1, 1997;April 11 and April 24, 1998; and April 16, April 22, and May 18, 1999.
Dollar spot disease was assessed by counting the number of spots (infection centers) per plotor by visual assessment on a 0 to 10 scale with 0 = no disease and 10 = severe disease. Dollarspot disease was assessed on June 23, July 22, and August 8, 1998. The percentage of annualbluegrass in each plot was assessed visually on June 30, 1999.
Appropriate statistical analyses were performed on turf injury, dollar spot, and annualbluegrass data to determine if differences were primarily due to treatment effects. Statisticsincluded analysis of variance and a mean separation test (Fisher’s protected least significantdifference test at the 0.05 level of significance).

ResultsAlthough an evaluation of spring green-up was not an objective of this study, green-up differencesamong treatments were noticed on April 22, 1997 (before the spring application took place). AllPCNB treatments delayed spring green-up slightly when compared to the Chipco 26019Flo/Daconil Ultrex combination and the untreated control. Two PCNB treatments; the Turfcide400 4F full rate (0.38 lb ai/1000 ft2) fall and late winter and Turfcide 400 4F full rate fall and 2Xrate (0.76 lb ai/1000 ft2) in late winter; showed the least amount of spring green-up on April 22(data not presented). Spring green-up treatment differences were not noticed in 1998 and 1999.
Turfgrass injury:
Turfgrass injury, expressed as scorching of creeping bentgrass foliage (turf foliage appearedbrown, red, yellow, and/or tan), became evident a few days after the spring applications in 1997,1998, and 1999. Little to no injury was apparent on the annual bluegrass. Turfgrass injuryranged from a very slight discoloration (rating of 1 or less) to a severe foliar scorching (rating of 7or 8 on the most severely-affected plots).
The greatest degree of injury in all three years of the test was caused by the spring-appliedTurfcide 400 4F treatments. The most severe injury resulted from Turfcide 400 4F full rate in falland 2X rate in spring followed by the Turfcide 400 4F full rate in fall and full rate in spring. Amoderate amount of injury was apparent on at least one rating date in all three years of the testwith the Turfcide 400 4F full rate in fall and half rate (0.19 lb ai/1000 ft2) in spring and theTurfcide 400 4F full rate in fall, half rate in winter, and half rate in spring. Injury was usuallyvisible within a week of each spring application and lasted for 3 to 5 weeks. No injury wasobserved with any of the Turfcide 400 4F treatments applied in fall only or in fall and winter(except on one occasion in 1999 where slight injury occurred from the Turfcide 400 4F full rate infall and 2X rate in late winter treatment).
Despite higher amounts of active ingredient applied with the 10G formulation, less injuryresulted from Turfcide 10G treatments than Turfcide 400 4F treatments. Only slight injury wasobserved on May 1, 1997 and May 18, 1999 on turf treated with Turfcide 10G full rate (1.0 lbai/1000 ft2) in fall, half rate (0.5 lb ai/1000 ft2) in winter, and half rate in spring. No injury wasobserved as a result of this treatment in 1998. Slight injury from two other Turfcide 10Gtreatments [full rate in fall, 2X rate (2.0 lb ai/1000 ft2) in spring and the full rate in fall, 2X rate inwinter] was recorded on May 18, 1999. None of the other Turfcide 10G treatments producedturfgrass injury.
Effects on dollar spot:
Differences in dollar spot severity were apparent among some treatments in June, July, andAugust, 1998 (Table 3). The Turfcide 10G treatments that resulted in reduced dollar spotseverity (when compared with the untreated control) on one or more of the three 1998 ratingdates all involved repeat applications in winter and/or spring. Only two Turfcide 400 4Ftreatments showed reduced dollar spot relative to the untreated control; the full rate in fall and 2Xrate in spring and the full rate in fall and full rate in spring. More of the Turfcide 10G treatmentswere suppressive to dollar spot than the Turfcide 400 4F treatments, perhaps due to the higheramount of active ingredient applied with the Turfcide 10G treatments. No dollar spot suppression

was observed when applications of either formulation were made only in late fall. The onlytreatment that showed more dollar spot than the untreated control was Turfcide 400 4F fall onlytreatment on June 23, 1998.
Although brown patch and dollar spot were evident in the test area during August andSeptember, 1997 and 1999; disease ratings revealed no differences among treatments. Therefore,no disease data is presented for these years.
Effects on annual bluegrass:
Differences in annual bluegrass populations were apparent among some treatments during thespring of 1999. All Turfcide 10G-treated plots showed higher percentages of annual bluegrassthan the untreated control and the Chipco 26019 Flo/Daconil Ultrex combination. Generally, theTurfcide 10G-treated plots showed more annual bluegrass than plots treated with Turfcide 4004F. The only Turfcide 400 4F treatments that had more annual bluegrass than the untreatedcontrol and the Chipco 26019 Flo/Daconil Ultrex combination were those that included the fulland 2X rates applied in spring. These two treatments showed the greatest degree of injury tobentgrass turf during the three year test period.
Conclusions
When applied in late fall only (no repeat applications) at maximum label rates for snow molddiseases, Turfcide 10G and Turfcide 400 4F caused no injury to creeping bentgrass or annualbluegrass maintained as a putting green. No injury occurred when repeat applications of the 4Fand 10G formulations were made at full- or half-label rates in late winter while the turf was stilldormant. However, when repeat applications of Turfcide 400 4F were made on turf that wasactively growing in spring, injury did occur. The severity of injury from spring applicationsincreased with increasing rates of the 4F.
Generally, Turfcide 10G treatments caused less injury than Turfcide 400 4F treatments, eventhough higher rates of active ingredient were applied. The only instance of injury resulting from10G treatments was in May of 1997 and 1999 and this injury was slight (1.0 to 1.3 on a scale of 0to 9). Although it appears from these results that the 10G formulation is safer than the 4Fformulation when applied to actively-growing turf, the Turfcide 10G treatments produced higheramounts of annual bluegrass than most of the Turfcide 400 4F treatments as well as the controls.Although the reason(s) for this are not known, the Turfcide 10G treatments may be causing areduction in the competitiveness of creeping bentgrass with no adverse visual effects on the turf.If this is true, the affect may be due to the higher amount of active ingredient used with the 10Gformulation.
The reason dollar spot suppression occurred with some PCNB treatments in 1998, but not in1997 or 1999, could be due to an earlier initial infection in 1998 (June) than in the other two years(August). Since there would probably be more residual PCNB in the soil in June than in latesummer, this may explain why disease suppressive effects occurred in 1998, but not in the otheryears of the test.
The 10G formulation generally showed stronger dollar spot suppression than the 4F. Thiswas probably due to the higher rates of PCNB from granular treatments resulting in more residualPCNB in the soil at the time of dollar spot infection.

Table 2. Turfgrass injury ratings following PCNB applications on a creeping bentgrass and annual bluegrass putting green.
Rate/Timing 1997 Injury Ratings 1998 Injury Ratings 1999 Injury Ratings Mean of all
Treatment Fall Winter Spring 5/1/97 6/1/97 4/11/98 4/24/98 4/16/99 4/22/99 5/18/99 Injury Ratings
- - - lb ai/1000 ft2 - - - - - - - - - - - - - - - - - - - - - - - - - - - - - - - - 0 - 9 scale* - - - - - - - - - - - - - - - - - - - - - - - - - - - - -
Control -- -- -- 0 e** 0 d 0 d 0 e 0 d 0 e 0 c 0 dChipco/Daconil 0.13 + 0.41 -- -- 0 e 0 d 0 d 0 e 0 d 0 e 0 c 0 dTurfcide 10G 1.0 -- -- 0 e 0 d 0.3 d 0 e 0 d 0 e 0 c 0 dTurfcide 10G 1.0 0.5 -- 0.3 de 0 d 0.3 d 0.3 e 0 d 0 e 0 c 0.1 dTurfcide 10G 1.0 -- 0.5 0 e 0 d 0.3 d 0 e 0 d 0 e 0 c 0.2 dTurfcide 10G 1.0 1.0 -- 0 e 0 d 0 d 0 e 0 d 0 e 0.3 c 0 dTurfcide 10G 1.0 -- 1.0 0.3 de 0.3 d 0.3 d 0.3 e 0 d 0 e 0.7 abc 0.3 dTurfcide 10G 1.0 2.0 -- 0.7 de 0 d 0 d 0 e 0 d 0 e 1.3 a 0.3 dTurfcide 10G 1.0 -- 2.0 0 e 0 d 0 d 0 e 0 d 0 e 1.3 a 0.3 dTurfcide 10G 1.0 0.5 0.5 1.0 d 0 d 0 d 0 e 0 d 0 e 1.0 ab 0.3 dTurfcide 400 4F 0.38 -- -- 0 e 0 d 0.3 d 0 e 0 d 0 e 0 c 0 dTurfcide 400 4F 0.38 0.19 -- 0 e 0 d 0.3 d 0.7 de 0 d 0 e 0 c 0.1 dTurfcide 400 4F 0.38 -- 0.19 2.7 c 1.7 b 3.0 c 2.7 bc 1.0 c 0.7 de 0 c 1.7 cTurfcide 400 4F 0.38 0.38 -- 0 e 0 d 1.3 d 1.3 cde 0.3 d 0 e 0 c 0.4 dTurfcide 400 4F 0.38 -- 0.38 3.7 b 1.7 b 4.7 b 3.7 b 1.7 b 2.3 b 0.7 abc 2.6 bTurfcide 400 4F 0.38 0.76 -- 0 e 0 d 0.3 d 0.3 e 0.3 d 1.0 cd 0.3 bc 0.3 dTurfcide 400 4F 0.38 -- 0.76 6.0 a 3.7 a 7.7 a 5.7 a 3.3 a 3.7 a 1.3 a 4.5 aTurfcide 400 4F 0.38 0.19 0.19 2.0 c 0.7 c 3.0 c 2.0 cd 1.0 c 1.7 bc 0 c 1.5 c
* Injury ratings based on 0 - 10 visual assessment scale ; 0 = no visible injury and 9 = severe injury (complete loss of green color).** Column numbers followed by the same letter are not significantly different as determined by Fisher’s Protected Least Significant Difference test at 0.05 level of
significance.

Table 3. Dollar spot and P. annua ratings following PCNB applications on a creeping bentgrass and annual bluegrass putting green.
Rate/Timing # of Infection Centers Visual Rating % Annual bluegrassTreatment Fall Winter Spring 6/23/98 7/22/98 8/8/98 6/30/99
- - - lb ai/1000 ft2 - - - - 0 - 10 scale* -Control -- -- -- -- 26 b-d** 68 a-c 5.0 ab 12 gChipco/Daconil 0.13 + 0.41 -- -- 28 a-c 83 ab 4.7 a-c 11 gTurfcide 10G 1.0 -- -- 22 b-e 49 a-d 3.3 b-g 32 bcdTurfcide 10G 1.0 0.5 -- 17 b-f 57 a-d 4.0 a-e 32 bcdTurfcide 10G 1.0 -- 0.5 7 e-g 36 b-d 2.7 d-h 38 abTurfcide 10G 1.0 1.0 -- 3 fg 11 d 2.3 e-h 40 aTurfcide 10G 1.0 -- 1.0 5 fg 23 cd 2.0 f-h 38 abTurfcide 10G 1.0 2.0 -- 4 fg 23 cd 2.7 d-h 34 a-dTurfcide 10G 1.0 -- 2.0 1 g 10 d 1.3 h 40 aTurfcide 10G 1.0 0.5 0.5 7 e-g 93 a 4.3 a-d 37 abcTurfcide 400 4F 0.38 -- -- 43 a 93 a 5.7 a 16 fgTurfcide 400 4F 0.38 0.19 -- 25 b-d 84 ab 4.3 a-d 15 fgTurfcide 400 4F 0.38 -- 0.19 14 c-g 52 a-d 3.0 c-h 21 efTurfcide 400 4F 0.38 0.38 -- 28 a-c 52 a-d 3.3 b-g 18 fgTurfcide 400 4F 0.38 -- 0.38 5 fg 11 d 1.7 gh 28 deTurfcide 400 4F 0.38 0.76 -- 30 ab 55 a-d 3.3 b-g 18 fgTurfcide 400 4F 0.38 -- 0.76 1 g 14 d 1.7 gh 30 cdTurfcide 400 4F 0.38 0.19 0.19 13 d-g 38 b-d 3.7 b-f 21 ef
* The visual dollar spot rating scale is 0 to 10 ; 0 = no evidence of disease and 10 = severe infestation.** Column numbers followed by the same letter are not significantly different as determined by Fisher’s Protected Least Significant Difference test at 0.05 level of
significance.

Summer Management of Hairy Chinch Bug with DeltaGard, Dursban,Scimitar, Talstar, and Tempo Formulations on Established Fescue
P. R. Heller and R. WalkerDepartment of Entomology
Introduction
Hairy chinch bug (HCB) populations at select areas across the Commonwealth in 1998 weremajor pests of fine leafed fescue home lawns. The major objective of this experiment was todetermine the effectiveness of synthetic pyrethroid formulations in comparison to chlorpyrifos.
Materials and Methods
The site used for this study was located in Somerset County on turfgrass with significantthatch. The turfgrass area consisted primarily of fine leafed fescue. Treatment plots were 5 X 6 ftarranged in a RCB (randomized complete block) design and replicated 3 times. Granularformulations were applied with a hand held shaker with top dressing sand used to provide evendistribution of product. Liquid formulations were applied by using a a CO2 compressed airsprayer with 4 8002VS TeeJet nozzles mounted on a 6 ft boom, operating at 28 psi, and appliedin 227 ml of water/30 ft2 or delivering 2 gal/1000 ft2. At treatment time (18 Aug) the followingsoil and environmental conditions existed: air temperature, 78 oF; soil temperature at 1 inchdepth, 73 oF; soil temperature at 2 inch depth, 69 oF; RH, 79%; amount of thatch, 1.0 inch; soiltextural class, silt loam; soil particle size analysis: 28.8% sand, 57.7% silt, 13.5% clay; % watercontent (% by wt), 14.6%; organic matter, 5.8%; water pH, 7.0; soil pH, 6.5; application time,mid morning; and partly cloudy skies. Immediately after treatment the experimental area received0.055 inch of irrigation. HCB was sampled by driving a 6 inch-diam stainless steel cylinder intothe turf, filling it with water, and counting the number of HCB nymphs and adults floating to thesurface during a 10 min period 24 Aug and 31 Aug. Two floatation samples were taken randomlyfrom each replicate, and the total number of HCB from each sample was recorded and convertedto a ft2 count.
Results and Discussion
An average of 177.0 HCB nymphs and adults/ft2 was recorded 18 Aug before treatment. Posttreatment counts completed 24 Aug and 31 Aug indicated that all treatments provided significantcontrol. The Table summarizes treatment results. Talstar GC Flowable, Talstar PL G, DeltaGardGC Granular, and Scotts Insecticide III formulations provided excellent control of HCB. Nophytotoxicity was noted.

Table. Hairy chinch bug (HCB) results summary.
Treatment/ Rate Avg no. HCB/ft2
formulation lb (AI)/acre 24 Aug 31 Aug*
Talstar GC Flowable 0.1 5.0 c 1.6 cd
Talstar GC Flowable 0.2 0.0 c 0.1 cd
Scimitar CS 0.066 37.5 b 38.6 b
Tempo Ultra 1SC** 0.138 21.2 bc 12.9 bcd
DeltaGard GC 5SC 0.13 14.5 bc 19.0 bc
Dursban Pro 1.0 11.0 c 15.4 bcd
Talstar PL Granular 0.2 0.0 c 0.0 d
DeltaGard GC Granular 0.13 14.3 bc 4.7 cd
Scotts Insecticide III 1.0 1.7 c 0.8 cd
Untreated Control -- 109.8 a 92.5 a
Means followed by the same letter are not significantly different(P = 0.05, WD).
* Arcin transformed data.
** Experimental formulation of Tempo.
*** Apply registered formulations only according to label directions. In some cases experimentalrates may have been used.

Annual Bluegrass Weevil Suppression with Formulations of Chlorpyrifos,DeltaGard, and Scimitar
P.R. Heller and R. Walker,Department of Entomology
Introduction
Annual bluegrass weevil (ABW) (formerly Hyperodes spp.) remains a significant pest ofannual bluegrass. Populations have increased at various locations across the state. The primaryobjective of this experiment was to compare the effectiveness of synthetic pyrethroid formulationswith chlorpyrifos to reduce natural adult populations of this weevil pest.
Materials and Methods
This experiment was conducted on turfgrass located in Bedford County. The turfgrassconsisted primarily of annual bluegrass (70%) and Kentucky bluegrass (30%). Applications weremade when flowering dogwood was in full bloom. Treatment plots were 5 x 6 ft, arranged in aRCB design and replicated 4 times. Liquid formulations were applied in 1 gal of water with ahand held sprinkling can followed by an additional gal of water. At treatment time (28 April), thefollowing soil and environmental conditions existed: air temperature, 56 oF; soil temperature at linch depth, 60 oF; soil temperature at 2 inch depth, 59 oF; RH, 52%; amount of thatch, 0.1875-0.25 inches; soil textural class, silt loam; soil particle analysis: 23.0% sand, 57.3% silt, 19.6%clay; soil percent water weight (percent by weight), 31.2; organic matter, 6.3%; soil pH, 5.8;water pH, 7; application time, noon; and clear skies. Granular formulations only were irrigatedwith 0.11 inch water immediately after treatment. Post treatment counts were made on 4 June.ABW control was evaluated by removing two 4 inch cup cutter sod samples from each replicateand recording the total number of annual bluegrass weevil life stages (larva, pupa, adult) persample. Totals were then converted to a ft2 count.
Results and Discussion
ABW adults were actively observed on turfgrass before treatment. All treatments providedsignificant control and results are summarized in the Table. The newly introduced DeltaGard GCGranular and 5SC insecticide formulations provided good to excellent reduction in comparison toScimitar and Dursban treatments. No phytotoxicity was noted.

Table. Results summary for suppression of annual bluegrass weevil (ABW) withformulations of DeltaGard, Scimitar, and Scott's Insecticide III.
Avg. no. ABW/ft2
Treatment/ Rate (All life stages)
formulation lb (AI)/acre 4 Jun % Reduction
DeltaGard GC 5SC 0.13 7.2 b1 84.5
DeltaGard GC Granular 0.13 4.3 b 90.7
Scotts Insecticide III 2.0 0.0 b 100.0
Scimitar CS2 0.03 0.0 b 100.0
Scimitar CS2 0.06 2.9 b 93.8
Untreated Control -- 46.4 a --
1Means followed by the same letter are not significantly different (P = 0.05, WD).2Formulation is not registered for use on golf courses.* Apply registered formulations only according to label directions. In some cases experimentalrates may have been used.

Evaluation of Mach 2, Merit, and Conventional Formulations for ResidualSuppression of White Grubs on Home Lawns
P.R. Heller and R. WalkerDepartment of Entomology
Introduction
A wide array of formulations are available for suppression of white grubs in home lawns.Although spring management of white grubs seldom is suggested, the primary objective of thisexperiment was to determine spring reduction of white grub species as well as residual control.
Methods and Materials
Treatment plots were established at the Valentine Turfgrass Research Center located at ThePennsylvania State University. The turfgrass area consisted primarily of perennial ryegrass(100%). Treatment plots were 9 x 6 ft, arranged in a randomized complete block design andreplicated 3 times. Liquid formulations were applied by using a hand held sprinkling can and 4 galof water. Granular formulations were applied with a hand-held shaker and mixed with fine topdressing sand to facilitate product distribution. At treatment time (7 May) the following soil andenvironmental conditions existed: air temperature, 56o F; soil temperature at l inch depth, 60o F;soil temperature at 2 inch, 58o F; relative humidity, 95%; amount of thatch, 0.0625-0.125 inch;soil textural class, silt loam; soil particle size analysis: 15.1% sand, 59.2% silt, 25.6% clay;organic matter, 3.1%; soil percent water content (percent by weight), 20.4; water pH, 7.0; soilpH, 5.8; treatments were applied in late-morning; 1.7 inch of rainfall was recorded from 7 Maythrough 12 May; and sunny skies. Select treatments were irrigated with 0.125 inch of waterimmediately after treatment. Post-treatment counts were completed on 20 May and 16 Sept.Three ft2 sod samples were randomly taken from each replicate, and the total number of whitegrubs/ft2 was recorded. White grubs recovered consisted primarily of Japanese beetle grubs(98.3%).
Results and Discussion
An average of 7.8 grubs/ft2 was recorded on 24 April. All treatments provided significantcontrol of Japanese beetle grubs 13 days after treatment (DAT) while only seven treatmentsprovided significant control on 16 Sept. Results are summarized in the Table. No phytotoxicitywas noted.

Table. Japanese beetle white grub efficacy summary for 1998.
Avg. No. Japanese beetle grubs/ ft2
20 May 16 Sep Treatment/formulation Rate
lb (AI)/acre Living Dead1 Living %Red2
Mach 2 1.0%G3, 5 0.91 4.4 b 3.0 abc 0.4 c 96.9
Mach 2 1.0%G3, 5 1.00 2.6 bc 2.7 bc 1.0 c 92.2
Mach 2 1.0%G3, 5 1.50 4.0 bc 3.8 ab 0.0 c 100.0
Mach 2 1.0%G4, 5 0.91 4.6 b 3.6 ab 0.0 c 100.0
Mach 2 1.0%G4, 5 1.00 3.7 bc 4.6 ab 0.1 c 99.2
Mach 2 1.0%G4, 5 1.50 4.9 b 5.1 ab 0.0 c 100.0
Spectracide 3X Insect Control3 0.27 4.4 b 5.3 ab 17.4 a 0.0
Ortho Diazinon Turf Insect Control3 4.4 2.4 bc 6.0 a 8.4 b 34.4
Scotts GrubEx3 0.25 4.8 b 3.4 ab 0.0 c 100.0
Spectracide Diazanon Multi-purpose
Insect Spray3 4.3 2.1 bc 3.2 abc 10.0 b 21.9
Ortho Diazinon Ultra Insect Spray3 4.04 1.2 c 5.4 ab 8.3 b 35.2
Untreated Control -- 11.6 a 0.0 c 12.8 ab --
1Avg no dead grubs recovered from treatments 13 DAT. In some instances grubs were in amoribund state (i.e., they would not respond to any type of tactile stimulation and did not moveoff sampling boards).2Percent Reduction3Treatments watered in immediately following treatment.4Post-treatment irrigation delayed for 24 hrs. Irrigation was not necessary since rainfall occurredsoon after treatment.5Mach 2 1.0%G is an experimental formulation.Apply formulations only according to label rates. In some cases experimental rates may have beenused.Means followed by the same letter are not significantly different (P = 0.05, WD).

Response of Kentucky Bluegrass and Perennial Ryegrass to the Applications ofProxy Under Reduced Light Conditions
Dr. T. L. Watschke and J. A. BorgerDepartment of Agronomy
Introduction
Little is known about the effects that the growth regulator (Proxy) might have on the turfquality of perennial ryegrass and Kentucky bluegrass grown under different levels of shade. Sixstudies were conducted on a mature stand of perennial ryegrass (three studies) and Kentuckybluegrass (three studies) at the Landscape Management Research Center, Penn State University,University Park, PA. The objective of the studies was to determine whether Proxy treated turfwould have improved quality under varying levels of shade.
Methods and Materials
Each study was a randomized complete block design with three replications. All of thetreatments (Proxy at 3,5, and 10 oz/M) were applied on June 21, 1999 using a three foot CO2
powered boom sprayer calibrated to deliver 40 gpa using two, flat fan, 6504 nozzles at 40 psi.Each study area was covered with a shade cloth (kept twenty inches above the turf canopy
with a wooden rack) to simulate shade. Shade was imposed at three levels (30, 55 and 73 percentlight filtering). The racks with shade cloth were removed each week to record data and mow andthen returned.
All test sites were maintained at two and one half inches with a rotary mower withclippings removed. The test site was irrigated as needed for the duration of the study. Colorratings were taken approximately every seven days for six weeks. Fresh weights (g) wereharvested using a twenty inch rotary mower making one pass per plot on August 3.
Results and Discussion
On July 20, (approximately one month after treatment) the color ratings for Kentuckybluegrass tended to produce a trend whereby a slight increase in color was observed as the rate ofProxy increased from 3 to 10 oz/M across all three levels of shade (Table1). On July 27,Kentucky bluegrass treated with Proxy at the lowest level of shade (30%) had a slightly bettercolor than untreated turf. This trend was not found on the final rating date (Aug 3).Kentucky bluegrass shaded at the 55% level tended to have improved color on July 27 comparedto untreated turf. By the final rating date (Aug 3) all Proxy treated Kentucky bluegrass was ratedbelow the acceptable level of 7. Only untreated turf was rated as acceptable.On July 20, Kentucky bluegrass treated with Proxy at the 10 oz/M rate and exposed to 73%shade was rated above the acceptable level (7). At 73% shade, all treated and untreated Kentuckybluegrass was rated to have unacceptable color on the final two rating dates (Jul 27 and Aug 3).

At the 30% shade level Proxy treated perennial ryegrass color was rated lower than untreated turfbut not below the level of acceptability of 7. By July 27 only the perennial ryegrass treated withProxy at 3 oz/M was rated lower that untreated turf. On the final rating date (Aug 3) all perennialryegrass (treated and untreated) was rated 8.5 for color.When perennial ryegrass was subjected to a 55% shade and rated for color only the 5 and 10oz/M rate of Proxy on July 13 were below that of untreated turf.On July 13 all Proxy treated perennial ryegrass under 73% shade had color ratings belowuntreated turf but not below a level of acceptability. On July 27 perennial ryegrass treated at the3 and 10 oz/M rates of Proxy had poorer color than the untreated perennial ryegrass. By the finalrating date (Aug 3) all perennial ryegrass treated with Proxy was rated to have poorer color thanuntreated turf. Regardless of treatment, the color ratings of the perennial ryegrass was neverrated below the acceptable level.
After harvesting fresh weights of perennial ryegrass grown at 55% shade on Aug 3 theuntreated turf produced 137.7 grams of clippings which was significantly more than the perennialryegrass treated at any rate of Proxy (Tables 2 and 3).More shade/Proxy research should be conducted in the future. Although, some interesting resultswere found in these studies, the shade canopies should be put in place just after turf green up inthe spring and treatments withheld until the turfgrass is acclimated to the shade environment. Thestudy should then be conducted for the entire growing season.

Table 1. Color ratings of Kentucky bluegrass and perennial ryegrass with varying degrees of shade and rates of Proxy.
Treatment Form Rate (--------------------Color-------------------) (oz/M) 6-29 7-6 7-13 7-20 7-27 8-3
------------------Kentucky bluegrass 30 % shade------------------------CHECK 8.81 8.8 8.5 8.8 7.7 8.5PROXY 2SL 3 8.8 8.8 8.6 8.9 8.0 8.5PROXY 2SL 5 8.8 8.8 8.7 8.9 8.2 8.5PROXY 2SL 10 8.8 8.8 8.8 9.0 8.3 8.5
------------------Kentucky bluegrass 55 % shade------------------------CHECK 8.8 8.7 8.5 8.8 7.5 7.1PROXY 2SL 3 8.8 8.7 8.7 8.8 7.9 6.8PROXY 2SL 5 8.8 8.7 8.8 8.9 8.0 6.7PROXY 2SL 10 8.8 8.7 8.8 9.0 7.7 6.5
------------------Kentucky bluegrass 73 % shade------------------------CHECK 8.8 8.7 8.3 6.2 4.8 4.0PROXY 2SL 3 8.8 8.7 8.3 6.3 5.3 4.4PROXY 2SL 5 8.8 8.7 8.8 6.8 4.3 4.0PROXY 2SL 10 8.8 8.7 8.8 7.2 4.0 3.5
------------------Perennial ryegrass 30 % shade---------------------------CHECK 8.8 8.8 8.3 8.5 8.0 8.5PROXY 2SL 3 8.8 8.8 8.2 8.5 7.9 8.5PROXY 2SL 5 8.8 8.8 8.2 8.5 8.0 8.5PROXY 2SL 10 8.8 8.8 8.0 8.5 8.0 8.5
------------------Perennial ryegrass 55 % shade---------------------------CHECK 8.8 8.8 8.7 8.5 8.0 8.5PROXY 2SL 3 8.8 8.8 8.7 8.5 8.0 8.5PROXY 2SL 5 8.8 8.8 8.5 8.5 8.0 8.5PROXY 2SL 10 8.8 8.8 8.6 8.5 8.0 8.5
------------------Perennial ryegrass 73 % shade---------------------------CHECK 8.8 8.8 8.7 8.5 7.8 8.0PROXY 2SL 3 8.8 8.8 8.6 8.5 7.6 7.5PROXY 2SL 5 8.8 8.8 8.6 8.5 7.8 7.8PROXY 2SL 10 8.8 8.8 8.5 8.5 7.5 7.81 - where 0 = brown, 7 = acceptable and 10 = dark green

Table 2. Fresh weight (grams) harvested on Aug 3 from Kentucky bluegrass grown under varying degrees of shade and treated with three rates of Proxy.
Treatment Form Rate (----------Degree of Shade------------) Oz/M 30 55 73 CHECK 119.0a1 195.7a 175.0a PROXY 2SL 3 142.7a 201.3a 191.0a PROXY 2SL 5 132.3a 225.7a 178.0a PROXY 2SL 10 157.3a 232.7a 186.7a 1 - Means followed by same letter in the same column do not significantly differ (P=0.05, Duncan's New MRT).
Table 3. Fresh weight (grams) harvested on Aug 3 from perennial ryegrass grown under varying degrees of shade and treated with three rates of Proxy
Treatment Form Rate (----------Degree of Shade------------) Oz/M 30 55 73 CHECK 82.3a1 137.7a 155.7aPROXY 2SL 3 89.7a 119.7b 147.7aPROXY 2SL 5 82.7a 119.7b 150.0aPROXY 2SL 10 84.0a 121.7b 159.0a1 - Means followed by same letter in the same column do not significantly differ (P=0.05, Duncan's New MRT).

Spring Overseeding of Creeping Bentgrass After a Late Summer Pre-Emergence Application
Dr. T. L. Watschke and J. A. BorgerDepartment of Agronomy
Introduction
This study was conducted on a mature stand of perennial ryegrass (Lolium perenne L.) atthe Valentine Turfgrass Research Center, Penn State University, University Park, PA. Theobjective of the study was to determine the spring establishment rate of creeping bentgrass afterpre-emergence herbicides were applied late the previous summer for control of Poa annua.
Methods and Materials
This study was a randomized complete block design with three replications. All of the latesummer treatments were applied on September 7, 1998 using a three foot CO2 powered boomsprayer calibrated to deliver 80 gpa using two, flat fan, 6504 nozzles at 30 psi. After theapplication of treatments the test site received 0.5” of water. The test area was maintained at 7/8”using a triplex reel mower returning the clippings to the site. Glyphosate was applied at 5 lbs ai/Aon September 21, 1998 to the test site to kill the ryegrass and create conditions similar to winterkill the following spring.
On April 28, 1999, the test site was prepared for seeding by making one pass using 3/4”hollow core aerification and two passes with a verticutting unit. The test site was seeded with 0.5lb/M ‘Penneagle’ creeping bentgrass (Agrostis palustris Huds.) using a 10 to 1 ratio of greensgrade Milorganite to bentgrass seed. The seeding was accomplished using a three-foot dropseeder. In addition to the seeding, the test site received 0.75 lb N/M from a 19-26-5 starterfertilizer at the time of seeding. The seedbed was maintained until the final rating on June 3,1999.
Results and Discussion
Both rates of Barricade and Dimension significantly reduced the establishment rate of theseeded creeping bentgrass (less than 10 percent ground cover). The untreated plots and thosetreated with bensulide had a similar ground cover (over 85 percent). It appears that the use ofBarricade and Dimension for pre-emergence control of annual bluegrass can cause problems if aneed arises to seed creeping bentgrass into the treated areas the following spring. Both materialsappear to have considerably more soil residual than bensulide.

Table. Ground cover ratings (percent) of the seeded creeping bentgrass after alate summer application of pre-emergence herbicides. Ratings were taken on June 3, 1999.
Treatment Form Rate(LB Ai/A) %Cover
BARRICADE 65 WG 0.38 8.3b1
BARRICADE 65 WG 0.5 10.0bCHECK -- -- 88.3aBENSULIDE 4 L 12.5 88.3aDIMENSION 1 EC 0.5 8.3b 1 – Means followed by the same letter do not significantly differ (P = 0.05, Duncan’s New MRT).

Seedhead Suppression of Annual Bluegrass
T. L. Watschke and J. A. BorgerDepartment of Agronomy
Introduction
This study was conducted on a mature stand of Poa annua at the Landscape ManagementResearch Center, University Park, PA. The objective of the study was to evaluate selectedherbicides and growth regulators for the seedhead suppression of Poa annua.
Methods and Materials
All of the Prograss/Sprint/urea treatments were applied on April 14, 1999 using a three-foot CO2 powered boom sprayer calibrated to deliver 40 GPA using two 6504 nozzles at 40 psi.The balance of the treatments were applied on April 21, 1999 using the same applicationmethods and equipment. The turf was maintained using practices for irrigation, mowing andfertilization that would be typical for a fairway.
Seedheads were emerging at the time of the April 21, 1999 treatment. The April 14,1999 application was timed to follow the first mowing of the growing season.
Results and Discussion
All treatments provided some level of seedhead suppression (Table). No treatment causedan unacceptable level of phytotoxicity. The two low rates of Prograss/Sprint/urea providedsimilar seedhead suppression (53.3 % on May 18). The high Prograss rate caused a seedheadsuppression rating of 71.1% on May 18. Turf treated with Embark T/O with or without Ferromechad very little seedhead suppression (23% at the best). The timing of application for the Embarkwas too late for good efficacy as such treatment properly timed usually yields seedheadsuppression in the 90% range. It appears that the application of the Prograss treatments sevendays earlier than the Embark applications provided an efficacy advantage for the Prograss.

Table. Ratings of phytotoxicity (April 21, 1999) and percent suppression of Poa annuaseedheads (May 5 and May 18, 1999) on a mature stand of Poa annua. Treatment Form Rate Phytotoxicity % Suppression
5-5 5-18 Prograss 1.5EC 0.75 LB A/A 7.51a2 21.7bc 53.3bSprint G 3 OZ/MUrea 46 G 0.1 LB A/M Prograss 1.5EC 1.0 LB A/A 7.5a 43.3ab 53.3bSprint G 3 OZ/MUrea 46G 0.1 LB A/M Prograss 1.5EC 1.5 LB A/A 7.5a 61.7a 71.7aSprint G 3 OZ/MUrea 46G 0.1 LB A/M Check 7.5a 0.0c 0.0d Embark T/O 0.2L 40 OZ/A 7.5a 15.0c 23.3c Embark T/O 0.2L 40 OZ/A 7.5a 10.0c 23.3cFerromec L 5 OZ/M 1Rating scale of 0 = brown 7 = acceptable 10 = dark green.2Means followed by same letter do not significantly differ (P=.05Duncan's New MRT)

Seedhead Suppression of Annual Bluegrass on a Putting Green
T. L. Watschke and J. A. BorgerDepartment of Agronomy
Introduction
This study was conducted on a mixed stand of creeping bentgrass (Agrostis stolonifera)and Poa annua at the Penn State Blue Golf Course in State College, PA. The objective of thestudy was to evaluate selected growth regulators, with and without additional adjuvants, for theseedhead suppression of Poa annua.
Methods and Materials
All of the treatments were applied on April 21, and, in some cases, April 29 and May 5,1999 using a three-foot CO2 powered boom sprayer calibrated to deliver 40 GPA using two 6504nozzles at 40 psi. The turf was maintained using practices for irrigation, mowing, andfertilization that would be typical for a green. The green did not receive anyaerification/topdressing prior to or during the study.
Results and Discussion
On May 11, 1999 none of the treatments were rated to have caused a significantphytotoxicity to the turf compared to turf that was not treated (Table). Slight decreases in colorwere noted, but none was judged to be unacceptable. It should be noted that the experimental sitewas very low in nitrogen fertility and was in some degree of moisture stress due to problemswith the golf course irrigation system.
On May 19, 1999 the percentage of seedhead suppression due to chemical treatments wasrated (Table ). The seedhead suppression for this experiment across the treatments was lower thisyear than in the past. The reduced efficacy can be explained by the stress condition of the turffollowing treatment. The severe environmental conditions likely hindered absorption andtranslocation of the materials resulting in the reduced efficacy. Even so, it appeared that by usingeither Seaweed Cocktail or MacroSorb Foliar with 40 oz/A of Embark T/O, the amount ofseedhead suppression tended to be greater than for the other treatments. There does not appear tobe compelling evidence in the data that MacroSorb Foliar is capable of altering the antagonismof efficacy associated with using Embark T/O with Ferromec. There does, however, appear to besome enhancement of efficacy when Ferromec is not used.

Table 1. Ratings of Phytotoxicity (May 11, 1999) and percent suppression of Poa annua seedheads (May 19, 1999) on a Poa annua/creeping bentgrass putting green.Treatment Form Rate Timing Phytotoxicity % Suppression EMBARK T/O 0.2L 40 OZ/A 7.71a2 70.0a EMBARK T/O 0.2L 40 OZ/A 8.0a 71.7aFERROMEC L 5 OZ/M EMBARK T/O 0.2L 40 OZ/A 8.2a 68.3aFERROMEC L 5 OZ/MSURFSIDE 37 L 2 OZ/MSURFSIDE 37 L 2 OZ/M 2WAT EMBARK T/O 0.2L 40 OZ/A 7.8a 70.0aFERROMEC L 5 OZ/MSEAWEED COCKTAIL L 0.5 GAL/ASURFSIDE 37 L 2 OZ/MSURFSIDE 37 L 2 OZ/M 2WATSEAWEED COCKTAIL L 0.5 GAL/A 2WAT EMBARK T/O 0.2L 40 OZ/A 7.9a 73.3aSEAWEED COCKTAIL L 0.5 GAL/ASEAWEED COCKTAIL L 0.5 GAL/A 2WAT CHECK 8.1a 0.0b EMBARK T/O 0.2L 40 OZ/A 7.7a 73.3aMACRO-FOLIAR L 2 OZ/MMACRO-FOLIAR L 2 OZ/M 1WATMACRO-FOLIAR L 2 OZ/M 2WAT EMBARK T/O 0.2L 40 OZ/A 8.2a 66.7aFERROMEC L 5 OZ/MMACRO-FOLIAR L 2 OZ/MMACRO-FOLIAR L 2 OZ/M 1WATMACRO-FOLIAR L 2 OZ/M 2WAT EMBARK T/O 0.2L 40 OZ/A 8.3a 71.7aFERROMEC L 5 OZ/MSEAWEED COCKTAIL L 0.5 GAL/ASEAWEED COCKTAIL L 0.5 GAL/A 2WAT EMBARK T/O 0.2L 30 OZ/A 8.0a 63.3aMACRO-FOLIAR L 2 OZ/MMACRO-FOLIAR L 2 OZ/M 1WATMACRO-FOLIAR L 2 OZ/M 2WAT EMBARK T/O 0.2L 30 OZ/A 8.2a 58.3aFERROMEC L 5 OZ/MMACRO-FOLIAR L 2 OZ/MMACRO-FOLIAR L 2 OZ/M 1WATMACRO-FOLIAR L 2 OZ/M 2WAT EMBARK T/O 0.2L 20 OZ/A 7.8a 65.0aSEAWEED COCKTAIL L 0.5 GAL/ASEAWEED COCKTAIL L 0.5 GAL/A 2WAT EMBARK T/O 0.2L 20 OZ/A 8.5a 55.0a EMBARK T/O 0.2L 30 OZ/A 7.8a 61.7a 1 – Rating scale of 0 = brown, 7 = acceptable, 10 = dark green.2 - Means followed by same letter do not significantly differ (P=. 05 Duncan's New MRT)

Control of Poa Annua in a Stand of Kentucky Bluegrass
Dr. T. L. Watschke and J. A. BorgerDepartment of Agronomy
Introduction
This study was conducted on a mature mixed stand of Kentucky bluegrass (“Midnight”)and Poa annua at the Landscape Management Research Center, Penn State University, UniversityPark, PA. The objective of the study was to evaluate the control of Poa annua from a mixedstand of Kentucky bluegrass and Poa annua using PGRs.
Methods and Materials
This study was a randomized complete block design with three replications. All of thetreatments were applied on May 27, 1999 using a three foot CO2 powered boom sprayercalibrated to deliver 40 gpa using two, flat fan, 6504 nozzles at 40 psi. A sequential application ofPrimo was applied on June 18, 1999 and Proxy on July 8, 1999 using the afore mentionedapplication technique.
Results and Discussion
Phytotoxicity (color) ratings were made on eleven dates during the course of the study(Table 1). Only slight changes were observed in color, i.e. Proxy treated turf (highest) had lowercolor ratings than untreated turf on July 30, 1999. Primo treated turf had higher color ratings thanuntreated turf on June 18, July 14, July 22 and July 30, 1999.
With regard to changes in the percentage of Poa annua in the plots (Table 2), theuntreated turf had an increase in Poa annua from 33.3% on May 26, 1999 to 46.7% onSeptember 7, 1999. At the September rating date, no differences were found for treated versesuntreated turf in terms of Poa annua percentage. The only significant difference in Poa annuapercentage was found on July 30, 1999 when there was less Poa annua in Primo treated turf. Thepercentage of Poa annua for all treatments tended to decrease from May to July and increasefrom July to September.
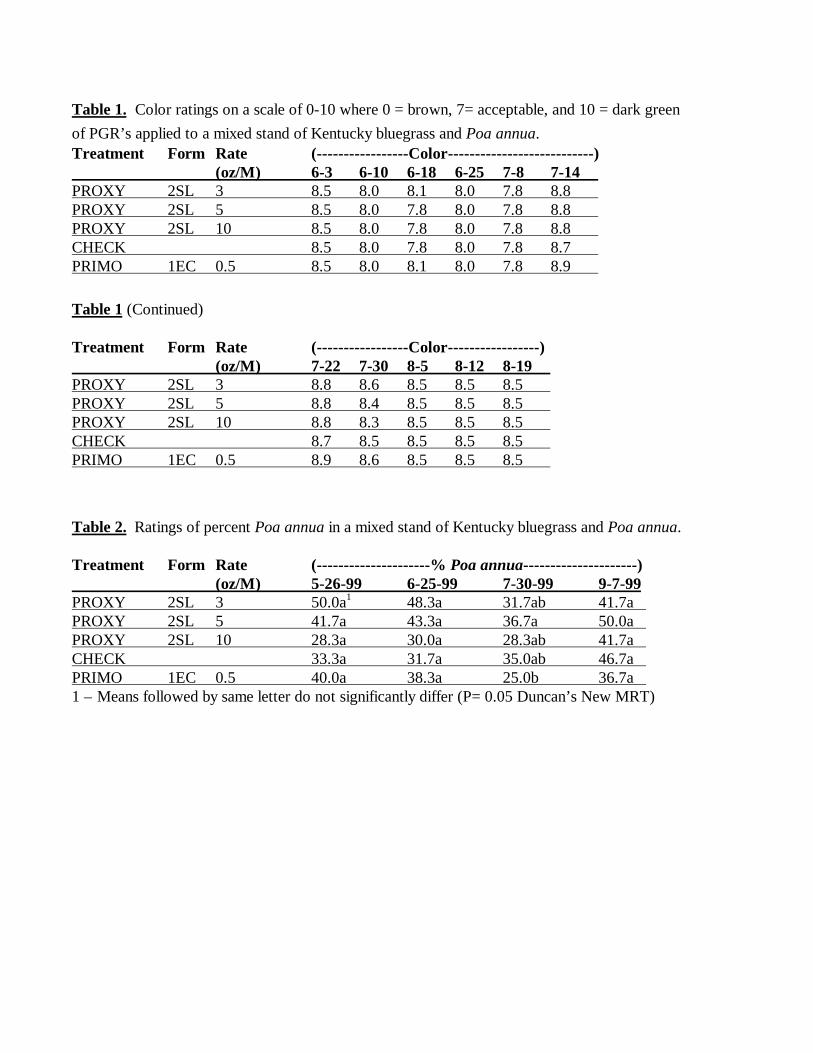
Table 1. Color ratings on a scale of 0-10 where 0 = brown, 7= acceptable, and 10 = dark greenof PGR’s applied to a mixed stand of Kentucky bluegrass and Poa annua.Treatment Form Rate (-----------------Color---------------------------) (oz/M) 6-3 6-10 6-18 6-25 7-8 7-14 PROXY 2SL 3 8.5 8.0 8.1 8.0 7.8 8.8 PROXY 2SL 5 8.5 8.0 7.8 8.0 7.8 8.8 PROXY 2SL 10 8.5 8.0 7.8 8.0 7.8 8.8 CHECK 8.5 8.0 7.8 8.0 7.8 8.7 PRIMO 1EC 0.5 8.5 8.0 8.1 8.0 7.8 8.9
Table 1 (Continued)
Treatment Form Rate (-----------------Color-----------------) (oz/M) 7-22 7-30 8-5 8-12 8-19 PROXY 2SL 3 8.8 8.6 8.5 8.5 8.5 PROXY 2SL 5 8.8 8.4 8.5 8.5 8.5 PROXY 2SL 10 8.8 8.3 8.5 8.5 8.5 CHECK 8.7 8.5 8.5 8.5 8.5 PRIMO 1EC 0.5 8.9 8.6 8.5 8.5 8.5
Table 2. Ratings of percent Poa annua in a mixed stand of Kentucky bluegrass and Poa annua.
Treatment Form Rate (---------------------% Poa annua---------------------) (oz/M) 5-26-99 6-25-99 7-30-99 9-7-99PROXY 2SL 3 50.0a1 48.3a 31.7ab 41.7a PROXY 2SL 5 41.7a 43.3a 36.7a 50.0a PROXY 2SL 10 28.3a 30.0a 28.3ab 41.7a CHECK 33.3a 31.7a 35.0ab 46.7a PRIMO 1EC 0.5 40.0a 38.3a 25.0b 36.7a 1 – Means followed by same letter do not significantly differ (P= 0.05 Duncan’s New MRT)

Poa annua Control Using Summer Applications of Prograss
Dr. T. L. Watschke and J.A. BorgerDepartment of Agronomy
Introduction
This study was conducted at the State College Elks Country Club, Boalsburg, PA on amature stand of Poa annua and perennial ryegrass (#13 fairway). The objective of this study wasto evaluate the control of Poa annua when Prograss was applied during the summer growingperiod.
Methods and Materials
The study was a randomized complete block design with 3 replications. Treatments wereapplied on June 8, 1998 and were reapplied every 21 days until September 18, 1998 using a three-foot hand held CO2 powered boom sprayer with two 6504 flat fan nozzles calibrated to deliver 40GPA at 30 psi.
As a reference, an area was treated using Prograss 1.5EC at a rate of 0.75 lb ai/A on Sept30, Oct 27 and Nov 19, 1998 using the afore mentioned equipment and application methods.
Results and Discussion
The lowest rate of Prograss tended to increase the amount of Poa annua from June 6,1998 until May 5, 1999. The 0.75 lb ai/A rate appeared to have no effect, while the high rate (1.0lb ai/A) tended to cause a slight decrease in the amount of Poa annua (Table 1). The fallapplication of 0.75 lb ai/A applied three times (September, October, and November) resulted in asubstantial reduction in Poa annua when compared to the lower rate, sequential seasonalapplications.
Table 1. Ratings for percent control of Poa annua in a mixed Poa annua and perennial ryegrass fairway. Ratings taken on June 6, 1998 and May 5, 1999.
Treatment Form Rate Timing % Control Lb ai/A Prograss 1.5EC 0.25 21DAT -21.00b1 Prograss 1.5EC 0.5 21DAT -5.56.00ab Prograss 1.5EC 0.75 21DAT 2.50ab Prograss 1.5EC 1.0 21DAT 22.87a Prograss 1.5EC 0.25 21DAT 17.78aPrimo 1EC 0 0.25 21DAT Check -5.05ab
Reference OnlyPrograss 1.5EC 0.75 Fall 79.30 1 Negative numbers represent an increase and positive numbers a decrease of Poa annua. Means followed by same letter do not significantly differ (P=. 05 Duncan’s New MRT)

Late Summer Poa Annua Pre-Emergence Application
Dr. T. L. Watschke and J. A. BorgerDepartment of Agronomy
Introduction
This study was conducted on a mature stand of Poa annua/creeping bentgrass (#6 green)at the Nittany Six Hole Golf Course, Penn State University, University Park, PA. The objective ofthe study was to determine the efficacy of preemergences applied in the late summer for control ofPoa annua the following growing season.
Methods and Materials
This study was a randomized block design with three replications. All of the treatmentswere applied on August 26, 1998 using a three foot CO2 powered boom sprayer calibrated todeliver 80 gpa using two, flat fan, 6504 nozzles at 40 psi.
Results and Discussion
Neither bensulide nor Dimension significantly reduced the amount of Poa annua in thetreated plots (Table). However, since the amount of Poa annua was very low (1%) it would bedifficult to attain significant differences. So far in this study there has been no change in thepercent of Poa annua regardless of treatment. As the study continues with a low populationinitially of Poa annua a good evaluation of these herbicides for encroachment should be made.
Table. Rating of percent cover of Poa annua in a Poa annua/creeping bentgrass putting green.Treatment Form Rate % Cover (LB Ai/A) 8-26-98 5-5-99 Bensulide 4L 12.5 1.0a1 1.0a Dimension 1EC 0.5 0.3a 0.3a Check 1.0a 1.0a 1Means followed by same letter do not significantly differ (P= 0.05 Duncan's New MRT)
Post-Emergence Control of Broadleaf Weeds
Dr. T. L. Watschke and J. A. BorgerDepartment of Agronomy
Introduction
This study was conducted on a mature stand of perennial ryegrass (Lolium perenne L.) atthe Landscape Management Research Center, University Park, PA. The objective of the studywas to determine the efficacy of broadleaf weed herbicides when applied in early and late summerfor control of dandelion, common plantain, and white clover.
Methods and Materials
This study was a randomized complete block design with three replications. All of thetreatments were applied on June 7 and August 31, 1999 using a three foot CO2 powered boomsprayer calibrated to deliver 40 gpa using two, flat fan, 6504 nozzles at 40 psi. Control of theweeds was rated on August 9 and Oct 6, 1999.
Results and Discussion
Applications of the commercial standards Momentum, Trimec Classic, Confront, andWeed-B-Gone resulted in very good to excellent control of white clover and common plantainhowever, all of the standards had relatively poor control of dandelion when rated on Aug 9 (Table1). Observation of the dandelions 4 to 6-weeks after application revealed apparent good control.However, by the eight-week rating date, many of the dandelions had resprouted from the taproot.All of the treatments had some level of control of common plantain and white clover, but all hadlimited control of dandelion. Of the series, NB20334 appeared to have best range of controlacross the three weed species but still not acceptable on dandelion. The addition of Acclaim Extrato Confront did not appear to antagonize efficacy as Acclaim or Preclaim. Drive providedexcellent control of white clover by itself. Combining Drive with Momentum (L0338) improvedcommon plantain control slightly. Tank mixing Drive and Momentum resulted in improveddandelion control compared to Momentum alone, but the control of white clover was decreased.All treatments were reapplied on Aug 31 and a second rating for control was made on Oct 6(Table 2). All treatments provided acceptable dandelion control except NB30405, and thecombination of Preclaim and Confront. All treatments provided acceptable plantain control exceptL-0337 (Drive G) Drive. Only NB30405 failed to provide acceptable control of white clover.

Table 1. Rating of percent control of three broadleaf weeds taken on Aug. 9, 1999, eight weeksafter treatment.Treatment Form Rate (---------------% Control-------------) (lbs ai/A) Dand1 Plant CloverL-0337 (DRIVE) 0.43G 4 LB/M 40.0a-d2 8.3de 100.0a L-0338 (DRIVE/MOMEN) 0.43G 4 LB/M 41.1a-d 37.8cd 100.0a DRIVE 75DF 0.75 75.6ab 11.1de 97.8aMSO 1 % V/V DRIVE 75DF 0.75 87.8a 93.3a 66.7aMSO 1% V/VMOMENTUM 3.06L 1.5 OZ/M CHECK 0.0d 0.0e 0.0b NB20332 L 4 PT/A 41.7a-d 82.3ab 100.0a NB30401 L 4 PT/A 8.3d 84.0a 88.9a NB30402 L 4 PT/A 35.6a-d 75.6ab 65.6a NB30403 L 4 PT/A 11.1cd 46.7bc 25.0b NB20334 L 4 PT/A 22.2bcd 88.3a 86.7a NB30405 L 4 PT/A 1.1cd 75.6ab 0.0b TRIMEC CLASSIC L 4 PT/A 32.2a-d 85.0a 100.0a CONFRONT 3SL 0.75 41.1a-d 85.6a 100.0a MOMENTUM 3.06L 3.2 PT/A 47.2a-d 80.0ab 100.0a MOMENTUM 3.06L 4 PT/A 34.4a-d 77.8ab 100.0a WEED-B-GONE 1.06L 13.6 PT/A 57.8a-d 93.3a 100.0a ACCLAIM EXTRA 0.57EW 0.12 33.3a-d 73.3ab 100.0aCONFRONT 3SL 0.375 PRECLAIM 3.09EC 2.06 67.8abc 27.8cde 100.0aCONFRONT 3SL 0.375 1 - Dand = dandelion, Plant = broadleaf plantain, Clover = white clover.2 - Means followed by same letter do not significantly differ (P=.05 Duncan's New MRT)

Table 2. Rating of percent control of three broadleaf weeds taken on Oct 6, 1999.Treatment Form Rate (---------------% Control-------------) (lb ai/A) Dand1 Plant CloverL-0337 (DRIVE) 0.43G 4 LB/M 96.7a2 33.3d 100.0a L-0338 (DRIVE/MOMEN) 0.43G 4 LB/M 100.0a 80.0ab 100.0a DRIVE 75DF 0.75 100.0a 65.6bc 100.0aMSO 1 % V/V DRIVE 75DF 0.75 100.0a 100.0a 100.0aMSO 1% V/VMOMENTUM 3.06L 1.5 OZ/M CHECK 0.0c 0.0e 0.0d NB20332 L 4 PT/A 93.3a 100.0a 100.0a NB30401 L 4 PT/A 93.3a 100.0a 100.0a NB30402 L 4 PT/A 88.7a 100.0a 100.0a NB30403 L 4 PT/A 83.3a 100.0a 100.0a NB20334 L 4 PT/A 97.8a 100.0a 100.0a NB30405 L 4 PT/A 64.4ab 100.0a 55.6b TRIMEC CLASSIC L 4 PT/A 93.3a 100.0a 100.0a CONFRONT 3SL 0.75 100.0a 100.0a 100.0a MOMENTUM 3.06L 3.2 PT/A 100.0a 100.0a 100.0a MOMENTUM 3.06L 4 PT/A 97.8a 100.0a 100.0a WEED-B-GONE 1.06L 13.6 PT/A 97.8a 100.0a 100.0a ACCLAIM EXTRA 0.57EW 0.12 65.3ab 97.8a 100.0aCONFRONT 3SL 0.375 PRECLAIM 3.09EC 2.06 100.0a 100.0a 100.0aCONFRONT 3SL 0.375 1 - Dand = dandelion, Plant = broadleaf plantain, Clover = white clover.2 - Means followed by same letter do not significantly differ (P=.05 Duncan's New MRT)

Pre-Emergence Crabgrass Control Study
Dr. T. L. Watschke and J. A. BorgerDepartment of Agronomy
Introduction
This study was conducted on a mature stand of perennial ryegrass at the LandscapeManagement Research Center, Penn State University, University Park, PA. The objective of thestudy was to evaluate the efficacy of herbicides for the preemergence control of smoothcrabgrass.
Methods and Materials
This study was a randomized complete block design with three replications. All of thetreatments were applied on April 28, 1999 using a three foot CO2 powered boom sprayercalibrated to deliver 80 gpa using two, flat fan, 6504 nozzles at 40 psi. Granular treatments wereapplied with a shaker jar. After application the entire test site received approximately 0.5 inch ofwater.
Crabgrass germination was first noted in the test site on May 12, 1999. Non treatedchecks were rated to have a minimum of 80 percent crabgrass infestation in all replications.
Results and Discussion
Most of the herbicides used in this study provided commercially acceptable control (atleast 85%). Those providing the best control (at least 95%) were the following; prodiamine65WDG at 0.5 and 0.65 lbs ai/A, dithiopyr 1EC at 0.38, dithiopyr 40WP at 0.25 and 0.38 lbsai/A, dithiopyr FG AND445 0.164G at 0.38 lbs ai/A, and XF99007 2.32SC at 0.25 and 0.38 lbsai/A (Table 1). Those providing from 90 to 95% control included; prodiamine 65WDG at 0.38 lbsai/A, AND672-99 at 3.6 lbs product/M, XF99006 2.32SC at 0.25 and 0.38 lbs ai/A,pendimethalin 60WG at 1.5 lbs ai/A, Team Pro, 0.86G at 2 lbs ai/A, and dithiopyr FG AND4450.164G. Those materials that did not provide acceptable control were; 011399B, 011399C,012799E, 012799F, prodiamine at 0.25 lbs ai/A, AND669-99 at 3.6 lbs product/M, AND670-99at 3.6 lbs product/M, dithiopyr (Crabex) 0.14G at 0.125 lbs ai/A, pendimethalin (Scotts) 0.86G at1.5 lbs ai/A oxadiazon 2G at 2.0 lbs ai/A and Team 0.87G at 2.0 lbs ai/A.

Table1. Percent control of smooth crabgrass rated on Aug 23, 1999 where 85% and above was considered acceptable.
Treatment Form Rate (LB Ai/A) % Control 011399B G 3.2 LB/M 68 011399C G 3.0 LB/M 80 012799E G 3.4 LB/M 68 012799F G 3.5 LB/M 75 PRODIAMINE 65WDG 0.25 77 PRODIAMINE 65WDG 0.38 91 PRODIAMINE 65WDG 0.5 97 PRODIAMINE 65WDG 0.65 98 DIMENSION SCOTTS 0.17G 0.5 89 AND669-99 G 3.6 LB/M 78 AND670-99 G 3.6 LB/M 82 AND671-99 G 3.6 LB/M 88 AND672-99 G 3.6 LB/M 90 CHECK LMRC FERT 0 DIMENSION CRABEX 0.14G 0.125 72 DIMENSION CRABEX 0.14G 0.25 86 FERT CHECK 28-3-10 G 3.6 LB/M 0 CHECK NO FERT 0 DIMENSION 1EC 0.25 90 DIMENSION 1EC 0.38 96 DIMENSION 40WP 0.25 96 DIMENSION 40WP 0.38 98 DIMENSION FG AD445 0.164G 0.25 93 DIMENSION FG AD445 0.164G 0.38 97 PENDIMETHALIN SCOTTS 0.86G 1.5 78 XF99006 2.32SC 0.25 91 XF99006 2.32SC 0.38 94 XF99007 2.32SC 0.25 96 XF99007 2.32SC 0.38 96 CHECK LMRC FERT 0 PENDIMETHALIN 60WG 1.5 93 RONSTAR 2G 3 72 BENSULIDE 4EC 10 89 TEAM 0.87G 2 80 TEAM PRO 0.86G 2 91

Post-Emergence Control of Crabgrass at the Two to Three Leaf Growth Stage
Dr. T. L. Watschke and J. A. BorgerDepartment of Agronomy
Introduction
This study was conducted on a mature stand of perennial ryegrass at the LandscapeManagement Research Center, Penn State University, University Park, PA. The objective of thestudy was to evaluate the efficacy of pre/post emergence herbicides for the postemergence controlof smooth crabgrass.
Methods and Materials
This study was a randomized complete block design with three replications. All of thetreatments were applied on June 18, 1999 using a three foot CO2 powered boom sprayercalibrated to deliver 40 gpa using two, flat fan, 6504 nozzles at 40 psi. Granular treatments wereapplied with a shaker jar.
Results and Discussion
Commercially acceptable (85%) postemergence control of smooth crabgrass was attainedby applications of the following herbicides; Drive 75DF at 0.75 lbs ai/A with 1%v/v MSO, Drive75DF at 0.75 lbs ai/A plus 0.375 lbs ai/A of Dimension and MSO at 1% v/v, Drive 75DF at 0.75lbs ai/A plus 1.5 lbs ai/A of pendimethlin and MSO at 1%v/v, and Acclaim Extra 0.57EW at 0.09lbs ai/A plus Dimension 40WP at 0.5 lbs ai/A (Table.). All treatments containing granular Drive,Preclaim 3.09EC at 2.06 lbs ai/A, Dimension 40WP at 0.5 and 0.25 lbs ai/A and Puma 1EC at0.12 lbs ai/A did not provide a commercially acceptable level of control.
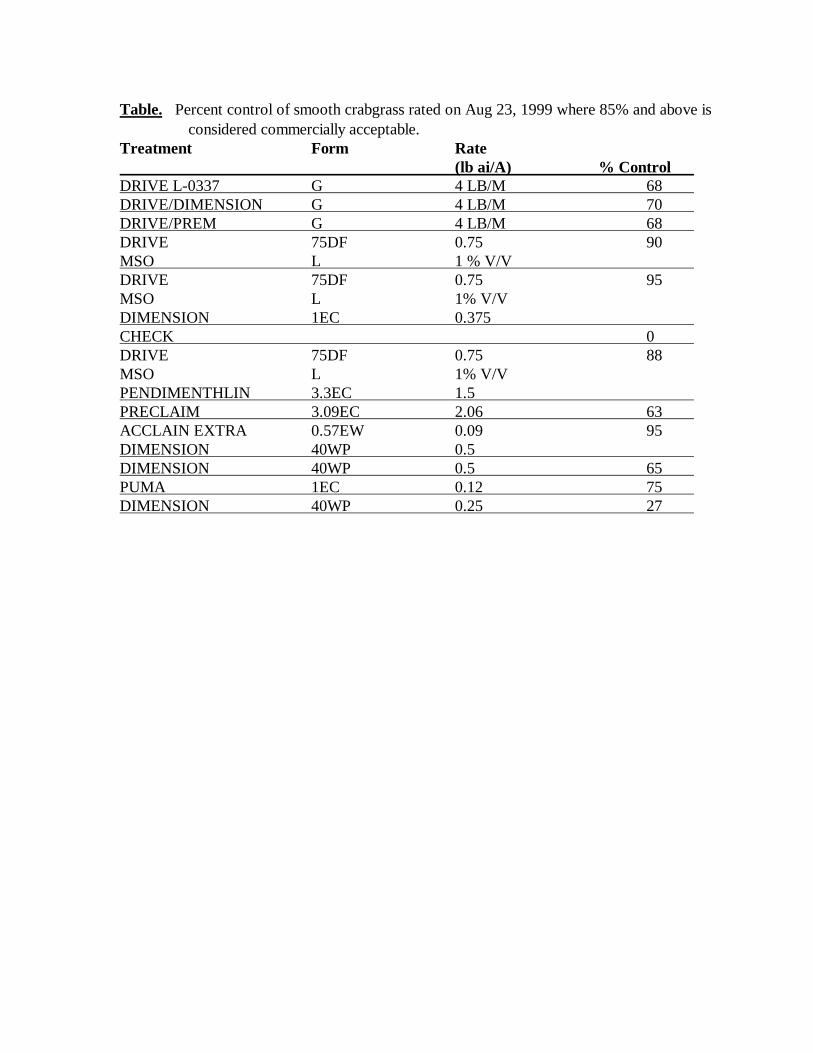
Table. Percent control of smooth crabgrass rated on Aug 23, 1999 where 85% and above is considered commercially acceptable.
Treatment Form Rate (lb ai/A) % Control DRIVE L-0337 G 4 LB/M 68 DRIVE/DIMENSION G 4 LB/M 70 DRIVE/PREM G 4 LB/M 68 DRIVE 75DF 0.75 90MSO L 1 % V/V DRIVE 75DF 0.75 95MSO L 1% V/VDIMENSION 1EC 0.375 CHECK 0 DRIVE 75DF 0.75 88MSO L 1% V/VPENDIMENTHLIN 3.3EC 1.5 PRECLAIM 3.09EC 2.06 63 ACCLAIN EXTRA 0.57EW 0.09 95DIMENSION 40WP 0.5 DIMENSION 40WP 0.5 65 PUMA 1EC 0.12 75 DIMENSION 40WP 0.25 27

Post Emergence Control of Crabgrass at the Two to Three Tiller GrowthStage
Dr. T. L. Watschke and J. A. Borger1
Introduction
This study was conducted on a mature stand of perennial ryegrass at the LandscapeManagement Research Center, Penn State University, University Park, Pa. The objective of thestudy was to evaluate the efficacy of herbicides for the post emergence control of smoothcrabgrass.
Methods and Materials
This study was a randomized complete block design with three replications. All of thetreatments were applied on July 19, 1999 using a three foot CO2 powered boom sprayercalibrated to deliver 40 gpa using two, flat fan, 6504 nozzles at 40 psi.
Results and Discussion
Commercially acceptable postemergence control of smooth crabgrass was attained by theapplication of Acclaim Extra 0.57EW at 0.12 lbs ai/A, Puma 1EC at 0.12 lbs ai/A, Acclaim Extra0.57EW at 0.12 lbs ai/A plus Confront 3SL at 0.375 lbs ai/A, and Preclaim 3.09EC at 2.06 lbsai/A plus Confront 3SL at 0.375 lbs ai/A. All other treatments did not provide commerciallyacceptable control.
1 Professor and Research Assistant, respectively, Department of Agronomy, Penn StateUniversity, University Park, PA, 16802

Table1. Percent control of smooth crabgrass rated on Aug 23, 1999 where 85% and above is considered commercially acceptable.Treatment Form Rate (lbs ai/A) % Control ACCLAIM EXTRA 0.57EW 0.12 87 PRECLAIM 3.09EC 2.06 82 PUMA 1EC 0.12 88 CHECK 0 DRIVE 75DF 0.75 75MSO L 1 % V/V DIMENSION 40WP 0.5 63 DRIVE 0.43G 4 LB/M 42 ACCLAIM EXTRA 0.57EW 0.12 93CONFRONT 3SL 0.375 PRECLAIM 3.09EC 2.06 85CONFRONT 3SL 0.375

Pre-Stress Conditioning of Perennial Ryegrass with PGRs
Dr. T. L. Watschke and J. A. BorgerDepartment of Agronomy
Introduction
This study was conducted on a mature stand of perennial ryegrass at the LandscapeManagement Research Center, Penn State University, University Park, PA. The objective of thestudy was to evaluate Proxy and Primo for pre-stress conditioning of the turfgrass.
Methods and Materials
This study was a randomized complete block design with three replications. All of thetreatments were applied on July 6, 1999 using a three foot CO2 powered boom sprayer calibratedto deliver 40 gpa using two, flat fan, 6504 nozzles at 40 psi. The test site was only irrigated toprevent turfgrass dormancy.
Results and Discussion
Color was rated six times following the application of the treatments as a means ofassessing stress tolerance (Table 1). There were no significant differences found among thetreatments on any rating date. Some trends were found to the extent that some generalizations canbe made. The highest rate of Proxy (10 oz/M) tended to reduce color until the August third ratingdate. The two lower rates tended to cause the same effect but caused slightly better color byAugust third. Adding MacroSorb Foliar to the lowest Proxy rate tended to improve color on thelast four rating dates.
The MEC formulation of Primo tended to cause a slightly better color response than theEC formulation (more consistently at the 0.5 oz/M rate). Adding MacroSorb Foliar to Primotreatments did appear to result in color trends. It also appeared that turf treated at the low ratehad a similar color response to that treated at the high rate.
On August 17, fresh clipping weights were taken (Table 2). Although Proxy treated turfdid not yield significantly different from the check, the yields were significantly lower than thosefrom turf treated with Primo MEC at 0.25 oz/M. By adding MacroSorb Foliar to the 0.25 oz/Mrate of Primo MEC, this growth difference was no longer significant.

Table 1. Color ratings taken on six dates in 1999.
Treatment Form Rate(oz/M) (-----------------Color--------------------------)
7-13 7-20 7-27 8-3 8-10 8-17 PROXY 2SL 3 8.31 8.5 8.7 8.2 8.8 8.7 PROXY 2SL 5 8.0 8.3 8.8 8.2 8.8 8.7 PROXY 2SL 10 8.0 8.0 8.6 7.9 8.8 8.7 CHECK 8.5 8.7 8.9 7.9 8.8 8.6 PRIMO 1EC 0.5 8.5 8.7 9.0 8.1 8.8 8.8 PRIMO 1MEC 0.5 8.5 8.8 8.9 8.5 8.8 8.8 PROXY 2SL 3 8.0 8.2 8.8 8.5 8.8 8.8MACROSORB FOLIAR L 2 PRIMO 1MEC 0.25 8.5 8.8 9.1 8.3 8.8 8.7 PRIMO 1MEC 0.25 8.5 8.7 9.0 8.1 8.8 8.7MACROSORB FOLIAR L 2 PRIMO 1EC 0.25 8.5 8.5 9.1 8.5 8.8 8.8 PRIMO 1EC 0.25 8.5 8.8 9.0 8.3 8.8 8.8MACROSORB FOLIAR L 2 1 – Color ratings where 0 = brown, 7 = acceptable, and 10 = dark green.
Table 2.. Fresh clipping weights (grams) taken Aug 17, 1999.
Treatment Form Rate Weight (oz/M) PROXY 2SL 3 14.3b1 PROXY 2SL 5 12.7b PROXY 2SL 10 13.0b CHECK 17.0ab PRIMO 1EC 0.5 21.7ab PRIMO 1MEC 0.5 17.7ab PROXY 2SL 3 17.7abMACROSORB FOLIAR L 2 PRIMO 1MEC 0.25 23.7a PRIMO 1MEC 0.25 21.3abMACROSORB FOLIAR L 2 PRIMO 1EC 0.25 17.7ab PRIMO 1EC 0.25 17.0abMACROSORB FOLIAR L 2 1 Means followed by same letter do not significantly differ (P= 0.05 Duncan's New MRT)

Evaluation of a New Plant Growth Regulator on Creeping Bentgrass
Dr. T. L. Watschke and J. A. BorgerDepartment of Agronomy
Introduction
This study was conducted on a mature stand of “Penncross” creeping bentgrass at theLandscape Management Research Center, Penn State University, University Park, PA. Theobjective of the study was to determine the efficacy and phytotoxicity of an experimental plantgrowth regulator (EXP310309D).
Methods and Materials
This study was a randomized complete block design with three replications. All of thetreatments were applied on June 15 and again on July 13, 1999 using a three foot CO2 poweredboom sprayer calibrated to deliver 40 gpa using two, flat fan, 6504 nozzles at 40 psi. The test sitewas maintained similar to that of a golf course fairway with respect to irrigation, fertilization andmowing.
Results and Discussion
Color was rated eight times during the course of the experiment (Table 1). No significantdifferences in color were observed for treated turf.
Height was measured eight times during the course of the experiment (Table 2). On theJune 28, July 7, July 12 and July 19 dates there was a slight trend for treated turf to be shorterthan non treated, but the differences were not significant.
Fresh clipping weights were harvested seven times during the course of the experiment(Table 3). No significant differences in clipping weights were found in any of the harvest dates.

Table 1. Color ratings on a scale of 0-10 where 0 = brown, 7= acceptable, and 10 = dark green ofPGR’s applied to “Penncross” creeping bentgrass.Treatment Form Rate Oz/M 6-21 6-28 7-7 7-12 7-19 7-26 8-2 8-9 EXP310309D 4SL 2.5 8.0 8.2 8.4 8.5 8.7 8.5 8.7 8.5 EXP310309D 4SL 5 8.0 8.5 8.8 8.5 8.5 8.5 8.8 8.5 CHECK 8.0 8.7 8.6 8.5 9.0 9.0 9.0 8.7 PROXY 2SL 5 8.0 8.6 8.7 8.5 8.8 8.7 8.8 8.6
Table 2. Height ratings (in inches) of PGR’s applied to “Penncross” creeping bentgrass.Treatment Form Rate Oz/M 6-21 6-28 7-7 7-12 7-19 7-26 8-2 8-9 EXP310309D 4SL 2.5 0.49a1 0.40a 0.49a 0.37a 0.43a 0.43a 0.42a 0.39a EXP310309D 4SL 5 0.52a 0.39a 0.50a 0.41a 0.45a 0.42a 0.44a 0.42a CHECK 0.50a 0.46a 0.50a 0.41a 0.46a 0.41a 0.40a 0.38a PROXY 2SL 5 0.53a 0.38a 0.48a 0.38a 0.43a 0.43a 0.39a 0.40a 1 - Means followed by same letter do not significantly differ (P= 0.05 Duncan's New MRT)
Table 3. Fresh weight ratings (in grams) of PGR’s applied to “Penncross” creeping bentgrass.Treatment Form Rate Oz/M 6-21 7-7 7-12 7-19 7-26 8-2 8-9 EXP310309D 4SL 2.5 35.7a1 0.45a 29.3a 27.0a 30.7a 29.3a 26.3a EXP310309D 4SL 5 44.0a 46.3a 33.0a 26.0a 29.0a 29.3a 27.0a CHECK 38.7a 45.3a 33.0a 27.0a 31.7a 28.7a 27.3a PROXY 2SL 5 43.7a 37.3a 28.0a 27.3a 29.3a 27.3a 25.3a 1 - Means followed by same letter do not significantly differ (P= 0.05 Duncan's New MRT)

Re-Rooting of Four Varieties of Creeping Bentgrass After Applications ofBensulide and Dithiopyr
Dr. T. L. Watschke and J. A. BorgerDepartment of Agronomy
Introduction
This study was conducted at Penn State University, University Park, PA in thegreenhouse at the Agricultural Sciences and Industries Building to evaluate the re-rooting of‘Penncross’, ‘Seaside’, ‘Penneagle’ and ‘Pennlinks’ creeping bentgrasses. Applications ofbensulide and dithiopyr were applied to the bentgrasses for two growing seasons. Samples weretaken the spring following the two years of applications for the assessment of re-rooting.
Methods and Materials
This experiment was a completely random design with nine replications. On Feb. 27,1999, two-inch diameter plugs were collected from the plots in the field that received theherbicide applications. The soil was removed to a depth of 0.5 inch. The plugs were then plantedin a sand medium in four-inch pots in a greenhouse.
Bensulide and dithiopyr were applied during two of the three previous growing seasons.All treatments were applied on May 3, 1996 and, with exception of dithiopyr again on May 30,and Aug 26, in 1996. In 1998, all treatments were applied on April 16 and with exception ofdithiopyr again on May 20, and Aug 19. All applications were applied using a three-foot handheld CO2 powered boom sprayer with two 6504 flat fan nozzles calibrated to deliver 80 GPA at30 psi. After each application the test site received approximately 0.5 inch of water.
Results and Discussion
Color (phytotoxicity) was rated on five consecutive days in March after the plugs wereplaced in the greenhouse (Table 1). No differences were found in color regardless of treatmentduring the five day ‘green-up’ phase of the experiment. On March 18, topgrowth was harvestedand fresh weights of clippings was recorded (Table 2). No significant differences or trends werefound among the treatments. On March 23, roots were harvested, dried, and weighed as a meansof assessing re-rooting. No significant differences in re-rooting were found for Penncross,Seaside or Pennlinks varieties. However, Penneagle that had been treated in 1996 and 1998 at thehigh rate (40, 30, and 30 pts/A) had significantly reduced re-rooting compared to untreatedPenneagle. Dithiopyr was not found to cause any significant decrease in re-rooting on any of thevarieties when applied at the label rate (0.5 lbs ai/A) with a spring (April) application.

Table 1. Phytotoxicity ratings taken in 1999 on a scale of 1-10 where 1 = brown, 7 = acceptableand 10 = dark green.Treatment Form Rate Timing (pt/a ) 3-2 3-3 3-4 3-5 3-6
Penncross creeping bentgrassBETASAN 4L 20 April 8.6a1 9.1a 9.3a 9.2a 9.2aBETASAN 4L 15 MayBETASAN 4L 15 Aug BETASAN 4L 40 April 8.4a 9.1a 9.2a 9.1ab 9.1aBETASAN 4L 30 MayBETASAN 4L 30 Aug DIMENSION 1EC 0.5 lb ai/A April 8.5a 9.1a 8.9ab 8.9ab 8.9a CHECK 8.4a 8.9a 9.1a 9.0ab 8.9a
Seaside creeping bentgrassBETASAN 4L 20 April 8.5a 9.0a 9.1a 9.0ab 9.0aBETASAN 4L 15 MayBETASAN 4L 15 Aug BETASAN 4L 40 April 8.6a 9.0a 9.2a 8.9ab 8.9aBETASAN 4L 30 MayBETASAN 4L 30 Aug DIMENSION 1EC 0.5 lb ai/A April 8.2a 8.8a 9.1a 8.9ab 8.8a CHECK 8.5a 9.1a 9.1a 8.9ab 9.0a
Penneagle creeping bentgrassBETASAN 4L 20 April 8.5a 8.8a 9.0a 8.8ab 8.9aBETASAN 4L 15 MayBETASAN 4L 15 Aug BETASAN 4L 40 April 8.5a 9.0a 9.1a 8.9ab 9.0aBETASAN 4L 30 MayBETASAN 4L 30 Aug DIMENSION 1EC 0.5 lb ai/A April 8.6a 8.9a 9.2a 8.8ab 9.1a CHECK 8.4a 8.7a 8.9ab 8.8ab 9.0a
Pennlinks creeping bentgrassBETASAN 4L 20 April 8.6a 9.1a 9.2a 9.0ab 9.1aBETASAN 4L 15 MayBETASAN 4L 15 Aug BETASAN 4L 40 April 8.6a 9.0a 9.1a 9.0ab 9.0aBETASAN 4L 30 MayBETASAN 4L 30 Aug DIMENSION 1EC 0.5 lb ai/A April 8.5a 8.8a 9.1a 8.7b 9.0a CHECK 8.7a 9.0a 9.2a 9.1ab 9.0a 1Means followed by the same letter do not significantly differ (P = 0.05, Duncan’s New MRT).

Table 2. Top growth weights (fresh) and root weights (dry) in grams.Treatment Form Rate Timing Top growth Root (pt/a ) 3-18 3-23
Penncross creeping bentgrassBETASAN 4L 20 April 2.94a1 0.21abBETASAN 4L 15 MayBETASAN 4L 15 Aug BETASAN 4L 40 April 2.64a 0.17abBETASAN 4L 30 MayBETASAN 4L 30 Aug DIMENSION 1EC 0.5 lb ai/A April 2.32a 0.15ab CHECK 2.65a 0.23ab
Seaside creeping bentgrassBETASAN 4L 20 April 2.59a 0.19abBETASAN 4L 15 MayBETASAN 4L 15 Aug BETASAN 4L 40 April 2.58a 0.19abBETASAN 4L 30 MayBETASAN 4L 30 Aug DIMENSION 1EC 0.5 lb ai/A April 2.59a 0.21ab CHECK 2.36a 0.17ab
Penneagle creeping bentgrassBETASAN 4L 20 April 2.55a 0.23abBETASAN 4L 15 MayBETASAN 4L 15 Aug BETASAN 4L 40 April 2.55a 0.14bBETASAN 4L 30 MayBETASAN 4L 30 Aug DIMENSION 1EC 0.5 lb ai/A April 2.72a 0.25ab CHECK 2.45a 0.25a
Pennlinks creeping bentgrassBETASAN 4L 20 April 2.58a 0.17abBETASAN 4L 15 MayBETASAN 4L 15 Aug BETASAN 4L 40 April 2.67a 0.19abBETASAN 4L 30 MayBETASAN 4L 30 Aug DIMENSION 1EC 0.5 lb ai/A April 2.55a 0.21ab CHECK 2.47a 0.24ab 1Means followed by the same letter do not significantly differ (P = 0.05, Duncan’s New MRT).

Phytotoxicity Screening of Dimension and Different Rates of Bensulide onFour Cultivars of Creeping Bentgrass
Dr. T.L. Watschke and J. A. BorgerDepartment of Agronomy
Methods and Materials
This study was conducted at the Valentine Turfgrass Research Center University Park, PAon four mature bentgrass cultivars; ‘ Penncross’, ‘Seaside’, ‘Penneagle’ and ‘Pennlinks’.
The experiment was a split block design with two factors (herbicides and varieties). Theturf cultivars were replicated three times. The herbicides (four treatments) were applied across theblocks of varieties. All treatments were applied on April 16, 1998 and, with the exception ofDimension again on May 20, and Aug 19, 1998 using a three-foot hand held CO2 powered boomsprayer with two 6504 flat fan nozzles calibrated to deliver 80 GPA at 30 psi. After eachapplication the test site received approximately 0.5 inch of irrigation.
The turf was maintained at 1/2 inch every other day using a triplex reel mower with theclippings removed. The turf received irrigation when needed.
Results and Conclusions
The various rate and application schemes of bensulide applied to four creeping bentgrassvarieties in 1998 resulted in the same phytotoxicity responses that were found in 1997 (nophytotoxicity on any rating date). Ratings for phytotoxicity were initiated in April and lastedthrough August. Monthly ratings in the fall of 1998 are not included as no phytotoxicity wasobserved. Dimension was included as a chemical treatment as creeping bentgrass has a knowntolerance to this herbicide. No phytotoxicity was observed from applications of Dimension on anyof the creeping bentgrass varieties.
Phytotoxicity rated in the spring of 1999 (Table), revealed that none was present.

Table. Phytotoxicity ratings taken in 1999 on a scale of 1-10 where 1 = brown, 7 = acceptableand 10 = dark green.Treatment Form Rate Timing (pt/a ) 5-5-99
Penncross creeping bentgrassBETASAN 4L 20 April 8.0a1
BETASAN 4L 15 MayBETASAN 4L 15 Aug BETASAN 4L 40 April 8.0aBETASAN 4L 30 MayBETASAN 4L 30 Aug DIMENSION 1EC .5lbai/a April 8.0a CHECK 8.0a
Seaside creeping bentgrassBETASAN 4L 20 April 8.0aBETASAN 4L 15 MayBETASAN 4L 15 Aug BETASAN 4L 40 April 8.0aBETASAN 4L 30 MayBETASAN 4L 30 Aug DIMENSION 1EC .5lbai/a April 8.0a CHECK 8.0a
Penneagle creeping bentgrassBETASAN 4L 20 April 8.0aBETASAN 4L 15 MayBETASAN 4L 15 Aug BETASAN 4L 40 April 8.0aBETASAN 4L 30 MayBETASAN 4L 30 Aug DIMENSION 1EC .5lbai/a April 8.0a CHECK 8.0a
Pennlinks creeping bentgrassBETASAN 4L 20 April 8.0aBETASAN 4L 15 MayBETASAN 4L 15 Aug BETASAN 4L 40 April 8.0aBETASAN 4L 30 MayBETASAN 4L 30 Aug DIMENSION 1EC .5lbai/a April 8.0a CHECK 9.0a 1Means followed by the same letter do not significantly differ (P = 0.05, Duncan’s New MRT).

Web-Accessible Learning Resource Development
A. J. TurgeonDepartment of Agronomy
1. Development and evaluation of student-specific courseware for the web.
In cooperation with Heather Shoener, web-accessible learning resources have beendesigned with “loops” by which information can be added to linear modules for a variety ofpurposes, including elaboration, clarification, and preparation. An “elaboration” loop simplyadds a series of units (graphics, narrative text, and navigation icons) launched from one of theunits in the linear series that provide more detailed coverage of a particular subject. Forexample, the unit on moisture in the climatology module briefly covers the role of moisture inturfgrass growth and quality, but the moisture loop provides detailed information ontranspirational cooling, dew formation, and desiccation (see example at:http://www.cas.psu.edu/docs/casdept/turf/Education/shoener/235Lesson05/Climatology/IVA_text20.html). A “clarification” loop attempts to clarify concepts that some students may havedifficulty grasping by breaking the concept down into its component parts, explaining eachpart and the important relationships between parts, and assembling the parts into the wholeconcept. A “preparation” loop covers prerequisite knowledge that may be needed to fullyunderstand a particular subject. For example, to understand some aspects of nitrogenfertilization, it may be helpful to understand relevant aspects of plant physiology,biochemistry, and organic chemistry. These aspects can be covered in primary, secondary,and tertiary loops, respectively.
Questions can be used to assess each student’s understanding of the material prior to eachsection of an instructional module. If the student is able to correctly answer the questions, heor she is given the option to by-pass the section immediately following the questions andproceed to the next section (an example can be viewed at: http://www.cas.psu.edu/docs/casdept/turf/Education/shoener/235Lesson05/Climatology/Lightprequiz.html).
2. Development and evaluation of solution strategies in case-based learning on the web.
Decision cases are valuable for simulating real-world problematic situations anddeveloping analytical and problem-solving skills. In cooperation with USGA Green Sectionagronomists, Susan Coleric, David Jonassen, and I are developing a database of “historical”cases as an instructional resource providing students with examples of successful problem-solving as they attempt to develop solution strategies in dealing with the simulatedproblematic situations presented in our “decision” cases. Currently, we have accumulatedapproximately 40 historical cases and are attempting to expand the database to severalhundred covering a broad array of problems encountered in golf turf operations. Theagronomists pointed out that the case database has utility as a reference resource for those

attempting to deal with real problematic situations as well. The case database can be viewedat: http://ide.ed.psu.edu/users/ike/scripts/case-based/turf.idc
3. Courseware development and use for the Penn State World Campus.
Five courses have been completed for use on the World Campus; these are: TurfgrassPesticides (TURF 230) by Tom Watschke, The Turfgrasses (TURF 235) by Al Turgeon,Turfgrass Pest Management (TURF 236) by Paul Heller and Wakar Uddin, TurfgrassEdaphology (TURF 334) by Andy McNitt, and Case Studies in Turfgrass Management(TURF 436W) by Al Turgeon. Currently under development are:, Weed Control in Turf andOrnamentals (TURF 238) by Tom Watschke and Larry Kuhns, and Turfgrass CulturalSystems (TURF 337) by Tom Watschke. TURF 230, 235, 236, 334, and 436 are currentlybeing taught.

This publication is available in alternative media on request.
The Pennsylvania State University is committed to the policy that all persons shall haveequal access to programs, facilities, admission, and employment without regard to personalcharacteristics not related to ability, performance, or qualifications as determined by Universitypolicy or by state or federal authorities. The Pennsylvania State University does not discriminateagainst any person because of age, ancestry, color, disability or handicap, national origin, race,religious creed, sex, sexual orientation, or veteran status. Direct all inquiries regarding thenondiscrimination policy to the Affirmative Action Director, The Pennsylvania State University,201 Willard Building, University Park PA 16802-2801; Tel. (814) 865-4700/V; (814) 863-1150/TTY.
Front Cover
Inset photo: Sunrise over the bentgrass plots at the Joseph Valentine Turfgrass ResearchCenter with Beaver Stadium, The Bryce Jordan Center, and Mount Nittany in the background.
Main photo: Flats of individual strains of Annual bluegrass being propagated for use inPenn State’s turfgrass breeding program.
Back cover
Clockwise from top left: 1). Students enrolled in the two year Turfgrass ManagementProgram gain hands-on experience in irrigation installation. 2). DNA fingerprints of 13seedlings of Perennial ryegrass. 3). Laser-grading a USGA spec green under construction forfuture turfgrass research at the Valentine Research Center. 4). A dandilion grows in the crotchof a tree. 5). Black cutworm & predator. 6). Bentgrass varieties in a National TurfgrassEvaluation Program (NTEP) trial exhibiting susceptibility or resistance to brown patch.