1987 pavement evaluation system annual report · 1987 pavement evaluation system annual report...
TRANSCRIPT

1987 PAVEMENT EVALUATION SYSTEM
ANNUAL REPORT
Texas State Department of Highways
and Public Transportation
November 10, 1988

Chapter
1
2
3
4
5
6
7
TABLE OF CONTENTS
Title
Executive Summary . . . . . . . . . . . . . . . . . . . . . . . . . . . ii
Introduction ............................... .
1987 PES Survey ............................ .
Audit of 1987 PES Data •....•.•••••.•...••.••
Condition of Texas Highway System
Statewide Pavement Rehabilitation Needs •....
Analysis of Pavement Deflection Data .•......
Conclusions
i
1
2
6
8
20
26
39
EXECUTIVE SUMMARY
This report summarizes the results of the 1987 Pavement Evaluation System (PES) survey of Texas highways and describes current statewide pavement condition and rehabilitation needs, as well as historic trends observed over the last five years (1983-1987). Analysis of the data has identified the following trends:
1. The condition of the Texas highway system has stabilized with only small improvements being observed. These improvements generally lie within the expected variability of the data. The observed improvements may also be due to the absence of about 9 percent of the data (mostly in urban areas). Normally, about five percent of the required data are missing.
2. Approximately $808 million is needed for pavement rehabilitation work on 11,274 lane miles. These figures are less than last year, when $1 billion was needed for work on 11,930 lane miles, however the 1987 estimate assumes that IH rehab needs in District 12 (Houston) remained at 1986 levels, since no PES data were available in time for use in this report.
3. The expected variability in PES condition ratings remains at 15 points. On 75.0 percent of the 1987 PES audit sections, the District and audit raters returned ratings which were within 15 points of each other, compared to 77.5 percent in 1986.
4. Analysis of the pavement deflection data indicates that nearly 47 percent of the tested mileage could be considered "structurally weak." As expected, "weak" pavement sections are generally in poorer condition than "strong" sections. More importantly, the data suggests that these "weak" sections experience greater changes in condition (both up and down) , indicating either an existing pavement that deteriorates rapidly, or a newly-placed pavement, consisting of weak materials, which may not last for long. Comparison of subgrade, basejsurface stiffness, and pavement condition maps also suggests that, although high-quality pavements exist all across the state, "excellent" condition may be extremely unstable, due to observed weaknesses in subgrade and basejsurface materials.
ii

CHAPTER 1 -- Introduction
The Pavement Evaluation System (PES) is a combination of field evaluations and computer programs which describes statewide pavement condition and determines statewide rehabilitation needs. PES uses three types of data to define pavement condition: visual surface distress data, ride quality data, and pavement deflection data. Surface distress data are collected by District personnel who are specially trained in pavement evaluation once each year. Ride quality and deflection data are collected by operators from five District Regional Data Collection Centers (located in Districts 8, 11, 14, 15, and 18).
Pavement condition cannot be determined until both the visual and the ride data have been collected, entered, and stored into PES. Pavement deflection data must also be collected, entered, and stored for approximately one-third of these sections. PES sections are usually about two miles long and are defined by mileposts at both the beginning and the end of the section.
Surface distress data consists of a series of categorical values recorded by the raters for each distress type observed on a pavement section. Ride quality is measured mechanically and is reported on a scale of 0 (very rough) to 5 (very smooth). Deflection data is also measured mechanically and is reported as a structural strength index ranging from 0 (very weak) to 100 (very strong). The surface distress and ride quality values are then combined into a condition value which describes the current condition of the pavement surface on a scale of 0 (very bad) to 100 (excellent). Structural strength index is also reported, when available, but is not yet used as a factor in computing the PES condition index.
PES provides a consistent method of describing the condition of various pavement sections across the state. The condition ratings also enable an estimate of statewide pavement rehabilitation needs by incorporating traffic, environmental, and functional class factors into a priority index. This index measures a section's relative priority for rehabilitation on a scale of 0 (most urgent) to 100 (least urgent) with 34 or below generally being considered to be the threshhold value for PES rehabilitation estimates.
PES condition and rehabilitation estimates in this report were extrapolated from the statistically-representative random sample of "mandatory" mainlane sections which every District was required to rate. Previous PES Annual Reports (i.e. 1986 and 1985) analyzed all rated mainlane sections. comparison of the extrapolated results obtained from the "mandatory" and 11all rated" samples indicates little difference in the final values from either sample.
1

CHAPTER 2 -- 1987 PES Survey
To reduce the time spent on data collection, PES estimates are based on a statistical sample of the state-maintained highway system. The PES program randomly selects 100 percent of the Interstate mileage, 50 percent of the State and US highway mileage, and 20 percent of the Farm-to-Market road mileage. This results in a yearly sample size of approximately 30,000 lane miles.
Table 1 lists the total length of pavement, in lane miles, rated over the past five years (1983-1987). Table 1 consists of five sections, representing sample distributions for 1983, 1984, 1985, 1986, and 1987, respectively. Lane mileage totals are provided for the following pavement types:
1. ACP 2. CRC 3. JCP
Asphalt Concrete Pavement Continuously-Reinforced Concrete Jointed Concrete Pavement
Lane mileage totals are also provided for the following major highway systems:
1. IH -- Interstate Highway system 2. US/SH -- u.s. and State Highway systems 3. FM -- Farm-to-Market system
The inclusion of concrete (CRC and JCP) sections into the PES sample in 1984 has caused significant variations in the amount of mileage to be rated. PES contains an "overlap" function which attempts to provide continuity from year to year by adding sections rated in a previous year to the current year's sample.
In 1984, concrete had never been rated, therefore PES selected all concrete sections for evaluation. In 1985, the "overlap" function selected all concrete not rated in 1984 (i.e. zero) and added a small percentage of the concrete which had been rated in 1984. This process was reversed in 1986 -- a small percentage of the 1985 concrete was added to a large number of concrete sections not rated in 1985. The oscillation in the number of concrete sections to be rated must be considered when analyzing the results of the condition and rehabilitation studies.
2

Table 1. Total Length of Pavement Evaluated Each Year From 1983 to 1987 (Lane Miles). PES Random Statistical Sample Sections Only.
YEAR SURFACE IH US/SH FM TOTAL
ACP 2,560 12,793 5,518 20,871 1983 CRC 0 0 0 0
JCP 0 0 0 0
TOTAL 2,560 12,793 5,518 20,871
ACP 4,051 16,240 7,145 27,436 1984 CRC 1,285 739 0 2,024
JCP 273 621 18 912
TOTAL 5,609 17,600 7,163 30,372
ACP 4,190 14,035 7,591 25,816 1985 CRC 1,270 74 2 1,346
JCP 199 131 22 352
TOTAL 5,659 14,240 7,615 27,514
ACP 4,383 16,899 7,545 28,827 1986 CRC 1,298 639 4 1,941
JCP 130 578 33 741
TOTAL 5,811 18,116 7,582 31,509
ACP 4,196 13,871 7,639 25,706 1987 CRC 1,038 183 2 1,223
JCP 97 180 16 293
TOTAL 5,331 14,234 7,657 27,222
Note: Frontage roads are not included in this table.
3

Statistical analysis has demonstrated that the random PES sample is representative of the entire Texas highway network, thus PES estimates derived from the random sample are assumed to reflect actual statewide conditions and needs. However, PES statewide estimates are only as good as the sample data on which they are based. When significant amounts of the random sample data are missing, as is the case in 1987, the statewide PES estimates may not reflect actual statewide conditions and needs. Table 2 lists the percentage of the 1987 PES statistical sample which was not rated in each District.
4

Table 2. Percentage of 1987 PES Random Statistical Sample Not Rated. (Percent of Lane Mileage)
DISTRICT IH us SH FM TOTAL
1 0 0 0 0 0 2 12 0 1 0 6 3 1 3 1 3 2 4 2 2 2 2 2 5 0 0 0 0 0 6 2 1 0 0 1 7 1 2 0 0 1 8 2 7 2 0 3 9 43 0 2 0 14
10 43 1 1 1 9 11 0 6 3 2 4 12 100 57 62 9 73 13 16 2 2 0 4 14 0 0 2 1 1 15 33 17 12 4 22 16 3 2 5 1 3 17 1 3 4 0 2 18 23 15 5 1 16 19 1 4 1 0 2 20 19 13 5 9 11 21 6 9 9 6 9 23 2 4 0 5 3 24 6 0 3 0 3 25 0 15 3 2 7
1987 TOTAL 19 6 5 2 9
1986 TOTAL 9 5 3 2 5
Notes: Frontage roads are not included in this table.
Percentage identifies PES sections for which no condit~on rating values were available (due to missing ride data, missing visual distress data, or both) .
PES data collection responsibility was shared between the Districts and Austin. Therefore large values do not necessary represent a District's failure to collect the required data.
5

CHAPTER 3 -- Audit of 1987 Data
As in 1986, District personnel rated roads in their own District during the 1987 survey. Additionally, District personnel were instructed to rate randomly selected audit sections in a neighboring District during a five day period. This audit described the variability of ratings which can be expected when different people rate the same highway section.
Audit sections were selected at random from the mandatory PES sample. The audit sample size was kept down to about 5 percent, so that the audit could be completed within a five day period. However, each of the three surface types (ACP, CRC, and JCP) were sample separately so that a representative sample of each would be obtained. It should be noted in 1987 that the CRC and JCP audit data is not considered to be representative, due to misinterpretation of the audit instructions.
Ideally, condition values computed for a single section from the audit and the District data would be identical, since the same road is being rated. In reality, the current rating procedure is somewhat subjective and different condition values may be obtained by different rating teams on the same section of road. The precision (or "repeatability") of these values is a major influence on the reliability of the PES condition estimates.
Reliability of statewide Pavement Condition Ratings
Analysis of the 1987 audit data, summarized in Table 3, indicates a 75.0 percent probability that pavement condition ratings returned by different teams on the same section of road will be within 15 points of each other. This compares with 77.5 and 75.0 percent for 1986 and 1985, respectively.
Table 3. Precision of PES Condition Ratings.
Surface Type 1986 1987
ACP 77.2 74.2 CRC 87.2 83.6 JCP 60.0 76.9
ALL 77.5 75.0
Note: Values indicate the probability that condition ratings from different rating teams will be within 15 points of each other.
6

Reliability of Pavement Distress Ratings
The 1987 PES audit also enabled an analysis of the reliability of the individual pavement distress ratings which make up the final condition rating.
Since some distress types are more detrimental to the pavement's condition than others, the type of distress along with the expected magnitude of error in rating that distress must be considering when assessing the reliability of a PES condition rating.
For example, on asphalt pavements, 14.0 percent of the audit sections showed a disagreement in the ratings for rutting which would have been large enough, by itself, to cause at least a 10 point change in the condition rating (e.g. from 80 to 70, or from 45 to 35). Table 4 lists similar percentage values for each PES distress type for 1987 and 1986.
Table 4. Precision of PES Distress Ratings.
Surface Distress Type Type 1986 1987
ACP Rutting 9.2 14.0 Patching 11.0 11.0 Failures 6.3 7.9 Block Cracking 3.8 2.8 Alligator Cracking 16.9 13.3 Longitudinal Cracking 7.2 8.7 Transverse Cracking 8.1 10.2
CRC Spalled Cracks 6.4 o.o Punchouts 12.8 1.8 Asphalt Patches 8.5 1.8 Concrete Patches 4.2 21.8
JCP Failed Joints/Cracks 33.3 23.1 Failures 33.3 7.7 Shattered Slabs 6.7 0.0 Longitudinal Crack3 6.7 0.0 Concrete Patches 6.7 o.o
Note: Values indicate the probability that distress ratings from different rating teams will cause at least a 10 point difference in the condition rating value.
7

CHAPTER 4 -- Condition of Texas Biqhvay system
Data from the annual PES survey can be used to describe the condition of Texas highways. PES computes an overall condition rating based on the observed surface distresses and ride quality. The distribution of condition and ride quality ratings provides insight into the overall surface condition of the Texas highway system.
PES condition ratings may be used to compare pavements from different areas on an absolute basis, without introducing regional factors to bias the results. As a result, PES data provides an average driver's view of the highway system, unencumbered by the various traffic, environmental, and material properties which engineers use to refine their judgement.
Table 5 summarizes the results of the condition analysis by listing the percentage of all Texas highways which falls within each of the five major condition categories defined below:
Class Condition Rating
A 90 - 100 B 70 - 89 c 50 - 69 D 35 - 49 F 0 - 34
Please note that the Table 5 values, although taken only from the group of PES random statistical sample sections, are assumed to be representative of the entire Texas highway system.
8

Group
IH US/SH FH
ACP CRC JCP
IH ACP "' IH CRC
IH JCP
US/SH ACP US/SH CRC US/SH JCP
FM ACP
ALL HWYS.
NOTES:
Table 5 -- Percentage of Texas Highway System in Each Pavement Condition Class (Values Extrapolated from 1983-1987 PES Random Statistical Sample Sections)_
Class A" Class "B" Class "C"
83 84 85 86 87 83 84 85 86 87 83 84 85 86 87
73.7 65.6 64.4 65.1 69.5 18.2 14.4 18.4 16.4 18.1 5.2 9.8 7.8 10.2 7.1 53.9 44.8 56.1 57.5 59.6 24.6 24.5 22.2 21.3 20.9 13.6 17.1 12.2 11.5 12.0 50.8 37.7 45.2 50.0 52.7 25.0 25.0 24.9 22.7 22.0 15.3 19.5 17.7 16.4 14.2
55.5 48.8 56.4 59.5 59.8 23.9 23.0 22.2 21.2 20.8 13.0 16.2 12.7 11.9 11.5 38.3 36.0 39.5 60.1 21.4 24.8 16.2 19.8 17.8 16.7 18.4 12.9 10.7 11.9 8.5 34.4 18.7 11.2 15.0 11.4 17.8 11.0 20.4 20.5
73.7 75.2 75.7 73.2 71.3 18.2 12.7 16.7 16.3 18.3 5.2 7.5 5.1 7.8 5.8 47.1 36.0 43.3 64.7 19.2 25.4 17.7 17.6 15.0 16.8 18.0 11.7 10.4 8.6 9.4 42.8 16.4 9.1 7.9 12.9 19.9 8.3 13.3 15.5
53.9 47.0 56.6 60.2 60.3 24.6 24.7 22.3 21.8 20.9 13.6 16.9 12.2 10.9 11.7 22.9 36.0 32.2 34.8 25.2 14.5 13.3 31.0 22.7 16.0 18.7 19.7 11.1 19.0 8.3 31.7 20.3 15.1 17.3 11.6 15.6 13.2 22.2 22.2
50.8 37.8 45.3 50.2 52.8 25.0 25.0 25.0 22.8 22.0 15.3 19.4 17.7 16.4 14.2
55.5 47.0 54.8 57.1 59.6 23.9 22.8 22.2 20.7 20.7 13.0 16.3 12.8 12.5 11.6
Frontage roads are not included in this table.
Concrete pavement (CRC and JCP) was not rated in 1983, therefore, no condition estimates are available.
Class "0" Class "F"
83 84 85 86 87 83 84 85 86 87
1.9 4.7 3.1 4.0 2.9 1.0 5.5 6.3 7.3 2.5 4.8 7.4 5.1 4.9 4.7 3.0 6.2 4.4 4.7 2.9 5.8 10.9 6.8 5.8 5.9 3.1 6.9 5.4 5. 1 5.1
4.7 7.2 4.9 4.2 4.6 2.8 4.8 3.9 3.2 3.3 11.1 8.3 11.8 4.0 11.4 14.3 14.1 3.2 14.8 10.0 15.3 15.6 38.1 55.8 40.9 18.0
1.9 2.3 1. 7 2.0 2.4 1.0 2.2 0.8 0.6 2.3 9.2 7.5 9.6 2.9 9.5 14.2 11.4 3.1
19.1 3.0 13.6 22.8 34.3 70.9 55.8 6.0
4.8 6.8 4.9 4.1 4.5 3.0 4.5 4.0 3.1 2.6 14.4 18.1 16.4 10.9 14.8 15.3 19.4 3.6 13.0 19.3 15.8 10.3 40.0 33.4 36.5 24.2
5.8 10.9 6.7 5.8 5.9 3.1 6.9 5.3 4.8 5. 1
4.7 7.7 5.2 5.0 4.7 2.8 6.2 5. 1 4.7 3.4
Overall Statewide Pavement Condition
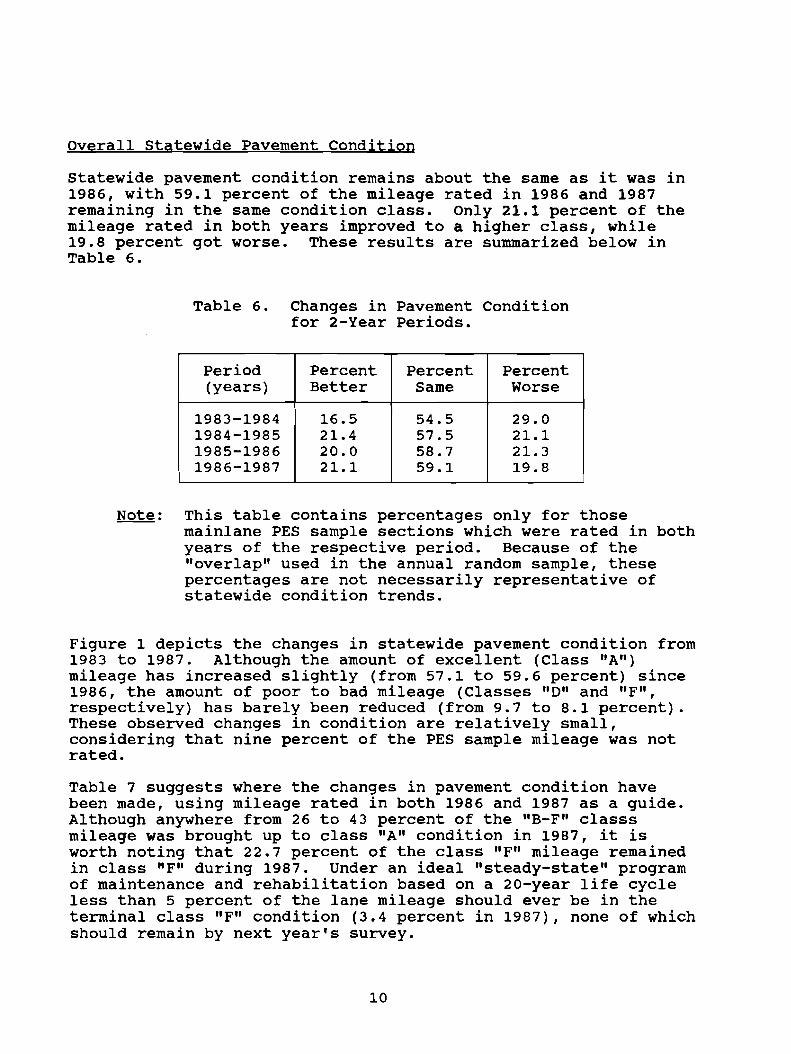
Statewide pavement condition remains about the same as it was in 1986, with 59.1 percent of the mileage rated in 1986 and 1987 remaining in the same condition class. Only 21.1 percent of the mileage rated in both years improved to a higher class, while 19.8 percent got worse. These results are summarized below in Table 6.
Table 6. Changes in Pavement Condition for 2-Year Periods.
Period Percent Percent Percent (years) Better Same Worse
1983-1984 16.5 54.5 29.0 1984-1985 21.4 57.5 21.1 1985-1986 20.0 58.7 21.3 1986-1987 21.1 59.1 19.8
Note: This table contains percentages only for those mainlane PES sample sections which were rated in both years of the respective period. Because of the "overlap" used in the annual random sample, these percentages are not necessarily representative of statewide condition trends.
Figure 1 depicts the changes in statewide pavement condition from 1983 to 1987. Although the amount of excellent (Class "A") mileage has increased slightly (from 57.1 to 59.6 percent) since 1986, the amount of poor to bad mileage (Classes "D" and "F", respectively) has barely been reduced (from 9.7 to 8.1 percent). These observed changes in condition are relatively small, considering that nine percent of the PES sample mileage was not rated.
Table 7 suggests where the changes in pavement condition have been made, using mileage rated in both 1986 and 1987 as a guide. Although anywhere from 26 to 43 percent of the "B-F" classs mileage was brought up to class "A" condition in 1987, it is worth noting that 22.7 percent of the class "F" mileage remained in class "F" during 1987. Under an ideal "steady-state" program of maintenance and rehabilitation based on a 20-year life cycle less than 5 percent of the lane mileage should ever be in the terminal class "F" condition (3. 4 percent in 1987) , none of which should remain by next year's survey.
10

CONDITION OF TEXAS HIGHWAYS Mainlanes -- 1983-1987 PES
100
'"rJ 1-'·
(JQ 90 c ~ (!)
...... 80
(") a.J :T Oil Ol ::s ell 70 (JQ a.J (!) ..... [/) ..... 1-'•
....... ~
::s a.J 60 tfl ~ ~ ell ...... Ol .....:l ...... ~ (!) 50 ~ '"d 1-'• a.J p.. .., (!)
ell '"d 0:: 40 Ol < ~ (!) 0 El (!)
30 ::s .., ~ u (") 0.. 0 ::s
20 p.. 1-'· ~
1-'· 0 ::s
10 .
0
A B c D F
Pavement Condition Class
cs=J 1983 ~ 1984 ~ 19R5 ~ 1986 ~ 1987

NOTES
12

Table 7. Changes In Pavement Condition Classes From 1986 To 1987.
1986 Pvt. 1987 Pavement Condition Class condition
Class "A" "B" "C" "D" "F"
"A" 77.8 16.0 4.0 1.0 1.3 II B" 43.1 33.8 15.4 5.5 2.2 "C" 39.6 24.8 24.4 5.8 5.4 "D" 34.0 20.7 19.0 17.1 9.3 "F" 26.6 10.9 18.5 21.4 22.7
Notes: This table contains percentages for only those mainlane PES sections which were rated in 1986 and 1987. Because of the "overlap" used in the annual random sample, these percentages are not necessarily representative of statewide condition trends.
Values in bold print indicate mileage which remained in the same pavement condition class from 1986 to 1987.
Totals may not equal 100.0 percent due to roundoff error.
13

As with pavement condition, overall ride quality has also improved. Nearly 27 percent of the statewide lane mileage has a ride quality better than 4.0 (on a scale of 0 to 5). The percent of mileage rougher than 3.0 has also dropped (from 24.7 percent in 1986 to 21.6 percent in 1987) after slowly increasing from 1983 to 1985. "3.0" is used as a threshhold ride quality value since the average motorist would probably identify roads with lower values as being "rough." Figure 2 depicts the changes in statewide ride quality, by class, from 1983 to 1987.
On asphalt pavements, rutting continues to be a problem. As indicated in Table 8, 33.1 percent of the PES sample sections in 1987 had "measurable" rutting {up from 29.0 percent in 1986). However, this percentage does not reflect the true amount of rutting on Texas highways since PES ratings ignore ruts less than 0.5 inches deep. Failures are also more common, although the actual percentage, 6.1, is still quite low.
Table 9 describes the extent of "severe" asphalt pavement distress observed on Texas highways. PES raters describe distress area and severity according to definitions which are consistent throughout the state. When a distress type is identified, it contributes to the reduction of the pavement section's condition rating. Most distress ratings only reduce condition by about 85 to 95 percent of the original value -"severe" distress ratings are defined as those which reduce the pavement condition to 80 percent or less. Again, rutting continues to increase, this time at a steady 0.3 percent each year since 1985.
Analysis of distress data for CRC pavements indicates that pavement distress is becoming less frequently observed. Of the four CRC distress types, only concrete patches were observed more frequently in 1987 than in 1986 (39.0 percent to 39.1 percent). This is to be expected since concrete is the recommended patching material for CRC. However, these percentages should be not be literally interpreted since, by the nature of the PES rating method, only one crack (or one punchout or one patch) need be counted for the section to be included in the percentages. Table 10 summarizes the results of the CRC distress analysis.
In contrast with the Table 10 values, Table 11 indicates the amount of "severe" CRC distress types is up to its highest level to date. Such a trend is to be expected from an aging CRC network, however the large values, especially those for punchouts and asphalt patches (73.9 and 83.4 percent, respectively), warn of increasingly high rehabilitation costs in future years.
A JCP distress analysis was also performed, however there were so few sections available that reporting of the results was considered to be inappropriate.
14

RIDE QUALITY OF TEXAS HIGHWAYS
'rj Mainlanes -- 1983-1987 PES 1-'· 100 OQ
c 'i ro N
90 n ::r Ql :::1 80 OQ
ro (/) Q)
1-'· blJ :::1 ('j 70 Q) U'l ....... rt ..... Ql ::g rt ro
Q) 60 ~
1-' 1-'• ~
U1 0.. ('j ro ....:1
'"d 50 Ql 'd ..:: Q) I'll +) 5I I'll ('j :::1 0:: 40 rt
::0 .....
1-'• 0 0.. I'll +) 30 .0 u c 0.. Ql ......
20 1-'· rt
'<:
10
0
A D c D F
Ride Quality Class
[S::=J 1983 ~ 1984 ~ 1985 ~ 1986 ~ 1987

Table 8. Percent of PES Sections Having Each ACP Distress Type.
Distress Type 1983 1984 1985 1986
Rutting 24.3 31.6 29.6 29.0 Patching 30.8 28.8 25.4 Failures 4.9 4.7 5.6 5.6 Block Cracking 9.9 5.8 6.3 Alligator Cracking 25.9 24.8 18.2 13.8 Longitudinal Cracking 36.2 40.8 34.0 31.1 Transverse Cracking 29.9 32.8 27.4 27.4
Notes: Frontage roads are not included in this table.
1987
33.1 23.7 6.1 4.6
13.3 31.0 26.0
Patching and Block Cracking were not rated in 1983.
Values in bold print indicate highest observed percentage for each distress type.
Table 9. Percent of PES Sections Having Severe Levels of Each ACP Distress Type.
Distress Type 1983 1984 1985 1986
Rutting 0.8 2.8 1.4 1.7 Patching 11.5 8.8 7.9 Failures 0.3 0.4 0.8 0.9 Block Cracking 3.3 2.2 2.5 Alligator Cracking 8.2 8.6 5.6 4.0 Longitudinal Cracking 6.6 7.7 6.2 6.2 Transverse Cracking 10.3 11.3 7.2 7.4
Notes: Frontage roads are not included in this table.
1987
2.0 7.8 0.8 1.7 4.0 7.0 8.3
Patching and Block Cracking were not rated in 1983.
Values in bold print indicate highest observed percentage for each distress type.
16

Table 10. Percent of PES Sections Having Each CRC Distress Type.
Distress Type 1983 1984 1985 1986
Spalled Trans. Cracks 80.9 78.1 67.9 Concrete Patching 42.5 .C8.9 39.0 Punchouts 40.8 .C7 • .C 31.6 Asphalt Patching 30.3 .C5.3 19.2
Notes: Frontage roads are not included in this table.
1987
50.6 39.1 26.1 16.6
Concrete pavement (CRC and JCP) was not rated in 1983.
Values in bold print indicate highest observed percentage for each distress type.
Table 11. Percent of PES Sections Having Severe Levels of Each CRC Distress Type.
Distress Type 1983 1984 1985 1986
Spalled Trans. Cracks 19.7 21.9 32.1 Concrete Patching 57.5 51.2 61.2 Punchouts 59.2 52.6 68.4 Asphalt Patching 69.7 54.8 80.9
Notes: Frontage roads are not included in this table.
1987
.C9 • .C 61.0 73.9 83.-C
Concrete pavement (CRC and JCP) was not rated in 1983.
Values in bold print indicate highest observed percentage for each distress type.
17

Pavement Condition By Highway System
Analysis of the PES data for the Interstate (IH) system shows a noticeable improvement in condition, especially in the percent of excellent and good (Classes "A" and "B", respectively) mileage. Nearly 88 percent of the Interstate lane mileage has a pavement condition rating of 70 or above. The percent of mileage in the other classes ("C-F") has decreased from 18.5 to 12.5 percent in the last year. However, twenty percent of the Interstate lane mileage was not rated in 1987. Because so much of this missing mileage was in the major urban areas, where pavement condition is usually worse, the observed improvements in condition could be almost eliminated.
The US and State highway systems have improved slightly since 1986, however these improvements (approximately 2 percent) lie within the expected variability of the data. Therefore, overall condition of the US and State highway systems may be said to have stabilized at 1986 levels.
As expected, the Farm-to-Market (FM) system remains in the poorest overall condition of the three major highway systems. However FM condition has improved, especially when compared to the 1984 PES survey. Nearly 53 percent of the FM mileage was in excellent condition in 1987, compared to only 38 percent in 1984. Although the FM system has improved to 1983 levels and beyond, it is worth noting that 11.1 percent of the mileage was in poor to bad condition in 1987, compared to only 8.9 percent in 1983.
Pavement Condition By Pavement Type
As with the overall Texas highway system, asphalt pavements show little change in condition from 1986 to 1987. This is to be expected since asphalt pavements made up over 94 percent of the lane mileage rated in the 1987 PES random sample. Since 1984, when concrete sections were first rated, the percentage of asphalt mileage in the statewide random sample has ranged from 90.3 percent (in 1984) to 94.4 percent (in 1987). Ride quality on asphalt pavements remains very good overall, with only 18.4 percent of the mileage below 3.0 (compared to 19.6 percent in 1986, 26.8 percent in 1985, 24.1 percent in 1984, and 25.1 percent in 1983). Nearly one-third of the lane mileage in 1917 had a ride quality value of 4.0 or better -- the largest percentage in five years. Overall asphalt ride quality is not really affected by the increasing amount of rutting, which is to be expected since ruts tend to guide vehicles along well worn wheelpaths.
18

Analysis of the CRC and JCP sections yield inconsistent results at best, because of the large amounts of missing data and also because of the oscillating nature of the "overlap" which drastically reduces the number of concrete sections in the random sample during odd years (e.g. 1985 and 1987). As shown earlier in Table 1, only 1223 miles of CRC and 293 miles of JCP data were actually stored in 1987.
For CRC, 60.1 percent of the rated lane mileage in 1987 is in Class "A" condition, compared to 36.0-39.5 percent during the last three years. Class "F" mileage dropped from around 14 percent to 3.2 percent in 1987. "Rough" mileage also dropped dramatically from 24.5 percent in 1986 to 6.4 percent in 1987.
The results for JCP are even more unexpected. The percentage of Class "A" mileage quadrupled from 8.5 percent in 1986 to 34.4 percent in 1987, while Class "F" mileage was cut in half from 40.9 percent to 18.0 percent (1986-1987). Ride quality, traditionally the worst feature of the JCP mileage, improved from 69.2 percent "rough" sections in 1986 to 44.2 percent in 1987.
Again, because of the small sample size, the CRC and JCP results should not be literally interpreted as being representative of all Texas concrete mileage.
Each year, analysis of the PES data only emphasizes the magnitude of the statewide drop in pavement condition which was observed in 1984. Part of this drop may be attributed to the addition of concrete pavements to the PES rating sample, as suggested by the Interstate system, which has only gradually improved since 1984. A harsh winter, combined with later restrictions in State funding, must also be considered when interpreting the 1984 data. These last two factors affected the FM system so severely that it has taken three years of intensive work at increased funding levels to restore its previous (i.e. 1983) condition.
19

CHAPTER 5 -- Statewide Pavement Rehabilitation Heeds
Statewide pavement rehabilitation needs were estimated by identifying rated lane mileage which was in most urgent need of rehabilitation. PES contains a rating value for rehabilitation priority which ranges from 0 (most urgent) to 100 (least urgent). A pavement section was included in the needs estimate if its rehabilitation priority index was 34 or below.
Total statewide needs were extrapolated from the PES random statistical sample of mandatory sections, since all state maintained lane mileage was not rated each year. The needs estimate program distributed all PES sections into small groups according to the following classes:
1. Year (1983, 1984, 1985, 1986, or 1987) 2. District (1-25, except 22) 3. System (IH, US/SH, or FM) 4. Surface Type (ACP, CRC, or JCP) 5. ADT Class (1, 2, or 3)
These five classes partition the Texas highway system into 3240 groups of pavement sections. The extrapolation assumed that the percent of total lane mileage needing rehabilitation in a group would be the same as the percent of rated lane mileage needing rehab. For example, if 10 percent of the rated lane mileage in a group needed rehab, then 10 percent of the total lane mileage in that group would also be selected for rehab. Each group was considered independently, with the results being assembled into larger categories for reporting.
The rehab model eliminated construction sections (which could not be rated) and frontage roads from each group before performing the extrapolation. Table 12 lists the total assumed inventory of mainlane mileage (in lane miles) for each year, before elimination of the construction sections.
The rehab model estimates immediate high-priority lane mileage and funding needs for a one-year statewide pavement rehabilitation program. Unit costs for typical rehabilitation strategies are listed in Table 13, by highway system, surface type, and ADT class. These unit costs simulate intensive rehabilitation or reconstruction work and do not represent all rehabilitation work done in the Districts.
Table 14 contains the statewide pavement rehabilitation lane mileage estimates for 1983-1987, while Table 15 contains the statewide pavement rehabilitation funding estimates for 1983-1987.
20

Table 12. Assumed Total Statewide Lane Mileage.
YEAR SURFACE IH US/SH FM TOTAL
ACP 7,646 64,851 80,460 152,956 1983 CRC 0 0 0 0
JCP 0 0 0 0
TOTAL 7,646 64,851 80,460 152,956
ACP 8,566 65,559 81,305 155,430 1984 CRC 3,799 2,031 73 5,903
JCP 1,497 2,535 344 4,376
TOTAL 13,862 70,125 81,721 165,708
ACP 8,694 65,400 80,805 154,899 1985 CRC 3,862 1,915 81 5,858
JCP 1,482 2,427 350 4,259
TOTAL 14,038 69,742 81,235 165,015
ACP 9,180 66,173 81,918 157,270 1986 CRC 3,645 1,982 84 5,712
JCP 1,445 2,516 357 4,318
TOTAL 14,270 70,671 82,359 167,301
ACP 9,449 66,591 82,199 158,239 1987 CRC 3,431 1,746 86 5,262
JCP 1,407 2,385 358 4,150
TOTAL 14,287 70,722 82,644 167,652
Notes: Frontage roads are not included in this table since frontage road lane mileage is not directly available from PES data files.
Concrete (CRC and JCP) pavement was not rated in 1983. Since no ratings were available from which to extrapolate rehab needs, estimates of statewide concrete lane mileage were not made.
Totals may not be exact due to roundoff error.
21

Table 13. Assumed 1983-1987 Pavement Rehabilitation Costs (in Dollars per Lane Mile).
IH US/SH FM
SURFACE Cost ADT Cost ADT Cost
85,000 23,000 65,000 23,000 25,000 ACP 143,000 100,000 143,000 100,000 50,000
400,000 100,000+ 400,000 100,000+
103,000 25,000 103,000 25,000 25,000 CRC 143,000 100,000 143,000 100,000 50,000
400,000 100,000+ 400,000 100,000+
65,000 25,000 25,000 JCP 165,000 100,000 165,000 100,000 50,000
500,000 100,000+ 500,000 100,000+
Note: ADT is Average Daily Traffic, in vehicles/day.
22
ADT
1500 1500+
1500 1500+
1500 1500+

YEAR
1983
1984
1985
1986
1987
Table 14. Total Projected Statewide Lane Mileage in Need of Rehabilitation.
SURFACE IH US/SH FM TOTAL
ACP 180 3,968 3,472 7,620 CRC 0 0 0 0 JCP 0 0 0 0
TOTAL 180 3,968 3,472 7,620
ACP 531 5,455 7,840 13,826 CRC 658 486 0 1,144 JCP 497 1,127 55 1,680
TOTAL 1,686 7,068 7,895 16,649
ACP 262 4,645 5,435 10,343 CRC 896 270 0 1,167 JCP 591 1,104 101 1,796
TOTAL 1,749 6,020 5,536 13,305
ACP 287 3,803 4,864 8,954 CRC 768 528 2 1,298 JCP 422 1,100 155 1,677
TOTAL 1,477 5,431 5,022 11,930
ACP 455 3,737 5,440 9,633 CRC 174 283 0 457 JCP 76 715 42 833
TOTAL 706 4,735 5,482 10,924
Notes: Frontage roads are not included in this table.
Concrete (CRC and JCP) pavement was not rated in 1983, therefore no sections were found to be in need of rehabilitation due to low PES ratings.
Totals may not be exact due to roundoff errors.
23

Table 15. Total Projected Statewide Pavement Rehabilitation Funding Required (in thousands of dollars).
YEAR SURFACE IH US/SH FM TOTAL
ACP 21,243 305,915 117,190 444,349 1983 CRC 0 0 0 0
JCP 0 0 0 0
TOTAL 21,243 305,915 117,190 444,349
ACP 48,803 382,342 234,087 665,232 1984 CRC 263,257 74,940 0 338,197
JCP 105,879 111,039 2,771 219,689
TOTAL 417,940 568,320 236,858 1,223,118
ACP 44,185 395,781 174,535 614,501 1985 CRC 358,450 62,038 0 420,489
JCP 97,506 121,916 4,684 224,107
TOTAL 500,142 579,735 179,219 1,259,096
ACP 33,823 276,464 148,589 458,876 1986 CRC 307,348 65,718 113 373,178
JCP 69,592 127,871 6,381 203,843
TOTAL 410,762 470,053 155,082 1,035,897
ACP 44,598 274,619 171,362 490,579 1987 CRC 69,676 32,404 0 102,081
JCP 12,612 72,557 1,475 86,644
TOTAL 126,886 379,581 172,837 679,303
Notes: Frontage roads are not included in this table.
Concrete (CRC and JCP) pavement was not rated in 1983, therefore no estimates of pavement rehabilitation needs could be made.
Totals may not be exact due to roundoff error.
24

Tables 14 and 15 do not include 1987 rehabilitation work scheduled for Interstate highways in District 12, since no 1987 IH sections were available in PES for analysis. Assuming that the total rehabilitation needs have not changed since 1986 would add 350 lane miles and $128,262,000 to the 1987 rehab estimates. Thus, the summarized statewide rehabilitation needs would be:
Year Lane Miles Dollars
1983 7,620 $ 444,349,000 1984 16,649 $1,223,118,000 1985 13,305 $1,259,096,000 1986 11,930 $1,035,897,000 1987 11,274 $ 807,565,000
The above summary depicts a noticeable reduction in total rehabilitation needs, despite the Chapter 4 conclusion which suggests that statewide pavement condition has shown little or no noticeable improvement. It must be emphasized, however, that these conclusions have been extrapolated from a partial sample which, when collected in full, is statistically representative of statewide pavement conditions. The absence of substantial portions of the 1987 PES sample certainly affects the accuracy of the 1987 estimates. If the missing data were uniformly distributed across the state, the statistical sample would probably remain representative. However much of the missing data were located in high-traffic high-rehab areas, thus severely affecting the accuracy of the rehabilitation estimates.
25

CHAPTER 6 -- Analysis of Pavement Deflection Data
One of the biggest limitations of PES has been its lack of sub-surface structural strength data to complement the surface (ride and visual distress) ratings. To address this limitation, the 1987 PES survey included the collection of pavement deflection data on about one-third of the PES random statistical sample sections (i.e. approximately one-ninth of the Texas highway system).
Pavement deflection data were collected to assess base and subgrade conditions which might contribute to accelerated deterioration of pavements which otherwise look to be in excellent condition. The deflection data were collected mechanically and then combined into a structural strength index with values ranging from 1 (very weak) to 100 (very strong).
Figure 3 depicts the distribution of structural strength index values observed during the 1987 PES survey. Nearly 47 percent of the lane mileage tested had a structural strength index below 80, and thus could be considered structurally weak. Such pavements, though their PES condition ratings may be excellent, can rapidly deteriorate unless frequently monitored.
Condition of "Strong" Versus "Weak" Pavement Sections
Analysis of PES sections rated in 1986 and 1987 suggests that such structurally weak sections are subject to rapid changes in condition. Table 16 lists the percentage of structurally weak (i.e. SSI < 80) mileage in each 1986/1987 condition class. The bold values form a "line of equality," representing those sections which stayed in the same condition class from 1986 to 1987. Values above and to the right of the line got worse in 1987 while values below and to the left of the line got better in 1987. As expected, the percentages on either side of the line tend be larger (i.e. more of the changing sections are structurally weak). Values on the line also increase (with one exception) as the condition class worsens.
The large percentages for classes "D" and "F" in Table 16 suggest that the structurally weak mileage is, as a group, in poorer condition than the structurally strong mileage. Figure 4 compares the percentage of "strong" and "weak" mileage in each pavement condition class. As expected, the "strong" mileage is in better condition overall, with much larger percentages of Class "A" and Class "B" mileage.
26

t-rj
~· (!) ()Q c bll '1 ('j (1) (!)
w ,....; ...... ...... ......
U'l (!) U'lrt rt OJ ~ '1 rt ('j (1) (1)
::l ~ ....:l
N ()Q ~· -._J rt 0.. "d
::rro (!)
Ht::! -+-)
::l ~-('j
O..Ul ~ (1) rt ~ '1
"'"' ~· <cr 0 OJ c f-'rt c ~·
-+-)
(1) 0 u Ul ::l 0...
0 1-tl
U'l rt '1 c n rt c '1 OJ f-'
100
90
80
70
60
50
40
30
20
10
0
0
STRUCTURAL STRENGTH OF TEXAS HIGHWAYS
10 20
ACP Mainlanes -- 1987 PES
30 40 50 60
Structural Strength Index -- 1987
70 80 90 100

TABLE 16. Percent of Structurally Weak Mileage In Each Pavement Condition Class.
1986 PVT. 1987 PAVEMENT CONDITION CLASS CONDITION
CLASS "A" "B" "C" "D"
"A" 24.9 31.5 53.2 46.5 "B" 40.9 36.7 38.1 58.0 "C" 38.9 43.4 61.2 51.7
. "D" 58.5 65.6 73.4 54.2 "F" 57.8 24.4 72.3 70.8
"F"
27.6 61.4 53.9 56.6 65.0
Notes: This table contains percentages for only those mainlane PES sections which were rated in 1986 and 1987. Because of the "overlap" used in the annual random sample, these percentages are not necessarily representative of statewide condition trends.
Values in bold print indicate mileage which remained in the same pavement condition class from 1986 to 1987.
28

'"r:1 1-'·
(IQ c: 'i ro .to-
(J 0
: 9 Cfl'O rt Pl 'i 'i 0 1-'· ::J ::J
(IQ(IQ
(J
Pl 0 N :::1 ::J \0 0.. 0..
1-'· : rt ~ I-'• ro 0 Pl ::J !>\""'
: 0 Hl
Cfl ro Cfl (') rt rt 'i 1-'· c: 0 (')
:::1 rt Ul c:
'i Pl t-' t-'
'<:
1987 PES PAVEMENrr CONDITION Man_datory MainJa11e FlWD Sections
"B" 19.1
"Strong" Sections (SSI >= 80)
Flexible (ACP) Pavements Only
"F" 2.3
"D" 3.1
"A" 50
"C" 15.1
"Weak" Sections (SSI < 80)
"F" 5. 5
"D" 6.7

Structural Strength of Pavements in "Excellent" Condition
Considering the extensive amount of resurfacing that the Department has funded since 1984, it is worth studying the expected effectiveness or durability of the newly-completed work. Although PES data cannot track specific projects from completion to reconstruction, the statewide condition data can be used to identify sections which have experienced rapid changes in condition.
The original justification for structural strength testing was that PES condition ratings could be easily influenced by recently-completed surface improvements, such as seal coats and thin overlays, which would not really improve the pavement's overall performance. Such "structurally weak" sections would deteriorate rapidly over time because the underlying structural weakness had not been addressed by the surface work.
Figure 5 depicts this expected behavior by comparing the SSI cumulative percentage distributions of 1986 sections which were found, in 1987, to be in condition class "A." Sections which were (in 1986) in excellent condition had the best overall structural strength, as evidenced by the small area under the 1986 "A" SSI curve. Those sections with minor improvements from Classes "B" and "C" are practically interchangeable, however both curves are definitely worse than the Class "A" curve. The sections with the largest improvements, the Class "D" and "F" curves, show the worst SSI distributions. In fact, in an ideal environment, these curves should not even exist because the structural deficiencies inherent in such sections should be corrected along with the surface defects. Figure 5 suggests that, for whatever reason, not enough structural repair is being made during improvement work on the highway system. such mileage could mushroom into a serious maintenance burden if it is not monitored and managed diligently.
30

STRUCTURAL STRENGTH OF TEXAS HIGHWAYS 1987 Condition Grade = "A"
100 "':l 1-'·
(IQ c '1 ('!) 90 1..11
• Cfl .. 80 Cfl .. H • t:l .... 1-'· .. en :. rt
70 '1 1-'• 0"' • c a rt 60 1-'• .. 0 ~ ~ en w
>--' Hl 'd 0 '1 •
~0
.., >--' 1.0 .. CXl ~ .......
4-0
(') \4 I-' Ill 0 en 30 en
• ~
.., 0
~ ~ 20
1-'· I-' ('!) Ill
(IQ 10
('!) . 0
0 10 20 30 40 ~ 60 70 80 90 100
Structural StreD,Jth Indo:
1988 "A" -- - 1986 "D" 1986 "B" . 1988 "C"
-- 1888 IIDII

NOTES
32

Effect of Subgrade Support and Base/Surface Stiffness on Pavement Condition
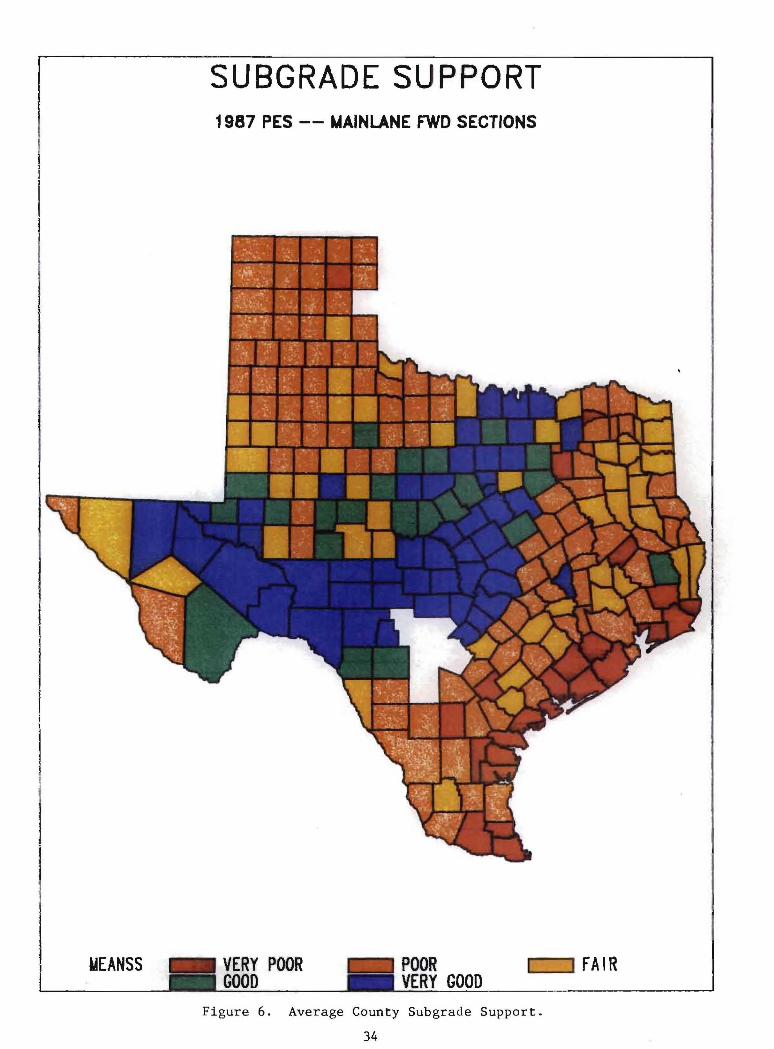
PES pavement deflection data also provided insight into the relationship between subgrade support, basejsurface stiffness, and pavement condition, as depicted by Figures 6, 7, and a, respectively.
Figure 6 shows each county's computed average subgrade support value. Subgrade support categories were defined in terms of the subgrade modulus, as shown below:
Range of Subgrade category Modulus Values (psi)
"Very Poor" 0-12,999 "Poor" 13,000-17,999 "Fair" 18,000-22,999 "Good" 23,000-27,999 "Very Good" 28,000-99,999
STATE AVG. 20,652
Major geologic features are readily apparent, especially the blue-shaded Balcones Escarpment, Llano Uplift, and Edwards Plateau regions of central Texas (the white regions indicate seven counties where deflection data were not available). These blue-shaded regions provide excellent subgrade -- the first step in building a durable, high-quality pavement.
The other step is to provide a strong basejsurface. displays the average surface curvature index (SCI) of base and surface stiffness -- for each county. were defined as shown below:
Range of category SCI Values
"Very Good" 0- 6.99 "Good" 7.00-12.99 "Fair" 13.00-18.99 "Poor" 19.00-24.99 "Very Poor" 25.00-99.99
STATE AVG. 16.58
33
Figure 7 -- a measure SCI categories
UEANSS
SUBGRADE SUPPORT 1987 PES -- UAJNLANE FWD SECTIONS
VERY POOR GOOD
POOR VERY GOOD
Figure 6. Average County Subgrade Support.
34

BASE/SURFACE STIFFNESS 1987 PES -- MAINLANE FWD SECTIONS
Figure 7. Average County Base/Surface Stiffness .

•rhe SCI values indicate the relative quality of the "man-made" roadbed materials, as opposed to the 11 natural" subgrade materials. Figure 7 displays some of the same general trends as Figure 6, identifying areas where local (subgrade) materials are being used in the pavement construction. However, predominant use of seal coats in some rural counties will worsen the average stiffness, since the light-duty seal coat surface has little or no stiffness. "Very Good" values for the. major urban counties (Harris, Dallas, Travis, Tarrant, and Jefferson) indicate the use of better materials or thicker sections in construction. This practice has become more prevalent, given the infeasibility of frequent maintenance in urban areas, however it places a greater burden on District design/construction personnel because more money and effort are at risk if an isolated section fails prematurely.
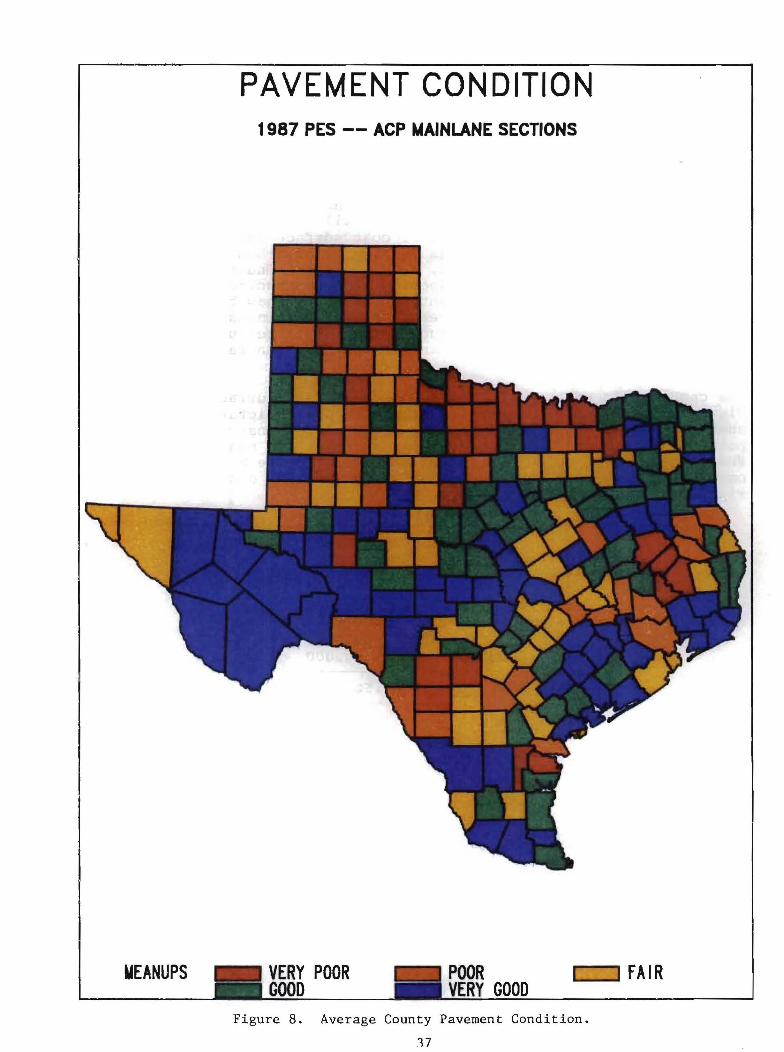
The combination of the subgrade support and base/surface data of Figures 6 and 7 should directly yield an overall picture of county pavement condition. However, Figure 8 demonstrates that pavement condition (at least surface condition, as measured by PES) is dependent on other factors as well. Figure 8 shows each county's average pavement condition value (surface distress and ride quality), as defined below:
Range of Pavement Category Condition Values
-
"Very Poor" 0-74.999 "Poor" 75.000-79.999 "Fair" 80.000-84.999 "Good" 85.000-89.999 "Very Good" 90.000-100.000
STATE AVG. 8~.52
36
YEAN UPS
PAVEMENT CONDITION 1987 PES -- ACP WAINLANE SECTIONS
VERY POOR GOOD
POOR VERY GOOD
Figure 8. Average County Pavement Condition .
. 17

"Good" and "Very Good" pavement condition exists in many counties throughout the state, even in those regions with "Poor" or "Very Poor" subgrade support. The most striking example is the entire coastal region, where subgrade is poor and base/surface stiffness is generally fair, at best, with a scattering of better values. This prevalence of "Good" and "Very Good" pavement condition suggests several interesting causes:
1. Unusually long-lasting maintenance/design practices, which are capable of providing quality pavement, even in adverse conditions.
2. Higher-level (even "overdesigned") treatments, applied at the same frequency as normally-adequate "lesser" treatments.
3. Unusually frequent ~aintenancejrehabilitation practices (e.g. seal coats applied every three years, when once every seven years ~ould be normally expected). This is a particularly ~orr~ome cause, since it suggests that work is being misapplted and is not lasting.
4. Errors in the PES computations of pavement condition or subgrade support.
Of course there are some regions (e.g. the Panhandle) with poorer subgrade and poorer condition, in which case a review of treatment and funding allocation practices is in order. regions display poor condition even with better subgrade or base/surface stiffness, which again suggests the need review of treatment and funding allocation.
Other support for a
With only one year's worth of structural data, analysis of subgrade, stiffness, and pavement condition trends yields as many questions as it does answers. Part of this problem is due to lack of experience (i.e. first-year data) while the rest is du.e to the use of a pavement evaluation system, by itself, to provide non-evaluation related management conclusions. A fully-developed and supported pavement management system can eliminate much of the guesswork and provide the information necessary to assess the actual effectiveness of highway work.
38

CHAPTER 7 -- Conclusions
Analysis of the PES condition data indicates that the rapid recovery of pavement condition in 1985 and 1986 has slowed, with 1987 values only slightly better than 1986. Although much of the network is in good to excellent condition, PES structural strength testing identifies extensive areas of poor subgrade and potentially weak basejsurface layers. These findings are supported by observed increases in load-associated distress (i.e. rutting and failures) suggesting that the observed gains in condition may be quickly lost unless diligently monitored and maintained.
Rehabilitation needs continue to decrease, at a rate greater than that which might normally be expected from the observed improvement in overall pavement condition. However, PES data for several portions of the major urban areas were not available in time for use in developing the 1987 rehab estimate. Thus the final 1987 estimate includes assumed values for the missing areas, and must be regarded only as an estimate of relative, as opposed to absolute, need.
Precision, or repeatability, of the PES visual distress ratings remains at approximately 75% + or - 15 points. Experience in Texas and other states suggests that this precision is about the best that can be obtained using the current subjective PES rating procedure. Implementation of more automated data collection equipment is expected to improve precision by replacing some of the more subjective or tedious ratings, such as rutting, with computerized distress identification techniques.
39