19. visual quality effects - yellowhead mining inc. main report/19) chapter 19...19. visual quality...
TRANSCRIPT

HARPER CREEK MINING CORPORATION 19-1
19. VISUAL QUALITY ASSESSMENT
19.1 INTRODUCTION
Harper Creek Mining Corporation (HCMC) proposes to construct and operate the Harper Creek
Project (the Project), an open pit copper mine near the unincorporated community of Vavenby,
British Columbia (BC). The Project location and infrastructure is shown in Figure 19.1-1. This chapter
describes the baseline visual quality conditions, and undertakes a scoping and effects assessment to
characterize potential effects on visual quality as a result of the Project. The chapter is informed by
the baseline report provided in Appendix 19-A (Platt 2012). This chapter follows the effects
assessment methodology described in Chapter 8 of this Application for an Environmental
Assessment Certificate / Environmental Impact Statement (Application/EIS).
19.2 REGULATORY AND POLICY FRAMEWORK
The Application Information Requirements (AIR), approved by the British Columbia Environmental
Assessment Office (BC EAO; 2011) on October 21, 2011, includes a requirement to assess the Project’s
effects on visual quality. Section 6.23 of the AIR states the assessment will consider potential visual
impacts of the Project on the North Thompson River Valley near Vavenby and the surrounding
recreational areas such as Dunn Peak. Recreational use of the Barrière River watershed is considered
high and includes fishing, hunting, boating, and other activities such as snowmobiling and cross-
country skiing (BC EAO 2011).
There is currently no provincial or federal legislation regulating visual quality. The Forest and Range
Practices Act (2002b) requires forest operators to set specific targets or develop strategies for
addressing environmental priorities and objectives regarding visual quality. The British Columbia
Ministry of Forests, Lands and Natural Resources Operations (BC MFLNRO) has established
procedures and created tools for performing visual impact assessments to aid in managing visual
effects of forestry activities. Proponents in other sectors are encouraged to apply these procedures
and tools to limit visual quality effects of their projects. These procedures and tools are used to
assess the Project’s potential effects on visual quality.
The Project falls within the Kamloops Land and Resource Management Plan (LRMP), which is a
subregional land use plan. Under the Kamloops LRMP, the Project is subject to legislation and
regulations for Crown land and resource management (BC ILMB 1995). The Kamloops LRMP
includes visual quality objectives (VQOs) for visually sensitive areas, in terms of their resource value.
A VQO indicates the desired visual condition based on social concerns and the physical
characteristics of the landscape. By being consistent with the VQOs, visual resource management can
guide development activities in a manner that minimizes impacts to visually sensitive areas. With
respect to mining and VQOs, the Kamloops LRMP states that the objectives do not preclude mine
development activities and every effort should be made to meet VQOs (BC ILMB 1995). Table 19.2-1
provides a summary of applicable statutes and regulations for potential visual quality effects.

!.
Non-PAGWaste Rock
OverburdenStockpile
PlantSite
Min
e Access Road
ExplosivesFacility
Power LineOption 1
Power LineOption 2
TailingsManagementFacility (TMF)
Open Pit
PAGLow GradeStockpile
Rail ConcentrateLoad-out Area
£¤5Vavenby
220
0
2200
2000
200
0
1600
22
00
1400
1200
2200 2000
1800
16
00
140
0
800
1000
1200
1800
18
00 16
00
10001200
1400
160
0
1400
18
00
140
0
1200
12
00
1600
1000
120
0
1400
20001800
1800
600
600
20
00
2200
18
00
180
0
1600
1800
180
0
800
160
0
Lu
teC
reek
Cla
yC
ree
k
Foghorn
Cre
ek
Ba
ker
Cre
ek
North Thomps on River
Jone
s Cre
ek
Chuck
Creek
AveryC
ree
k
Barr
i ère
Riv
er
Har p
er
Cre
ek
P-C
reek
T-C reek
300000
300000
305000
305000
310000
310000
315000
315000
57
05
00
0
57
05
00
0
57
10
00
0
57
10
00
0
57
15
00
0
57
15
00
0
Project Location and Infrastructure
Date: October 17, 2014Projection: NAD 1983 UTM Zone 11N
±
!. Community
Existing Infrastructure
Highway
Local Road
Resource Road
Railway
Transmission Line
Proposed Project Infrastructure
Project Footprint
Project Site
Figure 19.1-1
Proj # 0230881-0024 | GIS # HCP-21-015HARPER CREEK MINING CORPORATION
0 2 4
Kilometres
1:100,000
!.
!.
!.
!.
!.
!.^̀̂̀Harper CreekProject Site
US
Alberta
Alaska,US
Yukon Northwest Territories
PacificOcean
Clearwater
Victoria
Smithers
Vancouver
Prince George
Kamloops
Service Layer Credits: Source: Esri, DigitalGlobe, GeoEye, i-cubed, EarthstarGeographics, CNES/Airbus DS, USDA, USGS, AEX, Getmapping, Aerogrid, IGN, IGP,swisstopo, and the GIS User CommunityContains information licensed under the Open Government Licence – BritishColumbia and Canada

VISUAL QUALITY ASSESSMENT
HARPER CREEK MINING CORPORATION 19-3
Table 19.2-1. Summary of Applicable Statutes and Regulations for Potential Visual Quality
Effects, Harper Creek Project
Name
Level of
Government Description
Kamloops LRMP Provincial
(BC Ministry of
Environment)
The Kamloops LRMP identifies several Resource Management Zones
which are described in Chapter 18, Section 18.4.3.1. The LRMP
includes visual quality objectives for resource development visual
quality objectives (VQOs) for visually sensitive areas, in terms of their
resource value.
The Kamloops LRMP identifies communities, public use areas, and travel corridors (including roadways,
waterways, and major road corridors) as visually sensitive areas (BC ILMB 1995). The LRMP applies to
the management of visually sensitive areas on Crown land. Visually sensitive areas also include
viewpoints identified through referral or planning processes, where maintaining visual quality is
important. Resource development is permitted and encouraged within visually sensitive areas consistent
with achieving VQOs, when a VQO has been established. Management of visual quality by non-timber
uses is to be managed in accordance with the Forest Practices Code Act (1996b) and other provincial
guidelines for visual quality (BC ILMB 1995).
19.3 SCOPING THE EFFECTS ASSESSMENT
19.3.1 Valued Components
The BC EAO defines Valued Components (VCs) as components “that are considered important
by the proponent, public, First Nations, scientists, and government agencies involved in the
assessment process” (BC EAO 2013). To be included in the Application/EIS, there must be a
perceived likelihood that the VC will be affected by the Project. VCs proposed for assessment
were identified in the AIR (BC EAO 2011) and in the Canadian Environmental Assessment
Agency (CEA Agency 2011) Background Information document.
19.3.1.1 Consultation Feedback on Proposed Valued Components
A preliminary list of proposed VCs was drafted early in Project planning based on the expected
components and activities of the Project, the type of project being proposed, the local area and
region where the Project would be located, and the consultation with federal, provincial, and local
government agencies.
Concerns about potential visual quality effects of the mine and power line were raised by Aboriginal
groups (Appendix 3-F), by government agencies (Appendix 3-J) and the public (Appendix 3-L).
Concerns relating to visual quality effects on public recreation in the Dunn Peak Protected Area
were also raised. A summary of how scoping feedback was incorporated into the selection of
assessment subject areas and VCs is summarized below in Table 19.3-1.
In the AIR (BC EAO 2011), visual quality is identified as a VC under the social subject area.

APPLICATION FOR AN ENVIRONMENTAL ASSESSMENT CERTIFICATE / ENVIRONMENTAL IMPACT STATEMENT
19-4 ERM Rescan | PROJ #0230881 | REV E.1 | JANUARY 2015
Table 19.3-1. Consultation Feedback on Proposed Valued Components
Subject
Area VC
Feedback by*
Issues Raised Proponent Response AG G P/S O
Visual
Quality
x • Dunn Peak Protected Area is
accessed through the Harper Creek
drainage and is within viewing
distance of the proposed mine.
Should discuss potential impact to
Dunn Peak Protected Area
(Ministry of Environment -
Thompson Region, April 15, 2009).
Viewpoints 7 and 14 assess visual
quality effects for the Dunn Peak
Protected Area.
x • The Barriere watershed has high
recreational use including
development along the Barrière
Lakes and hunting and fishing
(Simpcw First Nation,
September 12, 2011).
The viewshed analysis indicates
there will be no visual impacts
around Barrière Lake (see
Figure 19.4-3, Visual Quality
Viewpoint Locations).
x • Visual impact of mine on
surrounding properties
In accordance with section 6.2.3 of
the AIR, potential effects of the
Project from strategic viewpoints
are assessed (e.g., North
Thompson River valley near
Vavenby and surrounding
recreational areas such as
Dunn Peak) (see Section 19.4.2.1
and Figures 19.4-1 and 19.4-2).
x • Visual impact of power line In accordance with section 6.2.3 of
the AIR, potential effects of the
Project from strategic viewpoints
are assessed (e.g., North
Thompson River valley near
Vavenby and surrounding
recreational areas such as
Dunn Peak). Figure 19.4-1 shows
the footprint and study areas in
relation to surrounding parks and
recreational areas. The footprint
(see Figure 19.1-1) includes the
two power line route options, the
rail load out and the Mine
Access Road.
*AG = Aboriginal Group; G = Government; P/S = Public/Stakeholder; O = Other
19.3.1.2 Selecting Valued Components
Based on the results of the assessment of potential interactions between the Project and visual
quality, as identified in Table 19.3-2, on consultations with the EA Working Group, First Nations,
and the public, visual quality was selected as a VC.

VISUAL QUALITY ASSESSMENT
HARPER CREEK MINING CORPORATION 19-5
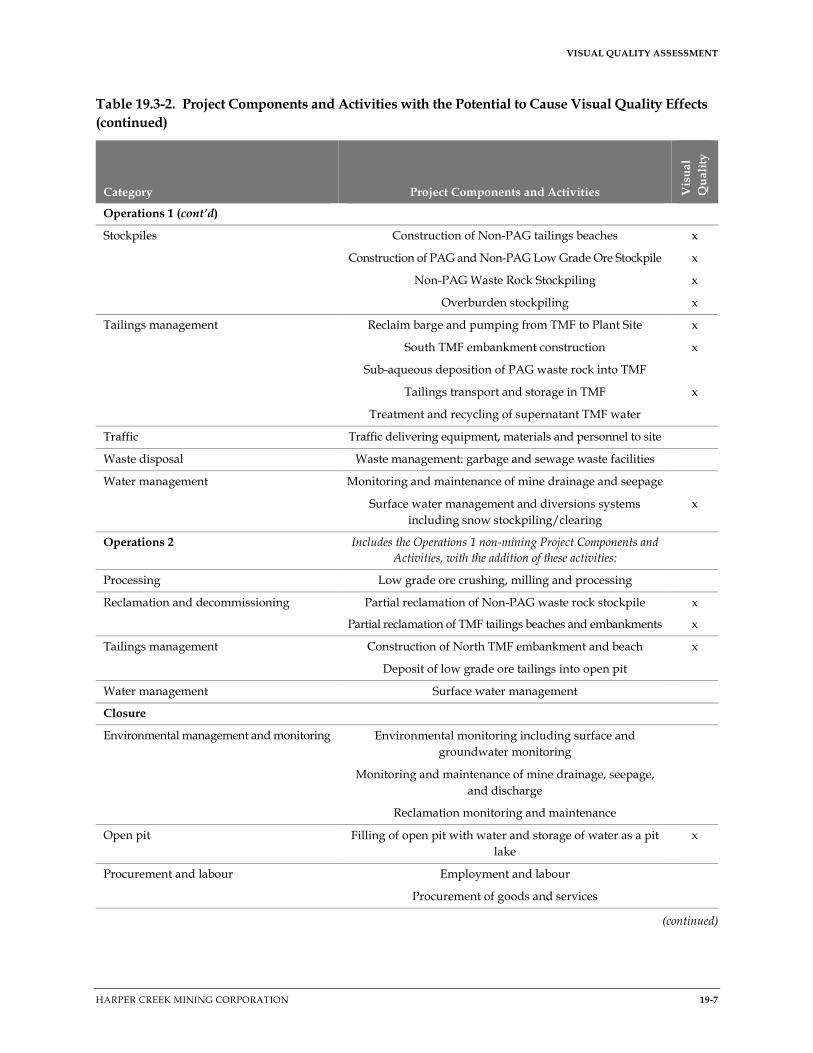
Table 19.3-2. Project Components and Activities with the Potential to Cause Visual Quality Effects
Category Project Components and Activities Vis
ua
l
Qu
ali
ty
Construction
Concrete production Concrete batch plant installation, operation and
decommissioning
x
Dangerous goods and hazardous materials Hazardous materials storage, transport, and off-site disposal
Spills and emergency management
Environmental management and monitoring Construction of fish habitat offsetting sites
Equipment On-site equipment and vehicle use: heavy machinery and
trucks
x
Explosives Explosives storage and use
Fuel supply, storage and distribution Fuel supply, storage and distribution
Open pit Open pit development - drilling, blasting, hauling and
dumping
x
Potable water supply Process and potable water supply, distribution and storage
Power supply Auxiliary electricity - diesel generators
Power line and site distribution line construction:
vegetation clearing, access, poles, conductors, tie-in
x
Processing Plant construction: mill building, mill feed conveyor, truck
shop, warehouse, substation and pipelines
x
Primary crusher and overland feed conveyor installation x
Procurement and labour Employment and labour
Procurement of goods and services
Project Site development Aggregate sources/ borrow sites: drilling, blasting,
extraction, hauling, crushing
x
Clearing vegetation, stripping and stockpiling topsoil and
overburden, soil salvage handling and storage
x
Earth moving: excavation, drilling, grading, trenching,
backfilling
x
Rail load-out facility Rail load-out facility upgrade and site preparation x
Roads New TMF access road construction: widening, clearing,
earth moving, culvert installation using non-PAG material
x
Road upgrades, maintenance and use: haul and access roads x
Stockpiles Coarse ore stockpile construction x
Non-PAG Waste Rock Stockpile construction x
PAG and Non-PAG Low-grade ore stockpiles foundation
construction
x
PAG Waste Rock stockpiles foundation construction x
(continued)

APPLICATION FOR AN ENVIRONMENTAL ASSESSMENT CERTIFICATE / ENVIRONMENTAL IMPACT STATEMENT
19-6 ERM Rescan | PROJ #0230881 | REV E.1 | JANUARY 2015
Table 19.3-2. Project Components and Activities with the Potential to Cause Visual Quality Effects
(continued)
Category Project Components and Activities Vis
ua
l
Qu
ali
ty
Construction (cont’d)
Tailings management Coffer dam and South TMF embankment construction x
Tailings distribution system construction x
Temporary construction camp Construction camp construction, operation, and
decommissioning
x
Traffic Traffic delivering equipment, materials and personnel to
site
Waste disposal Waste management: garbage, incinerator and sewage waste
facilities
Water management Ditches, sumps, pipelines, pump systems, reclaim system
and snow clearing/stockpiling
Water management pond, sediment pond, diversion
channels and collection channels construction
x
Operations 1
Concentrate transport Concentrate transport by road from mine to rail loadout x
Dangerous goods and hazardous materials Explosives storage and use
Hazardous materials storage, transport, and off-site
disposal
Spills and emergency management
Environmental management and monitoring Fish habitat offsetting site monitoring and maintenance
Equipment fleet Mine site mobile equipment (excluding mining fleet) and
vehicle use
x
Fuel supply, storage and distribution Fuel storage and distribution
Mining Mine pit operations: blast, shovel and haul x
Ore processing Ore crushing, milling, conveyance and processing x
Potable water supply Process and potable water supply, distribution and storage
Power supply Backup diesel generators
Electrical power distribution x
Processing Plant operation: mill building, truck shop, warehouse and
pipelines
x
Procurement and labour Employment and labour
Procurement of goods and services
Rail load-out facility Rail-load out activity (loading of concentrate; movement of
rail cars on siding)
x
Reclamation and decommissioning Progressive mine reclamation x
(continued)
VISUAL QUALITY ASSESSMENT
HARPER CREEK MINING CORPORATION 19-7
Table 19.3-2. Project Components and Activities with the Potential to Cause Visual Quality Effects
(continued)
Category Project Components and Activities Vis
ua
l
Qu
ali
ty
Operations 1 (cont’d)
Stockpiles Construction of Non-PAG tailings beaches x
Construction of PAG and Non-PAG Low Grade Ore Stockpile x
Non-PAG Waste Rock Stockpiling x
Overburden stockpiling x
Tailings management Reclaim barge and pumping from TMF to Plant Site x
South TMF embankment construction x
Sub-aqueous deposition of PAG waste rock into TMF
Tailings transport and storage in TMF x
Treatment and recycling of supernatant TMF water
Traffic Traffic delivering equipment, materials and personnel to site
Waste disposal Waste management: garbage and sewage waste facilities
Water management Monitoring and maintenance of mine drainage and seepage
Surface water management and diversions systems
including snow stockpiling/clearing
x
Operations 2 Includes the Operations 1 non-mining Project Components and
Activities, with the addition of these activities:
Processing Low grade ore crushing, milling and processing
Reclamation and decommissioning Partial reclamation of Non-PAG waste rock stockpile x
Partial reclamation of TMF tailings beaches and embankments x
Tailings management Construction of North TMF embankment and beach x
Deposit of low grade ore tailings into open pit
Water management Surface water management
Closure
Environmental management and monitoring Environmental monitoring including surface and
groundwater monitoring
Monitoring and maintenance of mine drainage, seepage,
and discharge
Reclamation monitoring and maintenance
Open pit Filling of open pit with water and storage of water as a pit
lake
x
Procurement and labour Employment and labour
Procurement of goods and services
(continued)

APPLICATION FOR AN ENVIRONMENTAL ASSESSMENT CERTIFICATE / ENVIRONMENTAL IMPACT STATEMENT
19-8 ERM Rescan | PROJ #0230881 | REV E.1 | JANUARY 2015
Table 19.3-2. Project Components and Activities with the Potential to Cause Visual Quality Effects
(completed)
Category Project Components and Activities Vis
ua
l
Qu
ali
ty
Closure (cont’d)
Reclamation and decommissioning Decommissioning of rail concentrate loadout area x
Decommissioning and reclamation of mine site roads x
Decommissioning and removal of plant site, processing
plant and mill, substation, conveyor, primary crusher, and
ancillary infrastructure (e.g., explosives facility, truck shop)
x
Decommissioning of diversion channels and distribution
pipelines
x
Decommissioning of reclaim barge x
Reclamation of Non-PAG LGO stockpile, overburden
stockpile and Non-PAG waste rock stockpile
x
Reclamation of TMF embankments and beaches x
Removal of contaminated soil x
Use of topsoil for reclamation x
Stockpiles Storage of waste rock in the non-PAG waste rock stockpile x
Tailings management Construction and activation of TMF closure spillway x
Maintenance and monitoring of TMF
Storage of water in the TMF and groundwater seepage x
Sub-aqueous tailing and waste rock storage in TMF
TMF discharge to T-Creek
Waste disposal Solid waste management
Post-Closure
Environmental management and monitoring Environmental monitoring including surface and
groundwater monitoring
Monitoring and maintenance of mine drainage, seepage,
and discharge
Reclamation monitoring and maintenance
Open pit Construction of emergency spillway on open pit x
Storage of water as a pit lake x
Procurement and labour Procurement of goods and services
Stockpiles Storage of waste rock in the non-PAG waste rock stockpile x
Tailings management Storage of water in the TMF and groundwater seepage x
Sub-aqueous tailing and waste rock storage
TMF discharge
Note: a column is marked with an X when it has been determined that the Project component or activity could potentially
interact with the VC.

VISUAL QUALITY ASSESSMENT
HARPER CREEK MINING CORPORATION 19-9
19.3.2 Defining Assessment Boundaries
Assessment boundaries define the maximum limit within which the effects assessment and
supporting studies (e.g., predictive models) are conducted. Boundaries encompass the areas within,
and times during which, the Project is expected to interact with the VCs, as well as any constraints
due to political, social, and economic realities, and limitations in predicting or measuring changes.
Boundaries relevant to visual quality are described below.
19.3.2.1 Temporal Boundaries
Temporal boundaries are the time periods considered in the assessment for various Project
phases and activities, and are shown in Table 19.3-3. Temporal boundaries reflect those periods
during which planned Project activities are reasonably expected to potentially affect a VC.
Potential effects will be considered for each phase of the Project, although the largest potential
effect of the Project on visual quality is expected to be Year 23, during the Operations 1 phase.
Table 19.3-3. Temporal Boundaries Used in the Assessment for Visual Quality
Phase
Project
Year
Length of
Phase Description of Activities
Construction -2 and -1 2 years Pre-construction and construction activities.
Operations 1 1 - 23 23 years Active mining in the open pit from Year 1 through to Year 23.
Operations 2 24 - 28 5 years Low-grade ore processing from the end of active mining through to
the end of Year 28.
Closure 29 – 35 7 years Active closure and reclamation activities while the open pit and TMF
are filling.
Post-Closure 36 onwards 50 years Steady-state long-term closure condition following active
reclamation, with ongoing discharge from the TMF and monitoring.
19.3.2.2 Spatial Boundaries
Project Site
The Project Site consists of the mine site with a defined buffer of 500 metres (m) around the
primary Project components, and also includes linear facilities as shown in Figure 19.1-1. Mine
site components include the open pit; the open pit haul road, primary crusher and ore conveyor;
mill plant site with ore processing facilities and intake/outtake pipelines; TMF; overburden,
topsoil, PAG waste rock, and non-PAG waste rock stockpiles; and non-PAG and PAG low-grade
ore stockpiles.
Local Study Area
The local study area (LSA) boundary was created by determining a distance at which a land user
could clearly view the Project. Within 8 km, several shapes and pattern of objects emerge from the
general background based on the description of moderate and low viewing distance ratings
defined by BC MOF 1997. Beyond 8 km the viewer will “see outlines of general shapes and patterns
with little discernible texture and color, and a sense of overall perspective” (BC MOF 2001). The

APPLICATION FOR AN ENVIRONMENTAL ASSESSMENT CERTIFICATE / ENVIRONMENTAL IMPACT STATEMENT
19-10 ERM Rescan | PROJ #0230881 | REV E.1 | JANUARY 2015
LSA boundary includes a radius of 8 km around the Project infrastructure, which will encompass
the foreground and mid-ground view of the landscape (BC MOF 2001; Figure 19.3-1).
Regional Study Area
The regional study area (RSA) boundary was created by determining the maximum distance at
which a land user could see the Project. According to the World Meteorological Organization’s
Guide to Meteorological Instruments and Methods of Observation (WMO 2008), an object must
occupy at least 0.5º of the total view relative to a viewer to be seen, and stand out from its
surroundings (WMO 2006). This means that from a distance of 5 m an object must be at least
4.3 centimetres (cm) in size to be discernible. For the purposes of calculating the viewshed for
the Project infrastructure, a size of 6.5 km was used which corresponds to the maximum
horizontal width of infrastructure components. An area up to 56 km distance from the Project
should therefore encompass all potential areas that could have views of the Project
infrastructure, as indicated in Figure 19.3-1.
19.3.2.3 Technical and Administrative Boundaries
No administrative or technical boundaries apply to the visual quality effects assessment.
19.4 BASELINE CONDITIONS
19.4.1 Regional and Historical Setting
The proposed Project facilities are located on a plateau just north of Harp Mountain at
approximately 1,800 metres above sea level and straddle the boundary between the Headwaters
and Kamloops Forest Districts. The proposed power line, off-site facilities, and part of the
proposed open pit are within the Headwaters Forest District, while all other facilities are within
the Kamloops Forest District.
The Project’s proposed power line and access roads begin in Vavenby. Current access to the
Project Site is via the Jones Creek Forest Service Road (FSR) and/or the Vavenby Mountain FSR.
The Project Site is located southwest of Vavenby and the Southern Yellowhead Highway
(Highway 5). There are several provincial parks in the region. The Project facilities are also
adjacent to a series of designated recreational trails known as the Foghorn-Harp Snowmobile
Trail network. There are recreation facilities servicing several lakes to the south. The area
around the lakes is used for a variety of activities including fishing, canoeing, camping, and
other recreational activities.
The area surrounding the Project has a long history of forestry activities, and has recently been
logged, with a high density of forestry access roads. Forestry is a primary economic activity in
the North Thompson area; however, the industry within the Kamloops Forest District has
experienced recent declines due to mountain pine beetle infestation and other economic
influences (Chapter 18). There are large areas of regenerating forests and clear cuts in the area.
Forestry has had an effect on the visual quality of the area, including the Project Site.

!.
!.
!.
!.
Vavenby
Barriere
North
Thom
pson
Riv
er
£¤5
£¤24
Clearwater
Kamloops
AdamsLake
LittleShuswap
Lake
JohnsonLake
MahoodLake
BowersLake
KamloopsLake
EastBarrière
Lake
NorthBarrière
Lake
SaskumLake
MurtleLake
Bridge
Lake
McNeilLake
ShuswapLake
MaraLake
WhiteLake
RosemondLake
Bonaparte
Lake
MabelLake
MomichLake
HiddenLake
CanimLake
StevensLakes
HunakwaLake
119°0'0"W
119°0'0"W
119°20'0"W
119°20'0"W
119°40'0"W
119°40'0"W
120°0'0"W
120°0'0"W
120°20'0"W
120°20'0"W
120°40'0"W
120°40'0"W
52
°0'0
"N
52
°0'0
"N
51
°40
'0"N
51
°40
'0"N
51
°20
'0"N
51
°20
'0"N
51
°0'0
"N
51
°0'0
"N
50
°40
'0"N
50
°40
'0"N
Figure 19.3-1
Visual Quality Local and Regional Study Areas
Proj # 0230881-0024 | GIS # HCP-21-005
1:900,000
Date: October 28, 2014Projection: NAD 1983 UTM Zone 11N
±
Local Study Area
Midground (1 - 8 km)
Foreground (0 - 1 km)
Regional Study Area
Background (8 -56 km)
!. Community
Highway
Railway
Transmission Line
Project Footprint
Project Site
0 25 50
KilometresContains information licensed under the OpenGovernment Licence – British Columbia and Canada
HARPER CREEK MINING CORPORATION

APPLICATION FOR AN ENVIRONMENTAL ASSESSMENT CERTIFICATE / ENVIRONMENTAL IMPACT STATEMENT
19-12 ERM Rescan | PROJ #0230881 | REV E.1 | JANUARY 2015
There are a variety of commercial and non-commercial land uses in the area. Commercial land use in
the region has largely focused on resource development, including forestry (logging), agriculture,
and mining. Other commercial land uses in the region include ranching and trapping. Public or
non-commercial use includes hunting, hiking, snowmobiling, All Terrain Vehicle (ATV) riding,
boating, and skiing (Chapter 18).
19.4.2 Baseline Studies
19.4.2.1 Objectives
This section summarizes the Visual Impact Assessment (VIA) appended in Appendix 19-A (Platt
2012). The objective of this study was to estimate the potential impact of the Project on visually
sensitive and scenic landscapes in the vicinity of the Project. The VIA includes:
• Viewshed Analysis;
• Digital terrain modeling and development situation;
• Photographic panorama comparison; and
• Relevant planimetric map products.
19.4.2.2 Methods
The methods used to determine where there is the potential for visual quality effects are based
on the procedures in the Visual Impact Assessment Guidebook (BC MOF 2001). This guidebook
provides recommendations to help forest resource managers comply with the Forest Practices
Code Act (1996b).
Spatial information was studied and recorded using ArcGIS. Spatial data containing potentially
sensitive areas identified during the literature and data review were overlaid on GIS-based maps to
compare the various types of data. Locations for field investigation were chosen by overlaying the
potentially sensitive areas with the viewshed analysis results. Panoramic photographs were taken at
each location to confirm both the existing visual conditions and the viewing distances.
19.4.2.3 Viewshed Analysis
A viewshed analysis was performed using the ESRI ArcGIS 10.1 3D Analyst Viewshed tool to
identify the areas that could potentially be viewed from the location of Project infrastructure. The
analysis assumed that an area that could be seen from Project infrastructure could also have a view
of the Project infrastructure. The location and assumed height of proposed infrastructure was
inserted into a digital elevation model (DEM), with an approximate resolution of 20 m, created by
the Centre for Topographic Information (BC MSRM 2002).
19.4.2.4 Sensitive Areas Intersecting with the Viewshed
A review of relevant literature and land use data was conducted to identify potentially sensitive
areas. The following paragraphs provide an overview of the general land use areas visible in the
visual quality LSA and RSA based on this review.

VISUAL QUALITY ASSESSMENT
HARPER CREEK MINING CORPORATION 19-13
Communities and Travel Corridors
The Project could be visible from Vavenby, Clearwater, and stretches of Highway 5.
Parks and Protected Areas
Figure 19.4-1 identifies the parks and protected areas in the visual quality LSA and RSA. The Project
could be visible from areas within the Dunn Peak Protected Area, which is 0.5 km from the Project
Site. The Project may be visible along areas of the Dunn Peak trail, which is accessed through the
Harper Creek Watershed and leads to the base of Dunn Peak. The Dunn Matterhorn Peak is the
highest point in the Shuswap Highlands.
The Project may be visible from areas near Wells Gray Provincial Park, located 22 km from the
Project Site as well as Raft Mountain near Caligata Lake Provincial Park, located 23 km from the
Project Site. The park is used for hiking and recreational fishing, and is also near Raft Mountain
snowmobiling and backcountry ski trails.
Commercial Recreation Tenures
Figure 19.4-2 identifies the commercial recreation tenures in the visual quality LSA and RSA. The
Project could be visible from the following tenures:
• a multiple use tenure near Wells Gray Park, 17 km north of Vavenby and 22 km north of the
Project Site,
• a tenure near the North Thompson River, 15 km west from the Mine Access Road and
northwest of the Project Site;
• a snowmobiling tenure, 54 km from the Project Site;
• three heli-hiking tenures between 48 km and 53 km west of the Project Site;
• a cat-ski tenure, 44 km southeast of the Project Site;
• an alpine skiing tenure south of Clearwater, 17 km east of the Project Site;
• a guided freshwater recreation tenure on the North Thompson River, 11 km west of the
Project Site; and
• a heli-skiing tenure, 26 km east of the access road and 32 km east of the Project Site.
19.4.2.5 Viewpoints
Viewpoints were selected based on the literature review and identification by land users in the
visual quality LSA and RSA. Several visually sensitive areas were identified and locations were
selected for field investigation from several of these areas. A list and map of viewpoint locations is
provided in Table 19.4-1 and Figure 19.4-3, respectively.

!.
!.
!. Vavenby
Barriere
£¤5
AdamsLake
EastBarrière
Lake
NorthBarrière
Lake
DunnLake
SaskumLake
SilenceLake
DutchLake
JohnsonLake
SouthBarrière
Lake
McTaggartLakes H
arp
er
Cre
ek
Barrière
River
Ea
st
Barrière
Riv
e r
Raf
t Rive
r
Nort
hTho
m
pson RiverCle
arw
ate
rR
ive
r
Mad
Riv
er
Clearwater
WellsGray Park
WellsGrayPark
Chu ChuaCottonwood Park
Adams Lake MarinePark - Poplar
Point Site
Adams Lake MarinePark - Spillman
Beach Site
MomichLakesPark
Floodplain Park
CaligataLake Park
Adams LakeMarine Park -
Refuge Bay Site
UpperAdams
River Park
Dunn PeakProtected
Area
North ThompsonIslands Park
NorthThompsonRiver Park
300719
300719
ClearwaterSki Hill
119°20'0"W
119°20'0"W
119°40'0"W
119°40'0"W
120°0'0"W
120°0'0"W
51
°40
'0"N
51
°40
'0"N
51
°20
'0"N
51
°20
'0"N
Figure 19.4-1
Provincial Parks and Protected Areas inthe Local and Regional Study Areas
Proj # 0230881-0004 | GIS # HCP-21-006
Date: October 28, 2014Projection: NAD 1983 UTM Zone 11N
±
Viewshed
Potentially Visible
!. Community
Highway
Resource Road
Transmission Line
Railway
Project Footprint
Project Site
Protected Area*
Provincial Park*
Local Study Area
Midground (1 - 8 km)
Foreground (0 - 1 km)
Regional Study Area
Background (8- 56 km)
0 10 20
KilometresContains information licensed under the OpenGovernment Licence – British Columbia and Canada
HARPER CREEK MINING CORPORATION
*Data accurate to April 30, 2014.
1:400,000
!.
!.
!.
BirchIsland
AdamsLake
NorthBarrière
Lake
SaskumLake
No
rth
Th
om
ps
on
Riv
er
ShuswapLake
MurtleLake
Barriere
Clearwater
Vavenby
£¤5
£¤1 1:2,500,000

Vavenby
Barrière
Harp MountainCabin
£¤5
AdamsLake
EastBarrière
Lake
NorthBarrière
Lake
DunnLake
SaskumLake
SilenceLake
DutchLake
JohnsonLake
SouthBarrière
Lake
McTaggartLakes H
arp
er
Cre
ek
Barrière
River
East B
arrière
R iver
Raf
t Rive
r
Nort
hTho
m
pson RiverCle
arw
ate
rR
ive
r
Mad
Riv
er
Clearwater
UpperPulloutArea
LowerPulloutArea
VavenbyMountain Cabin
FoghornMountain Cabin
300719
300719
SerenityPerformingArts Centre
ClearwaterSki Hill
North BarrièreLake Resort
1
2
3 4 56
7 8
9
1011
12
13
14
1516
17
119°20'0"W
119°20'0"W
119°40'0"W
119°40'0"W
120°0'0"W
120°0'0"W
51
°40
'0"N
51
°40
'0"N
51
°20
'0"N
51
°20
'0"N
Figure 19.4-2
Commercial Recreation Tenures in the Local and Regional Study Areas
Proj # 0230881-0004 | GIS # HCP-21-003
Date: October 28, 2014Projection: NAD 1983 UTM Zone 11N
±
Viewpoint
Viewshed
Potentially Visible
!( Snowmobile Cabin
!(Potential Pullout Area For Snowmobile
!( Tourism Facility
!. Community
Highway
Resource Road
Transmission Line
Railway
Project Footprint
Project Site
Commercial Recreation Tenure
Guided FreshwaterRecreation
Heli Skiing
Cat Skiing
Multiple Use
Snowmobiling
Trail Riding
Guiding TerritoryCertificate*
Local Study Area
Midground (1 - 8 km)
Foreground (0 - 1 km)
Regional Study Area
Background (8- 56 km)
0 10 20
KilometresContains information licensed under the OpenGovernment Licence – British Columbia and Canada
HARPER CREEK MINING CORPORATION
*Data accurate to April 30, 2014.
1:400,000
*Guide Outfitting Tenure dataaccurate to April 30, 2014.
!.
!.
!.
BirchIsland
AdamsLake
NorthBarrière
Lake
SaskumLake
No
rth
Th
om
ps
on
Riv
er
ShuswapLake
MurtleLake
Barriere
Clearwater
Vavenby
£¤5
£¤1 1:2,500,000

Vavenby
Barrière
£¤5
£¤24
AdamsLake
EastBarrière
Lake
NorthBarrière
Lake
DunnLake
SaskumLake
TaweelLake
SilenceLake
MoiraLake
DutchLake
JohnsonLake
SouthBarrière
Lake
McTaggartLakes H
arp
er
Cre
ek
Barr ière
River
No
rth
Th
om
pson
Riv
er
East
Barrière
Riv
er
Raf
t R
iver
No
rth
Tho
mpson RiverC
lea
rwate
rR
ive
r
Mad
River
Clearwater
1
2
34
56
78
9
10
11
12
13
14
17
15 16
119°20'0"W
119°20'0"W
119°40'0"W
119°40'0"W
120°0'0"W
120°0'0"W
120°20'0"W
120°20'0"W
52
°0'0
"N
51
°40
'0"N
51
°40
'0"N
51
°20
'0"N
51
°20
'0"N
51
°0'0
"N
51
°0'0
"N
Figure 19.4-3
Visual Quality Viewpoint Locations
Proj # 0230881-0024 | GIS # HCP-21-002
1:600,000
Date: October 28, 2014Projection: NAD 1983 UTM Zone 11N
±
Viewpoint Location
Local Study Area
Midground (1 - 8 km)
Foreground (0 - 1 km)
Regional Study Area
Background (8 - 56 km)
Viewshed
Potentially Visible
!. Community
Highway
Railway
Transmission Line
Project Footprint
Project Site
0 10 20
Kilometres
Contains information licensed under the OpenGovernment Licence – British Columbia and Canada
HARPER CREEK MINING CORPORATION
VISUAL QUALITY ASSESSMENT
HARPER CREEK MINING CORPORATION 19-17
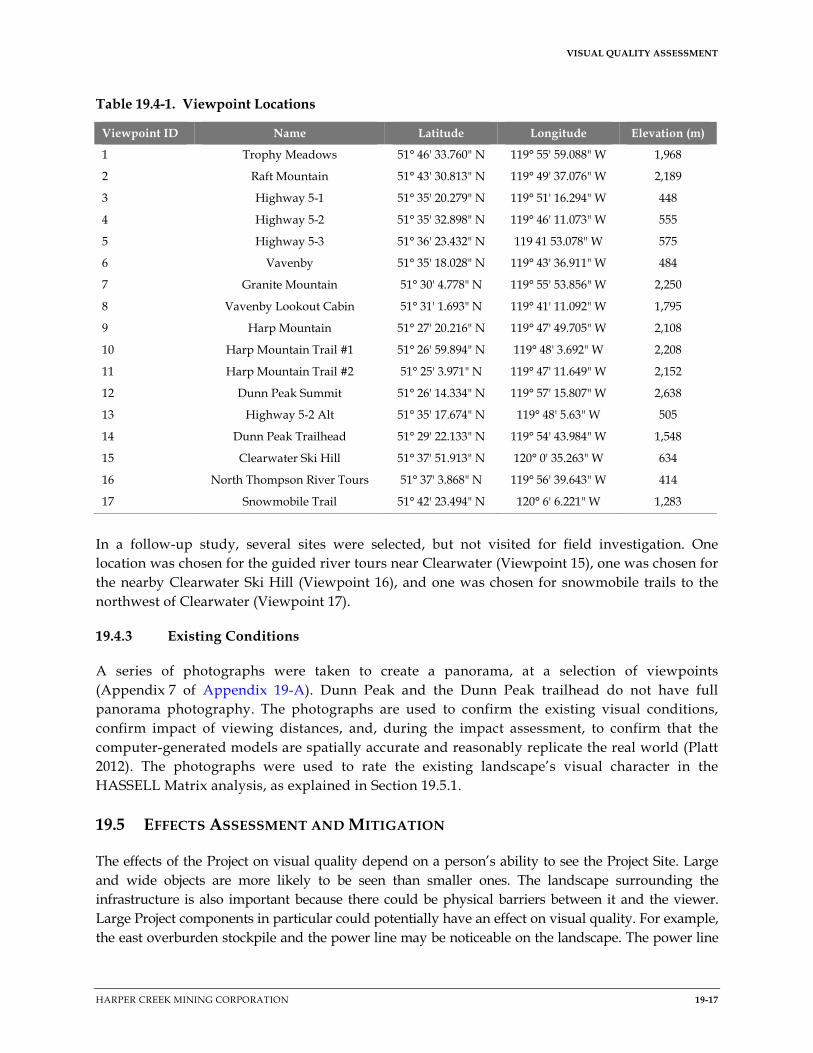
Table 19.4-1. Viewpoint Locations
Viewpoint ID Name Latitude Longitude Elevation (m)
1 Trophy Meadows 51° 46' 33.760" N 119° 55' 59.088" W 1,968
2 Raft Mountain 51° 43' 30.813" N 119° 49' 37.076" W 2,189
3 Highway 5-1 51° 35' 20.279" N 119° 51' 16.294" W 448
4 Highway 5-2 51° 35' 32.898" N 119° 46' 11.073" W 555
5 Highway 5-3 51° 36' 23.432" N 119 41 53.078" W 575
6 Vavenby 51° 35' 18.028" N 119° 43' 36.911" W 484
7 Granite Mountain 51° 30' 4.778" N 119° 55' 53.856" W 2,250
8 Vavenby Lookout Cabin 51° 31' 1.693" N 119° 41' 11.092" W 1,795
9 Harp Mountain 51° 27' 20.216" N 119° 47' 49.705" W 2,108
10 Harp Mountain Trail #1 51° 26' 59.894" N 119° 48' 3.692" W 2,208
11 Harp Mountain Trail #2 51° 25' 3.971" N 119° 47' 11.649" W 2,152
12 Dunn Peak Summit 51° 26' 14.334" N 119° 57' 15.807" W 2,638
13 Highway 5-2 Alt 51° 35' 17.674" N 119° 48' 5.63" W 505
14 Dunn Peak Trailhead 51° 29' 22.133" N 119° 54' 43.984" W 1,548
15 Clearwater Ski Hill 51° 37' 51.913" N 120° 0' 35.263" W 634
16 North Thompson River Tours 51° 37' 3.868" N 119° 56' 39.643" W 414
17 Snowmobile Trail 51° 42' 23.494" N 120° 6' 6.221" W 1,283
In a follow-up study, several sites were selected, but not visited for field investigation. One
location was chosen for the guided river tours near Clearwater (Viewpoint 15), one was chosen for
the nearby Clearwater Ski Hill (Viewpoint 16), and one was chosen for snowmobile trails to the
northwest of Clearwater (Viewpoint 17).
19.4.3 Existing Conditions
A series of photographs were taken to create a panorama, at a selection of viewpoints
(Appendix 7 of Appendix 19-A). Dunn Peak and the Dunn Peak trailhead do not have full
panorama photography. The photographs are used to confirm the existing visual conditions,
confirm impact of viewing distances, and, during the impact assessment, to confirm that the
computer-generated models are spatially accurate and reasonably replicate the real world (Platt
2012). The photographs were used to rate the existing landscape’s visual character in the
HASSELL Matrix analysis, as explained in Section 19.5.1.
19.5 EFFECTS ASSESSMENT AND MITIGATION
The effects of the Project on visual quality depend on a person’s ability to see the Project Site. Large
and wide objects are more likely to be seen than smaller ones. The landscape surrounding the
infrastructure is also important because there could be physical barriers between it and the viewer.
Large Project components in particular could potentially have an effect on visual quality. For example,
the east overburden stockpile and the power line may be noticeable on the landscape. The power line

APPLICATION FOR AN ENVIRONMENTAL ASSESSMENT CERTIFICATE / ENVIRONMENTAL IMPACT STATEMENT
19-18 ERM Rescan | PROJ #0230881 | REV E.1 | JANUARY 2015
will exist for the life of the mine and post-closure; however, the east overburden stockpile may not be
visible until the later stages of mine development, and will be reclaimed post-closure. The TMF and
the open pit cover a large area and could potentially be seen from large distances at higher elevations.
19.5.1 Screening Potential Project Effects on Visual Quality
The relationship between Project components and activities and potential Project effects is
established using an impact matrix. The impact matrix applies a risk-based approach to filter
potential effects into low-, moderate-, or high-risk ratings as a result of Project-VC interactions. This
process serves to focus the effects assessment on the Project components and activities that are likely
to have the most influential effects on each VC, in accordance with the methodology described by
BC EAO (2013). The impact matrix results below evaluate the risk of effects on each VC being
assessed. When data are lacking, professional judgement is used to inform this evaluation. Attention
was given to establishing causal linkages between Project activities and VCs, in order to delineate
the associated risks and potential effects. Risk ratings for each of the VCs as to low, moderate, or
high risks associated with key activities of interaction are described in Table 19.5-1.
Table 19.5-1. Risk Ratings of Project Effects on Visual Quality Valued Components
Project Components and Activities Vis
ua
l
Qu
ali
ty
Construction
On-site equipment and vehicle use: heavy machinery and trucks �
Open pit development - drilling, blasting, hauling and dumping �
Power line and site distribution line construction: vegetation clearing, access, poles, conductors, tie-in �
Plant construction: mill building, mill feed conveyor, truck shop, warehouse, substation and pipelines �
Primary crusher and overland feed conveyor installation �
Aggregate sources/ borrow sites: drilling, blasting, extraction, hauling, crushing �
Clearing vegetation, stripping and stockpiling topsoil and overburden, soil salvage handling and storage �
Earth moving: excavation, drilling, grading, trenching, backfilling �
Rail load-out facility upgrade and site preparation �
New TMF access road construction: widening, clearing, earth moving, culvert installation using non-PAG
material
�
Road upgrades, maintenance and use: haul and access roads �
Coarse ore stockpile construction �
Non-PAG Waste Rock Stockpile construction �
PAG and Non-PAG Low-grade ore stockpiles foundation construction �
PAG Waste Rock stockpiles foundation construction �
Coffer dam and South TMF embankment construction �
Tailings distribution system construction �
(continued)
VISUAL QUALITY ASSESSMENT
HARPER CREEK MINING CORPORATION 19-19
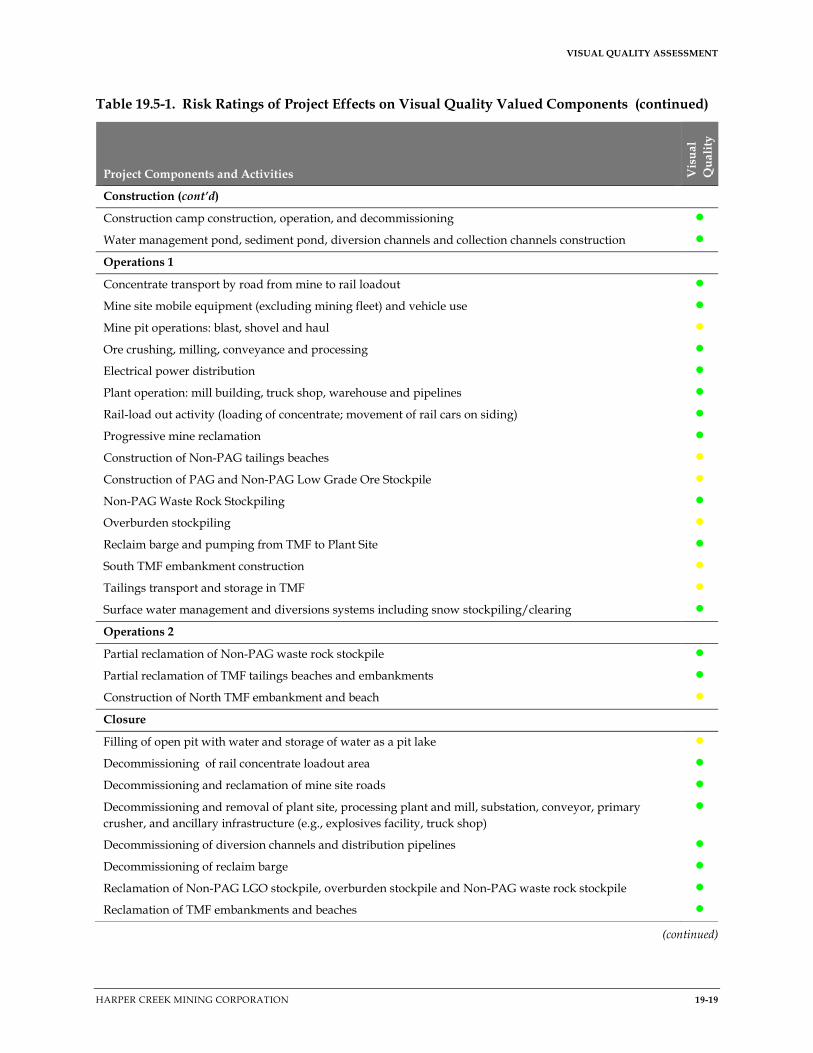
Table 19.5-1. Risk Ratings of Project Effects on Visual Quality Valued Components (continued)
Project Components and Activities Vis
ua
l
Qu
ali
ty
Construction (cont’d)
Construction camp construction, operation, and decommissioning �
Water management pond, sediment pond, diversion channels and collection channels construction �
Operations 1
Concentrate transport by road from mine to rail loadout �
Mine site mobile equipment (excluding mining fleet) and vehicle use �
Mine pit operations: blast, shovel and haul �
Ore crushing, milling, conveyance and processing �
Electrical power distribution �
Plant operation: mill building, truck shop, warehouse and pipelines �
Rail-load out activity (loading of concentrate; movement of rail cars on siding) �
Progressive mine reclamation �
Construction of Non-PAG tailings beaches �
Construction of PAG and Non-PAG Low Grade Ore Stockpile �
Non-PAG Waste Rock Stockpiling �
Overburden stockpiling �
Reclaim barge and pumping from TMF to Plant Site �
South TMF embankment construction �
Tailings transport and storage in TMF �
Surface water management and diversions systems including snow stockpiling/clearing �
Operations 2
Partial reclamation of Non-PAG waste rock stockpile �
Partial reclamation of TMF tailings beaches and embankments �
Construction of North TMF embankment and beach �
Closure
Filling of open pit with water and storage of water as a pit lake �
Decommissioning of rail concentrate loadout area �
Decommissioning and reclamation of mine site roads �
Decommissioning and removal of plant site, processing plant and mill, substation, conveyor, primary
crusher, and ancillary infrastructure (e.g., explosives facility, truck shop)
�
Decommissioning of diversion channels and distribution pipelines �
Decommissioning of reclaim barge �
Reclamation of Non-PAG LGO stockpile, overburden stockpile and Non-PAG waste rock stockpile �
Reclamation of TMF embankments and beaches �
(continued)

APPLICATION FOR AN ENVIRONMENTAL ASSESSMENT CERTIFICATE / ENVIRONMENTAL IMPACT STATEMENT
19-20 ERM Rescan | PROJ #0230881 | REV E.1 | JANUARY 2015
Table 19.5-1. Risk Ratings of Project Effects on Visual Quality Valued Components (completed)
Project Components and Activities Vis
ua
l
Qu
ali
ty
Closure (cont’d)
Removal of contaminated soil �
Use of topsoil for reclamation �
Storage of waste rock in the non-PAG waste rock stockpile �
Construction and activation of TMF closure spillway �
Storage of water in the TMF and groundwater seepage �
Post-Closure
Construction of emergency spillway on open pit �
Storage of water as a pit lake �
Storage of waste rock in the non-PAG waste rock stockpile �
Storage of water in the TMF and groundwater seepage �
Notes:
* Includes Operations 1 and Operations 2 as described in the temporal boundaries.
� = Low risk interaction: a negligible to minor adverse effect could occur; no further consideration warranted.
� = Moderate risk interaction: a potential moderate adverse effect could occur; warrants further consideration.
� = High risk interaction: a key interaction resulting in potential significant major adverse effect or significant concern;
warrants further consideration.
19.5.2 Analyzing Project Effects
Seventeen viewpoints were selected for the Project, as identified in Table 19.4-1. Of the 17 viewpoints,
five were based on established VQO polygons and were assessed using the BC MFLNRO’s Visual
Impact Assessment Procedure, which is explained in Appendix 19-A (Platt 2012). Table 19.5-2
identifies the VQO and perspective view alteration limits used in the assessment.
Table 19.5-2. VQO Definition and Perspective View Alteration Limits
Visual Quality
Objective
Perspective View
Alteration Percentage Definition
Preservation 0 Very small in scale and not easily distinguishable from the pre-project
landscape
Retention 0 – 1.5 Difficult to see, small in scale, and natural in appearance
Partial Retention 1.6 – 7.0 Easy to see, small to medium in scale, and natural not rectilinear or
geometric in shape
Modification 7.1 – 18.0 Very easy to see, and is large in scale plus natural in its appearance, or
small to medium in scale, but with some angular characteristics
The remaining 12 viewpoints were rated using the HASSELL Matrix described in Section 19.5.2.2.
The baseline panoramic photographs were used to rate the existing landscape’s visual character. The
three-dimensional (3-D) visualizations were used to measure the degree of visual modification and
VISUAL QUALITY ASSESSMENT
HARPER CREEK MINING CORPORATION 19-21
the vertical visual effect. The viewshed analysis from specific viewpoints and the 3-D visualizations
were used to calculate the horizontal visual effect. These visual aspects are described further below.
HASSELL Matrix evaluation results for the 12 viewpoints were used to determine potential visual
quality effects. These results are described in Section 19.5.3.
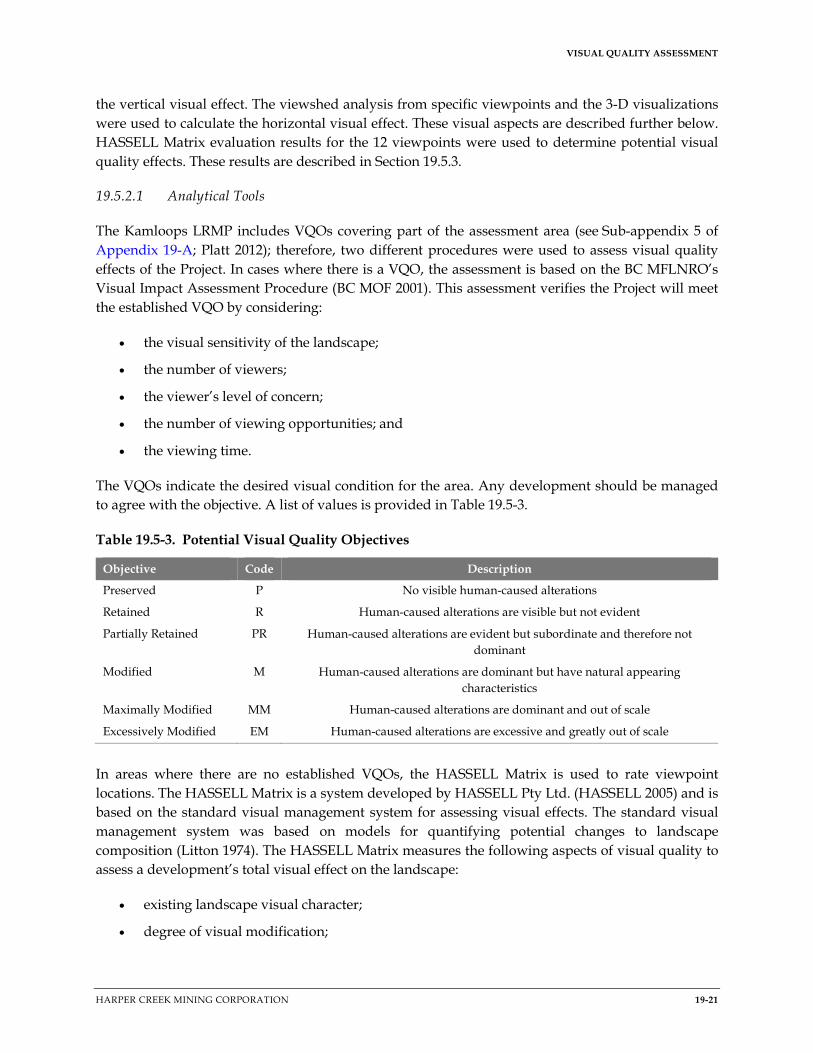
19.5.2.1 Analytical Tools
The Kamloops LRMP includes VQOs covering part of the assessment area (see Sub-appendix 5 of
Appendix 19-A; Platt 2012); therefore, two different procedures were used to assess visual quality
effects of the Project. In cases where there is a VQO, the assessment is based on the BC MFLNRO’s
Visual Impact Assessment Procedure (BC MOF 2001). This assessment verifies the Project will meet
the established VQO by considering:
• the visual sensitivity of the landscape;
• the number of viewers;
• the viewer’s level of concern;
• the number of viewing opportunities; and
• the viewing time.
The VQOs indicate the desired visual condition for the area. Any development should be managed
to agree with the objective. A list of values is provided in Table 19.5-3.
Table 19.5-3. Potential Visual Quality Objectives
Objective Code Description
Preserved P No visible human-caused alterations
Retained R Human-caused alterations are visible but not evident
Partially Retained PR Human-caused alterations are evident but subordinate and therefore not
dominant
Modified M Human-caused alterations are dominant but have natural appearing
characteristics
Maximally Modified MM Human-caused alterations are dominant and out of scale
Excessively Modified EM Human-caused alterations are excessive and greatly out of scale
In areas where there are no established VQOs, the HASSELL Matrix is used to rate viewpoint
locations. The HASSELL Matrix is a system developed by HASSELL Pty Ltd. (HASSELL 2005) and is
based on the standard visual management system for assessing visual effects. The standard visual
management system was based on models for quantifying potential changes to landscape
composition (Litton 1974). The HASSELL Matrix measures the following aspects of visual quality to
assess a development’s total visual effect on the landscape:
• existing landscape visual character;
• degree of visual modification;

APPLICATION FOR AN ENVIRONMENTAL ASSESSMENT CERTIFICATE / ENVIRONMENTAL IMPACT STATEMENT
19-22 ERM Rescan | PROJ #0230881 | REV E.1 | JANUARY 2015
• horizontal visual effect;
• vertical visual effect; and
• distance of visual effect.
19.5.2.2 HASSELL Matrix System
The existing landscape visual character aspect is assigned a value from one to five, as shown in
Table 19.5-4. The degree of visual modification aspect of visual quality is measured by assessing the
degree of visual change to the existing landscape that would result from a project, balanced with
consideration of the landscape’s capacity to absorb or mitigate visual effects, and assigning that a
value from one to five, as shown in Table 19.5-5.
Table 19.5-4. Existing Landscape Visual Character
Description Value Typical Character/Modification
Unmodified
landscape/natural
5 No or minimal effect from anthropogenic sources (e.g., national parks,
coastlines, native forest areas)
Natural transition landscape 4 Changing landscape character associated with the interface between
natural areas and modified rural, pastoral, or agricultural zones
Modified rural landscape,
agricultural, pastoral areas
3 Rural landscape defined by field patterns, forestry plantations, and
agricultural areas, and associated small roads and buildings
Rural transition landscape 2 Landscape associated with the interface between rural, agricultural areas,
and more developed suburban or urban zones
Highly modified landscape,
urban/industrial
1 Substantially developed landscape with a high level of visual effects
associated with buildings, factories, roads, and other related
infrastructure
Source: HASSELL (2005).
Table 19.5-5. Degree of Visual Modification
Degree of Visual
Modification (expressed
as percentage of change) Value Description of Visual Modification
80 to 100 5 Substantial visual effects: the existing landscape character is completely
changed or modified to accommodate the development
60 to 79 4 Increasing visual effects: the landscape is seen as changed permanently with
the development dominating the existing landscape
40 to 59 3 Moderate visual effects: medium level of change to the landscape character;
the landscape is less able to absorb change because of the scale, frequency, or
extent of the development
20 to 39 2 Limited effects: the development is noticeable within the landscape, but the
capacity for the landscape to absorb the development through vegetation
growth or landforms is high
0 to 19 1 No or minor visual effects within the landscape: the development is
considered in keeping with the existing landscape character
Source: HASSELL (2005).

VISUAL QUALITY ASSESSMENT
HARPER CREEK MINING CORPORATION 19-23
The horizontal visual effect aspect of visual quality concerns the human field of vision. This field is
described as an angle of 200º horizontally. Using this fixed visual reference, an assessment is made
of the possible effect of a project within this measurable area. The centre of a proposed development
is established and an angle of 100º on each side is defined. The extent of visual effect within this
zone is then measured. The overall assessment is conducted for an entire development, rather than
for individual infrastructure. This measurement of effect is then described as a percentage of the
panorama and is assigned a value from one to five, as shown in Table 19.5-6.
Table 19.5-6. Horizontal Visual Effect
Degree of Horizontal Visual
Effect of the Panorama
Measured at 200º Field of
Vision (expressed as percentage
of change) Value Description of Visual Modification
80 to 100 5 Substantial visual effects throughout the whole panorama
60 to 79 4 Increasing visual effects
40 to 59 3 Moderate visual effects
20 to 39 2 Limited visual effects
0 to 19 1 No or minor visual effects
Source: HASSELL (2005).
The vertical visual effect aspect of visual quality is measured in a similar way to the horizontal visual
effect, but the field of view is described as 150º. This assessment ensures that the visual effect in relation
to proximity is considered. This aspect is assigned a value from one to five, as shown in Table 19.5-7.
Table 19.5-7. Vertical Visual Effect
Degree of Vertical Visual
Impact of the Panorama
Measured at a 150º Field of
Vision (expressed as percentage
of change) Value Description of Visual Modification
80 to 100 5 Substantial visual effects
60 to 79 4 Increasing visual effects
40 to 59 3 Moderate visual effects
20 to 39 2 Limited visual effects
0 to 19 1 No or minor visual effects
Source: HASSELL (2005).
The distance of visual effect aspect of visual quality is a measurement of how visual effect is
modified by distance. The effect of scale, topography, vegetation, aerosols, and weather changes
with distance and, in turn, changes the degree of visual effect. This aspect is assigned a value from
one to five, as shown in Table 19.5-8.

APPLICATION FOR AN ENVIRONMENTAL ASSESSMENT CERTIFICATE / ENVIRONMENTAL IMPACT STATEMENT
19-24 ERM Rescan | PROJ #0230881 | REV E.1 | JANUARY 2015
Table 19.5-8. Distance of Visual Effect
Distance to Development (km) Value Description
0 to 0.5 5 Adjacent
0.5 to 1 4 Foreground
1 to 3 3 Middle ground
3 to 5 2 Distant middle ground
Over 5 1 Background
Source: HASSELL (2005).
The values of all five visual aspects are then added together resulting in the final visual effect value,
which is used to determine the degree of visual effect, as shown in Table 19.5-9.
Table 19.5-9. Final Visual Effect Rating
Degree of Visual Effect Value
Severe 21 to 25
Substantial 17 to 20
Moderate 13 to 16
Slight 9 to 12
Negligible 5 to 8
Source: HASSELL (2005).
19.5.3 Viewpoints
19.5.3.1 Visual Quality Objectives
Viewpoints 3, 4, 5, 6, and 13 are related to specific VQOs. Sub-appendix 5 of Appendix 19-A (Platt
2012) shows these viewpoints in relation to the established VQOs in the vicinity of the Project.
Viewpoints 3, 4, 5, and 13 are located along Highway 5, while Viewpoint 6 is located near Vavenby.
Viewpoint 3 is 9.5 km west of Vavenby and has an established VQO of Partial Retention, Viewpoint 4
is 3.3 km west and has an established VQO of Modification, Viewpoint 5 is 2.5 km west and has an
established VQO of Modification, and Viewpoint 13 is 5.6 km west of Vavenby and has an established
VQO of Modification. The highway corridor provides sustained side viewing to the south across the
North Thompson River Valley. Existing forest activity can be seen from these locations. Nearby trees
could provide a minor barrier to the view of the Project. Viewpoint 6 is on a popular recreational area
in Vavenby. The recreation sensitivity and significance for Viewpoint 6 is high and has an established
VQO of Partial Retention. Table 19.5-10 lists viewpoints with specific characteristics.
19.5.3.2 Provincial Parks
Viewpoint 1 is in Trophy Meadows in Wells Gray Provincial Park. It is an easily accessible
sub-alpine meadow, which is a popular hiking area. The meadow does not provide a barrier to the
view of the Project.

VISUAL QUALITY ASSESSMENT
HARPER CREEK MINING CORPORATION 19-25
Table 19.5-10. List of Viewpoints with Specific Characteristics
Viewpoint Name VP # Importance* Field of View Direction VQO**
Trophy Meadows 1 5 38.6 165 NA
Raft Mountain 2 5 38.6 176 NA
Highway 5 – 1a 3 2 44 111 PR
Highway 5 – 1b 3 2 71 169 M
Highway 5 – 2 4 2 95 158 PR
Highway 5 – 3 5 3 56 209 PR
Vavenby 6 5 90 182 PR
Granite Mountain 7 2 60 86 NA
Vavenby Lookout Cabin 8 5 45 278 NA
Harp Mountain 9 NA 41 341 NA
Harp Mountain 1 10 5 60 354 NA
Harp Mountain 2 11 5 56 346 NA
Dunn Peak Summit 12 5 45 55 NA
Highway 5 – 2 alt 13 2 65 176 M
Dunn Peak Trailhead 14 5 25 80 NA
Clearwater Ski Hill 15 3 NA
North Thompson River 16 5 NA
Lizard Head Mountain 17 1 NA
* Importance is based on the “Effectiveness Evaluation of Visual Impacts” (BC MOF 2008). Importance of the viewpoint is
determined using a five-point scale from Low (1) to High (5). The scale is calibrated to the viewing duration: (1) Low - glimpse
view, less than 10 seconds, (2) sustained side view, (3) Moderate - sustained focal view, travelling toward the alteration for more
than one minute, (4) viewpoint is at a rest stop, campsite, or other static short-term view location, (5) High - viewpoint is the
location of a community, commercial tourist-related enterprise, or other static long-term view location.
** VQO (Visual Quality Objective) is explained in detail in Figure 3 of Appendix 19-A (Platt 2012).
19.5.3.3 Commercial Recreation Tenures
Viewpoint 2 is on the south slopes of Raft Mountain, near the Willis Snowmobile Cabin. The viewpoint
is upslope of the cabin site. The location is in the area of networks of cross-country ski and snowmobile
trails. The ground is clear and the nearby trees do not provide a barrier to the view of the Project.
The recreation sensitivity and significance for Viewpoint 2 is high.
Viewpoint 7 is on a location near the summit of Granite Mountain, approximately 2.1 km from a
maintained shelter. Granite Mountain is part of the Foghorn-Harp Snowmobile Trail and a
snowmobile commercial recreation tenure.
19.5.3.4 Snowmobile, Multi-use Tenure (Non-commercial)
Viewpoint 8 is on a road landing in an area of recent harvesting, 1,380 m from the Vavenby
Mountain Lookout Cabin. This site was chosen because it will be a good representation of potential
viewing windows created by future forestry harvesting activities.

APPLICATION FOR AN ENVIRONMENTAL ASSESSMENT CERTIFICATE / ENVIRONMENTAL IMPACT STATEMENT
19-26 ERM Rescan | PROJ #0230881 | REV E.1 | JANUARY 2015
Viewpoint 9 is on Harp Mountain, 400 m from the Harp Mountain Cabin. Harp Mountain is a
well-known managed snowmobile area and a popular hiking and cross-country skiing area.
The Foghorn-Harp Snowmobile Trails are designated as active recreation trails by the provincial
recreation inventory. The topography and trees will provide a barrier to the view of the Project.
The recreation sensitivity and significance for Viewpoint 9 is high.
Viewpoints 10 and 11 are on a trail designated by the provincial recreation inventory. Harp Mountain
is a well-known managed snowmobile area and the area is popular for hiking and cross-country
skiing. The recreation sensitivity and significance rating for Viewpoints 10 and 11 is high.
Viewpoint 12 is on the summit of Dunn Peak. The Dunn Peak summit is accessed via the Dunn Peak
Trail. This is the highest point in the Shuswap Highlands and it provides 360º panoramic views.
The recreation sensitivity and significance for Viewpoint 12 is high.
Viewpoint 14 is from the head of Dunn Peak Trail and parking area. The trail is a moderately
popular day and overnight hiking destination and leads to the base of Dunn Peak. The recreation
sensitivity and significance for Viewpoint 14 is high.
19.5.3.5 Alpine Ski Tenure
Viewpoint 15 is from a location within the Clearwater Ski Hill alpine skiing tenure. The recreation
sensitivity and significance for the viewpoint is medium.
19.5.3.6 River Tour Tenure
Viewpoint 16 is from a point within the North Thompson River tenure for river tours. The recreation
sensitivity and significance rating for the viewpoint is high.
Viewpoint 17 is from a point within a snowmobile commercial recreation tenure that leads to Lizard
Head Mountain. The recreation significance and sensitivity recreation rating for the area is low.
19.5.4 Viewpoint Viewshed
A second viewshed analysis was completed from baseline viewpoints. Viewshed modelling
included the same DEM from the BC Terrain Resource Information Mapping program used in the
baseline viewshed analysis. The modelling also included Vegetation Resources Inventory data from
the British Columbia Integrated Land Management Bureau. The DEM was used to provide
topographic information, and the vegetation resources inventory was used to add tree height data to
the modelled landscape 3-D visualization.
19.5.4.1 3-D Visualization
A 3-D visualization was created to model the changes in visual quality for photographs taken during the
baseline study at the selected viewpoints. The surrounding ecosystems were recreated based on a DEM
and GIS shapefiles containing spatial data of water and vegetation features. Proposed Project features
were added to the model to create a view with potential vertical and horizontal changes caused by the
infrastructure. The results from the model can be seen in Sub-appendix 7 of Appendix 19-A (Platt 2012).

VISUAL QUALITY ASSESSMENT
HARPER CREEK MINING CORPORATION 19-27
19.5.5 Viewpoint Assessment
19.5.5.1 Points with Visual Quality Objectives
From Viewpoint 3, portions of the power line right-of-way and the east overburden stockpile are
visible. The proposed power line is visible along a stretch on the upper slope where it parallels the
contours. Following the definition and perspective view alteration limits shown in Table 19.5-2, the
alteration to the landscape accounts for less than a 1% addition. Existing forest activity disturbance
accounts for 1.3%. The top of the east overburden stockpile is visible above a mature stand of balsam
trees that have a projected height of 22 m. This stand is not likely to provide further screening over
the life of the Project. The amount of effect meets the VQO definition of Modification.
From Viewpoint 4, portions of the power line right-of-way and the east overburden stockpile are
visible. The power line is 2 km from the viewpoint, putting it in the middle ground, while the Project
Site is 7.9 km from the viewpoint, putting it in the background. Following the definition and
perspective view alteration limits shown in Table 19.5-2, the alteration to the landscape accounts for
less than a 1% addition. Existing forest activity disturbance accounts for less than 1%. The proposed
power line route has straight tangents and climbs perpendicular to contours, and is visible as it climbs
across contours on the lower and mid-slopes. The mitigating factor here is the variability that already
exists on the landscape. Variable stands of conifer and deciduous trees with varying ages and
undulating terrain help this straight tangent look more natural. The top of the east overburden
stockpile is visible above a mature stand of balsam trees that is anticipated to grow to a height of 22 m.
This stand is not likely to provide further screening over the life of the Project. The amount of effect
meets the VQO definition of Partial Retention.
From Viewpoint 5, the top of the east overburden stockpile is visible and could be prominent in the
viewscape. The power line is 7 km from the viewpoint, putting it in the middle ground, while the
Project Site is 11.2 km from the viewpoint, putting it in the background. A mitigating factor is that
the stockpile is in the background and therefore its visual effect is diminished. The mature stand of
balsam trees in front of the stockpile will not likely provide further screening over the life of the
Project. The amount of effect meets the VQO definition of Partial Retention.
From Viewpoint 13, the east overburden stockpile is visible on the horizon. The stockpile is at the very
top of the slope, 7 km away from the viewpoint, and is above an area with significant tree stand
variability. This variability in stand age, stocking, and height will continue through the life of the Project
as this area is an active forestry cutblock. The amount of effect meets the VQO definition of Modification.
19.5.5.2 Parks
From Viewpoint 1, the PAG low-grade stockpile and north non-PAG stockpile will be visible.
The Project Site is 29 km from the viewpoint, putting it in the background. Topography will block part
of the Project Site. Project facilities would only be visible on clear days, free of haze and low cloud.

APPLICATION FOR AN ENVIRONMENTAL ASSESSMENT CERTIFICATE / ENVIRONMENTAL IMPACT STATEMENT
19-28 ERM Rescan | PROJ #0230881 | REV E.1 | JANUARY 2015
19.5.5.3 Snowmobile, Multi-use Tenure
The proposed mine facilities will be visible from Viewpoint 2, including the pit. The Project Site is
22 km from the viewpoint. However, due to the large scale of the Project, the facilities will be visible
on moderately clear days. The topography will block part of the Project Site.
From Viewpoint 6, the east overburden stockpile is visible. The power line is 2.8 km from the
viewpoint, putting it in the middle ground, while the Project Site is 8.5 km from the viewpoint,
putting it in the background. A mitigating factor is that the stockpile is in the background on an
upper slope. The mature stand of balsam trees in front of the stockpile will not likely provide further
screening over the life of the Project.
Most of the proposed Project facilities are visible from Viewpoint 7, including the stockpiles and the
TMF, the open pit, and the plant facilities. The Project Site is 7 km from the viewpoint. There will be
a high impact on the visual landscape from this viewpoint based on its moderate viewing distance
and the scale of the proposed Project facilities. It is important to note that this viewpoint is from the
Granite Mountain summit and the facilities are not visible from the Foghorn Mountain Meadows
(shelter site) or the designated trail network in the area.
The east overburden stockpile, power line right-of-way, northwest topsoil stockpile, and a small portion
of the open pit are visible from Viewpoint 8. The Project Site is 6 km from the viewpoint. This is an area
of regenerating forests and viewing windows to the Project Site are limited. Over time, as the Project Site
is developed, these viewing windows will change as regenerating forests grow and continue to add to
vegetative screening and new harvesting activities open up new viewing windows.
From Viewpoint 9, the PAG low-grade stockpile and TMF, including the dam embankment, would
be visible. The Project Site is 1.3 km from the viewpoint. The Project facilities are not visible from the
Harp Mountain Cabin.
Viewpoint 10 has an unobstructed view of the proposed mine facilities. The Project Site is 2.5 km
from the viewpoint. Most facilities would be visible from this location, including the plant site
buildings and infrastructure.
From Viewpoint 11 a small portion of the TMF is visible and is approximately 7 km away. The peak
of Harp Mountain is between the viewpoint and the mine facility.
All Project facilities will be visible from Viewpoint 12. However, this viewpoint is not as accessible
to the average recreational user so there will not be a large number of viewers, compared to the
more accessible hiking and snowmobile trails in the area. At a 10 km viewing distance, the mine will
be well beyond the immediate foreground, mitigating its visual impact.
From Viewpoint 14, the PAG stockpiles and the west topsoil stockpiles will be visible when looking
east and will offer potential glimpse views while travelling along the access road. No other mine
facilities would be visible. This area is sparsely vegetated and views of the mine facilities are
expected to be short in duration. It should be noted that the Project facilities are not expected to be

VISUAL QUALITY ASSESSMENT
HARPER CREEK MINING CORPORATION 19-29
visible from the Dunn Peak Trail itself, as it is more heavily vegetated and quickly turns to the south
behind a large ridge.
From Viewpoint 15 looking east the Project Site will likely not be visible. The location is 17 km to the
northwest of the Project. As the Project cannot be seen, no further analysis will be done for this location.
19.5.5.4 River Tour Tenure
Viewpoint 16, which is located within the North Thompson River tenure for river tours, has a view
on the western part of the Project Site (see Figures 19.4-2 and 19.4-3). The viewpoint is 12.5 km
northwest of the Project Site, outside the LSA. The view of Project infrastructure can only be seen for
a portion of the river tour at a distance which makes it hard to discern individual infrastructure
items. Vegetation and topography are mitigating factors for the view.
Viewpoint 17 has a view on the Project from a similar angle as viewpoint 16 only farther away
(22 kilometres). This viewpoint is part of the snowmobile trails northwest from Clearwater. The
viewpoint is located at an elevation of 1,283 metres and therefore has a better and wider view of the
Project. The distance from the Project makes it even harder to discern any individual infrastructure items.
19.5.6 Non-VQO Viewpoints
Table 19.5-11 summarizes the HASSELL Matrix values for each of the sites with no VQO, based on
the information above.
Table 19.5-11. Results of Hassel Matrix for Non-VQO Viewpoints
Viewpoint Area
Existing
Landscape
Visual
Character
Degree of
Visual
Modification
Horizontal
Visual
Effect
Vertical
Visual
Effect
Distance
of Visual
Effect
Final
Visual
Effect
Rating
Degree of
Visual
Effect
1 Trophy
Meadows
5 1 1 1 1 9 Slight
2 Raft Mountain 4 2 2 1 1 10 Slight
7 Granite
Mountain
4 3 4 1 1 13 Moderate
8 Vavenby
Lookout Cabin
3 1 1 1 1 7 Negligible
9 Harp Mountain 4 3 2 2 3 14 Moderate
10 Harp Mountain
Trail #1
4 2 3 1 3 13 Moderate
11 Harp Mountain
Trail #2
5 1 1 1 1 9 Slight
12 Dunn Peak
Summit
4 2 3 1 1 11 Slight
14 Dunn Peak
Trailhead
5 1 2 1 1 10 Slight
(continued)

APPLICATION FOR AN ENVIRONMENTAL ASSESSMENT CERTIFICATE / ENVIRONMENTAL IMPACT STATEMENT
19-30 ERM Rescan | PROJ #0230881 | REV E.1 | JANUARY 2015
Table 19.5-11. Results of Hassel Matrix for Non-VQO Viewpoints (completed)
Viewpoint Area
Existing
Landscape
Visual
Character
Degree of
Visual
Modification
Horizontal
Visual
Effect
Vertical
Visual
Effect
Distance
of Visual
Effect
Final
Visual
Effect
Rating
Degree of
Visual
Effect
15 Clearwater Ski
Hill
NA NA NA NA NA NA NA
16 North
Thompson
River Tours
3 2 1 1 1 8 Slight
17 Lizard Head
Mountain
4 2 2 1 1 10 Slight
19.5.7 Mitigation Measures
With the implementation of mitigation measures, as summarized in Table 19.5-12, effects on visual
quality can be reduced.
Table 19.5-12. Proposed Mitigation Measures and their Effectiveness
Potential Effects Proposed Mitigation Measure
Effectiveness
(Low/Moderate/High/Unknown)
Residual
Effect
(Y/N)
Effect of alteration to the
landscape associated with
the Project components on
visual quality
Re-vegetate disturbed areas not
directly affected by the Project
during the Construction and
Operations phases
Moderate Y
Re-vegetate directly disturbed areas
following decommissioning and
Closure
High N
During the Operations phase, for viewpoints with a moderate classification from the HASSELL
Matrix, mitigation measures include re-vegetating areas not directly affected by the Project. At
viewpoints 2, 9, and 10 there will be a residual effect. These viewpoints are at locations close to the
mine at high elevations. The Project will have a similar effect on all of these sites. A number of
stockpiles and the tailings facility could have an effect on visual quality for viewpoints at higher
elevations. Due to the size of the facilities and the less obstructed view from the high viewpoints, the
facilities will cause a residual effect. The east overburden stockpile will become visible from many
locations as it grows throughout the mine life. Mitigation should be considered when it reaches a
height that will affect views. At closure, the TMF embankments will be vegetated, which will reduce
the residual effect to a non-significant level.
In addition to these mitigation measures, good visual design principles can be taken into
consideration during Project design and construction. Visual design is a process that works with
visual patterns and lines of force to guide changes to development design in ways that meet the
needs of many resource values, including economic, recreational, ecological, and social values. The
following are examples of good visual design principles:

VISUAL QUALITY ASSESSMENT
HARPER CREEK MINING CORPORATION 19-31
• utilizing variable clearing widths - keeping right-of-way clearing as narrow as possible when
safe to do so will create a variable width that makes the corridor more natural in appearance;
this also fits well with hazard tree abatement procedures along the power line corridor;
• utilizing benches in topography and less visually sensitive terrain;
• utilizing screens created from vegetation;
• exploiting visual shadows (hidden areas);
• avoiding straight edges when possible;
• feathering forest edges along cleared areas and right-of-ways; feathered edges look more
natural in appearance;
• re-vegetation of exposed soil and rock;
• rehabilitating road and right-of-ways with grasses and vegetation following construction;
• considering infrastructure aesthetics (using non-reflective material and natural colours); and
• engineering road clearing widths as narrow as possible where safe to do so and feasible for
construction; standard clearing widths can be reduced whenever side slopes and road
prisms allow.
19.5.8 Predicted Residual Effects and Characterization
19.5.8.1 Residual Effects on Visual Quality
As listed in Table 19.5-10, the viewpoints in close proximity to the Project are most likely to be
visually affected by the Project activities to an extent not exceeding a moderate effect. Large and
more intrusive Project infrastructure, such as the TMF or the waste rock stockpile, will be most
visually obvious during the Operations phase. These components will be re-vegetated during
closure, which will limit the extent to a slight effect.
19.5.8.2 Characterization of Effect of Alteration to the Landscape Associated with the Project
Components on Visual Quality
Residual effects will largely occur during the Operations phase. The magnitude of the effect will be
moderate, based on the HASSELL Matrix results for the sites with potential residual effects. The sites that
will have a residual effect are those closest (within 3 km) to the Project. The sites are in the foreground or
middle ground, based on the HASSELL Matrix definition. The effect will be long-term. Even though
construction and operation of the mine will span a long period, the time during which its size will be
significant enough to cause an effect will be much shorter. The frequency of the effect will be sporadic or
regular, depending on the seasonal popularity of the particular site. The effect is partially reversible. The
mitigation measure will help to reduce the effect during the Closure phase; however, the view will be
changed from the current landscape appearance. The resiliency of the area to absorb the effect is neutral.
Topography and vegetation can reduce the effect on the landscape; however, when the Project is in the
foreground, the environment will have less of a mitigating effect. Table 19.5-13 lists the characterization
criteria for visual quality; these are based on Table 8.6-2 Attributes for Characterization of Residual
Effects (Chapter 8 Assessment Methodology), with the exception of the biophysical criterion, which was
developed specifically for the visual quality VC.

Table 19.5-13. Definitions of Specific Characterization Criteria for Visual Quality
Timing Magnitude
Biophysical* (distance to
development in km)
Socio-
economic Duration Frequency Reversibility Resiliency
Construction phase Negligible Foreground (0.5- 1) Individual/
household
Short term One time Reversible Low
Operations phases Low Middle ground (1-3) Community Medium
term
Sporadic Partially
reversible
Neutral
Closure phase Moderate Distant middle ground (3-5) Regional/
Aboriginal
Long term Regular Irreversible High
Post-Closure phase High Background (>5) Beyond
regional
Far future Continuous - -
*Definitions are from Table 19.5-8.

VISUAL QUALITY ASSESSMENT
HARPER CREEK MINING CORPORATION 19-33
19.5.8.3 Likelihood of Effect of Alteration to the Landscape Associated with the Project Components
on Visual Quality
Likelihood refers to the probability of the predicted residual effect occurring and is determined
according to the attributes identified in Table 19.5-14.
Table 19.5-14. Attributes of Likelihood of Effects
Probability Rating Quantitative Threshold
High > P80 (effect has > 80% chance of effect occurring)
Moderate P40 - P80 (effect has 40 - 80% chance of effect occurring)
Low < P40 (effect has < 40% chance of effect occurring)
There is a high likelihood that there will be a residual effect on visual quality caused by the Project.
The Project’s size will ensure that it takes up a large proportion of a view, even from a distance. If
the higher elevation viewpoint locations continue to be used as viewpoints, the view of the Project
will be clearer because there is less topography and dense vegetation to block the view.
19.5.8.4 Summary of Residual Effects on Visual Quality
During the Operations phase, the Project will alter the visual quality of the landscape. When
mitigation measures are applied there will still be a residual effect (Table 19.5-15).
Table 19.5-15. Summary of Residual Effects on Visual Quality
Valued Component
Project Phase
(Timing of Effect) Cause-Effect 1
Mitigation
Measure(s) Residual Effect
Visual Quality Operations Construction of
Project facilities
will alter visual
quality of
landscape
Re-vegetate
disturbed areas not
directly affected by
the Project during
Construction and
Operations
Alteration by
Project on visual
quality
1 “Cause-effect” refers to the relationship between the Project component
or physical activity that is causing the change or effect in the condition of
the receptor VC, and the actual change or effect that results.
The study has taken into account the degree of change caused by the Project. Based on the result of the
HASSEL Matrix on the viewpoints, the scale of the significance of adverse residual effect is moderate,
and therefore the significance rating of this VC would be not significant. The significance rating
applies to the Project as a whole. The individual locations are affected by the development to varying
degrees. The areas further away from the Project are only affected slightly. However, the closer areas
will have a greater degree of change.

APPLICATION FOR AN ENVIRONMENTAL ASSESSMENT CERTIFICATE / ENVIRONMENTAL IMPACT STATEMENT
19-34 ERM Rescan | PROJ #0230881 | REV E.1 | JANUARY 2015
19.5.9 Confidence and Uncertainty in Determination of Significance
The confidence rating for the determination of significance is moderate, although there is confidence
in the modelling techniques and the mitigation effectiveness is known. The baseline data use
conservative estimates on areas that have potential views of the site, as vegetation is not considered
as a possible mitigating factor. There is not enough information available about vegetation height
and density to accurately estimate the effect it has on the visibility of the project. The sites chosen are
those where the Project is most likely to be seen.
19.5.10 Summary of the Assessment of Residual Effects for Visual Quality
There is a high likelihood that the Project will cause an effect on visual quality. After mitigation is
applied the magnitude will be moderate, the geographic extent will be foreground to middle
ground, the duration will be long-term, the frequency will be continuous, the change will be
reversible in the long-term, and the resiliency of the environment to absorb the change is low
(Table 19.5-16). The scale of the significance of the adverse residual effect will be moderate and the
rating is considered to be not significant.
19.6 CUMULATIVE EFFECTS ASSESSMENT
19.6.1 Scoping Visual Quality Cumulative Effects
Cumulative effects are the result of Project-related residual effects interacting with the residual effects of
other human actions (i.e., anthropogenic developments, projects, or activities) to produce a combined
effect. The methodologies used in the cumulative effects assessment (CEA) are outlined in Section 8.7.
19.6.1.1 Valued Components and Project-Related Residual Effects
A moderate residual effect resulting in alteration to the landscape associated with the Project
components and infrastructure during operations was identified in the project effects assessment as
described in Table 19.5-16. This effect will be assessed for cumulative alteration to the landscape.
19.6.1.2 Defining Assessment Boundaries
Similar to the Project-related effects, assessment boundaries define the maximum limit within which
the cumulative effects assessment (CEA) is conducted. A CEA considers past, present, and
reasonably foreseeable future projects and activities, within an effects assessment study area
boundaries or beyond, that may in combination exacerbate a particular effect. Given the nature of
visual effects assessment, its scoping in terms of the need for CEA is approached in a manner that
recognizes the extensive and dissimilar spatial criteria typical of such assessments.

Table 19.5-16. Summary of Key Effects, Mitigation, Residual Effects, Likelihood, Significance, and Confidence
Key Effect
Mitigation
Measures
Summary of Residual Effects
Characterization Criteria
(Magnitude, Biophysical, Socio-
economic, Duration, Frequency,
Reversibility, Resiliency)
Likelihood
(High,
Moderate,
Low)
Significance of Adverse Residual Effects
Confidence
(High,
Moderate,
Low)
Scale
(Minor, Moderate,
Major)
Rating
(Not Significant;
Significant)
Alteration to the
landscape associated
with the Project
components and
infrastructure
Re-vegetate
disturbed areas
not directly
affected by the
Project during
Construction
and Operations
Moderate, foreground to middle
ground, Community Long-term,
Continuous, Reversible, Low
High Moderate No Significant Moderate
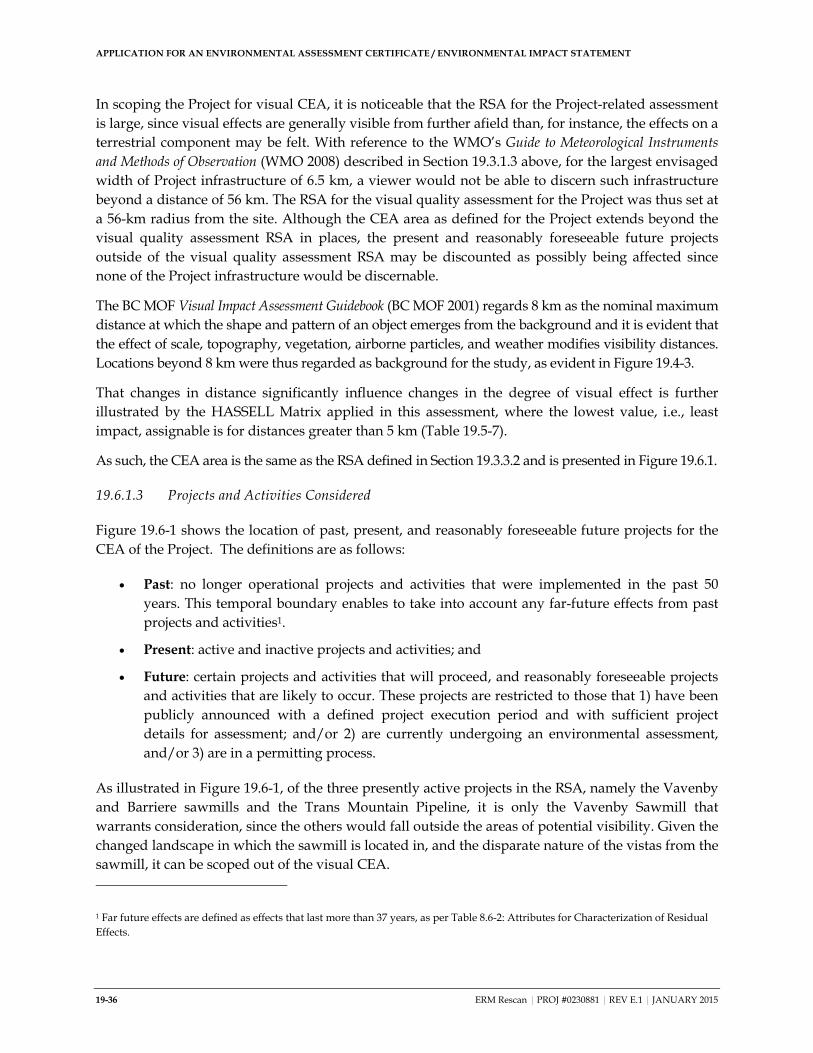
APPLICATION FOR AN ENVIRONMENTAL ASSESSMENT CERTIFICATE / ENVIRONMENTAL IMPACT STATEMENT
19-36 ERM Rescan | PROJ #0230881 | REV E.1 | JANUARY 2015
In scoping the Project for visual CEA, it is noticeable that the RSA for the Project-related assessment
is large, since visual effects are generally visible from further afield than, for instance, the effects on a
terrestrial component may be felt. With reference to the WMO’s Guide to Meteorological Instruments
and Methods of Observation (WMO 2008) described in Section 19.3.1.3 above, for the largest envisaged
width of Project infrastructure of 6.5 km, a viewer would not be able to discern such infrastructure
beyond a distance of 56 km. The RSA for the visual quality assessment for the Project was thus set at
a 56-km radius from the site. Although the CEA area as defined for the Project extends beyond the
visual quality assessment RSA in places, the present and reasonably foreseeable future projects
outside of the visual quality assessment RSA may be discounted as possibly being affected since
none of the Project infrastructure would be discernable.
The BC MOF Visual Impact Assessment Guidebook (BC MOF 2001) regards 8 km as the nominal maximum
distance at which the shape and pattern of an object emerges from the background and it is evident that
the effect of scale, topography, vegetation, airborne particles, and weather modifies visibility distances.
Locations beyond 8 km were thus regarded as background for the study, as evident in Figure 19.4-3.
That changes in distance significantly influence changes in the degree of visual effect is further
illustrated by the HASSELL Matrix applied in this assessment, where the lowest value, i.e., least
impact, assignable is for distances greater than 5 km (Table 19.5-7).
As such, the CEA area is the same as the RSA defined in Section 19.3.3.2 and is presented in Figure 19.6.1.
19.6.1.3 Projects and Activities Considered
Figure 19.6-1 shows the location of past, present, and reasonably foreseeable future projects for the
CEA of the Project. The definitions are as follows:
• Past: no longer operational projects and activities that were implemented in the past 50
years. This temporal boundary enables to take into account any far-future effects from past
projects and activities1.
• Present: active and inactive projects and activities; and
• Future: certain projects and activities that will proceed, and reasonably foreseeable projects
and activities that are likely to occur. These projects are restricted to those that 1) have been
publicly announced with a defined project execution period and with sufficient project
details for assessment; and/or 2) are currently undergoing an environmental assessment,
and/or 3) are in a permitting process.
As illustrated in Figure 19.6-1, of the three presently active projects in the RSA, namely the Vavenby
and Barriere sawmills and the Trans Mountain Pipeline, it is only the Vavenby Sawmill that
warrants consideration, since the others would fall outside the areas of potential visibility. Given the
changed landscape in which the sawmill is located in, and the disparate nature of the vistas from the
sawmill, it can be scoped out of the visual CEA.
1 Far future effects are defined as effects that last more than 37 years, as per Table 8.6-2: Attributes for Characterization of Residual
Effects.
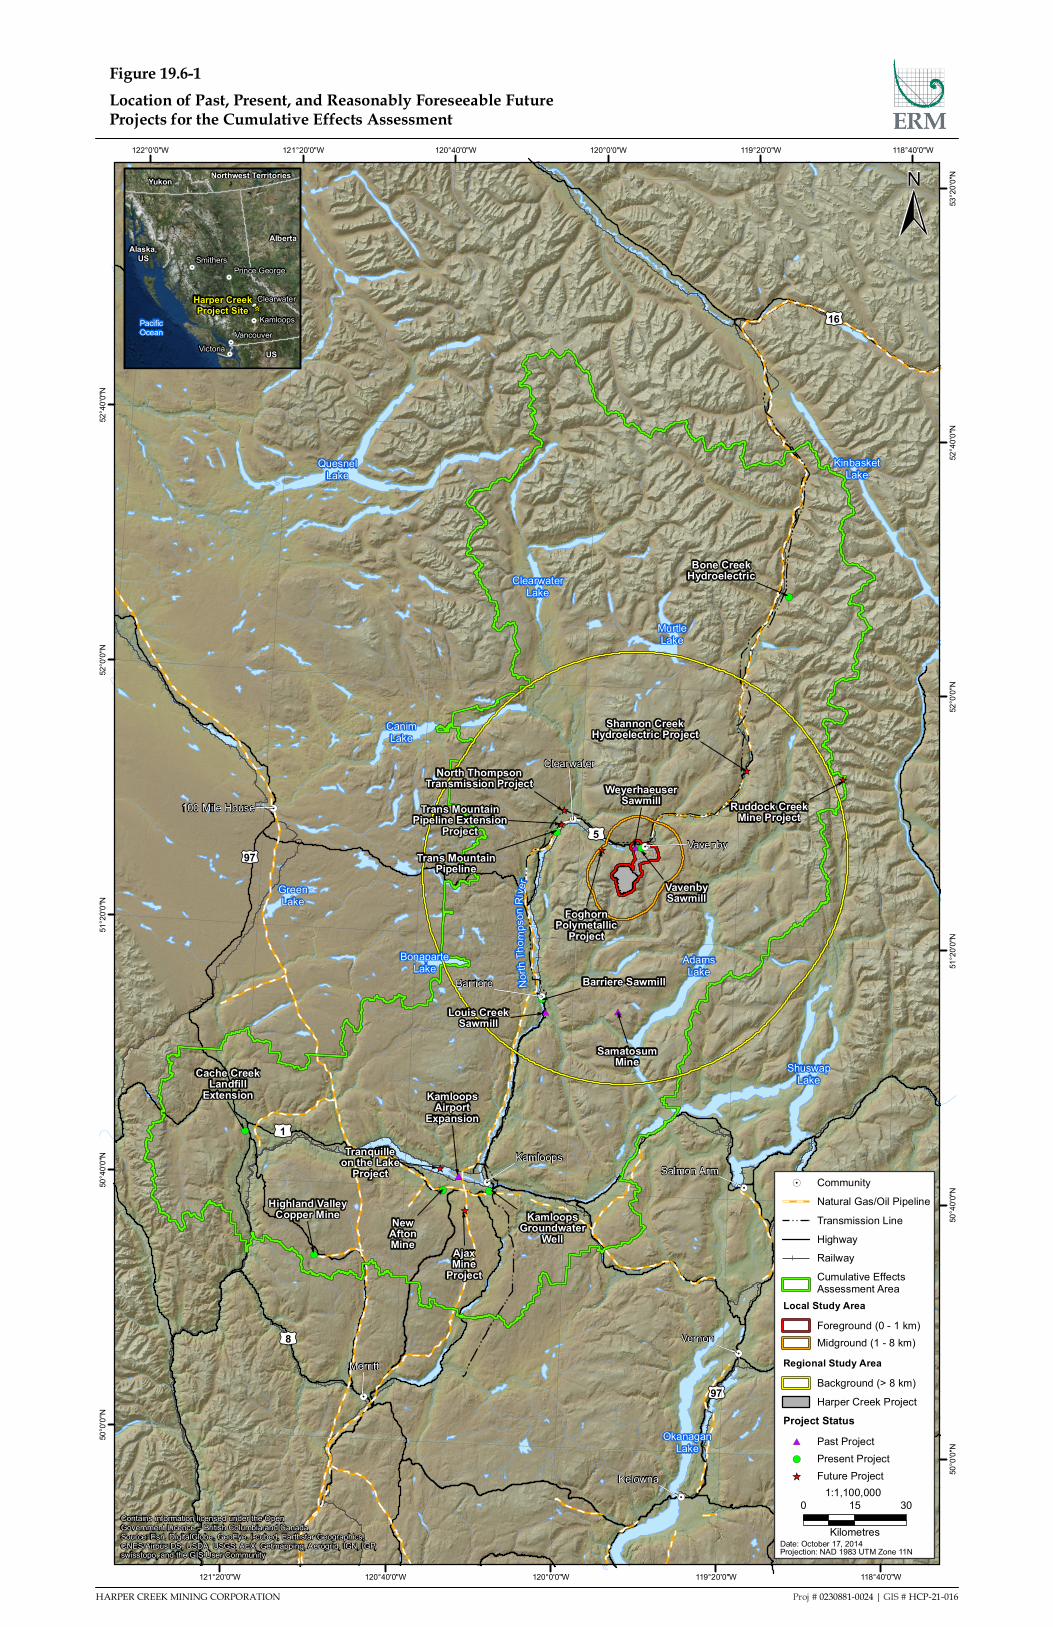
#*
#*#*
!(
!(
!(
!(
_̂
_̂
_̂
_̂
!(
_̂
_̂
_̂
!(
#*
!(
!(
!.
!.
!.
!.!.
!.
!.
!.
!.
Barriere
£¤5
£¤97
£¤8
£¤1
£¤16
£¤97
AdamsLake
ClearwaterLake
Nort
hT
ho
mpson
Riv
er
MurtleLake
CanimLake
BonaparteLake
OkanaganLake
ShuswapLake
GreenLake
QuesnelLake
KinbasketLake
Clearwater
Vavenby
Kamloops
Vernon
Kelowna
Salmon Arm
100 Mile House
Merritt
SamatosumMine
Louis CreekSawmill
Trans MountainPipeline
VavenbySawmill
Barriere Sawmill
Highland ValleyCopper Mine
FoghornPolymetallic
Project
North ThompsonTransmission Project
Ruddock CreekMine Project
WeyerhaeuserSawmill
Trans MountainPipeline Extension
Project
NewAftonMine
Shannon CreekHydroelectric Project
Tranquilleon the Lake
Project
AjaxMine
Project
Bone CreekHydroelectric
KamloopsAirport
Expansion
Cache CreekLandfill
Extension
KamloopsGroundwater
Well
118°40'0"W
118°40'0"W
119°20'0"W
119°20'0"W
120°0'0"W
120°0'0"W
120°40'0"W
120°40'0"W
121°20'0"W
121°20'0"W122°0'0"W
53
°20
'0"N
52
°40
'0"N
52
°40
'0"N
52
°0'0
"N
52
°0'0
"N
51
°20
'0"N
51
°20
'0"N
50
°40
'0"N
50
°40
'0"N
50
°0'0
"N
50
°0'0
"N
1:1,100,000
Date: October 17, 2014Projection: NAD 1983 UTM Zone 11N
±
!. Community
Natural Gas/Oil Pipeline
Transmission Line
Highway
Railway
Cumulative EffectsAssessment Area
Local Study Area
Foreground (0 - 1 km)
Midground (1 - 8 km)
Regional Study Area
Background (> 8 km)
Harper Creek Project
Project Status
#* Past Project
!( Present Project
_̂ Future Project
0 15 30
Kilometres
!.
!.
!.
!.
!.
!.^̀̂̀Harper Creek
Project Site
US
Alberta
Alaska,US
YukonNorthwest Territories
PacificOcean
Clearwater
Victoria
Smithers
Vancouver
Prince George
Kamloops
Contains information licensed under the OpenGovernment Licence – British Columbia and CanadaSource: Esri, DigitalGlobe, GeoEye, i-cubed, Earthstar Geographics,CNES/Airbus DS, USDA, USGS, AEX, Getmapping, Aerogrid, IGN, IGP,swisstopo, and the GIS User Community
HARPER CREEK MINING CORPORATION Proj # 0230881-0024 | GIS # HCP-21-016
Figure 19.6-1
Location of Past, Present, and Reasonably Foreseeable FutureProjects for the Cumulative Effects Assessment

VISUAL QUALITY ASSESSMENT
HARPER CREEK MINING CORPORATION 19-39
Of the four foreseeable future projects in the greater area, namely the Shannon Creek Hydroelectric
Project, North Thompson Transmission Project, Trans Mountain Pipeline Extension Project, and
Foghorn Polymetallic Project, only Foghorn Polymetallic projects warrant consideration, since the
others may be discounted as they would fall outside the areas of potential visibility. Given the
distance to the transmission project, i.e., greater than 8 km, it is regarded as background, and the
location of the Foghorn project on the lower slopes below the Project mine site, also at the 8 km
distance mar, is also regarded as background. There has also been a no registration reserve under the
Mineral Tenure Act (1996f) for uranium and thorium since 2008. As a result there is a high level of
uncertainty regarding the timing for the development of this project, and whether the Project would be
constructed during the life of the Harper Creek Project. Therefore, it is unlikely that the two projects
will interact to create a cumulative residual effect and further assessment is not warranted.
Considering the context of past, present, and reasonably foreseeable future projects that may be
affected by the Project as described in this section, it is considered appropriate to discount any
cumulative effects and scope them out of the Application/EIS. Cumulative effects derived from the
visual quality VC, and specifically the residual effect of alteration to the landscape associated with
construction and operation activities, will thus not be considered further.
19.7 CONCLUSIONS FOR VISUAL QUALITY
Spatial information, including baseline studies, GIS, enhanced photographic imagery, and
recognized tabular assessment methods were used to assess the potential for the visual quality of the
greater area to be affected by the visibility of infrastructure that would comprise the Project. After
considering mitigation measures, a residual effect in the form of the alteration to the landscape
associated with construction and operation activities was identified for visual quality. This residual
effect is predicted to be not significant (Table 19.5-14).
The Project-related residual effect was not carried forward to the CEA, since potential interactions
with other projects were scoped out, as described in Section 19.6.1.
REFERENCES
1996a. Forest Act, RSBC. C. 157.
1996b. Forest Practices Code of British Columbia Act, RSBC. C. 159.
2002a. Environmental Assessment Act, SBC. C. 43.
2002b. Forest and Range Practices Act, SBC. C. 69.
BC EAO. 2011. Harper Creek Copper-Gold-Silver Project: Application Information Requirements for
Yellowhead Mining Inc.’s Application for an Environmental Assessment Certificate. Prepared by
the British Columbia Environmental Assessment Office: Victoria, BC.
BC EAO. 2013. Guideline for the Selection of Valued Components and Assessment of Potential Effects.
Prepared by the British Columbia Environmental Assessment Office: Victoria, BC.
BC ILMB. 1995. Kamloops Land and Resource Management Plan. http://www.for.gov.bc.ca/tasb/slrp/
lrmp/kamloops/kamloops/plan/files/klrmp_full.pdf (accessed May 2014).

APPLICATION FOR AN ENVIRONMENTAL ASSESSMENT CERTIFICATE / ENVIRONMENTAL IMPACT STATEMENT
19-40 ERM Rescan | PROJ #0230881 | REV E.1 | JANUARY 2015
BC MFLNRO. 2011. BC Parks, Ecological Reserves, and Protected Areas.
https://apps.gov.bc.ca/pub/geometadata/metadataDetail.do?from=search&edit=true&sho
wall=showall&recordSet=ISO19115&recordUID=54259 (accessed July 2014).
BC MOF. 1997. Visual Landscape Inventory. Procedures & Standards Manual. Prepared by BC Ministry of
Forest, Forest Practices Branch for the Resource Inventory Committee, Cultural Task Force: n.p.
BC MOF. 2001. Visual Impact Assessment Guidebook. 2nd ed. Prepared by the Forest Practices Branch,
Ministry of Forests: Victoria, BC.
BC MOF. 2008. Protocol for Visual Quality Effectiveness Evaluation, Procedures and Standards. Prepared
by Jacques Marc, Forest and Range Evaluation Program, BC Ministry of Forests and Range
and BC Ministry of Environment: Victoria, BC.
BC MSRM. 2002. Gridded DEM Product Specification Release 2.0 Government of British Columbia.
http://geobc.for.gov.bc.ca/base-mapping/atlas/trim/specs/BC-DEM-specifications-2002-
12.pdf (accessed July 2014).
CEA Agency. 2011. Background Information for the Initial Federal Public Comment Period on the
Comprehensive Study pursuant to the Canadian Environmental Assessment Act of the Harper
Creek Mine Project near Kamloops, British Columbia. Prepared by the Canadian Environmental
Assessment Agency: Ottawa, ON.
HASSELL. 2005. Taralga Wind Farm Landscape Visual Assessment. http://www.planning.nsw.gov.au/
asp/pdf/taralga_app_d_hassell_report-01.pdf (accessed October 2012).
Litton, R. B. 1974. Visual Vulnerability of Forest Landscapes. Journal of Forestry, July, Vol. 72, No. 7,
pp. 392-397.
Platt, S. 2012. Harper Creek Mine Visual Impact Assessment. Prepared for Knight Piésold by S. Platt,
Strategic Group: Campbell River, BC.
WMO. 2008. Guide to Meteorological Instruments and Methods of Observation, WMO-No.8 Seventh edition
World Meteorological Organization.
http://www.wmo.int/pages/prog/www/IMOP/CIMO-Guide.html (accessed July 2014).