19-may-09 strh presentation
TRANSCRIPT

F.N.B. Corporation2Q09 Investor Presentation

Forward-Looking Statements
This presentation of F.N.B. Corporation and the reports F.N.B. Corporation files with the Securities and Exchange Commission often contain “forward-looking statements” relating to present or future trends or factors affecting the banking industry and, specifically, the financial operations, markets and products of F.N.B. Corporation. These forward-looking statements involve certain risks and uncertainties. There are a number of important factors that could cause F.N.B. Corporation’s future results to differ materially from historical performance or projected performance. These factors include, but are not limited to: (1) a significant increase in competitive pressures among financial institutions; (2) changes in the interest rate environment that may reduce interest margins; (3) changes in prepayment speeds, loan sale volumes, charge-offs and loan loss provisions; (4) general economic conditions; (5) legislative or regulatory changes that may adversely affect the businesses in which F.N.B. Corporation is engaged; (6) technological issues which may adversely affect F.N.B. Corporation’s financial operations or customers; (7) changes in the securities markets or (8) risk factors mentioned in the reports and registration statements F.N.B. Corporation files with the Securities and Exchange Commission. F.N.B. Corporation undertakes no obligation to revise these forward-looking statements or to reflect events or circumstances after the date of this presentation.
2

Outline
Ø Profile, Businesses, and Strategies
Ø Investments, Lending and Credit Quality
Ø Financials
Ø Investment Thesis3

Profile
Based in Hermitage, PA., F.N.B. Corporation (NYSE: FNB) ranks 5th among PA-based banks with $8.5B in total assets.
Ø Bank Charter: 1864Ø Market Capitalization: $767MØ Institutional Ownership: 40.8%Ø Branches: 225Ø Loan Production Offices: 7Ø Consumer Finance Offices: 57
4Market capitalization reflects 11-May-09 closing price of $8.54 per share and 89.8M shares outstanding.

Board Leadership
Ø Fourteen Independent Directors
Ø Seven Former Financial Services Executives
Ø Three Involved as Financial Services Investors
ØMonthly Board Meetings5

Executive Management Team
Name Position
Years of Banking
Experience
Steve Gurgovits Chairman, President and CEO 48
Brian LillyCFO and Director of Corporate Services
29
Vince Delie President, Banking Group 22
Gary GuerrieriChief Credit Officer and Group Executive, Lending Support & Specialized Lending
25
Louise LowreyGroup Executive, Technology & Support
35
6

Strategy
Ø Operating Strategy• Manage our business for profitability and growth
Ø Expansion Strategy• Expand our footprint with opportunistic acquisitions
Ø Capital Management Strategy• Exceed regulatory “Well Capitalized” measures• Return excess capital to shareholders in the form of
dividends7

Operating Strategy
8
ØManage our business for profitability and growth
ØOperate in markets we know and understand
ØMaintain a low-risk profile
ØDrive growth through relationship banking
ØFund loan growth through core deposits
ØTarget neutral asset / liability posture to manage interest rate risk
ØBuild fee income sources
ØMaintain rigid expense controls

9
F.N.B.Corporation
Well Diversified Business
BankingBanking
InsuranceInsurance
ConsumerConsumerFinanceFinance
MerchantMerchantBankingBanking
WealthWealthManagementManagement

History of Banking Expansion
10
July 2004
Morrell Butz
& Junker
October 2005
North East Bancorp, Inc.
$68M in Assets
April 2008
Omega Financial Corporation
$1,781M in Assets
February 2005
NSD Bancorp, Inc.
$503M in Assets
Nov 2005
Penn Group Insurance
August 2008
Iron and Glass Bancorp
$302M in Assets
April 2004
TICO Credit
$10M in Assets
October 2004 Slippery Rock
Financial Corporation
$335M in Assets
May 2006
The Legacy Bank
$375M in Assets
• 6 Bank Acquisitions - $3.4B Assets• 2 Insurance Acquisitions• 1 Consumer Finance Acquisition
January 2004
Post Spin-off of Florida Operations
$4,557M in Assets

Banking Locations
11Northwest Region Central Mountain Region
Pittsburgh Region Capital Region

Market Characteristics
Ø Stable Markets
Ø Modest Growth
Ø #1 Ranking in State
College
Ø #7 Ranking in
Pittsburgh
Ø Regional
Management
Ø Local Advisory Boards
12
FNB RegionMarket Size Deposits (1)
FNB Deposit
Ranking (1)
FNBBranches
Pittsburgh $69.8B 7th 70
Northwest $23.5B 3rd 55
Capital $19.2B 9th 25
Central Mountain
$10.8B 1st 75
(1) Source: SNL as of June 30, 2008

Loan Mix
$0
$1
$2
$3
$4
$5
$6
2004 2005 2006 2007 2008 1Q09
Indirect Installment
Residential Mortgage
Consumer Credit
Direct Installment
Commercial
13
$Bill
ions
1Q09 YOY Organic Loan Growth of 2.6%
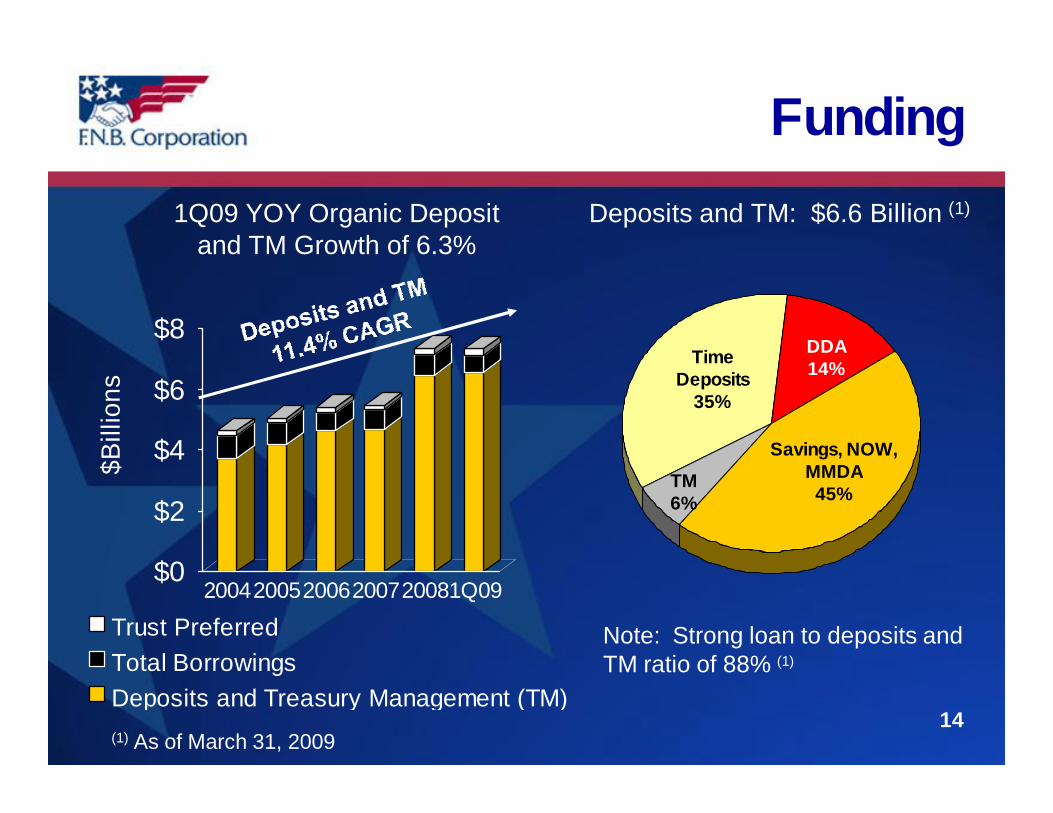
Funding
$0
$2
$4
$6
$8
200420052006200720081Q09
Trust PreferredTotal BorrowingsDeposits and Treasury Management (TM)
14
$Bill
ions
1Q09 YOY Organic Depositand TM Growth of 6.3%
Time Deposits
35%
Savings, NOW, MMDA
45%
DDA14%
TM6%
Deposits and TM: $6.6 Billion (1)
Note: Strong loan to deposits and TM ratio of 88% (1)
(1) As of March 31, 2009

F.N.B.Corporation
Well Diversified Business
BankingBanking
InsuranceInsurance
ConsumerConsumerFinanceFinance
MerchantMerchantBankingBanking
WealthWealthManagementManagement
15

16
Wealth Management
Ø Trust, Fiduciary and Institutional Investment Services• Over 70 Years Managing Wealth
• $2.0 Billion Under Management at March 31, 2009
Ø Individual Investment Services• Brokerage, Mutual Funds and Annuities
• Life and Long-Term Care Insurance Planning
Ø Strong Performance• 1Q09 ROTCE 55.3% (1)
• 1Q09 ROE 13.3%
(1) Return on average tangible common equity (ROTCE) is calculated by dividing net income less amortization of intangibles by average common equity less average intangibles.
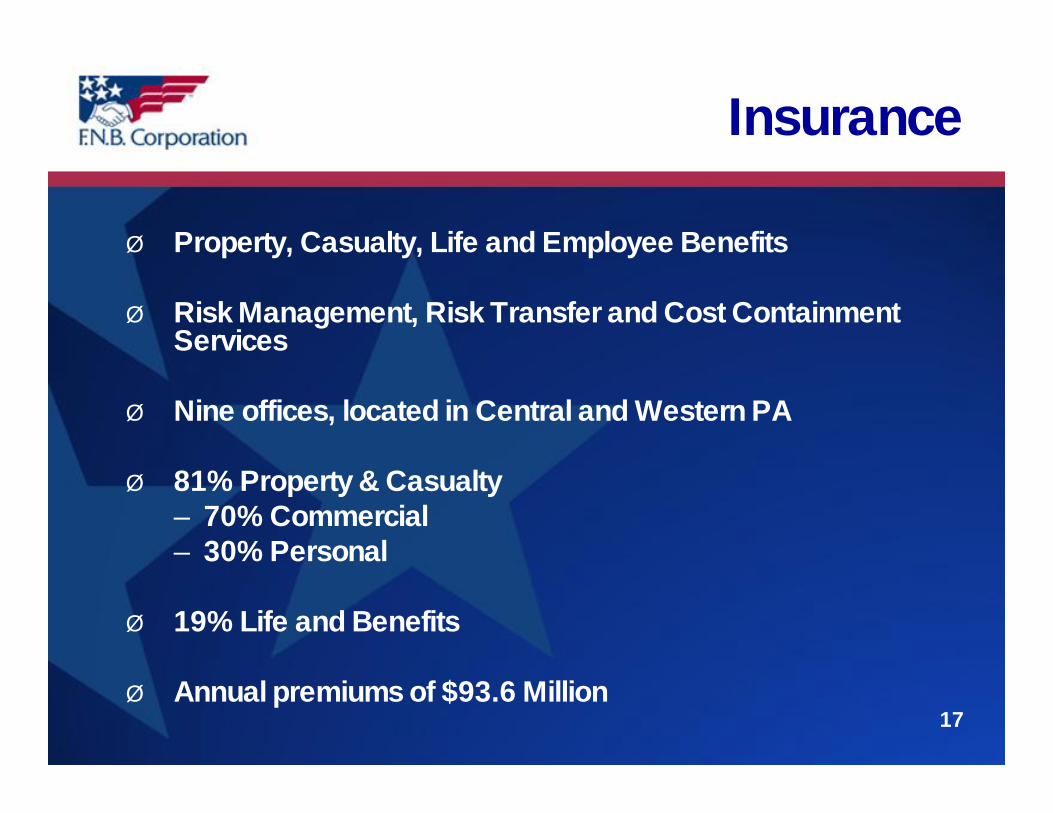
Insurance
Ø Property, Casualty, Life and Employee Benefits
Ø Risk Management, Risk Transfer and Cost Containment Services
Ø Nine offices, located in Central and Western PA
Ø 81% Property & Casualty– 70% Commercial– 30% Personal
Ø 19% Life and Benefits
Ø Annual premiums of $93.6 Million17

18
Regency Finance Co.
Ø 80 Years of Consumer Lending Experience
Ø 57 Offices
Ø High-Performing Affiliate• 1Q09 ROTCE 37.0% (1)
• 1Q09 ROA 2.9%
• 1Q09 ROE 32.3%
Consumer Finance
Pennsylvania
Tennessee
Ohio
(1) Return on average tangible common equity (ROTCE) is calculated by dividing net income less amortization of intangibles by average common equity less average intangibles.

Sales Finance Direct Loans Real Estate
Regency Finance Co. Loan Portfolio − $153 Million85% of Real Estate Loans are First Mortgages
9%40%
51%
As of March 31, 2009
Consumer Finance
19

20
Merchant Banking
As of March 31, 2009
F.N.B. Capital Corp.
Ø Founded in the Fourth Quarter of 2005
Ø Flexible Terms – Mezzanine Debt and Private Equity
• Focus on Stable, Growing Companies
• Investments as low as $1 Million
Ø Total Outstandings $14.6 Million
Ø Completed 12 Transactions

INVESTMENTS, LENDING AND CREDIT QUALITY

Earning Assets-Investments
Loans $5.8B$1.3B
AmountInvestment Ratings (in $Millions)
Mortgage AAA $ 841Backed
Agencies AAA $ 218
Municipals AA = 65% $ 176A = 31%
BBB = 4%
Private Label AAA = 59% $ 61CMO’s AA = 11%
B = 30%
Trust Preferred A = 15% $ 24(Pools and C = 85%
Single Issuer)
Bank Stocks $ 3
TOTAL $1,323
Investments
(1) Investment amounts are shown in accordance with GAAP.
(2) Excludes Federal Reserve Bank Stock of $30 million and FHLB Stock of $28 million.

Loan Portfolio Composition
$5.8 Billion Outstanding
23
$1.0 Billion CRE Non-Owner Occupied (excluding Florida)
Consumer Home Equity
20%
Residential Mortgage
10%
Indirect9%
Regency3%
Florida5%
CRE: Owner Occupied
18%
CRE: Non-Owner Occupied
17%Commercial& Industrial
15%
Other3%
Other19%
Retail19%
Office21%
Apartment11%
Residential13%
Warehouse/Mfg13%
Vacant Land3%
Condo1%
Construction loans & Land Development loans totaled $179.2 million and $59.9 million, respectively, or 5.5% and 1.8%, respectively, of the Corporation’s total Commercial loans.

Profile of Florida Loans
Income Producing RE
28%
Residential Construction
9%
Commercial Construction
11%
Land Development7%
Commercial Land24%
Residential Land18%
C & I2%
Owner Occupied
RE1%
Ø Underwriting• Weighted-average loan
to value of 71% (65% net of ALLL)
• Most with personal guarantees
Ø Credit Quality• 32% Non-performing
loans / total loans• 9% Allowance for loan
losses/ loans
Ø 5% of Total Loan Portfolio
$302 Million in Total Outstandings as of March 31, 2009
24

Credit Quality
NCOs % of Average Loans
0.00%
0.15%
0.30%
0.45%
0.60%
0.75%
0.90%
2004 2005 2006 2007 2008 1Q09
Bank Regency Florida
1.06% 1.23%
1.13% 1.05% 0.80%
0.94%
2.62%2.82%
0.0%
0.5%
1.0%
1.5%
2.0%
2.5%
3.0%
3.5%
2004 2005 2006 2007 2008 1Q09
NPAs (1) % of Total Loans + OREO
1.49% 1.35%1.24%
1.22%
1.80% 1.78%
1.38% 1.38%
0.0%
0.5%
1.0%
1.5%
2.0%
2.5%
3.0%
2004 2005 2006 2007 2008 1Q09
Reserves % of Total Loans
Dashed line excludes Florida
Dashed line excludes Florida
(1) Excludes non-performing investments

FINANCIALS

First Quarter Results
1Q09 1Q08Profitability:
Earnings per Common Share $0.16 $0.27Return on Tangible Common Equity (1) 17.48% 24.24%Return on Tangible Assets (2) 0.87% 1.18%
Operating: Loan Growth--Reported 32.2% 3.6%Loan Growth--Organic Y/Y 2.6% 3.6%
Deposit Growth--Reported (3) 39.4% 1.7%Deposit Growth--Organic Y/Y (3) 6.3% 1.7%
Net Interest Margin 3.70% 3.73%Efficiency Ratio 63.06% 59.79%
(1) Return on average tangible common equity (ROTCE) is calculated by dividing net income less amortization of intangibles by average common equity less average intangibles.
(2) Return on average tangible assets is calculated by dividing net income less amortization of intangibles by average assets less average intangibles.
(3) Includes Treasury Management Accounts.

EPS Analysis
1Q09 1Q08
Earnings per Share – Reported $0.16 $0.27
Adjustments (After Tax): Credit-Related Costs (1) 0.10 0.04 Other Non-Recurring (2) (0.00) (0.01)
Pre-Credit Cost / Run RateEarnings per Share $0.26 $0.30
(1) Includes Provision, OREO and NPA Carrying Costs. (2) Includes CEO departure, gain on the sale of building in 1Q09
and VISA gain in 1Q08.28
(Pre-Credit and Run Rate Adjusted)
Analysis: Higher FDIC, Pension = ($0.02) CPP Capital = $(0.02)
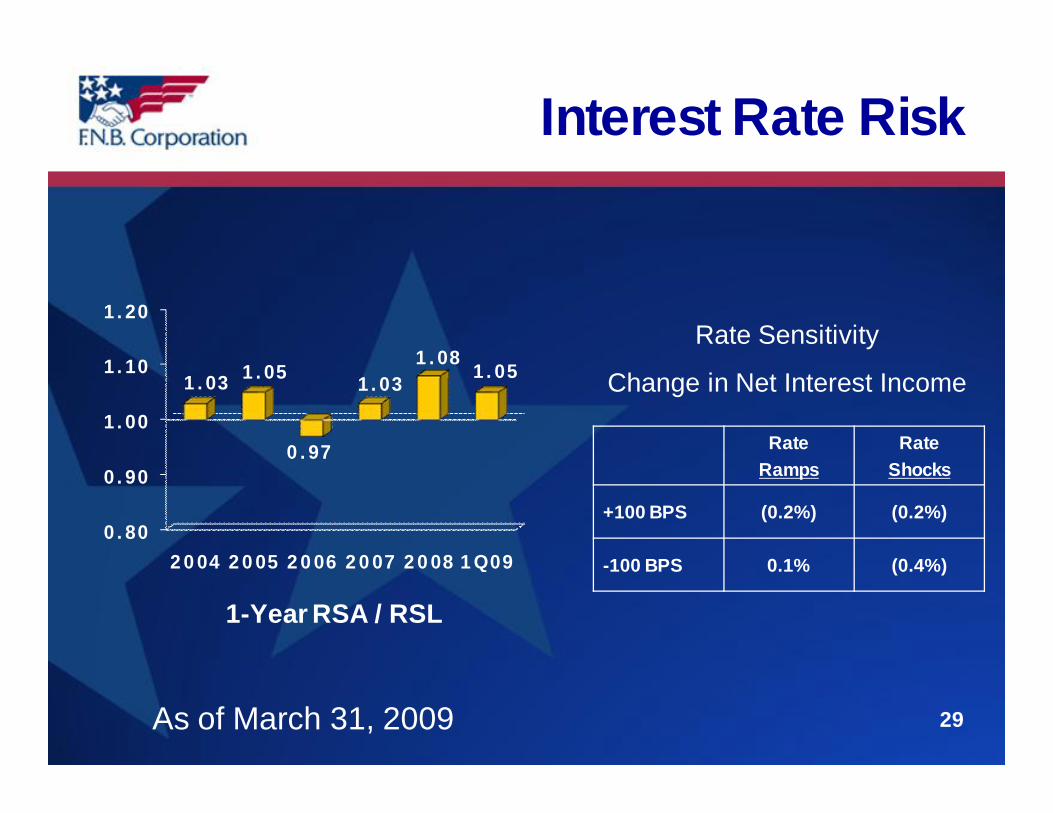
Interest Rate Risk
Rate
Ramps
Rate
Shocks
+100 BPS (0.2%) (0.2%)
-100 BPS 0.1% (0.4%)
0.80
0.90
1.00
1.10
1.20
2004 2005 2006 2007 2008 1Q09
1.03 1.05
0.97
1.031.08
1.05
Rate Sensitivity
Change in Net Interest Income
1-Year RSA / RSL
As of March 31, 2009 29

12.5%
11.1%
8.67%
4.54%
11.1%9.7%
7.34%
4.51%
0%
2%
4%
6%
8%
10%
12%
14%
Well Capitalized
30
Dec 31, 2008 Mar 31, 2009Regulatory “Well Capitalized”Threshold
Includes $100 million in CPP as of March 31, 2009
Total Risk-Based
Tier-One LeverageTangible
Common Equity

INVESTMENT THESIS

Long-Term Investment Thesis
Targeted EPS Growth 5-6%
Expected Dividend
Payout Ratio 65-75%
4-6%
= Total Shareholder Return 9-12%
32

Total Shareholder Return
YTD ’09
May 11th
1-Year
‘08
3-Year
‘06 – ‘08
5-Year
‘04 – ‘08
F.N.B. Corporation (31.7)% (3.7)% (7.5)% (4.8)%
Regional Peers (27) Median
F.N.B. Percentile Rank
(22.2)%
32nd
(4.3)%
54th
(10.4)%
54th
(7.2)%
54th
National Peers (59) Median
F.N.B. Percentile Rank
(22.0)%
37th
(8.6)%
57th
(24.0)%
75th
(12.1)%
60th
33F.N.B. is not included in peer medians. Higher is better for percentile rankings.
Cumulative Returns 2004 through 2008

Creating Long-Term Value
Ø Experienced Leadership
ØDiverse Revenue Sources
ØHigh Performing Results Focused
Ø Lower Risk Profile
Ø Sensible Expansion Strategy
34

Thank You
35