18 may 2017 burberry group plc...burberry group plc preliminary results for the year ended 31 march...
TRANSCRIPT

1
18 May 2017 Burberry Group plc
Preliminary results for the year ended 31 March 2017
FY 2017 revenue of £2.8bn and adjusted PBT of £462m in year of transition
Burberry continued to take strategic actions to elevate its luxury retail and digital business in FY 2017, particularly in wholesale and Beauty, to strengthen the brand and reposition for growth
Strategic progress Strengthened leadership with experience from luxury and business transformation. Key appointments also made in product, customer experience and technology Targeted cost savings on track. Delivered £20m in FY 2017, planned to increase to c.£50m in FY 2018 and to at least £100m annualised by FY 2019. Announced new business service centre in Leeds with plans to relocate roles from London Coty strategic partnership to accelerate Beauty growth receives regulatory approval Encouraging early success with key revenue drivers, including:
- Product focus: newness and innovation outperformed; strength in leather goods led by mid-teens growth in bags
- Productive space: improved mainline retail conversion and retention - E-commerce leadership: growth in digital as we invest in omni-channel
Financial performance Revenue £2.8bn, down 2% underlying, up 10% at reported FX
- Retail 77% of revenue, up 3% underlying with comparable sales up 1% - Wholesale down 14% underlying and licensing down 48% underlying
Adjusted profit before tax up £42m to £462m in line with guidance, down 21% underlying, in part due to taking strategic actions to elevate the brand
Reported profit before tax £395m (2016: £416m), after adjusting items Free cash flow of £465m, net cash up £149m, total year-end net cash of £809m
Enhanced capital returns to shareholders - New capital allocation framework defines clear priorities for uses of cash - Full year dividend 38.9p, up 5% and £100m of initial £150m share buyback
completed; in addition a new £300m buyback to be completed in FY 2018 including the distribution of the upfront sum from Coty
Christopher Bailey, Chief Creative and Chief Executive Officer, commented: “2017 was a year of transition for Burberry in a fast changing luxury market. The actions we have taken to lay the foundations for future growth are yielding early benefits and I remain confident that these will build over time. Marco Gobbetti assumes the role of CEO from July. With his extensive experience in the sector, we will build on these foundations to elevate and strengthen the brand further and take Burberry to the next level as a global luxury retail and digital business. I am excited to work closely with him in this next chapter.”

2
All metrics and commentary in the Group Financial Highlights and Business and Financial Review exclude adjusting items unless stated otherwise. The following alternative performance measures are presented in this announcement: adjusted performance measures, underlying performance, comparable sales, free cash flow and lease-adjusted net debt. The definition of these alternative performance measures are set out in the Appendix on page 14. Certain financial data within this announcement have been rounded. Enquiries Investors and analysts Charlotte Cowley VP, Investor Relations 020 3367 3524 Media Andrew Roberts VP, Corporate Relations 020 3367 3764 Caroline Daniel Brunswick 020 7404 5959 Paul Raeburn Brunswick There will be a presentation today at 9.30am (UK time) to investors and analysts at Horseferry
House, Horseferry Road, London, SW1P 2AW The presentation can be viewed live on the Burberry website www.burberryplc.com and can also
be accessed live via a listen only dial-in facility on +44 (0)20 3003 2666 The supporting slides and an indexed replay will be available on the website later in the day Burberry will issue its First Quarter Trading Update on 12 July 2017 The AGM will be held on 13 July 2017 Certain statements made in this announcement are forward-looking statements. Such statements are based on current expectations and are subject to a number of risks and uncertainties that could cause actual results to differ materially from any expected future results in forward-looking statements. Burberry Group plc undertakes no obligation to update these forward-looking statements and will not publicly release any revisions it may make to these forward-looking statements that may result from events or circumstances arising after the date of this document. Nothing in this announcement should be construed as a profit forecast. All persons, wherever located, should consult any additional disclosures that Burberry Group plc may make in any regulatory announcements or documents which it publishes. All persons, wherever located, should take note of these disclosures. This announcement does not constitute an invitation to underwrite, subscribe for or otherwise acquire or dispose of any Burberry Group plc shares, in the UK, or in the US, or under the US Securities Act 1933 or in any other jurisdiction. Burberry is listed on the London Stock Exchange (BRBY.L) and is a constituent of the FTSE 100 index. ADR symbol OTC:BURBY. BURBERRY, the Equestrian Knight Device and the Burberry Check are trademarks belonging to Burberry which are registered and enforced worldwide.

3
GROUP FINANCIAL HIGHLIGHTS Total revenue £2.8bn, down 2% underlying, up 10% at reported FX. Retail growth, offset by declines in wholesale and licensing, in part reflecting actions to elevate the brand Adjusted profit before tax £462m, down 21% underlying, up 10% at reported FX. Lower wholesale income, particularly in the US and Beauty, and reduced licensing income, principally due to planned expiry of Japanese licence, was partially offset by cost savings. Reported profit before tax £395m (2016: £416m) after adjusting items Adjusted diluted EPS up 11% to 77.4p (2016: 69.9p), with 25.8% effective tax rate (2016: 24.7%) and repurchase of 6.7m shares. Reported diluted EPS down 6% Full year dividend per share up 5% to 38.9p (2016: 37.0p), in line with progressive dividend policy Free cash flow of £465m (2016: £274m). Net cash of £809m at 31 March 2017 up £149m, after £97m of share buy buyback and £164m of dividends Year to 31 March % change £ million 2017 2016 reported
FX underlying
Revenue 2,766.0 2,514.7 10 (2) Cost of sales (832.9) (752.0) 11
Gross margin 1,933.1 1,762.7 10 Operating expenses* (1,474.4) (1,344.9) 10 Adjusted operating profit 458.7 417.8 10 (21) Net finance credit* 3.7 2.8 32 Adjusted profit before taxation 462.4 420.6 10 (21)Adjusting items (67.6) (5.0) Profit before taxation 394.8 415.6 (5) Taxation (107.1) (101.0) Non-controlling interest (0.9) (5.1) Attributable profit 286.8 309.5
Adjusted EPS (pence)~ 77.4 69.9 11 EPS (pence)~ 64.9 69.4 (6) Weighted average number of ordinary shares (millions)~
442.2 446.1
Adjusted measures exclude adjusting items * Excludes adjusting items. For detail, see page 9 ~ EPS is presented on a diluted basis

4
BUSINESS AND FINANCIAL REVIEW The external environment remained challenging in FY 2017, particularly in the US and Hong Kong. For the industry, newness led growth and accessories outperformed while apparel saw softer trends. For Burberry, FY 2017 marked a transitional period. Our plans for growth over time and simplification (outlined in May 2016) have been built into five key pillars. Three are focused on optimising revenue growth (Product Focus, Productive Space and E-commerce Leadership) enabled by Operational Excellence and Inspired People, improving efficiency and ensuring we have the right capabilities to deliver. The benefits of the revenue drivers are expected to build over the medium term and we are on track to achieve our targeted cost savings by FY 2019. The strategic partnership, announced in April, with Coty to accelerate the growth and development of Beauty has now received regulatory approval. 1. Product Focus: From product breadth to product focus Focusing on key product categories, simplifying the product offer while increasing innovation, tailoring the offer more effectively for local needs and implementing a new approach to managing product categories Completed roll out of one label strategy Reduced SKUs by c.15-20% to provide greater visibility of fashion and newness Evolved Burberry’s handbag offering around a new pillar and shape strategy
- Leather goods outperformed, with bags up mid-teens at retail Positive customer response to direct-to-consumer runway collections and their
commercial extensions Fashion outperformed, supported by innovation in core categories, such as the
successful launch of lightweight tropical gabardine, with a strong pipeline of launches to come
2. Productive Space: From new space to productive space Improving our end-to-end retail disciplines to drive retail productivity through a multi-year programme focusing on improving service and customer cultivation, product and operations Increased conversion and improved customer retention Invested further in globally consistent training, focusing on customer service Over 50% increase in Burberry Private Client team, ahead of our target of 20% Rolled out client feedback programme based on Net Promoter Score (NPS)

5
3. E-commerce Leadership: From digital prowess to e-commerce leadership Leveraging our strong digital capability to drive revenues both on our own platform and through third party relationships and to continue sector leading innovation in the fastest growing channel Digital growth reflected strategic focus and investment in omni-channel journeys
- About 70% of customers’ buying decisions influenced by digital Launched redesigned website for desktop and mobile and a localised site in China Soft-launched Burberry customer app in the UK 4. Operational Excellence: Focusing on efficiency
Delivered £20m planned cost savings, expect this to build to c.£50m in FY 2018 and on track to reach our target of at least £100m annualised by FY 2019. In addition to the operating model efficiencies, four major areas of opportunity identified to deliver these targets: process simplification, procurement, inventory management and improved information and technology Announced plans to establish Burberry Business Services in Leeds, generating
savings from process improvements and lower facility costs Rolling out digital indirect procurement system; pilot delivered 65% reduction in
order approval time 7% increase in stock availability from single pool of inventory, initiated work to
support better omni-channel customer journeys, including faster delivery times Continuing to simplify and standardise our technology platform globally to
facilitate business-wide efficiency
5. Inspired People: Implementing our new ways of working
Ensuring the business has the right capabilities in place to operate effectively to meet its strategic objectives, and that its employees continue to be motivated and inspired. Burberry is also committed to operating responsibly and to contributing to the communities in which it operates
Key appointments made in areas including product, customer experience and technology
Re-designed operating model to simplify the organisation Reviewing and simplifying employee performance and talent management process Set a new five-year Responsibility Strategy

6
Capital allocation framework Our new capital allocation framework defines our priorities for uses of cash, underpinned by our principle to maintain a strong balance sheet with solid investment grade credit metrics. The framework has four priorities:
Re-investment in the business to drive organic growth Maintaining a progressive dividend policy Continuing to pursue selective strategic investments To the extent that there is surplus capital to these needs, provide additional
returns to shareholders In FY 2017, the dividend increased by 5%, in line with our progressive dividend policy. We have completed £100m of the previously announced £150m share buyback. The remaining £50m of the initial programme, together with the new buyback of £300m announced today is expected to be completed in FY 2018. This is inclusive of the distribution of the Coty upfront sum. Revenue analysis Revenue by channel Year to 31 March % change £ million 2017 2016 reported
FX underlying
Retail 2,127.2 1,837.7 16 3Wholesale 613.9 634.6 (3) (14)Licensing 24.9 42.4 (41) (48)Revenue 2,766.0 2,514.7 10 (2) During FY 2017 we continued to elevate Burberry’s luxury brand positioning In retail, through service and cultivation initiatives and with the launch of our
redesigned website In wholesale, including Beauty, through tightly controlling inventory and
distribution despite challenging market conditions And in licensing, reflecting our move to direct luxury retail operation in Japan Retail 77% of revenue (2016: 73%); with 209 mainline stores, 200 concessions within department stores, digital commerce and 60 outlets Retail sales up 3% underlying Comparable sales up 1% (H1: flat; H2: up 3%) New space contributed the balance of growth

7
Asia Pacific With retail accounting for almost 90% of revenue in the region, Asia Pacific saw broadly unchanged comparable sales with an improved performance in the second half. Mainland China delivered high single-digit percentage growth, accelerating
through the year to deliver double-digit percentage growth in the fourth quarter Hong Kong improved through the period although remained negative for the full
year, impacted by lower footfall partially offset by improved conversion Korea, our third largest market in Asia, was impacted by both the macro
environment and our own actions to reduce promotional activity EMEIA Retail accounted for 70% of regional revenue. Comparable sales increased by a high single-digit percentage, with an improvement to double-digit percentage growth in the second half. Both local customers and tourists contributed to the positive trends The United Kingdom, delivered an exceptional performance Continental Europe saw improvements in most markets through the year,
particularly France The Middle East remained difficult, experiencing negative footfall trends Americas With retail accounting for c.70% of regional revenue, comparable sales reduced by a low single-digit percentage. The relative strength of the US dollar drove a strong increase in sales from US
customers abroad, while demand at home reduced (both domestic and tourist) Spend from US customers globally was stable Strategic actions were taken to protect brand positioning in the highly promotional
US environment
Wholesale 22% of revenue (2016: 25%); generated from sales of apparel and accessories to department stores, multi-brand accounts, 48 franchise stores and travel retail; as well as Beauty to distributors Wholesale revenue down 14% underlying in line with guidance, with almost half of the decline from Beauty. Reflecting the rationalisation of distribution in key markets, to improve the brand positioning, and distributor de-stocking, Beauty revenue declined by about 20% underlying (FY 2017: £171m). My Burberry and Mr Burberry continue to gain share in key markets as emphasis was placed on building pillar fragrances. Excluding Beauty, underlying wholesale revenue declined, led by a significant decline in Americas in part reflecting our strategy to reposition the brand in the US.
8
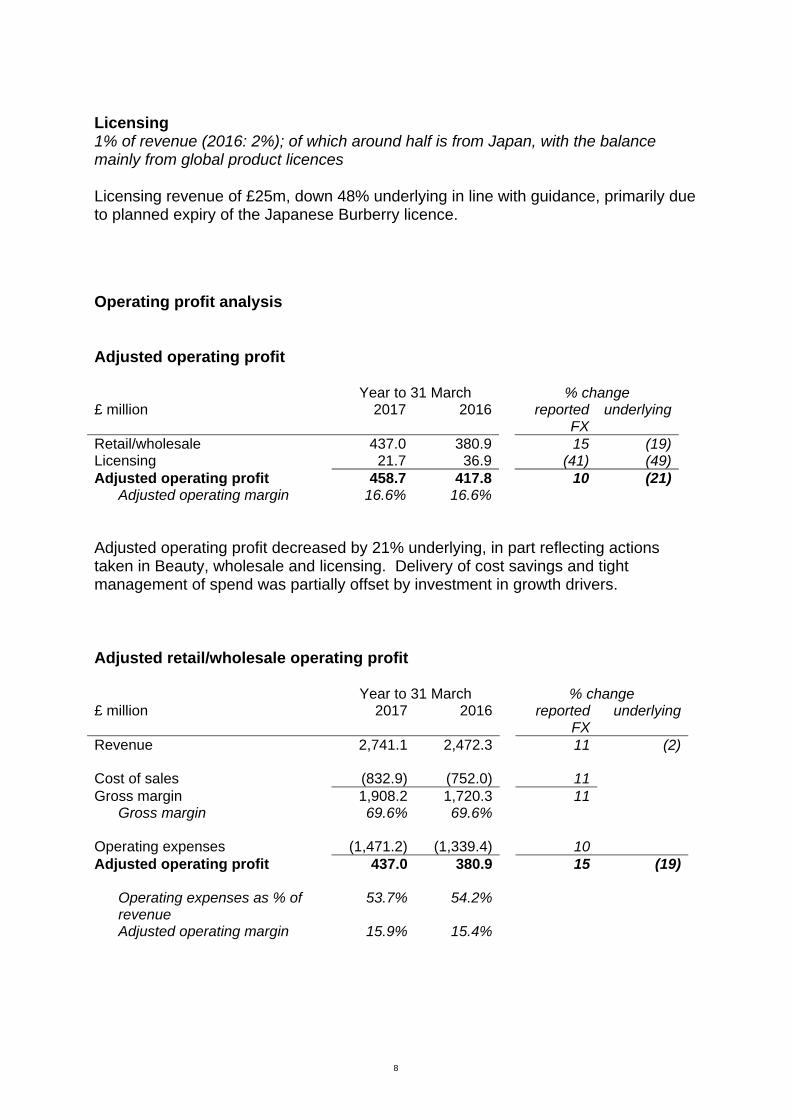
Licensing 1% of revenue (2016: 2%); of which around half is from Japan, with the balance mainly from global product licences Licensing revenue of £25m, down 48% underlying in line with guidance, primarily due to planned expiry of the Japanese Burberry licence.
Operating profit analysis Adjusted operating profit Year to 31 March % change £ million 2017 2016 reported
FX underlying
Retail/wholesale 437.0 380.9 15 (19)Licensing 21.7 36.9 (41) (49)Adjusted operating profit 458.7 417.8 10 (21)
Adjusted operating margin 16.6% 16.6% Adjusted operating profit decreased by 21% underlying, in part reflecting actions taken in Beauty, wholesale and licensing. Delivery of cost savings and tight management of spend was partially offset by investment in growth drivers. Adjusted retail/wholesale operating profit Year to 31 March % change £ million 2017 2016 reported
FX underlying
Revenue 2,741.1 2,472.3 11 (2) Cost of sales (832.9) (752.0) 11 Gross margin 1,908.2 1,720.3 11
Gross margin 69.6% 69.6% Operating expenses (1,471.2) (1,339.4) 10 Adjusted operating profit 437.0 380.9 15 (19)
Operating expenses as % of revenue
53.7% 54.2%
Adjusted operating margin 15.9% 15.4%

9
Adjusted retail/wholesale operating profit decreased by 19% underlying, up 15% at reported FX, including a £128m positive impact from exchange rate movements. This reflected:
A decline in wholesale profits, particularly in Beauty and the US Delivery of £20m of planned savings associated with our cost efficiency programme Ongoing tight discretionary cost management to mitigate underlying cost inflation Investment of £8m to support our growth initiatives The re-building of the performance related pay charge (£37m) as guided, partially
offset by lower store impairment and onerous lease charges (£22m) compared to the prior year
Adjusted licensing operating profit Year to 31 March % change £ million 2017 2016 reported
FX Revenue 24.9 42.4 (41) Cost of sales - - - Gross margin 24.9 42.4 (41)
Gross margin 100% 100% Operating expenses (3.2) (5.5) (43) Adjusted operating profit 21.7 36.9 (41)
Operating margin 87.1% 87.0% Adjusted licensing profit was down 41% at reported FX, including a £3m exchange rate benefit, primarily reflecting the planned expiry of the Japanese Burberry licence. Adjusting items Year to 31 March £ million 2017 2016 Beauty licence intangible charges (26.1) (14.9) Costs associated with the transfer of Beauty operations
(14.5) -
Restructuring costs relating to cost efficiency programme
(20.8) -
China put option liability finance (charge)/income (1.0) 9.9 BME deferred consideration charges (5.2) - (67.6) (5.0)

10
Beauty licence intangible In the first half, in addition to the planned amortisation charge of £7.5m, a further £18.6m was recognised to write down the remaining balance of the intangible to nil, due to lower than previously planned Beauty revenue expectations. Costs associated with the transfer of Beauty operations Costs of £14.5m associated with the transfer of the Beauty operations to Coty in October 2017. These costs arose in FY 2017 as a result of decisions made during the period. Restructuring costs Restructuring costs of £20.8m were incurred, relating to our cost and efficiency programme, in line with guidance. China put option liability The charge of £1.0m reflects the fair value movement of the put option liability in the period up to 1 August when Burberry exercised its call option. (see note 7 of the Financial Statements) Burberry Middle East (BME) deferred consideration The £5.2m charge principally reflects foreign exchange rate movements and the discount unwind on the deferred consideration for the BME transaction. (see note 7 of the Financial Statements) Taxation The tax rate on adjusted profit in FY 2017 was 25.8% (2016: 24.7%), higher than initially guided principally due to a change in the geographic mix of our taxable profits, in addition to a change in the transfer pricing approach by an overseas tax authority. Tax on adjusting items has been recognised as appropriate. The tax charge of £107m (2016: £101m) resulted in an effective tax rate on reported profit of 27.1% (2016: 24.3%), higher than the effective tax rate due to certain adjusting items which are not subject to tax. (see note 7 of the Financial Statements) Cash flow Cash generated from operating activities in FY 2017 was £689m (2016: £503m). The year-on-year increase reflects the growth in adjusted operating profit and a cash inflow from working capital. Inventory was down 3% underlying, below retail sales growth, reflecting tight management in the second half. Capital expenditure was below guidance at £104m (2016: £138m) predominantly due to timing of projects and is expected to return to a more normalised level in FY 2018. Tax paid of £132m (2016: £95m) was higher than the prior year reflecting sterling weakness and timing of payments. Free cash flow of £465m (2016: £274m) and net cash up £149m (after dividends, share buyback and payments for non-controlling interests in China and BME). Net cash at 31 March 2017 of £809m (2016: £660m) and lease-adjusted net debt of £388m (2016: £441m).

11
Summary outlook In what remains a rapidly changing environment, Burberry will continue to take actions to elevate its brand, maintain tight discipline on costs and efficient use of capital while executing its strategic agenda. Our focus is on our brand, our products and the execution of our five key pillars to return Burberry to growth. There is no change to our expectations for FY 2018 adjusted PBT at constant exchange rates. For detailed outlook, see Appendix. Disclosure To simplify its communication, Burberry is modifying its disclosure. With effect from FY 2018 Burberry will: Report four times per annum
- First and Third Quarter Trading Updates reporting on retail - Interim and Preliminary Results
Publish consensus on the Burberry plc website

12
APPENDIX
Outlook No change to our expectations for FY 2018 adjusted PBT at constant exchange rates. Retail: Burberry will focus on productivity from the current store footprint therefore no material contribution from net new space is expected in FY 2018. Beauty: Strategic partnership with Coty announced for Beauty from October 2017. The impact is expected to be broadly neutral to adjusted PBT in FY 2018 and
accretive from FY 2019 In the second half of FY 2018, Burberry expects to receive cash payments of
£130m for the long-term exclusive global licence and related transfer of the Beauty business, and c.£50m for assets transferring, principally inventory (which is subject to adjustments) totalling c.£180m
Burberry currently expects c.£30m of one-off cash costs associated with this agreement
From the second half of FY 2018, Beauty will transition from a wholesale business model to licensing. This is reflected in guidance below. Beauty wholesale revenue FY 2017: £171m (H1: £70m; H2: £101m)
Wholesale: Burberry expects total underlying wholesale revenue in the first half of FY 2018 to be down by a mid single-digit percentage (H1 2017: £287m). This reflects the potential business disruption for Beauty. Excluding Beauty, underlying wholesale revenue in H1 2018 is expected to be broadly unchanged year-on-year (H1 2017: £217m). Licensing: Total underlying licensing revenue for FY 2018 is expected to be up c.20% year-on-year. FY 2018 adjusted PBT: At 28 April effective rates*, the expected impact of year-on-year exchange rate
movements on reported adjusted PBT is about £30m adverse. This is an adverse movement of c.£20m since guidance given in April 2017
We expect to deliver around £50m of cumulative cost savings and invest about £20m In addition, to deliver the strategic savings, c.£40m of one-off restructuring costs are expected. Tax rate: The tax rate on adjusted profit for FY 2018 is currently expected to improve by about 80bps to about 25%. Capital expenditure: Spend of about £140m is planned in FY 2018. *see Exchange rates

13
Exchange rates Effective rates for
FY 2018 Average exchange rates
£1= 28 April 2017
31 March 2017
FY 2017Actual
FY 2016 Actual
Euro 1.19 1.17 1.19 1.36 US Dollar 1.29 1.25 1.30 1.50 Chinese Yuan 8.89 8.62 8.73 9.57 Hong Kong Dollar 10.02 9.74 10.11 11.67 Korean Won 1,458 1,402 1,487 1,740 Retail/wholesale revenue by destination Year to 31 March % change £ million 2017 2016 reported
FX underlying
Asia Pacific 1,069.0 932.9 15 -EMEIA 991.2 878.5 13 3Americas 680.9 660.9 3 (11)
2,741.1 2,472.3 11 (2) Retail/wholesale revenue by product division Year to 31 March % change £ million 2017 2016 reported
FX underlying
Accessories 1,033.2 901.7 15 2Womens 791.9 729.0 9 (4)Mens 623.5 548.4 14 1Childrens 108.1 90.7 19 5Beauty 184.4 202.5 (9) (18)
2,741.1 2,472.3 11 (2) Store portfolio
Directly-operated stores Stores Concessions Outlets Total Franchise
storesAt 31 March 2016 215 214 58 487 62Additions 13 7 4 24 -Closures (19) (21) (2) (42) (14)At 31 March 2017 209 200 60 469 48
14
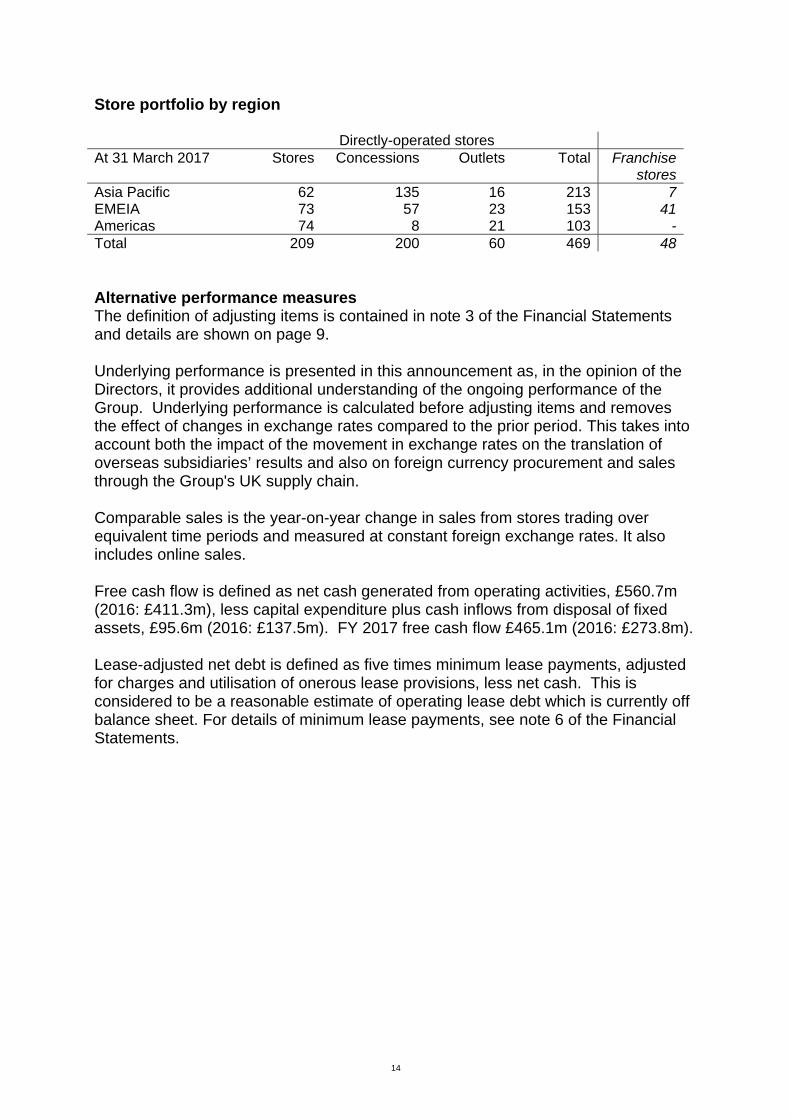
Store portfolio by region Directly-operated stores At 31 March 2017 Stores Concessions Outlets Total Franchise
storesAsia Pacific 62 135 16 213 7EMEIA 73 57 23 153 41Americas 74 8 21 103 -Total 209 200 60 469 48 Alternative performance measures The definition of adjusting items is contained in note 3 of the Financial Statements and details are shown on page 9. Underlying performance is presented in this announcement as, in the opinion of the Directors, it provides additional understanding of the ongoing performance of the Group. Underlying performance is calculated before adjusting items and removes the effect of changes in exchange rates compared to the prior period. This takes into account both the impact of the movement in exchange rates on the translation of overseas subsidiaries’ results and also on foreign currency procurement and sales through the Group's UK supply chain. Comparable sales is the year-on-year change in sales from stores trading over equivalent time periods and measured at constant foreign exchange rates. It also includes online sales. Free cash flow is defined as net cash generated from operating activities, £560.7m (2016: £411.3m), less capital expenditure plus cash inflows from disposal of fixed assets, £95.6m (2016: £137.5m). FY 2017 free cash flow £465.1m (2016: £273.8m). Lease-adjusted net debt is defined as five times minimum lease payments, adjusted for charges and utilisation of onerous lease provisions, less net cash. This is considered to be a reasonable estimate of operating lease debt which is currently off balance sheet. For details of minimum lease payments, see note 6 of the Financial Statements.

15
Group Income Statement
Note
Year to 31 March
2017 £m
Year to31 March
2016£m
Revenue 4 2,766.0 2,514.7
Cost of sales (832.9) (752.0)
Gross profit 1,933.1 1,762.7
Net operating expenses 5 (1,538.8) (1,359.8)
Operating profit 394.3 402.9
Financing
Finance income 5.5 5.1
Finance expense (1.8) (2.3)
Other financing (charge)/income (3.2) 9.9
Net finance income 8 0.5 12.7
Profit before taxation 6 394.8 415.6
Taxation 9 (107.1) (101.0)
Profit for the year 287.7 314.6
Attributable to:
Owners of the Company 286.8 309.5
Non-controlling interest 0.9 5.1
Profit for the year 287.7 314.6
Earnings per share
Basic 10 65.3p 70.0p
Diluted 10 64.9p 69.4p
£m £m
Reconciliation of adjusted profit before taxation:
Profit before taxation 394.8 415.6
Adjusting items:
Adjusting operating items 7 64.4 14.9
Adjusting financing items 7 3.2 (9.9)
Adjusted profit before taxation – non-GAAP measure 462.4 420.6
Adjusted earnings per share – non-GAAP measure
Basic 10 77.9p 70.5p
Diluted 10 77.4p 69.9p
Dividends per share
Interim 11 10.5p 10.2p
Proposed final (not recognised as a liability at 31 March) 11 28.4p 26.8p

16
Group Statement of Comprehensive Income
Note
Year to 31 March
2017 £m
Year to31 March
2016£m
Profit for the year 287.7 314.6
Other comprehensive income1:
Cash flow hedges 20 4.7 10.8
Net investment hedges (2.3) (0.8)
Foreign currency translation differences 103.1 20.4
Tax on other comprehensive income:
Cash flow hedges 9 (1.0) (2.2)
Net investment hedges 9 0.5 0.6
Foreign currency translation differences 9 (5.4) (1.9)
Other comprehensive income for the year, net of tax 99.6 26.9
Total comprehensive income for the year 387.3 341.5
Total comprehensive income attributable to:
Owners of the Company 384.6 335.5
Non-controlling interest 2.7 6.0
387.3 341.5
1 All items included in other comprehensive income may subsequently be reclassified to profit and loss in a future period.

17
Group Balance Sheet
Note
As at 31 March
2017 £m
As at31 March
2016£m
ASSETS
Non-current assets
Intangible assets 12 170.1 189.6
Property, plant and equipment 13 399.6 426.2
Investment properties 2.6 2.4
Deferred tax assets 125.0 134.4
Trade and other receivables 14 76.4 66.5
Derivative financial assets 1.1 0.3
774.8 819.4
Current assets
Inventories 15 505.3 486.7
Trade and other receivables 14 275.6 285.4
Derivative financial assets 5.0 8.0
Income tax receivables 9.2 3.0
Cash and cash equivalents 16 843.5 711.8
1,638.6 1,494.9
Total assets 2,413.4 2,314.3
LIABILITIES
Non-current liabilities
Trade and other payables 17 (101.9) (114.7)
Deferred tax liabilities (0.4) (0.6)
Retirement benefit obligations (0.9) (0.7)
Provisions for other liabilities and charges 18 (47.3) (38.4)
(150.5) (154.4)
Current liabilities
Bank overdrafts and borrowings 19 (34.3) (51.5)
Derivative financial liabilities (3.5) (2.3)
Trade and other payables 17 (459.1) (387.2)
Provisions for other liabilities and charges 18 (18.1) (17.6)
Income tax liabilities (50.1) (80.4)
(565.1) (539.0)
Total liabilities (715.6) (693.4)
Net assets 1,697.8 1,620.9
EQUITY
Capital and reserves attributable to owners of the Company
Ordinary share capital 20 0.2 0.2
Share premium account 211.4 209.8
Capital reserve 20 41.1 41.1
Hedging reserve 20 10.0 8.1
Foreign currency translation reserve 20 260.8 164.9
Retained earnings 1,169.0 1,140.9
Equity attributable to owners of the Company 1,692.5 1,565.0
Non-controlling interest in equity 5.3 55.9
Total equity 1,697.8 1,620.9

18
Group Statement of Changes in Equity
Attributable to owners
of the Company
Note
Ordinary share
capital£m
Share premium account
£m
Other reserves
£m
Retained earnings
£m Total
£m
Non-controlling
interest£m
Total equity
£m
Balance as at 31 March 2015 0.2 207.6 192.3 1,000.8 1,400.9 50.6 1,451.5
Profit for the year – – – 309.5 309.5 5.1 314.6
Other comprehensive income:
Cash flow hedges 20 – – 10.8 – 10.8 – 10.8
Net investment hedge – – (0.8) – (0.8) – (0.8)
Foreign currency translation differences – – 19.5 – 19.5 0.9 20.4
Tax on other comprehensive income – – (3.5) – (3.5) – (3.5)
Total comprehensive income for the year – – 26.0 309.5 335.5 6.0 341.5
Disposal of subsidiaries – – (6.2) 6.2 – – –
Transfer between reserves – – 2.0 (2.0) – – –
Transactions with owners:
Employee share incentive schemes
Value of share options granted – – – (0.3) (0.3) – (0.3)
Value of share options transferred to liabilities – – – (0.2) (0.2) – (0.2)
Tax on share options granted – – – (4.5) (4.5) – (4.5)
Exercise of share options – 2.2 – – 2.2 – 2.2
Purchase of own shares by ESOP trusts – – – (10.9) (10.9) – (10.9)
Dividends paid in the year – – – (157.7) (157.7) (0.7) (158.4)
Balance as at 31 March 2016 0.2 209.8 214.1 1,140.9 1,565.0 55.9 1,620.9
Profit for the year – – – 286.8 286.8 0.9 287.7
Other comprehensive income:
Cash flow hedges 20 – – 4.7 – 4.7 – 4.7
Net investment hedge – – (2.3) – (2.3) – (2.3)
Foreign currency translation differences – – 101.3 – 101.3 1.8 103.1
Tax on other comprehensive income – – (5.9) – (5.9) – (5.9)
Total comprehensive income for the year – – 97.8 286.8 384.6 2.7 387.3
Transactions with owners:
Employee share incentive schemes
Value of share options granted – – – 13.1 13.1 – 13.1
Value of share options transferred to liabilities – – – (0.4) (0.4) – (0.4)
Tax on share options granted – – – 0.9 0.9 – 0.9
Exercise of share options – 1.6 – – 1.6 – 1.6
Purchase of own shares
Share buy-back – – – (100.5) (100.5) – (100.5)
Held by ESOP trusts – – – (13.3) (13.3) – (13.3)
Expiry of put option over non-controlling interest 23 – – – 51.0 51.0 – 51.0
Acquisition of additional interest in subsidiary 23 – – – (45.1) (45.1) (53.2) (98.3)
Dividends paid in the year – – – (164.4) (164.4) (0.1) (164.5)
Balance as at 31 March 2017 0.2 211.4 311.9 1,169.0 1,692.5 5.3 1,697.8

19
Group Statement of Cash Flows
Note
Year to 31 March
2017 £m
Year to31 March
2016£m
Cash flows from operating activities
Operating profit 394.3 402.9
Depreciation 121.3 111.9
Amortisation 30.2 35.2
Net impairment of intangible assets 12 33.0 –
Net impairment of property, plant and equipment 13 15.9 26.5
Loss on disposal of property, plant and equipment and intangible assets 3.5 1.2
Loss on derivative instruments 5.6 3.1
Charge/(credit) in respect of employee share incentive schemes 13.1 (0.3)
Payment from settlement of equity swap contracts – (1.6)
Decrease/(increase) in inventories 8.4 (49.3)
Decrease/(increase) in receivables 19.7 (31.7)
Increase in payables and provisions 43.6 5.1
Cash generated from operating activities 688.6 503.0
Interest received 5.2 4.8
Interest paid (1.5) (1.7)
Taxation paid (131.6) (94.8)
Net cash generated from operating activities 560.7 411.3
Cash flows from investing activities
Purchase of property, plant and equipment (71.3) (107.3)
Purchase of intangible assets (32.8) (30.7)
Proceeds from sale of property, plant and equipment 8.5 0.5
Net cash outflow from investing activities (95.6) (137.5)
Cash flows from financing activities
Dividends paid in the year 11 (164.4) (157.7)
Dividends paid to non-controlling interest (0.1) (0.7)
Payment to acquire additional interest in subsidiary from non-controlling interest 23 (68.8) –
Issue of ordinary share capital 1.6 2.2
Purchase of own shares through share buy-back 20 (97.2) –
Purchase of own shares by ESOP trusts (13.3) (10.9)
Net cash outflow from financing activities (342.2) (167.1)
Net increase in cash and cash equivalents 122.9 106.7
Effect of exchange rate changes 26.0 1.4
Cash and cash equivalents at beginning of year 660.3 552.2
Cash and cash equivalents at end of year 809.2 660.3
Analysis of Net Cash
Note
As at 31 March
2017 £m
As at31 March
2016£m
Cash and cash equivalents as per the Balance Sheet 16 843.5 711.8
Bank overdrafts 19 (34.3) (51.5)
Net cash 809.2 660.3

20
Notes to the Financial Statements 1. Basis of preparation The financial information contained within this report has been prepared in accordance with the European Union endorsed International Financial Reporting Standards (IFRSs), IFRS Interpretations Committee (IFRS IC) interpretations and parts of the Companies Act 2006 applicable to companies reporting under IFRS. This financial information does not constitute the Burberry Group’s (the Group) Annual Report and Accounts within the meaning of Section 435 of the Companies Act 2006.
Statutory accounts for the year ended 31 March 2016 have been filed with the Registrar of Companies, and those for 2017 will be delivered in due course. The reports of the auditors on those statutory accounts for the years ended 31 March 2016 and 31 March 2017 were unqualified, did not contain an emphasis of matter paragraph and did not contain a statement under either section 400(2) or section 498(3) of the Companies Act 2006.
The principal accounting policies applied in the preparation of the consolidated financial statements are consistent with those set out in the statutory accounts for the year ended 31 March 2016.
2. Translation of the results of overseas businesses The results of overseas subsidiaries are translated into the Group’s presentation currency of Sterling each month at the weighted average exchange rate for the month according to the phasing of the Group’s trading results. The weighted average exchange rate is used, as it is considered to approximate the actual exchange rates on the date of the transactions. The assets and liabilities of such undertakings are translated at the closing rates. Differences arising on the retranslation of the opening net investment in subsidiary companies, and on the translation of their results, are taken directly to the foreign currency translation reserve.
Goodwill and fair value adjustments arising on the acquisition of a foreign operation are treated as assets and liabilities of the foreign operation and translated at the closing rate.
The principal exchange rates used were as follows:
Average rate Closing rate
Year to31 March
2017
Year to31 March
2016
As at 31 March
2017
As at31 March
2016
Euro 1.19 1.36 1.17 1.26
US Dollar 1.30 1.50 1.25 1.44
Chinese Yuan Renminbi 8.73 9.57 8.62 9.29
Hong Kong Dollar 10.11 11.67 9.74 11.16
Korean Won 1,487 1,740 1,402 1,640
The average exchange rate achieved by the Group on its Yen royalty income, taking into account its use of Yen forward foreign exchange contracts executed on a monthly basis approximately 12 months in advance of royalty receipts, was Yen 159.3: £1 in the year to 31 March 2017 (2016: Yen 177.1: £1).

21
Notes to the Financial Statements 3. Adjusted profit before taxation In order to provide additional consideration of the underlying performance of the Group’s ongoing business, the Group’s results include a presentation of Adjusted profit before taxation (‘adjusted PBT’). Adjusted PBT is defined as profit before taxation and before adjusting items. Adjusting items are those items which, in the opinion of the directors, should be excluded in order to provide a consistent and comparable view of the performance of the Group’s ongoing business. Generally this will include those items that are largely one-off and material in nature as well as income or expenses relating to acquisitions or disposals of businesses or other transactions of a similar nature, including the impact of changes in fair value of expected future payments or receipts relating to these transactions. Adjusting items are identified and presented on a consistent basis each year and a reconciliation of adjusted PBT to profit before tax is included in the financial statements. Adjusting items and their related tax impacts are added back to/deducted from profit attributable to owners of the Company to arrive at adjusted earnings per share. Refer to note 7 for further details of adjusting items.
4. Segmental analysis The Chief Operating Decision Maker has been identified as the Board of Directors. The Board reviews the Group’s internal reporting in order to assess performance and allocate resources. Management has determined the operating segments based on the reports used by the Board. The Board considers the Group’s business through its two channels to market, being retail/wholesale and licensing.
Retail/wholesale revenues are generated by the sale of luxury goods through Burberry mainline stores, concessions, outlets and digital commerce as well as Burberry franchisees, prestige department stores globally and multi-brand specialty accounts. The flow of global product between retail and wholesale channels and across our regions is monitored and optimised at a corporate level and implemented via the Group’s inventory hubs situated in Asia, Europe and the USA.
Licensing revenues are generated through the receipt of royalties from global licensees of eyewear, timepieces and European childrenswear, and from licences relating to the use of non-Burberry trade marks in Japan.
The Board assesses channel performance based on a measure of adjusted operating profit. This measurement basis excludes the effects of adjusting items. The measure of earnings for each operating segment that is reviewed by the Board includes an allocation of corporate and central costs. Interest income and charges are not included in the result for each operating segment that is reviewed by the Board.
Retail/Wholesale Licensing Total
Year to31 March
2017£m
Year to31 March
2016£m
Year to31 March
2017£m
Year to 31 March
2016 £m
Year to 31 March
2017 £m
Year to31 March
2016£m
Retail 2,127.2 1,837.7 – – 2,127.2 1,837.7
Wholesale 613.9 634.6 – – 613.9 634.6
Licensing – – 27.1 44.7 27.1 44.7
Total segment revenue 2,741.1 2,472.3 27.1 44.7 2,768.2 2,517.0
Inter-segment revenue1 – – (2.2) (2.3) (2.2) (2.3)
Revenue from external customers 2,741.1 2,472.3 24.9 42.4 2,766.0 2,514.7
Depreciation and amortisation2 144.0 132.2 – – 144.0 132.2
Net impairment of intangible assets3 7.1 – – – 7.1 –
Net impairment of property, plant and equipment 15.9 26.5 – – 15.9 26.5
Other non-cash items:
Share-based payments 13.1 (0.3) – – 13.1 (0.3)
Adjusted operating profit 437.0 380.9 21.7 36.9 458.7 417.8
Adjusting items4 (67.6) (5.0)
Finance income 5.5 5.1
Finance expense (1.8) (2.3)
Profit before taxation 394.8 415.6
1 Inter-segment transfers or transactions are entered into under the normal commercial terms and conditions that would be available to unrelated third parties.
2 Amortisation of £7.5m (2016: £14.9m) relating to the fragrance and beauty licence intangible asset is presented as an adjusting item and excluded from the
segmental analysis.
3 Impairment of £18.6m (2016: £nil) relating to the fragrance and beauty licence intangible asset and impairment of £7.3m (2016: £nil) of software assets specifically
relating to the transfer of the Beauty operations are presented as adjusting items and excluded from the segmental analysis.
4 Refer to note 7 for details of adjusting items.

22
Notes to the Financial Statements 4. Segmental analysis (continued) Segmental asset analysis Retail/Wholesale Licensing Total
Year to31 March
2017£m
Year to31 March
2016£m
Year to31 March
2017£m
Year to 31 March
2016 £m
Year to 31 March
2017 £m
Year to31 March
2016£m
Additions to non-current assets 112.1 146.2 – – 112.1 146.2
Total segment assets 1,332.5 1,365.5 3.6 3.5 1,336.1 1,369.0
Goodwill 99.6 88.8
Cash and cash equivalents 843.5 711.8
Taxation 134.2 137.4
Assets relating to discontinued Spanish operations – 7.3
Total assets per Balance Sheet 2,413.4 2,314.3
Additional revenue analysis
Revenue by product division
Year to 31 March
2017 £m
Year to31 March
2016£m
Accessories 1,033.2 901.7
Womens 791.9 729.0
Mens 623.5 548.4
Childrens/Other 108.1 90.7
Beauty 184.4 202.5
Retail/Wholesale 2,741.1 2,472.3
Licensing 24.9 42.4
Total 2,766.0 2,514.7
Revenue by destination
Year to 31 March
2017 £m
Year to31 March
2016£m
Asia Pacific 1,069.0 932.9
EMEIA1 991.2 878.5
Americas 680.9 660.9
Retail/Wholesale 2,741.1 2,472.3
Licensing 24.9 42.4
Total 2,766.0 2,514.7
1 EMEIA comprises Europe, Middle East, India and Africa.
Entity-wide disclosures Revenue derived from external customers in the UK totalled £300.9m for the year to 31 March 2017 (2016: £250.2m).
Revenue derived from external customers in foreign countries totalled £2,465.1m for the year to 31 March 2017 (2016: £2,264.5m). This amount includes £576.6m of external revenues derived from customers in the USA (2016: £562.1m) and £413.7m of external revenues derived from customers in China (2016: £350.9m).
The total of non-current assets other than financial instruments and deferred tax assets located in the UK is £147.6m (2016: £194.6m). The remaining £456.2m of non-current assets are located in other countries (2016: £452.6m), with £159.6m located in the USA (2016: £153.1m), £76.7m located in China (2016: £82.0m), and £72.4m located in Korea (2016: £58.9m).

23
Notes to the Financial Statements 5. Net operating expenses
Note
Year to 31 March
2017 £m
Year to31 March
2016 £m
Selling and distribution costs 913.5 816.7
Administrative expenses 560.9 528.2
Adjusting operating items 7 64.4 14.9
Net operating expenses 1,538.8 1,359.8
6. Profit before taxation
Note
Year to 31 March
2017 £m
Year to 31 March
2016£m
Adjusted profit before taxation is stated after charging/(crediting):
Depreciation of property, plant and equipment
Within cost of sales 1.6 1.4
Within selling and distribution costs 107.4 98.7
Within administrative expenses 12.3 11.8
Amortisation of intangible assets
Within selling and distribution costs 1.0 1.8
Within administrative expenses1 21.7 18.5
Loss on disposal of property, plant and equipment and intangible assets 3.5 1.2
Net impairment of intangible assets2 12 7.1 –
Net impairment of property, plant and equipment 13 15.9 26.5
Employee costs3,4 484.7 427.5
Operating lease rentals
Minimum lease payments5 239.0 235.3
Contingent rents 108.6 86.1
Net exchange gain on revaluation of monetary assets and liabilities (12.2) (1.6)
Net exchange loss on derivatives held for trading for the year 0.2 5.8
Trade receivables net impairment charge 2.4 3.1
Adjusting items
Adjusting operating items
Charge relating to the fragrance and beauty licence intangible asset 7 26.1 14.9
Restructuring costs 7 20.8 –
Revaluation of deferred consideration liability 7 3.0 –
Costs relating to the transfer of the Beauty operations 7 14.5 –
Total adjusting operating items 64.4 14.9
Adjusting financing items
Put option liability finance charge/(income) 7 1.0 (9.9)
Finance charge on deferred consideration liability 7 2.2 –
Total adjusting financing items 3.2 (9.9)
1 Amortisation of intangible assets within administrative expenses has been presented excluding amortisation of £7.5m (2016: £14.9) relating to the fragrance and
beauty licence intangible, which has been presented as adjusting (refer to note 7).
2 Net impairment of intangible assets for the year ended 31 March 2017 is presented excluding an impairment of £18.6m relating to the fragrance and beauty
licence intangible and an impairment of £7.3m of software assets specifically relating to the transfer of the Beauty operations, which have been presented as
adjusting (refer to note 7).
3 Employee costs for the year ended 31 March 2017 are presented excluding £9.7m of costs arising as a result of the cost-efficiency programme, which are
presented as adjusting (refer to note 7).
4 Employee costs for the year ended 31 March 2016 have been re-presented to include employee-related costs recognised within cost of sales.
5 Minimum lease payments include charges for onerous lease provisions during the year ended 31 March 2017 of £7.9m (2016: £20.1m) and does not include
payments of £8.3m (2016: £5.0m) where existing onerous lease provisions have been utilised.

24
Notes to the Financial Statements 7. Adjusting items Charge relating to the fragrance and beauty licence intangible asset During the year ended 31 March 2013, an intangible asset of £70.9m was recognised on the Balance Sheet, relating to the present value of the anticipated incremental income to be earned by the Group as a result of selling Beauty products through retail and wholesale channels rather than under licence, following the termination of the existing licence relationship with Interparfums SA. This asset was being amortised on a straight-line basis over the period 1 April 2013 to 31 December 2017.
During the six months ended 30 September 2016, amortisation expense of £7.5m was recognised in relation to the fragrance and beauty licence intangible. At 30 September 2016, management carried out an impairment assessment of the carrying value of this asset based on a value-in-use calculation using latest estimates for cost and revenue projections. As a result of a reduction in projected revenue over the remaining life to 31 December 2017, compared to previous estimates, management concluded that the book value of the asset was not supported by its value-in-use. An impairment charge of £18.6m was recognised at 30 September 2016, to write the remaining balance of the intangible asset down to nil.
The total charge in relation to the fragrance and beauty licence intangible for the year ended 31 March 2017 is £26.1m (2016: £14.9m). This has been presented as an adjusting item, which is consistent with the treatment of the cost recognised on termination of the licence relationship in the year ended 31 March 2013. A related tax credit of £5.1m (2016: £2.8m) has also been recognised in the current period.
Restructuring costs Restructuring costs of £20.8m were incurred in the current period, arising as a result of the Group’s cost-efficiency programme announced in May 2016. These costs are presented as an adjusting item as they are considered material and one-off in nature, being part of a restructuring programme running from May 2016 to March 2019, with restructuring costs being incurred in the first two years. The most significant elements of the restructuring costs relate to redundancies and consultancy costs supporting organisational design and development of strategic growth and productivity initiatives, with the remainder relating to legal advice and project assurance. £16.7m of this cost was settled in the period with the balance being accrued at 31 March 2017. A related tax credit of £4.2m has also been recognised in the current period.
Items relating to the deferred consideration liability On 22 April 2016, the Group entered into an agreement to transfer the economic right to the non-controlling interest in Burberry Middle East LLC to the Group in consideration of contingent payments to be made to the minority shareholder relating to an agreed percentage of the future revenue of Burberry Middle East LLC and its subsidiaries, Burberry Al Kuwait General Trading Textiles and Accessories Company WLL and Burberry Qatar WLL, over the period 2016 to 2023, together with fixed payments of AED 120.0m (£22.6m), relating to profits of Burberry Middle East LLC up to 31 March 2016, to be paid over the period 2016 to 2019. A liability for the present value of the fixed and contingent deferred consideration of AED 236.0m (£44.6m) was recognised at this point. Refer to note 17 for further details of the deferred consideration liability.
A charge of £3.0m in relation to the revaluation of this balance has been recognised in operating expenses for the year ended 31 March 2017. A financing charge of £2.2m in relation to the unwinding of the discount on the non-current portion of the deferred consideration liability has also been recognised for the year ended 31 March 2017. These movements are unrealised. No tax has been recognised on either of these items, as the future payments are not considered to be deductible for tax purposes. These items are presented as adjusting items in accordance with the Group accounting policy, as they arise from changes in the value of the liability for expected future payments relating to the purchase of a non-controlling interest in the Group.
Put option liability finance charge/income The financing charge of £1.0m for the year ended 31 March 2017 (2016: income of £9.9m) relates to fair value movements including the unwinding of the discount on the put option liability over the non-controlling interest in Burberry (Shanghai) Trading Co., Ltd. No tax has been recognised on this item, as the value of the option on exercise is not considered to be deductible for tax purposes. This item has been presented as an adjusting item in accordance with the Group accounting policy as it arises from changes in the value of the liability for expected future payments relating to the purchase of a non-controlling interest in the Group. Refer to note 17 for further details of the carrying value of the put option liability.

25
Notes to the Financial Statements 7. Adjusting items (continued) Costs relating to the transfer of the Beauty operations On 3 April 2017 Burberry entered into an agreement with Coty Geneva SARL Versoix (Coty) to grant Coty a licence for its fragrance and beauty products and to transfer Burberry’s Beauty operations to Coty. This agreement is expected to complete in October 2017. The licence agreement and the business transfer will be accounted for in the financial statements for the year ending 31 March 2018. Further details of the agreement to transfer the beauty operations business are set out in note 25.
Costs of £14.5m arising in relation to the transaction have been incurred and recognised in the current period. These costs related to the write-off of software assets specifically relating to the Beauty operations of £7.3m (refer to note 12); a provision for the termination of a distributor agreement; and other ancillary charges incurred. None of these costs were paid in the period. These costs are presented as an adjusting item in accordance with the Group’s accounting policy as they arise in relation to the transfer of a business. A related tax credit of £2.9m has also been recognised in the period. 8. Financing
Note
Year to 31 March
2017 £m
Year to31 March
2016£m
Bank interest income 5.0 4.6
Other finance income 0.5 0.5
Finance income 5.5 5.1
Interest expense on bank loans and overdrafts (1.0) (1.5)
Bank charges (0.7) (0.7)
Other finance expense (0.1) (0.1)
Finance expense (1.8) (2.3)
Put option liability finance (charge)/income 7 (1.0) 9.9
Finance charge on deferred consideration liability 7 (2.2) –
Other financing (charge)/income (3.2) 9.9
Net finance income 0.5 12.7
9. Taxation Analysis of charge for the year recognised in the Group Income Statement:
Year to 31 March
2017 £m
Year to31 March
2016£m
Current tax
UK corporation tax
Current tax on income for the year to 31 March 2017 at 20% (2016: 20%) 48.2 52.8
Double taxation relief (0.8) (0.8)
Adjustments in respect of prior years (3.3) (3.1)
44.1 48.9
Foreign tax
Current tax on income for the year 45.3 49.1
Adjustments in respect of prior years (6.3) (2.0)
Total current tax 83.1 96.0
Deferred tax
UK deferred tax
Origination and reversal of temporary differences (0.2) 9.9
Impact of changes to tax rates 0.8 1.3
Adjustments in respect of prior years (0.4) (0.7)
0.2 10.5
Foreign deferred tax
Origination and reversal of temporary differences 19.7 (13.1)
Impact of changes to tax rates (0.2) –
Adjustments in respect of prior years 4.3 7.6
Total deferred tax 24.0 5.0
Total tax charge on profit 107.1 101.0

26
Notes to the Financial Statements 9. Taxation (continued) Analysis of charge for the year recognised in other comprehensive income and directly in equity:
Year to 31 March
2017 £m
Year to31 March
2016£m
Current tax
Recognised in other comprehensive income
Current tax charge on exchange differences on loans (foreign currency translation reserve) 5.4 1.9
Current tax charge on cash flow hedges deferred in equity (hedging reserve) 1.9 –
Current tax credit on net investment hedges deferred in equity (hedging reserve) (0.6) –
Total current tax recognised in other comprehensive income 6.7 1.9
Recognised in equity
Current tax credit on share options (retained earnings) (0.4) (2.0)
Total current tax recognised directly in equity (0.4) (2.0)
Deferred tax
Recognised in other comprehensive income
Deferred tax charge on cash flow hedges deferred in equity (hedging reserve) – 1.5
Deferred tax (credit)/charge on cash flow hedges transferred to income (hedging reserve) (0.9) 0.7
Deferred tax charge/(credit) on net investment hedges deferred in equity (hedging reserve) 0.1 (0.1)
Deferred tax credit on net investment hedges transferred to income (hedging reserve) – (0.5)
Total deferred tax recognised in other comprehensive income (0.8) 1.6
Recognised in equity
Deferred tax (credit)/charge on share options (retained earnings) (0.5) 6.5
Total deferred tax recognised directly in equity (0.5) 6.5
The tax rate applicable on profit varied from the standard rate of corporation tax in the UK due to the following factors:
Year to 31 March
2017 £m
Year to31 March
2016£m
Profit before taxation 394.8 415.6
Tax at 20% (2016: 20%) on profit before taxation 79.0 83.1
Rate adjustments relating to overseas profits 14.1 3.4
Permanent differences 5.7 5.5
Tax on dividends not creditable 6.1 1.6
Current year tax losses not recognised 5.5 4.7
Prior year tax losses recognised in the year – (0.4)
Prior year tax losses no longer recognised 1.8 –
Adjustments in respect of prior years (5.7) 1.8
Adjustments to deferred tax relating to changes in tax rates 0.6 1.3
Total taxation charge 107.1 101.0
Total taxation recognised in the Group Income Statement arises on:
Year to 31 March
2017 £m
Year to31 March
2016£m
Adjusted profit before taxation 119.3 103.8
Adjusting items (12.2) (2.8)
Total taxation charge 107.1 101.0

27
Notes to the Financial Statements 10. Earnings per share The calculation of basic earnings per share is based on profit or loss attributable to owners of the Company for the year divided by the weighted average number of ordinary shares in issue during the year. Basic and diluted earnings per share based on adjusted profit before taxation are also disclosed to indicate the underlying profitability of the Group.
Year to 31 March
2017 £m
Year to31 March
2016£m
Attributable profit for the year before adjusting items1 342.2 311.7
Effect of adjusting items1 (after taxation) (55.4) (2.2)
Attributable profit for the year 286.8 309.5
1 Refer to note 7 for details of adjusting items.
The weighted average number of ordinary shares represents the weighted average number of Burberry Group plc ordinary shares in issue throughout the year, excluding ordinary shares held in the Group’s ESOP trusts.
Diluted earnings per share is based on the weighted average number of ordinary shares in issue during the year. In addition, account is taken of any options and awards made under the employee share incentive schemes, which will have a dilutive effect when exercised.
Year to 31 March
2017 Millions
Year to31 March
2016Millions
Weighted average number of ordinary shares in issue during the year 439.1 441.9
Dilutive effect of the employee share incentive schemes 3.1 4.2
Diluted weighted average number of ordinary shares in issue during the year 442.2 446.1
11. Dividends paid to owners of the Company
Year to 31 March
2017 £m
Year to31 March
2016£m
Prior year final dividend paid 26.8p per share (2016: 25.5p) 118.6 112.5
Interim dividend paid 10.5p per share (2016: 10.2p) 45.8 45.2
Total 164.4 157.7
A final dividend in respect of the year to 31 March 2017 of 28.4p (2016: 26.8p) per share, amounting to £123.6m, has been proposed for approval by the shareholders at the Annual General Meeting subsequent to the balance sheet date. The final dividend to Burberry Group plc shareholders has not been recognised as a liability at the year end and will be paid on 4 August 2017 to shareholders on the register at the close of business on 7 July 2017.

28
Notes to the Financial Statements 12. Intangible assets
Cost Goodwill
£m
Trade marks, licences and
other intangible assets
£m
Computer Software1
£m
Intangible assets in the
course of construction
£m Total
£m
As at 31 March 2015 88.8 87.0 121.0 12.2 309.0
Effect of foreign exchange rate changes – 0.5 0.2 – 0.7
Additions – 0.6 9.0 21.6 31.2
Disposals – (0.2) (7.3) – (7.5)
Reclassifications from assets in the course
of construction – – 10.8 (10.8) –
As at 31 March 2016 88.8 87.9 133.7 23.0 333.4
Effect of foreign exchange rate changes 10.8 0.6 3.7 – 15.1
Additions – 0.3 14.9 18.9 34.1
Disposals – – (7.5) (1.5) (9.0)
Reclassifications from assets in the course
of construction – – 20.1 (20.1) –
As at 31 March 2017 99.6 88.8 164.9 20.3 373.6
Accumulated amortisation and impairment
As at 31 March 2015 – 37.1 78.4 – 115.5
Effect of foreign exchange rate changes – 0.3 0.3 – 0.6
Charge for the year – 16.0 19.2 – 35.2
Disposals – (0.2) (7.3) – (7.5)
As at 31 March 2016 – 53.2 90.6 – 143.8
Effect of foreign exchange rate changes – 0.4 2.7 – 3.1
Charge for the year – 8.4 21.8 – 30.2
Disposals – – (6.6) – (6.6)
Net impairment charge on assets – 18.6 14.4 – 33.0
As at 31 March 2017 – 80.6 122.9 – 203.5
Net book value
As at 31 March 2017 99.6 8.2 42.0 20.3 170.1
As at 31 March 2016 88.8 34.7 43.1 23.0 189.6
1 During the year ended 31 March 2017, software assets of £14.4m were impaired, of which £7.3m related to the transfer of the Beauty operations and is included
in adjusting items (see note 7).
Fragrance and beauty licence intangible asset During the year ended 31 March 2013, an intangible asset of £70.9m was recognised on the Balance Sheet, relating to the present value of the anticipated incremental income to be earned by the Group as a result of selling Beauty products through retail and wholesale channels rather than under licence following the termination of the existing licence relationship with Interparfums SA. This asset is presented within the intangible asset category ‘trade mark, licences and other intangible assets’, and was being amortised on a straight-line basis over the period 1 April 2013 to 31 December 2017. The carrying value of this asset was £26.1m at 31 March 2016. At 30 September 2016 an impairment charge of £18.6m was recorded to write the carrying value of this intangible asset down to nil. Refer to note 7 for further details.

29
Notes to the Financial Statements 12. Intangible assets (continued) Impairment testing of goodwill The carrying value of the goodwill allocated to cash generating units:
As at 31 March
2017 £m
As at31 March
2016£m
China1 48.9 45.4
Korea 29.4 25.1
Other 21.3 18.3
Total 99.6 88.8
1 The goodwill reported for China does not include any goodwill attributable to the non-controlling interest.
The Group tests goodwill for impairment annually or where there is an indication that goodwill might be impaired. The recoverable amount of all cash generating units has been determined on a value-in-use basis. Value-in-use calculations for each cash generating unit are based on projected three-year pre-tax discounted cash flows together with a discounted terminal value. The cash flows have been discounted at pre-tax rates reflecting the Group’s weighted average cost of capital adjusted for country-specific tax rates and risks. Where the cash generating unit has a non-controlling interest which was recognised at a value equal to its proportionate interest in the net identifiable assets of the acquired subsidiary at the acquisition date, the carrying amount of the goodwill has been grossed up, to include the goodwill attributable to the non-controlling interest, for the purpose of impairment testing the goodwill attributable to the cash generating unit. The key assumptions contained in the value-in-use calculations include the future revenues, the margins achieved, the assumed life of the business and the discount rates applied.
The value-in-use calculations have been prepared using management’s approved financial plans for the three years ending 31 March 2020. These plans contain management’s best view of the expected performance for the year ending 31 March 2018 and the expected growth rates for the two years ending 31 March 2019 and 31 March 2020. The plans are based on the performance achieved in the current year and management’s knowledge of the market environment and future business plans. A terminal value has been included in the value-in-use calculation based on the cash flows for the year ending 31 March 2020 incorporating the assumption that there is no growth beyond 31 March 2020.
For the material goodwill balances of China and Korea, a sensitivity analysis has been performed on the value-in-use calculations by assuming no growth beyond the year ending 31 March 2018. This sensitivity analysis indicated significant headroom between the recoverable amount under this scenario and the carrying value of goodwill and therefore management considered no further detailed sensitivity analysis was required.
The pre-tax discount rates for China and Korea were 16.7% and 14.0% respectively (2016: 16.1%; 13.6%).
The other goodwill balance of £21.3m (2016: £18.3m) consists of amounts relating to eight cash generating units, none of which have goodwill balances exceeding £10m as at 31 March 2017.
No impairment has been recognised in respect of the carrying value of the goodwill balance in the year as, for each cash generating unit, the recoverable amount of goodwill exceeds its carrying value.

30
Notes to the Financial Statements 13. Property, plant and equipment
Cost
Freehold land and buildings
£m
Leasehold improvements
£m
Fixtures, fittings and equipment1
£m
Assets in the course of
construction £m
Total£m
As at 31 March 2015 137.5 361.5 443.5 27.8 970.3
Effect of foreign exchange rate changes 6.2 11.7 15.3 (0.5) 32.7
Additions 15.3 49.5 41.7 8.5 115.0
Disposals – (12.6) (26.7) (0.5) (39.8)
Reclassification from assets in the course
of construction – 8.2 17.7 (25.9) –
As at 31 March 2016 159.0 418.3 491.5 9.4 1,078.2
Effect of foreign exchange rate changes 18.4 47.5 43.7 1.0 110.6
Additions 0.4 37.4 27.0 13.2 78.0
Disposals (29.2) (32.4) (28.5) (0.4) (90.5)
Reclassification from assets in the course
of construction – 4.0 4.7 (8.7) –
As at 31 March 2017 148.6 474.8 538.4 14.5 1,176.3
Accumulated depreciation and impairment
As at 31 March 2015 48.2 181.3 304.3 – 533.8
Effect of foreign exchange rate changes 2.8 4.9 10.7 – 18.4
Charge for the year 3.3 45.9 62.7 – 111.9
Disposals – (12.4) (26.2) – (38.6)
Net impairment charge on assets 2.3 13.7 10.5 – 26.5
As at 31 March 2016 56.6 233.4 362.0 – 652.0
Effect of foreign exchange rate changes 6.7 28.5 33.2 – 68.4
Charge for the year 4.3 52.3 64.7 – 121.3
Disposals (21.3) (32.0) (27.6) – (80.9)
Net impairment charge on assets 0.6 8.1 7.2 – 15.9
As at 31 March 2017 46.9 290.3 439.5 – 776.7
Net book value
As at 31 March 2017 101.7 184.5 98.9 14.5 399.6
As at 31 March 2016 102.4 184.9 129.5 9.4 426.2
1 Included in fixtures, fittings and equipment are finance lease assets with a net book value of £1.3m (2016: £1.7m).
During the year to 31 March 2017, a net impairment charge of £23.0m (2016: £45.3m) was recorded as a result of the annual review of impairment of retail store assets. A charge of £15.3m (2016: £24.2m) was recognised against property, plant and equipment, and £7.7m (2016: £21.1m) was charged in relation to onerous lease provisions. Refer to note 18 for further details of onerous lease provisions.
Where indicators of impairment were identified, the impairment review compared the value-in-use of the cash generating units to the carrying values at 31 March 2017. The pre-tax cash flow projections were based on financial plans of expected revenues and costs for each retail cash generating unit, as approved by management, and extrapolated beyond the budget year to the lease exit dates using growth rates and inflation rates appropriate to each store’s location. The pre-tax discount rates used in these calculations were between 11.4% and 21.6% (2016: between 11.4% and 19.7%), based on the Group’s weighted average cost of capital adjusted for country-specific tax rates and risks. Where the value-in-use was less than the carrying value of the cash generating unit, an impairment of property, plant and equipment was recorded. Where the value-in-use was negative, onerous lease provisions were assessed in relation to the future contracted minimum lease payments. Potential alternative uses for property, such as subletting of leasehold or sale of freehold, were considered in estimating both the value for impairment charges and onerous lease provisions.

31
Notes to the Financial Statements 13. Property, plant and equipment (continued) Management has considered the potential impact of changes in assumptions on the total recorded as a result of the review for impairment of retail store assets and consideration of onerous lease provisions. The most significant estimate is the future level of revenues achieved by the retail stores. It is estimated that, for the stores subject to an impairment or onerous lease provision in the year, a 5% decrease/increase in revenue assumptions for the year ending 31 March 2018, with no change to subsequent forecast revenue growth rate assumptions, would result in an £8m increase/£9m decrease in the charge in the year ended 31 March 2017.
The impairment charge recorded in property, plant and equipment relates to 33 retail cash generating units (2016: 32 retail cash generating units) for which the total recoverable amount at the balance sheet date is £22.0m (2016: £18.2m). Impairment charges of £0.6m (2016: £2.3m) arose relating to other assets in the year.
14. Trade and other receivables
As at 31 March
2017 £m
As at31 March
2016£m
Non-current
Deposits and other financial receivables 44.9 37.5
Other non-financial receivables 3.7 2.8
Prepayments 27.8 26.2
Total non-current trade and other receivables 76.4 66.5
Current
Trade receivables 201.3 205.1
Provision for doubtful debts (9.5) (7.2)
Net trade receivables 191.8 197.9
Other financial receivables 22.3 20.9
Other non-financial receivables 20.4 27.5
Prepayments 38.1 35.4
Accrued income 3.0 3.7
Total current trade and other receivables 275.6 285.4
Total trade and other receivables 352.0 351.9
Included in total trade and other receivables are non-financial assets of £90.0m (2016: £91.9m).
The individually impaired receivables relate to balances with trading parties which have passed their payment due dates or where uncertainty exists over recoverability. As at 31 March 2017, trade receivables of £17.2m (2016: £18.2m) were impaired. The amount of the provision against these receivables was £9.5m as at 31 March 2017 (2016: £7.2m). It was assessed that a portion of the receivables is expected to be recovered. The ageing of the impaired trade receivables is as follows:
As at 31 March
2017 £m
As at31 March
2016£m
Current – 3.7
Less than 1 month overdue 7.0 11.5
1 to 3 months overdue 2.3 1.5
Over 3 months overdue 7.9 1.5
17.2 18.2

32
Notes to the Financial Statements 14. Trade and other receivables (continued) As at 31 March 2017, trade receivables of £20.9m (2016: £9.3m) were overdue but not impaired. The ageing of these overdue receivables is as follows:
As at 31 March
2017 £m
As at31 March
2016£m
Less than 1 month overdue 8.4 4.3
1 to 3 months overdue 12.1 4.1
Over 3 months overdue 0.4 0.9
20.9 9.3
Movement in the provision for doubtful debts is as follows:
Year to 31 March
2017 £m
Year to31 March
2016£m
As at 1 April 7.2 4.6
Effect of foreign exchange rate changes 0.2 –
Increase in provision for doubtful debts 2.4 3.1
Receivables written off during the year as uncollectable (0.3) (0.5)
As at 31 March 9.5 7.2
As at 31 March 2017 there were £1.6m impaired receivables within other receivables (2016: £1.5m).
The carrying amounts of the Group’s non-derivative financial assets excluding cash and cash equivalents by customer geographical location are:
Year to 31 March
2017 £m
Year to31 March
2016£m
Asia Pacific 120.4 99.3
EMEIA 78.1 89.1
Americas 63.5 71.6
262.0 260.0
15. Inventories
As at 31 March
2017 £m
As at31 March
2016£m
Raw materials 32.7 38.3
Work in progress 1.8 1.3
Finished goods 470.8 447.1
Total inventories 505.3 486.7
The cost of inventories recognised as an expense and included in cost of sales amounted to £795.9m (2016: £723.3m). The net movement in inventory provisions included in cost of sales for the year ended 31 March 2017 was a cost of £21.1m (2016: £24.9m).
The cost of finished goods physically destroyed in the year was £26.9m (2016: £18.8m).
16. Cash and cash equivalents
As at 31 March
2017 £m
As at31 March
2016£m
Cash at bank and in hand 268.7 282.1
Short-term deposits 574.8 429.7
Total 843.5 711.8

33
Notes to the Financial Statements 17. Trade and other payables
As at 31 March
2017 £m
As at31 March
2016£m
Non-current
Put option liability over non-controlling interest – 45.8
Other payables 2.5 3.0
Deferred income and non-financial accruals 75.6 65.9
Deferred consideration 23.8 –
Total non-current trade and other payables 101.9 114.7
Current
Trade payables 172.3 167.2
Other taxes and social security costs 58.7 58.3
Other payables1 8.2 3.9
Accruals 186.9 132.4
Deferred income and non-financial accruals 22.1 25.4
Deferred consideration 10.9 –
Total current trade and other payables 459.1 387.2
Total trade and other payables 561.0 501.9
1 Includes £3.3m (2016: £nil) relating to the cost of shares not yet purchased under an agreement entered in to by the Company to purchase its own shares,
together with anticipated stamp duty arising. Refer to note 20 for further details.
Included in total trade and other payables are non-financial liabilities of £156.5m (2016: £149.6m).
Put option liability over non-controlling interest Following the acquisition of the Burberry retail and distribution business in China, Sparkle Roll Holdings Limited, a non-Group company, retained a 15% economic interest in the Group’s business in China. Put and call options were granted over this interest stake which were exercisable after 1 September 2015 in the case of the call option, and after 1 September 2020 in the case of the put option. The net present value of the put option liability was recognised as a non-current financial liability under IAS 39. On 1 August 2016, the Group exercised the call option relating to the economic interest. As a result, the put option expired at this date.
The value of the put option liability is £nil at 31 March 2017 (2016: £45.8m). The movement in the liability for the period includes an increase of £1.0m relating to unrealised fair value movements, as described in note 7, together with an increase due to the translation of the put option liability to the Group’s presentational currency, combined with the derecognition of £51.0m on its expiry. Refer to note 23 for further details.
Deferred consideration Following the purchase of the economic right to the non-controlling interest in Burberry Middle East LLC on 22 April 2016, the Group has recognised a liability in relation to the deferred consideration for this transaction. Refer to note 23 for further details of this transaction. The deferred consideration consists of fixed payments to be paid over the period 2016 to 2019, and contingent payments calculated as an agreed percentage of the future revenue of Burberry Middle East LLC and its subsidiaries, over the period 2016 to 2023.
The fair value of the deferred consideration relating to the fixed payments has been derived via a present value calculation of the remaining fixed payments of AED 38.1m (£8.3m) discounted at an appropriate risk-free rate applicable to Burberry Middle East LLC.
The fair value of the deferred consideration relating to the contingent payments has been estimated using a present value calculation, incorporating observable and non-observable inputs. The inputs applied in arriving at the value of this component of the deferred consideration are an estimate of the future revenue of Burberry Middle East LLC and its subsidiaries from the current period to 2023 and an appropriate risk adjusted discount rate for Burberry Middle East LLC.
The carrying value of the deferred consideration relating to contingent payments is dependent on assumptions applied in determining these inputs, and is subject to change in the event that there is a change in any of these assumptions. The valuation is updated at every reporting period or more often if a significant change to any input is observed.
A 10% increase/decrease in the estimate of future revenues of Burberry Middle East LLC and its subsidiaries would result in a £2.3m increase/decrease in the carrying value of the deferred consideration relating to contingent payments at 31 March 2017 and a corresponding £2.3m decrease/increase in the profit before taxation for the year ended 31 March 2017.

34
Notes to the Financial Statements 18. Provisions for other liabilities and charges
Property obligations
£m
Restructuring costs
£m
Other costs
£m Total
£m
Balance as at 31 March 2015 29.4 0.8 2.3 32.5
Effect of foreign exchange rate changes 1.0 – 0.1 1.1
Created during the year 30.8 – 2.2 33.0
Discount unwind 0.1 – – 0.1
Utilised during the year (5.8) (0.1) (0.2) (6.1)
Released during the year (3.7) (0.7) (0.2) (4.6)
Balance as at 31 March 2016 51.8 – 4.2 56.0
Effect of foreign exchange rate changes 6.2 – 0.1 6.3
Created during the year 18.8 – 6.9 25.7
Discount unwind 0.1 – – 0.1
Utilised during the year (11.1) – (1.0) (12.1)
Released during the year (8.1) – (2.5) (10.6)
Balance as at 31 March 2017 57.7 – 7.7 65.4
Within property obligations are amounts of £30.3m (2016: £27.0m) relating to onerous lease obligations. See note 13 for details relating to impairment of assets and onerous lease provisions for retail cash generating units.
The net charge in the year for onerous lease obligations is £7.9m (2016: £20.1m). This includes amounts of £7.7m (2016: £21.1m) relating to retail stores (refer to note 13) and a charge of £0.2m (2016: credit of £1.0m) relating to other properties.
As at 31 March
2017 £m
As at31 March
2016£m
Analysis of total provisions:
Non-current 47.3 38.4
Current 18.1 17.6
Total 65.4 56.0
The non-current provisions relate to provisions for onerous leases and property reinstatement costs which are expected to be utilised within 19 years (2016: 20 years).
19. Bank overdrafts and borrowings Included within bank overdrafts is £31.3m (2016: £44.9m) representing balances on cash pooling arrangements in the Group.
The Group has a number of committed and uncommitted arrangements agreed with third-parties. At 31 March 2017, the Group held bank overdrafts of £3.0m (2016: £6.6m) excluding balances on cash pooling arrangements.
On 25 November 2014, the Group entered into a £300m multi-currency revolving credit facility with a syndicate of banks. At 31 March 2017, there were £nil outstanding drawings (2016: £nil). During the year the Group exercised an option to extend the maturity of the facility to November 2021, after receiving consent from all members of the syndicate. The Group is in compliance with the financial and other covenants within this facility and has been in compliance throughout the financial year.
The fair value of borrowings and overdrafts approximate the carrying amount because of the short maturity of these instruments.

35
Notes to the Financial Statements 20. Share capital and reserves Allotted, called up and fully paid share capital Number £m
Ordinary shares of 0.05p (2016: 0.05p) each
As at 31 March 2015 444,744,067 0.2
Allotted on exercise of options during the year 293,187 –
As at 31 March 2016 445,037,254 0.2
Allotted on exercise of options during the year 135,811 –
As at 31 March 2017 445,173,065 0.2
The Company has a general authority from shareholders, renewed at each Annual General Meeting, to repurchase a maximum of 10% of its issued share capital. During the year ended 31 March 2017, the Company entered into an agreement to purchase £100m of its own shares back as part of a share buy-back programme. Own shares purchased by the Company, as part of a share buy-back programme, are classified as treasury shares and their cost offset against retained earnings. When treasury shares are cancelled, a transfer is made from retained earnings to capital redemption reserve, equivalent to the nominal value of the shares purchased and subsequently cancelled. The cost of shares purchased by ESOP trusts are offset against retained earnings, as the amounts paid reduce the profits available for distribution by the Company.
As at 31 March 2017 the amount held as treasury shares by the Company and offset against retained earnings is £97.2m (2016: £nil) including stamp duty of £0.5m (2016: £nil). As at 31 March 2017 the Company held 6.7m treasury shares (2016: nil), with a market value of £116.1m (2016: £nil). £3.3m (2016: £nil), relating to the cost of shares not yet purchased under the current share buy-back agreement, has been charged to retained earnings in the period, with the payment obligation recognised in other payables (note 17).
As at 31 March 2017 the amount of own shares held by ESOP trusts and offset against retained earnings is £44.7m (2016: £39.9m). As at 31 March 2017, the ESOP trusts held 3.5m shares (2016: 3.1m) in the Company, with a market value of £59.6m (2016: £42.7m). In the year to 31 March 2017 the ESOP trusts have waived their entitlement to dividends of £1.7m (2016: £1.2m).
During the year profits of £nil (2016: £2.0m) have been transferred to capital reserves due to statutory requirements of subsidiaries. In the year ended 31 March 2016, £6.2m was transferred from capital reserves to retained earnings due to the disposal and merger of subsidiaries. No such activity took place in the current year. The capital reserve consists of non-distributable reserves and the capital redemption reserve arising on the purchase of own shares.
Other reserves in the Statement of Changes in Equity consists of the capital reserve, the foreign currency translation reserve, and the hedging reserves. The hedging reserves consist of the cash flow hedge reserve and the net investment hedge reserve.
Capitalreserve
£m
Hedging reserves Foreign
currency translation
reserve£m
Total£m
Cash flow hedges
£m
Net investment
hedge £m
Balance as at 31 March 2015 45.3 (4.4) 4.1 147.3 192.3
Other comprehensive income:
Cash flow hedges – gains deferred in equity – 7.3 – – 7.3
Cash flow hedges – losses transferred to income – 3.5 – – 3.5
Net investment hedges – losses deferred in equity – – (0.8) – (0.8)
Foreign currency translation differences – – – 19.5 19.5
Tax on other comprehensive income – (2.2) 0.6 (1.9) (3.5)
Total comprehensive income/(expense) for the year – 8.6 (0.2) 17.6 26.0
Disposal of subsidiaries (6.2) – – – (6.2)
Transfer between reserves 2.0 – – – 2.0
Balance as at 31 March 2016 41.1 4.2 3.9 164.9 214.1
Other comprehensive income:
Cash flow hedges – gains deferred in equity – 8.7 – – 8.7
Cash flow hedges – gains transferred to income – (4.0) – – (4.0)
Net investment hedges – losses deferred in equity – – (2.3) – (2.3)
Foreign currency translation differences – – – 101.3 101.3
Tax on other comprehensive income – (1.0) 0.5 (5.4) (5.9)
Total comprehensive income for the year – 3.7 (1.8) 95.9 97.8
Balance as at 31 March 2017 41.1 7.9 2.1 260.8 311.9

36
Notes to the Financial Statements 21. Capital commitments
As at 31 March
2017 £m
As at31 March
2016£m
Capital commitments contracted but not provided for:
Property, plant and equipment 13.2 15.2
Intangible assets 3.2 1.6
Total 16.4 16.8
Contracted capital commitments represent contracts entered into by the year end and future work in respect of major capital expenditure projects where activity has commenced by the year end relating to property, plant and equipment and intangible assets.
22. Related party transactions Transactions between the Company and its subsidiaries, which are related parties of the Company, have been eliminated on consolidation and are not disclosed in this note. Total compensation in respect of key management, who are defined as the Board of Directors and certain members of senior management, is considered to be a related party transaction.
The total compensation in respect of key management for the year was as follows:
Year to 31 March
2017 £m
Year to31 March
2016£m
Salaries, short-term benefits and social security costs 14.3 9.1
Termination benefits 1.6 –
Post-employment benefits – 0.1
Share based compensation (all awards and options settled in shares) 5.5 0.5
Total 21.4 9.7
There were no other material related party transactions in the period.
23. Transactions with non-controlling interests During the year ended 31 March 2017, the Group entered into two transactions with non-controlling interests. The impact of these transactions has been presented in the financial statements of the Group in the following manner:
Burberry Middle East
transaction Burberry Shanghai
transaction Total
£m
£m £m £m
Charge taken through statement of changes in equity 44.6 53.7 98.3
Cash outflow recognised in statement of cash flows (15.1) (53.7) (68.8)
A liability in relation to the remaining deferred consideration to be paid on the Burberry Middle East transaction has also been recognised. Refer to note 17 for further details on the carrying value of the liability at 31 March 2017.

37
Notes to the Financial Statements 23. Transactions with non-controlling interests (continued) Burberry Middle East LLC On 22 April 2016 the Group entered into an agreement to transfer the economic right to the non-controlling interest in Burberry Middle East LLC to the Group in consideration for payments to be made to the minority shareholder relating to an agreed percentage of the future revenue of Burberry Middle East LLC and its subsidiaries, Burberry Al Kuwait General Trading Textiles and Accessories Company WLL and Burberry Qatar WLL, over the period 2016 to 2023, together with fixed payments of AED 120.0m (£22.6m), relating to profits of Burberry Middle East LLC up to 31 March 2016, to be paid over the period 2016 to 2019.
In the judgement of management, the fixed payments of AED 120.0m are most appropriately treated as part of the consideration for purchasing the non-controlling interest in Burberry Middle East LLC. Therefore the transaction has been accounted for as a purchase of the non-controlling interest in Burberry Middle East LLC and its subsidiaries by the Group, for fixed and contingent deferred consideration, with the exception of a 12% interest in Burberry Qatar WLL which will continue to be held by another minority shareholder.
The present value of the fixed and contingent deferred consideration in total, at the date of the transaction, was estimated to be AED 236.0m (£44.6m). Non-controlling interests with a book value of £25.5m were transferred to retained earnings. Deferred consideration of AED 80.7m (£15.1m) was subsequently settled in the period.
Burberry (Shanghai) Trading Co., Ltd On 1 August 2016, the Group acquired the remaining 15% economic interest in its business in China, which was held by Sparkle Roll Holdings Ltd, a non-Group company, for consideration of CNY 470.9m (£53.7m), through the exercise of a call option held by the Group. The transaction has been accounted for as a purchase of the 15% non-controlling interest in Burberry (Shanghai) Trading Co., Ltd, for consideration of £53.7m. Non-controlling interests with a book value of £27.7m were transferred to retained earnings.
The Group had also granted a put option over the same 15% economic interest to Sparkle Retail Holdings Ltd which was exercisable after 1 September 2020. The net present value of the expected put option payment was held as a non-current financial liability. Upon exercise of the call option by the Group, the put option expired and as a result, the value of the liability at the date of exercise, being £51.0m, was transferred directly to retained earnings.
24. Contingent liabilities In a number of jurisdictions the Group is subject to claims against it and to tax audits. These typically relate to Value Added Taxes, sales taxes, customs duties, corporate taxes, transfer pricing, payroll taxes, various contractual claims and other matters. During the year, the Group reached a resolution of its dispute with the Spanish tax authorities regarding the tax treatment of interest paid during the year ended 31 March 2005. Where appropriate, the estimated cost of known obligations have been provided in these financial statements in accordance with the Group’s accounting policies but these matters are inherently difficult to quantify. While changes to the amounts that may be payable could be material to the results or cash flows of the Group in the period in which they are recognised, the Group does not currently expect the outcome of these contingent liabilities to have a material effect on the Group’s financial condition.
25. Events after the balance sheet date On 3 April 2017 Burberry entered into an agreement with Coty Geneva SARL Versoix (Coty) to grant Coty a licence for its fragrance and beauty products and to transfer Burberry’s Beauty operations to Coty. Under this agreement, Coty will make an upfront payment to Burberry of £130m for the licence and related transfer of the Beauty operations. Coty will also pay Burberry for assets transferring, principally inventory, estimated to be approximately £50m subject to any completion adjustments. Burberry will receive further payments, relating to royalties, over the term of the licence.
This agreement is expected to complete in October 2017. Burberry will receive the above sums on completion of the transaction. Associated costs will be incurred, currently estimated to be £30m. The licence agreement and the business transfer will be accounted for in the financial statements for the year ending 31 March 2018. Some of the costs arising in relation to the transaction have been incurred and recognised in the current period (refer to note 7).