1605r mcnair fact sheet for reports wave #2 2016 - cbaa ingenuity... · listening to community...
TRANSCRIPT

*Speak Languages Other Than English At HomeMcNair Ingenuity Research Pty Ltd ACN. 096 437 991
Level 4, 270 Pacific Highway, Crows Nest, NSW, 2065Phone: +61 2 9966 9133 www.mcnair.com.au
Prepared for:
July 2016
NT
FACT SHEET
Community Radio National Listener Survey
2016 Wave #1

Listened to community radio in an average week
How to Read*:
In an average week, of all people aged 15+ throughout NT (191,000 people):
people, or 41%, listen to community radio
people, or 14%, listen to community radio but not commercial radio
people, or 13%, listen to community radio but not ABC/SBS radio
Listening to community radio has increased by 8.3% compared to the last survey wave
2016 Wave #1
In An Average Week
%
2015 Wave #2
In An Average Week
2016 Wave #113.6
0
-13.3
+9.1
OVERALL RADIO LISTENINGNT
+11.6
+1.9
+8.3
85
39
51 106
Wave to Wave
% Change
%
57
16
12
+0.9
95
106
30
22
'000
159
72
56
14
13
85
41
'000
162
78
100191100187
56
12 4
107
26
24
-2.8
Source: McNair Ingenuity Research Pty Ltd - July 2016 - www.mcnair.com.au - Job No.: 1605R
2015 Wave #2: March-June 2014 & March-Nov 2015 / 2016 Wave #1: March-June 2015 & May 2016
Representative sample of people 15+ throughout NT - Base: NT n=551 - Weekly Listeners n=210
2015 Wave #213.9Average no. of hours
78,000
26,000
24,000
8,000
-33.386
people, or 4%, listen to community radio exclusively, that is, listen to community radio but not commercial radio or ABC/SBS radio
Listeners to community radio
Listeners to radio
NT all people aged 15+
do not listen to commercial radio or ABC/SBS radio
do not listen to ABC/SBS radio
do not listen to commercial radio
Listeners to community radio who:
Listeners to ABC and/or SBS radio
Listeners to commercial radio
* A detailed how to read guide can be found by clicking here

Average week community radio listeners
Up to 5 hours
5 to 10 hours
11 to 20 hours
Over 20 hours
%
24
31
18
9
Hours Spend Listening to Community Radio in a Week
13.6
11
‘000
23
19
%
78 100
39
‘000
Representative sample of people 15+ throughout NT - Base: NT n=551 - Weekly Listeners n=210
Source: McNair Ingenuity Research Pty Ltd - July 2016 - www.mcnair.com.au - Job No.: 1605R
Average no. of hours listened to community radio in an average week
COMMUNITY RADIO LISTENING BY DAY PART & HOURS SPENT LISTENING
The estimated 78,000 people aged 15+ who listened to community radio in the last seven days, listen during the following day parts:
Late Night (12 midnight - 5am)
Evening (7pm-12 midnight)
Drive Time (3pm-7pm)
Afternoon (12 noon - 3pm)
Mid-morning (9am-12 noon)
Breakfast (5am-9am)
65
1814
5442
4535
5744
6047
10078Base: Average week community radio listeners

100
28
Representative sample of people 15+ throughout NT - Base: NT n=551 - Weekly Listeners n=210
Source: McNair Ingenuity Research Pty Ltd - July 2016 - www.mcnair.com.au - Job No.: 1605R
'000
6046
NTREASONS FOR RADIO LISTENING TO COMMUNITY RADIO
The estimated 78,000 people aged 15+ who listened to community radio in the last seven days, listen for the following reasons:
Listeners 15+ to Community Radio In An
Average Week
%
2721
1915
2620
3124
3628
2418
54
1511
2318
3124
Local voices / local personalities
Specialist music
Local information / local news
Listeners to community radio
21
78
Other
Programs in languages other than English
Specialist information programs
Programs not available elsewhere / I hear something that I don't hear anywhere else
Locals can participate / I feel like I can get involved with the station if I was interested
Diversity in programming
The announcers sound like ordinary people / the announcers sound like 'one of us'
They give an independent voice / not owned by big business or government
They play Australian music / support local artists
Profile Base
Gender
Men
Women
Age Groups
15-24
25-39
40-54
55+
Marital Status
Single/never married
Married/partner, no children
Married/partner/single, child(ren) at home
Married/partner/single, child(ren) left home
Widowed/divorced/separated
Number of People in Household
1 or 2
3 or 4
5 or more
Main Grocery Buyer
Yes
No
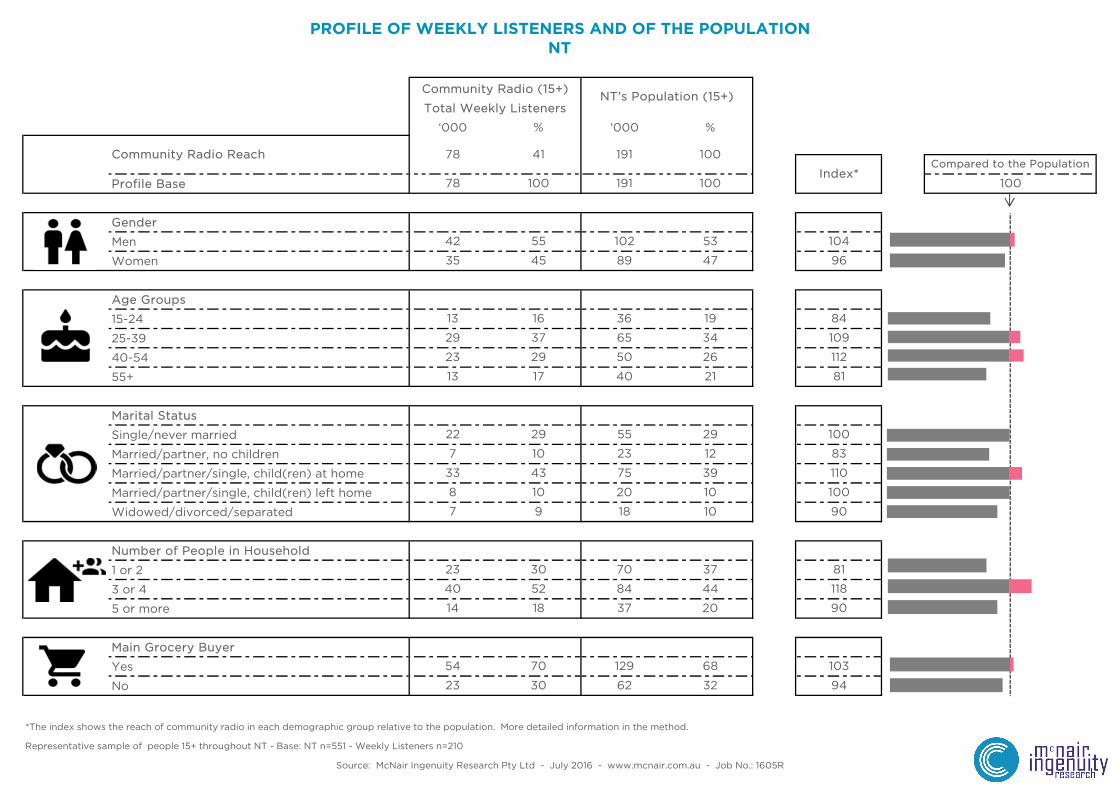
*The index shows the reach of community radio in each demographic group relative to the population. More detailed information in the method.
Compared to the PopulationIndex*
54 70 129 103
23 30 62 32 94
Representative sample of people 15+ throughout NT - Base: NT n=551 - Weekly Listeners n=210
36
100
104
96
84
NTPROFILE OF WEEKLY LISTENERS AND OF THE POPULATION
42 55 102 53
35 45 89 47
13 16
21
19
29 37
Community Radio Reach
22 29 55 29 100
NT’s Population (15+)Community Radio (15+)
Total Weekly Listeners
100191
10019110078
4178
%‘000%‘000
65 34
23
109
112
81
100
7 9 18 10 90
7 10 23 12 83
33 43 75 39 110
Source: McNair Ingenuity Research Pty Ltd - July 2016 - www.mcnair.com.au - Job No.: 1605R
14 18 37 20
81
118
90
40 52 84 44
10 20
68
23 30 70 37
8 10
29 50 26
13 17 40

Profile Base
Work Status
Full-time
Part-time
Home duties
Retired / pensioner
Unemployed
Student
Occupation
Professional, business manager or executive
Business owner, self-employed, sales or clerical
Technical, skilled, semi-skilled or manual
Not working
Highest Level of Education
Primary, Secondary or High School
Some tertiary/TAFE
University (Bachelor or higher degree)
Gross Annual Income
Under $20,000
$20,000 - $40,000
$40,000 - $60,000
$60,000 - $100,000
Over $100,000
Value of Community Radio
Very valuable
Quite valuable
Not very valuable
Not at all valuable
*The index shows the reach of community radio in each demographic group relative to the population. More detailed information in the method.
Representative sample of people 15+ throughout NT - Base: NT n=551 - Weekly Listeners n=210
30 39 92 48 81
4 6 17 9 67
2 2 9 5 40
Source: McNair Ingenuity Research Pty Ltd - July 2016 - www.mcnair.com.au - Job No.: 1605R
41 53 73 38 139
100Index*
Compared to the Population
16 20 39 21 95
13 17 30 16 106
25 33 56 30 110
12 16 36 19 84
11 14 29 15 93
28 36 66 34 106
23 29 63 33 88
27 35 62 33 106
15 23
23 30 61 32 94
12 16 34 18 89
22 28 47 25 112
NT’s Population (15+)Community Radio (15+)
21 27 49 25 108
Total Weekly Listeners
%
100
‘000
191
%
100
‘000
78
1 1 3 1 100
11 12 125
5 7 13 7 100
6 7 22 12 58
PROFILE OF WEEKLY LISTENERS AND OF THE POPULATIONNT
46 60 103 54 111
8 11 27 14 79

Profile Base
Aboriginal or Torres Strait Islander Origin
Yes
No
Identify as lesbian, gay or bisexual
Yes
No
Refused
Have Disabilities
Physical disability
Hearing impairment
Sight impairment
Speech impairment
None of the above
Refused
Reading Difficulty
Yes
No
Religious Faith
Christianity
Faith in other religion
No religious beliefs
Refused
Lang. Other Than English Spoken in Household
Yes
No
*The index shows the reach of community radio in each demographic group relative to the population. More detailed information in the method.
Representative sample of people 15+ throughout NT - Base: NT n=551 - Weekly Listeners n=210
Source: McNair Ingenuity Research Pty Ltd - July 2016 - www.mcnair.com.au - Job No.: 1605R
PROFILE OF WEEKLY LISTENERS AND OF THE POPULATIONNT
8 11 18 9
Index*Compared to the Population
100
Community Radio (15+)NT’s Population (15+)
Total Weekly Listeners
‘000 % ‘000 %
78 100 191 100
65 84 156 82 102
12 16 35 18 89
100
40 51 94 49 104
3 3 14 7 43
77 99 187 98 101
28 36 64 33 109
8 10 20 10
0 1 4 2 50
61 79 153 80 99
2 2 7 4 50
7 9 14 7 129
0 0 1 1 0
3 4 11 6 67
6 8 11 6 133
71 92 175 91 101
100
6 8 16 9 89
122
66 85 164 86 99
4 5 9 5

Profile Base
Gender
Men
Women
Age Groups
15-24
25-39
40-54
55+
Marital Status
Single/never married
Married/partner, no children
Married/partner/single, child(ren) at home
Married/partner/single, child(ren) left home
Widowed/divorced/separated
Number of People in Household
1 or 2
3 or 4
5 or more
Main Grocery Buyer
Yes
No
*The index shows the reach of community radio in each demographic group relative to the population. More detailed information in the method.
Representative sample of people 15+ throughout NT - Base: NT n=551 - Occasional Listeners n=408
9
Compared to the Population
100
40 33 55 29 114
80 65 129 68 96
7 18 10 70
43 35 62 32 109
25 20 37 20 100
35 28 70 37 76
62 51 84 44 116
12 83
49 40 75 39 103
12 10 20 10 100
Community Radio (15+)NT’s Population (15+)
Total Occasional Listeners
‘000 % ‘000 %
89 47 91
122 64 191
Source: McNair Ingenuity Research Pty Ltd - July 2016 - www.mcnair.com.au - Job No.: 1605R
12 10 23
30 25 50 26 96
PROFILE OF OCCASIONAL LISTENERS AND OF THE POPULATIONNT
8121401720
100191100122
Community Radio Reach 100
Index*
29 23 36 19 121
43 35 65 34 103
70 57 102 53 108
53 43

Profile Base
Work Status
Full-time
Part-time
Home duties
Retired / pensioner
Unemployed
Student
Occupation
Professional, business manager or executive
Business owner, self-employed, sales or clerical
Technical, skilled, semi-skilled or manual
Not working
Highest Level of Education
Primary, Secondary or High School
Some tertiary/TAFE
University (Bachelor or higher degree)
Gross Annual Income
Under $20,000
$20,000 - $40,000
$40,000 - $60,000
$60,000 - $100,000
Over $100,000
Value of Community Radio
Very valuable
Quite valuable
Not very valuable
Not at all valuable
*The index shows the reach of community radio in each demographic group relative to the population. More detailed information in the method.
Representative sample of people 15+ throughout NT - Base: NT n=551 - Occasional Listeners n=408
2 2 9 5 40
56 46 73 38 121
57 47 92 48 98
7 6 17 9 67
40 33 56 30 110
21 17 39 21 81
17 14 29 15 93
19 15 30 16 94
25 21 36 19 111
38 31 62 33 94
39 32 66 34 94
45 37 63 33 112
31 25 47 25 100
37 31 61 32 97
30 25 49 25 100
24 19 34 18 106
20 16 23 12 133
9 7 22 12 58
2 1 3 1 100
103 54 102
18 14 27 14 100
7 6 13 7 86
Community Radio (15+)NT’s Population (15+)
Total Occasional Listeners
‘000 % ‘000 %Index*
Compared to the Population
122 100 191 100 100
67 55
PROFILE OF OCCASIONAL LISTENERS AND OF THE POPULATIONNT
Source: McNair Ingenuity Research Pty Ltd - July 2016 - www.mcnair.com.au - Job No.: 1605R

Profile Base
Aboriginal or Torres Strait Islander Origin
Yes
No
Identify as lesbian, gay or bisexual
Yes
No
Refused
Have Disabilities
Physical disability
Hearing impairment
Sight impairment
Speech impairment
None of the above
Refused
Reading Difficulty
Yes
No
Religious Faith
Christianity
Faith in other religion
No religious beliefs
Refused
Lang. Other Than English Spoken in Household
Yes
No
*The index shows the reach of community radio in each demographic group relative to the population. More detailed information in the method.
Representative sample of people 15+ throughout NT - Base: NT n=551 - Occasional Listeners n=408
57 47 94 49 96
12 10 14 7 143
42 34 64 33 103
11 9 20
98
97 79 156 82 96
25 21 35 18 117
102
0 0 4 2 0
90
122 100 187
10
101 83 153 80 104
3 3 7 4 75
8 7 14 7 100
0 0 1 1 0
5 4 11 6 67
7 6 11 6 100
6 5 9 5 100
14 11 18 9 122
103 84 164 86 98
12 9 16 9 100
111 91 175 91 100
Compared to the Population
122 100 191 100 100
Community Radio (15+)NT’s Population (15+)
Total Occasional Listeners
‘000 % ‘000 %Index*
Source: McNair Ingenuity Research Pty Ltd - July 2016 - www.mcnair.com.au - Job No.: 1605R
PROFILE OF OCCASIONAL LISTENERS AND OF THE POPULATIONNT

How:
When:
Who:
For whom:
Weightings:
More information:
Icons made by Freepik from Flaticon or Google Design and licensed by Creative Commons BY 3.0
Onlineinterviews:
The index shows the reach of community radio in each demographic group relative to the population. If the index is 100, the audience for that demographic is exactly in-line with the population. If the index is over 100, that demographic group is relatively over-represented amongst listeners to community radio, as compared with the overall population. If the index is below 100, that demographic group is relatively under-represented amongst listeners to community radio, as compared with the overall population.
RELIABILITY OF RESULTSThe survey was carefully conducted using the highest possible standards at every stage of the process. The method and results are well benchmarked and validated over time.
While the overall survey was conducted amongst 551 people (+/- 4% margin of error), the weekly profile of community station listeners is based one people who have listened in the last week. This is a much smaller group than the overall survey and hence the margin of error increases for these questions - 210 people (+/- 7% margin of error)
While results are reported as a single figure, it is better to think of them as the mid-point in a possible range. This means that if we were to repeat this survey 100 times, the results calculated from the total base would be within a range of +/- 4% in 95 of the 100 surveys.
All sample surveys and polls may be subject to multiple sources of variation in sampling and coverage. Furthermore results of radio surveys are also vulnerable to fluctuations such as changes in the weather from month-to-month, which can change people's listening habits.
When reporting survey estimates, percentages are rounded to the nearest whole percent. Sometimes when combining or splitting groups the percentages may appear to add to a different total, due to the rounding factor. All percentages are calculated using the underlying number of respondents as a proportion of the relevant population. It is therefore incorrect to add percentage figures when combining groups. The number of respondents from each group should be added and the percentage recalculated on the total population for the combined group.
Source: McNair Ingenuity Research Pty Ltd - July 2016 - www.mcnair.com.au - Job No.: 1605R
INDEX*
METHOD
ABOUT THE SURVEYThe National Listener Survey is a survey on the community radio listening habits of Australians.
It provides invaluable feedback to community radio stations and the sector about trends, listeners and the sector itself.
This research is conducted by means of an mixed-mode survey comprising both online and telephone interviewing. A single respondent database across both methods ensures and integrated balance of respondents across Australia.
The telephone interviews were achieved by computer assisted telephone interviewing conducted by McNair Ingenuity Research in Crows Nest NSW. The telephone sample of people were selected at random from a commercial marketing database. All interviewing was conducted by trained and accredited interviewers under constant supervision. At least 5% of interviews were validated by means of live monitoring.
The online surveys were conducted with assistance from YellowSquares, using online consumer research panels. YellowSquares is an ISO20252 accredited company. All interviewing was conducted in March-June 2015 & May 2016 inclusive.
This survey is a national survey of people aged 15+. Quotas are set by age, gender and location to ensure a representative sample.
This research is commissioned and paid for by the Community Broadcasting Association of Australia
The results of this survey are weighted to the population estimates of the Australian Bureau of Statistics (ABS) - Estimated Resident Population (ERP) - 30 June 2014, so as to bring the sample exactly into line with NT's population distribution by these characteristics.For more information contact the Community Broadcasting Association of Australia - Email: [email protected] - Phone: 02 9310 2999
This report contains the results of a survey with a rolling 2 Wave representative sample of 551 people aged 15 and over throughout NT.
Total sample across Australia (2 waves): 14,294 (1,043 Telephone / 13,251 Online)
This research was carried out in compliance with international standard for market and social research, ISO20252.
Telephone interviews: