141125 madrid speech
DESCRIPTION
Madrid SpeechTRANSCRIPT

In the 40
bulk of e
shifted p
One thin
calm.
Because
reassurin
exports.
shortfall
Similarly
coming y
not to ta
There ha
number
United S
Sp
0 years since
energy dema
priorities, and
ng that has no
even for oi
ng. Markets
But the ris
. This may no
y, although g
years, geopo
ake steps to r
as also been
of recent po
States or the
pain, Euro
the IEA was
and, the thr
d LNG is rew
ot changed i
l, markets to
are surely c
k remains th
ot happen to
as supply is l
olitics is also
reduce relian
n positive ne
olicy efforts t
2030 frame
©
ope and th
established,
reat of clima
riting the glo
s the need fo
oday seem w
comforted th
hat long ter
oday, or tomo
likewise amp
creating un
nce on future
ws in terms
hat can help
work for ene
© OECD/IEA 2
he World:
, much has c
ate change a
obal gas land
or vigilance a
well-supplied
hat the turm
rm, instabilit
orrow, but is
ple and set to
certainty. De
e gas supply f
of climate c
p reduce CO2
ergy and clim
2014
The Geop
IEA ExecuCenter f
hanged. Eme
and the grow
scape.
and prepared
d, and prices
moil in Iraq h
ty will deter
s a possibility
o be reinforc
ebate in Eur
from Russia.
change and
2 emissions, s
mate in the E
politics of
tive Directorfor Global Ec
erging econo
wth of renew
dness, even i
are reflecti
has not disru
investment
y down the ro
ced by a new
ope has reig
the environm
such as the C
European Un
Energy
r Maria van donomy and GESADE Busin
25 Nove
omies now m
wable techno
n the case of
ng this supp
upted the co
, resulting in
oad.
w wave of LN
gnited over w
ment. We ha
Clean Power
ion. And of c
der HoevenGeopoliticsness School
Madridmber 2014
make up the
ologies has
f supposed
ply – this is
ountry’s oil
n a supply
G over the
whether or
ave seen a
Plan in the
course just

recently
together
emission
Indeed s
we know
To answ
Here in S
generate
news. W
But as w
When th
the syst
share of
Howeve
flexibility
likewise
gas capa
the United
r on reducin
ns, rising 2.6
some degree
w today, and
er that quest
Spain, your c
ed a full qua
With the EU ta
with all things
he sun doesn
em stands t
renewables.
r adding add
y dramatical
Spain could
acity. This cou
States and
g emissions.
percent ove
of uncertain
how can tha
tion, perhaps
country is ta
arter of its e
arget of 27%
s, it is not so
’t shine, or t
today, conve
.
ditional grid
lly. Excess p
import pow
uld in turn re
©
China have
. That said,
r 2012.
nty underlies
at help us to
s it is best to
king full adv
lectricity thr
renewable e
simple.
he wind doe
entional gen
interconnec
power from
wer when the
educe the vo
© OECD/IEA 2
signaled to
2013 was ye
s all discussio
prepare for t
o start at hom
antage of th
rough wind a
energy by 20
esn’t blow, th
eration capa
ctions with F
Spain’s rene
ere is less wi
latility of wh
2014
the world t
et another r
ons of energy
tomorrow?
me.
he promise o
and solar. On
30, Spain is a
hen alternativ
acity will be
rance, and t
ewables cou
nd and sun,
olesale elect
that they ar
ecord year i
y security. Th
f renewable
n its face, th
already well-
ve power so
needed to
the rest of E
uld be fed a
rather than
tricity prices.
re ready to
n terms of g
he question i
energy. In 2
his is nothing
-positioned.
urces are ne
complemen
Europe, woul
cross the bo
maintaining
.
take steps
global CO2
is, what do
2013, Spain
g but good
cessary. As
t this high
ld increase
order, and
g expensive

From th
Spain an
make th
And so f
Here it is
In this co
the Brot
not lead
complian
But ther
potentia
half. A k
account
dispropo
taking ad
But whil
of gas su
on impo
e perspectiv
nd Europe w
is happen is t
from Spain, w
s concerns ab
ontext Ukrai
therhood pip
to an interr
nce with the
re are reason
al interruptio
key reason f
for an inc
ortionate sha
dvantage of t
e, under the
upply, it cann
rts.
ve of both en
would be a p
the challeng
we take a ste
bout security
ine is extrem
peline. Contr
ruption of tr
Energy Char
ns to believe
ns to supply
for this is th
reasing sha
are of unde
this capacity
e right circum
not transform
©
nergy securit
ositive deve
e.
ep back and
y of gas supp
mely importa
rary to wides
ransit. The U
rter Treaty.
e that gas m
than they ar
e rise in LN
re in the g
erutilised LNG
a challenge.
mstances, LN
m over the lo
© OECD/IEA 2
ty, and clima
lopment for
look at Euro
ply that are m
ant: roughly
spread expe
Ukrainians ha
markets will
re today – ev
G, which alm
gas traded
G capacity,
.
NG trade can
ong term the
2014
ate goals, in
r everyone. F
ope as a cont
making headl
15 percent o
ctations, the
ave acted wi
be better eq
ven as global
most double
between re
though wea
help to brin
competitive
creased inte
Finding an in
tinent.
ines.
of European
e Russian shu
th remarkab
quipped in t
demand for
es in terms o
gions. Spain
ak pipeline i
ng back confi
positive of g
erconnection
nvestment st
gas supplie
utdown of U
ble self-restra
he future to
r gas rises by
of volume b
n and Portu
interconnect
idence in the
gas in marke
ns between
tructure to
s arrive on
Ukraine did
aint, in full
o deal with
more than
by 2040, to
ugal has a
tions make
e reliability
ts that rely
Here we
Because
markets
LNG sim
There ar
transpor
always h
If Asia re
unconve
for gas in
From Eu
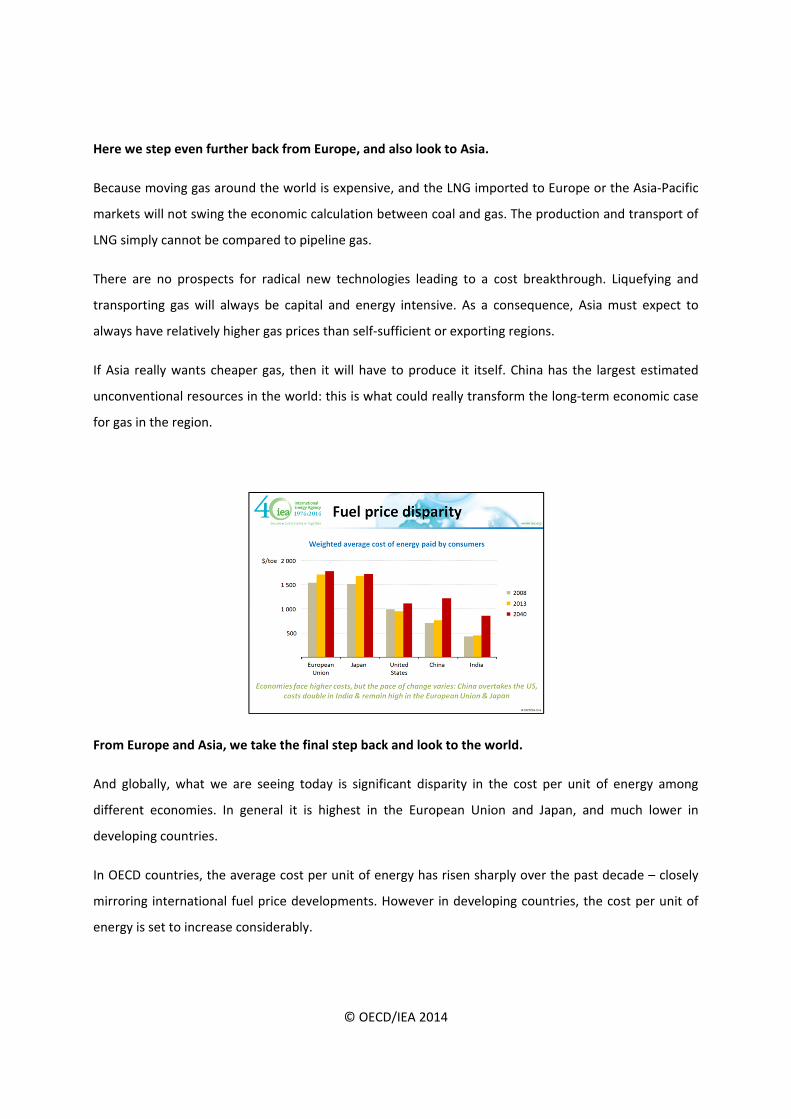
And glob
different
developi
In OECD
mirrorin
energy is
e step even fu
moving gas
will not swin
ply cannot b
re no prospe
rting gas wil
have relativel
eally wants c
entional reso
n the region.
rope and As
bally, what w
t economies
ing countries
countries, t
g internation
s set to incre
urther back f
around the
ng the econo
e compared
ects for radi
l always be
ly higher gas
cheaper gas,
urces in the
sia, we take t
we are seein
s. In general
s.
he average c
nal fuel price
ease consider
©
from Europe
world is exp
omic calculat
to pipeline g
ical new tec
capital and
prices than
, then it will
world: this i
the final step
ng today is s
it is highes
cost per unit
e developme
rably.
© OECD/IEA 2
e, and also lo
ensive, and t
tion between
gas.
chnologies le
energy inte
self-sufficien
have to pro
s what could
p back and lo
significant d
st in the Eu
t of energy h
ents. Howeve
2014
ook to Asia.
the LNG imp
n coal and ga
eading to a c
nsive. As a c
nt or exportin
oduce it itse
d really trans
ook to the w
isparity in th
ropean Unio
has risen sha
er in develop
ported to Eur
as. The produ
cost breakth
consequence
ng regions.
lf. China has
sform the lon
world.
he cost per
on and Japa
rply over the
ping countrie
rope or the A
uction and tr
hrough. Liqu
e, Asia must
s the largest
ng-term econ
unit of ene
n, and muc
e past decad
es, the cost
Asia-Pacific
ransport of
efying and
t expect to
estimated
nomic case
rgy among
h lower in
de – closely
per unit of

The aver
decreasi
increasin
average
of oil co
electricit
This disp
world m
competit
investme
energy, g
In this re
This yea
period to
switchin
For now
problem
To unde
come fro
rage cost in
ng importan
ngly being re
cost per uni
onsumption
ty prices due
parity can be
may represe
tiveness. Fal
ents. Like th
geopolitical l
egard, it is im
ar’s World En
o 2040, altho
g.
w, markets a
ms that may b
rstand why,
om over the
China, for e
nce of energ
eplaced by m
t of energy i
subsidies re
e to a change
a source of c
ent an oppo
ling prices e
he shift in e
landscape.
mportant to k
nergy Outloo
ough the rat
re currently
be around the
we need to
next two dec
©
xample, is se
gy-intensive
more expens
in India is als
eforms, a st
of the powe
concern, dep
ortunity for
lsewhere ma
energy dema
keep track of
ok sees oil d
te of increase
y well-supplie
e corner.
o look at the
cades: the Un
© OECD/IEA 2
et to overtak
industries a
ive gas and
so gradually
rong growth
er mix toward
pending on y
r fuel produ
ay increase c
and, such di
demand and
demand incr
e slows as hi
ed; but shor
longer term
nited States,
2014
ke that of th
and changes
electricity in
approaching
h of the tra
ds more expe
your perspect
ucers, yet
competitiven
sparities hav
d how deman
reasing by 14
igh prices en
rt-term cond
m and see wh
Canada, Bra
he United Sta
in the fuel
n the industr
g that of the
ansport secto
ensive fuels
tive. Rising p
be an impe
ness, yet put
ve the poss
nd affects inv
4 million ba
ncourage ene
ditions shou
here the ext
azil and the M
ates by 2040
mix, with c
ry sector. Sim
United State
or and an i
and technolo
prices in one
ediment to
bottlenecks
ibility of cha
vestment.
rrels per da
ergy efficienc
ld not blind
ra barrels ar
Middle East.
0, due to a
cheap coal
milarly, the
es, a result
ncrease of
ogies.
part of the
economic
on energy
anging the
y over the
cy and fuel
us to the
re going to

© OECD/IEA 2014
Tight oil production is making the United States the largest oil producer in the world – and it stays that
way in our projections until the late 2020s. But, by then, US production is already starting to fall back
and, by 2040, output is back to where it is today. Instead, it is the oil sands in Canada that takes over as
the main source of North American supply growth, assuming that a way can be found to bring this oil to
market. The other major non-OPEC source of supply growth is Brazil, with its prolific, complex and
capital-intensive deepwater fields – where delay is an ever-present risk. These suppliers do a lot to
satisfy growing demand over the period to 2020, but after this, there is a large and growing gap in the
market.
This is the gap that needs to be filled by the only remaining large source of low-cost oil, the Middle
East.
More than half of this growth comes only from one country, Iraq. There is no shortage of resources to
meet this challenge. But, looking at the turmoil in parts of the Middle East today, there is a real concern
about a shortfall in investment.
This is a decade away, but we should not be lulled into a false sense of security. To be producing extra
barrels in the 2020s requires investment today. Aside from the obvious security concerns in parts of the
region, there are also fiscal and demographic pressures that could squeeze the funds available for the
upstream.
What would be the implications of a shortfall in investment? Tighter markets and higher prices. The
effects would be felt around the world. But vulnerability would be particularly acute in those countries
that are actually looking for these extra barrels.
First among the sources of demand growth are the large importers in Asia, notably China, but also India
and others. By 2040, two out of every three barrels of crude oil that are traded internationally –
including 90 percent of Middle East exports – will be heading for Asia.
But for today, there is plenty of supply, and prices are low.
As you are all well aware, following three consecutive years of prices above 100 dollars, the price of
Brent crude has fallen by almost 30 percent since the middle of this year.
Buoyant supply from North America has been instrumental in bringing prices down. What remains to be
seen is for how long this supply can keep prices at or around today’s levels.

Around t
being cu
are being
We estim
percent
see the
constrain
producti
This brin
Middle E
price.
So while
longer-te
The thre
Over the
demand
growth o
countrie
today’s price
urtailed or ca
g revised dow
mate, for exa
fall in US up
postponeme
nt on the m
ion that we a
ngs us back a
East, where f
e today’s pric
erm market d
ead weaving t
e past 14 yea
in OECD co
over the pas
s in the Midd
e levels, we w
ancelled. The
wnwards; on
ample, that a
pstream capi
ent of new o
medium-term
anticipate fro
again to the
fiscal and ge
ce levels off
dynamics.
through all o
ars, global en
untries is alm
st decade w
dle East.
©
will start to s
ere are signs
nly projects w
a price aroun
tal expendit
oil sands pro
m outlook fo
om non-OPEC
question ma
eopolitical ch
er some com
of these issue
nergy deman
most the sam
was entirely d
© OECD/IEA 2
see some inv
s already tha
with strong e
nd today’s le
ure in 2015,
ojects. Lowe
or Brazil. Ta
C suppliers.
arks that we
allenges only
mfort to con
es is the glob
nd has grown
me today as
driven by no
2014
vestment in l
at, in some c
conomics are
evels – if mai
compared w
er cash flows
ken togethe
have about
y become m
sumers, they
al shift in en
n by around
it was in 20
on-OECD cou
ow-margin f
ases, investm
e likely to ga
intained – w
with this yea
s from oper
er, this coul
the adequac
more intense
y don’t prov
ergy demand
one-third. H
000. Indeed,
untries, inclu
fields around
ment budget
ain approval.
ould result in
ar. In Canada
ations could
d slow the
cy of investm
with the rec
vide reassura
d.
However ove
global energ
uding China,
d the world
ts for 2015
n a 5 to 10
a, we could
d also be a
growth in
ment in the
cent falls in
ance about
rall energy
gy demand
India, and
And it is
accounts
demand
growth s
As the p
energy d
capita as
China di
our proje
the lead
What th
system.
energy s
establish
Ladies an
We cann
about oi
gas with
consider
s China that
s for more th
reaches a pl
slows and as
pace of grow
demand grow
s China had
d at the time
ections, Indi
from China w
is shift in de
Emerging ac
should be ap
hed, tradition
nd gentleme
not talk abo
l prices with
hout conside
ring the effec
remains the
han one-thir
lateau by the
population g
wth in China
wth. This is p
some 10 yea
e, which ind
a accounts fo
with one-qua
emand mean
ctors may ha
pproached in
nal actors are
n, energy an
out renewab
hout discussin
ering Russia
cts of fuel pr
©
e driving for
rd of global e
e late 2030s.
growth slows
loses steam
particularly t
ars ago, but
icates the la
or 15 percen
arter of glob
ns, is a poss
ave different
n terms of co
e prepared fo
nd geopolitics
les in Spain
ng security is
’s relationsh
ice disparity,
© OECD/IEA 2
rce in global
energy dema
This occurs
s and starts t
m, other cou
rue for India
uses only lit
rge potentia
nt of global e
al growth aft
sible shift in
t priorities, d
ooperation, e
or this shift.
s are often o
without tal
ssues in the
hip with Eur
, competitive
2014
demand gro
and growth.
as efficiency
to slowly dec
ntries assum
a, which has
ttle more tha
al for energy
energy dema
ter 2025.
roles and re
different rul
engagement,
ne and the s
king about E
Middle East.
rope. We ca
eness, and th
owth until th
But then gro
y measures ta
cline.
me its role a
today a simi
an half the e
demand gro
and until 202
esponsibilitie
es, and diffe
, and compe
same.
EU climate p
. It is likewis
annot discus
he changing l
he mid-2020
owth slows a
ake effect, as
as the engine
ilar level of i
energy per p
owth in this c
25, and then
es in the glo
erent ideas a
etition. It is c
policy. We c
e impossible
ss fuel price
landscape of
0s, when it
and energy
s economic
e of global
ncome per
person that
country. In
takes over
bal energy
about how
crucial that
cannot talk
e to discuss
es without
f the global
© OECD/IEA 2014
energy system. And I have not even had time to discuss energy poverty, and the remarkable impact that
energy demand growth will have in Sub-Saharan Africa and South Asia over the coming decades.
All of these issues present us with uncertainties.
However there is one thing of which we can be certain. Countries will always require energy, and the
ways in which we generate, transport, and use this energy may not be the same tomorrow as they are
today. Being vigilant, having foresight, and ensuring energy security today is the best way to stay
prepared for tomorrow.