140 final rpt 2015 - valuer general of new south wales · 2.1.4 graph: residential uses ... coupled...
TRANSCRIPT
Independent Property Valuers & Consultants ACN : 099 913 210 ABN : 80 099 913 210 5/2 East Street, Five Dock, NSW 2046 PO Box 697 Five Dock NSW 2046 phone : (02) 9713-9077 Fax : (02) 9713-9022 email : [email protected]
b
FINAL REPORT
LAND TAX PROGRAMME DISTRICT 140 - HURSTVILLE
BASE DATE - 1 JULY 2015
Prepared by SOUTHERN ALLIANCE VALUATION SERVICES PTY LTD
for VALUER GENERAL &
LAND & PROPERTY INFORMATION

Hurstville Final Report __________________________________________________________________________________________________________________
_______________________________________________________________________________ Southern Alliance Valuation Services Pty Ltd – Hurstville Final Report – BD 1 July 2015 Page 2 of 49
Table of Contents
EXECUTIVE SUMMARY ......................................................................................................................... 3
1.0 GENERAL DESCRIPTION OF LOCAL GOVERNMENT AREA ................................................ 5
1.1 Introduction / Overview ......................................................................................................................................................................... 5 1.1.1 Residential ...................................................................................................................................................................................... 5 1.1.2 Commercial / Retail ........................................................................................................................................................................ 5 1.1.3 Industrial ......................................................................................................................................................................................... 7
2.0 NUMBER OF VALUATIONS IN THE ZONE CATEGORIES ...................................................... 8
2.1 Zone Category Break-Up ....................................................................................................................................................................... 8 2.1.1 Table: All Zones ............................................................................................................................................................................. 8 2.1.2 Table: Residential Uses ................................................................................................................................................................... 8 2.1.3 Graph: All Zones ............................................................................................................................................................................. 9 2.1.4 Graph: Residential Uses .................................................................................................................................................................. 9
3.0 TOWN PLANNING & ZONING INSTRUMENTS ........................................................................ 10
3.1 Current Planning Instruments within Hurstville City ........................................................................................................................... 10 3.1.1 Hurstville Local Environmental Plan(s) ........................................................................................................................................ 10 3.1.4 Development Control Plan (DCP) 1 (last amended 4 June 2014, eff. 12 June 2014) .................................................................... 11 3.1.5 Development Control Plan (DCP) 2 (last amended 17 September 2014, eff. 24 July 2015) ......................................................... 12 3.1.6 Hurstville MasterPlan ................................................................................................................................................................... 12
4.0 IDENTIFIED SIGNIFICANT CHANGES IN USE OR DEVELOPMENTS OF PROPERTY AND OTHER FACTORS WHICH MAY AFFECT VALUATIONS ..................................................... 13
4.1 Hurstville City Centre Planning Project ............................................................................................................................................... 13 4.2 Property Market Overview ................................................................................................................................................................... 14 4.3 Economy Overview .............................................................................................................................................................................. 15 4.4 Court Cases .......................................................................................................................................................................................... 19
5.0 ADDED VALUE OF IMPROVEMENTS ......................................................................................... 20
5.1 Residential ............................................................................................................................................................................................ 20 5.1.1 Paired Analysis ............................................................................................................................................................................. 23
5.2 Commercial / Retail / Industrial: .......................................................................................................................................................... 29
6.0 CHANGES TO COMPONENTS ILLUSTRATED BY CHANGES TO THE EXISTING VALUE RELATIONSHIPS. ............................................................................................................................ 30
6.1 Value Levels - Typical Properties ........................................................................................................................................................ 30 6.2 Value Totals ......................................................................................................................................................................................... 32 6.3 Component Movement Graphs ............................................................................................................................................................. 33
7.0 MARKET COMMENTARY: ............................................................................................................ 35
7.1 Residential ............................................................................................................................................................................................ 35 7.1.2Sale and Resales within Hurstville LGA (2014/15) ....................................................................................................................... 38 7.1.3 Change in Median Values ............................................................................................................................................................. 40 7.1.4 Building Approvals ....................................................................................................................................................................... 40
7.2 Commercial / Retail.............................................................................................................................................................................. 42 7.3 Industrial .............................................................................................................................................................................................. 43
8.0 MANAGEMENT OF COMPONENTS, VERIFICATION & HANDCRAFTING ....................... 44
8.1 Verification .......................................................................................................................................................................................... 44
9.0 QUALITY ASSURANCE ................................................................................................................... 45
9.1 Coefficient of Dispersion (COD) ......................................................................................................................................................... 45 9.2 Mean Value to Price Ratio (MVP) ....................................................................................................................................................... 45 9.3 Price Related Differential (PRD) .......................................................................................................................................................... 45 9.4 Subsequent Valuations upon Objection / Reascertainment .................................................................................................................. 46
10.0 CONCLUSION .................................................................................................................................. 47
10.1 Purpose of this Report ........................................................................................................................................................................ 47 10.2 Signatory ............................................................................................................................................................................................ 47

Hurstville Final Report __________________________________________________________________________________________________________________
_______________________________________________________________________________ Southern Alliance Valuation Services Pty Ltd – Hurstville Final Report – BD 1 July 2015 Page 3 of 49
EXECUTIVE SUMMARY
All properties in NSW are valued each year for rating and land tax purposes. All valuations are issued to the Office of State Revenue for land tax. Valuations are also issued to councils either each year or every 2nd, 3rd or 4th year. This report details the land valuation programme for the Hurstville Local Government Area (LGA). The majority of land values are determined using mass valuation techniques. The Valuer-General's mass valuation system is applied as follows: 1) Properties that react to market forces in a similar way are grouped together in a component, and 2) The existing values of those properties in a component are updated by a market-based factor that is then used as a multiplier of the prior Land Value. The result is then checked by the Contract Valuer and individually verified values applied as appropriate. The use of mass valuation techniques does have limitations, particularly over a period of time. The continued application of factors may lead to a distortion in the relativity of values within a geographical area. Some types of properties are so few in number or likely to be so sensitive to localised changes that individually verifying values is the only appropriate method. Although a mass valuation system is used to determine the majority of land values, the Valuation of Land Act requires that each land value be a market value. Each land value must be capable of being tested and supported on its own against all the available market evidence. The total number of valuation entries (as at 29 October 2015) within Hurstville LGA – 21,410. The total land value in dollars (as at 29 October 2015) within Hurstville LGA - $18,599,935,970. The last local government base date or year when the valuation notice was issued was for the Base Date 1 July 2013. The total land value for Base Date 1 July 2014 (as at 29 October 2015) was $15,131,358,530 which represents a percentage change of 22.9% to Base Date 1 July 2015. The percentage change reflects the overall movement for land values within the Hurstville LGA based on market sales evidence. Residential - Overall the residential market within the Hurstville LGA exhibited signs of strong positive growth over the 12 months ending 30 June 2015. As a whole, components zoned ‘R2 – Low Density Residential’ and ‘R3 – Medium Density Residential’ recorded growth of 24% and 27% respectively. On average residential land components, depending on locality and development potential, moved within a band of 18.1% and 36% between the Base Date 1 July 2014 and 1 July 2015. Single residential sites in Beverly Hills (XAA) and Kingsgrove (XBB) have shown considerable growth with the components moving 30.2% and 33.4% respectively over the 2015 valuation year. The growth in components ‘XAA’ and ‘XBB’ are partly attributable to the demographic of the market seeking close proximity to railway station/s & commercial hubs and additionally seeking close proximity to the suburb of Hurstville. In general, dual occupancy sites remained highly sought after, with component ‘TCC’ – Narwee, Penshurst & Mortdale – recording the largest growth among the dual occupancy components at 33.3% over the 12 months to 30 June 2015. ‘XNN’ – single residential sites in Riverwood (situated north of the east hills railway line) performed well over the 2015 valuation year recording growth of 36%. It should be noted, there is a small sample of sales within component ‘XNN’ and, as at date of report, there are no known town planning amendments which would assist in explaining the sharp increase in values – however, the locale’s proximity to Riverwood’s town centre, railway station and the M5 junction at Belmore Road may appeal to some demographics of the marketplace. All single residential sites within the ‘R3 – Medium Density’ zone perform well over the 2015 valuing year with components moving within a band of 27% - 34%. Growth in the aforementioned ‘R3’ components is partly attributable to the locale of R3 zones, in regards to distance to amenities and public transport, coupled with the development upside of future amalgamation to form a medium density residential (villa / townhouse) development site. Individual pockets can move against the trend for varying reasons, however on the whole properties within the Hurstville Municipality were relatively consistent.
Commercial / Retail – As a whole, from 1 July 2014 to 1 July 2015, commercial and retail property markets within the Hurstville LGA recorded mixed levels of growth. Overall, zones ‘B1 – Neighbourhood Centre’, ‘B2 – Local Centre’, ‘B3 – Commercial Core’ and ‘B4 – Mixed Use’ recorded growth of 23%, 12%, 2.6% and 23.4% respectively.

Hurstville Final Report __________________________________________________________________________________________________________________
_______________________________________________________________________________ Southern Alliance Valuation Services Pty Ltd – Hurstville Final Report – BD 1 July 2015 Page 4 of 49
EXECUTIVE SUMMARY (Cont.)
As a whole, business zoned components generally moved within a band of 0% - 38.9% over the 2015 valuation year. Individual components within each business zone show varying levels of growth for numerous reasons including, but not limited to, location, development potential and access to infrastructure / public transport – however, as a whole, business zoned components generally moved within a band of 0% - 38.9% over the 2015 valuation year.
Density / development sites continued to perform well over the 2014/15 valuation year. Generally, residential development continues to outprice commercial development as the highest and best use and as such, sites with residential development potential remain in high demand across the Hurstville LGA. Components ‘BWB – high rise / mixed development sites B1’, ‘BWW – high rise / mixed development sites B2’ and ‘HDS – high rise / mixed development sites B4’ exhibited growth of 21.2%, 19.8% and 14% respectively over the 2015 valuing year. The introduction of the ‘B3 – Commercial Core’ zoning within the Hurstville City Centre does not permit the incorporation of residential uses within any future development for those properties zoned ‘B3’. Subsequently component ‘HCS – Major Centre Office Developments Hurstville’ recorded nil growth over the 2015 valuation year, highlighting the subdued demand for office space / office sites within the Hurstville City Centre. Growth in retail spending (and ultimately retail asset values) is being supported by various factors. For example, increases in household net worth, driven by the uplift in residential dwelling values, are resulting in providing support for discretionary retail spending and retail spending on household goods. Additionally, a low Australian dollar and low interest rates are providing some overall support to retail spending and asset values. Generally, southern Sydney Neighbourhood Retail properties for the first half of 2015 illustrate a prime yield range from 6.50% up to 7.75% and a secondary yield range from 8.00% up to 10.00%.
Industrial - Overall, the industrial market within Hurstville LGA showed signs of positive growth with the ‘IN2 – Light Industrial’ zone recording 9.2% growth over the 12 months ending 1 July 2015. Five (5) out of seven (7) industrial components moved within a band of 9.4% - 10.2% over the 2015 valuation year, with the remaining two (2) industrial components recording growth of 7.2% and 17% over the same period. Certain components can move against the trend for a varying number of reasons, however overall the industrial market for the Hurstville LGA was fairly consistent. Southern Sydney’s industrial property market has experienced increasing demand from property developers acquiring quality industrial sites zoned to be redeveloped from industrial uses to high-rise residential and mixed use developments. As a result of the above, the current industrial supply is decreasing, proving to be a catalyst for driving competition in the industrial sector. Although the majority of the industrial redevelopment demand in Southern Sydney is around the suburbs of Botany, Mascot, Wolli Creek and the like, the reduction in stock creates a lack of supply for the current industrial market for the aforementioned suburbs, thus, potentially driving demand for industrial properties further south/south west to established industrial precincts within the St George and surrounding area. As a result of the above, it has been noted, that industrial yields for southern Sydney industrial properties have compressed to their lowest levels since June 2008, being 6.38% as at September 2015.
TABLE OF TYPICAL VALUES Location Zone Size (square metres) 2015 Land Value
Kimberley Rd, Hurstville Residential 520.15 $930,000 Myall St, Oatley Residential 495.56 $780,000 Gover St, Peakhurst Residential 569.1 $770,000 Carrington St, Penshurst Residential 480.6 $716,000 Forest Rd, Hurstville Business 271.9 $3,010,000 Stanley St, Peakhurst Industrial 2,554 $1,280,000 Commercial Rd, Kingsgrove Industrial 765.1 $626,000
Murray Edmondson St.George Area Manager Southern Alliance Valuation Services Pty Ltd

Hurstville Final Report __________________________________________________________________________________________________________________
_______________________________________________________________________________ Southern Alliance Valuation Services Pty Ltd – Hurstville Final Report – BD 1 July 2015 Page 5 of 49
1.0 GENERAL DESCRIPTION OF LOCAL GOVERNMENT AREA
1.1 Introduction / Overview
Hurstville is located on the Georges River near Sydney (Kingsford Smith) Airport, Bankstown Airport, the shipping facilities of Port Botany, and the Sydney CBD.
Hurstville's central business district is a regional growth centre which provides retail and commercial facilities for the St George region and contains the major concentration of commercial office and retail space for the immediate area. The city's status and significance as a commercial centre extends beyond St George and into the adjoining Sutherland and inner/western regions.
Hurstville City is within minutes of ocean beaches, Botany Bay, river foreshores, and contains the biggest native bush reserve in the St George region (Oatley Park). The area is well serviced by public transport and is closely positioned to the M5 Motorway.
Hurstville incorporates, wholly or partly, the suburbs of Allawah, Beverly Hills, Carlton, Hurstville, Kingsgrove, Lugarno, Mortdale, Narwee, Oatley, Peakhurst, Peakhurst Heights, Penshurst, and Riverwood. Industrial estates are located in Kingsgrove and Peakhurst.
Hurstville Council is currently responsible for providing services for 77,684 residents, 26,000 rateable properties, 250 kilometres of regional and local roads, 14.5 kms of State roads, 155 parks and reserves and 17 community buildings. Overall there are 285 hectares of parks and reserves in the city. The Local Government boundaries cover an area of 24.77 square kilometres.
1.1.1 Residential
The Local Government area has a variety of housing characters covering the eras from the mid to late 1800’s to present. The landscape consists of gentle slopes except near the Georges River foreshore where the terrain changes to steep slopes with a high degree of vegetation cover. The general street pattern is based on a grid pattern of rectangles or diagonals in the older areas such as Hurstville, Mortdale, Penshurst, Kingsgrove and Riverwood. Newer areas like Lugarno have a different character with a curved pattern of streets and cul-de-sacs. Streetscapes therefore vary from long straight roads on gentle slopes creating long views of freestanding gabled cottages to the curved, highly vegetated and, at times, steeply sloping landscapes in the areas of Oatley and Lugarno.
1.1.2 Commercial / Retail
There are several retail areas within the Local Government Area. Primarily they have developed around the Railway Stations (Hurstville, Penshurst, Mortdale, Oatley, Kingsgrove, Beverly Hills, Narwee and Riverwood) and are in the form of strip retail centres. Retail neighbourhood centres have also developed in the suburbs of Peakhurst, Peakhurst Heights and Lugarno. The main exception being Hurstville which is defined as a “sub regional multi purpose retail, financial commercial community recreational and residential centre” by the ILAP Integrated Transport and Landuse Study for Hurstville, Rockdale and Kogarah. The four main precincts as defined and described by Hurstville City Council in Development Control Plan No. 4 (July 1998) are as follows.

Hurstville Final Report __________________________________________________________________________________________________________________
_______________________________________________________________________________ Southern Alliance Valuation Services Pty Ltd – Hurstville Final Report – BD 1 July 2015 Page 6 of 49
1.0 GENERAL DESCRIPTION OF LOCAL GOVERNMENT AREA (Cont.)
1. The Western City Edge The area which is focussed on Forest Road and Queens Road forms the western entrance to the city. It is lined with car yards, office buildings commercial buildings, rail sheds and residential towers. The buildings are predominantly object buildings with varying setbacks. The street alignment is not uniform and so lacks the continuity of active street frontage which exists along Forest road in the neighbouring Forest Road Centre precinct.
2. Forest Road Centre The buildings adjacent to Forest Road are aligned consistently to the street frontage, creating a sculpted form which emphasises the topography and alignment of the street. This provides a strong sense of space on Forest Road. The subdivision pattern of narrow blocks perpendicular to Forest Road are expressed by the narrow facades and party walls which step down and up the hill as the street slope changes. This emphasises both the historical subdivision pattern and the slope, and creates well proportioned vertical facades many of which are built in Art Deco style. These relatively small buildings together with the street alignment, subdivision and relationship to topography, create a cohesive main street.
3. Town Centre North Town Centre North precinct provides the greatest densities in terms of retail, residential and commercial uses in the Town Centre. It includes Westfield Shoppingtown and a pair of residential towers, one twenty storey and one eight storey. These developments do not contribute positively to the streetscape or public life of the Town Centre. Westfield Shoppingtown presents blank walls and pedestrian ramps to the street, and the residential towers are not only out of scale with the street but have car parking at their lower levels.
By contrast, some of the existing low rise office buildings, particularly those in Crofts Avenue, contribute well to the street, presenting major facades and retail spaces at ground floor levels. Their height, alignment and articulation create positive urban spaces and good views from various points in the street.
MacMahon Street contains a number of important buildings which were built from 1920 to 1930. The public buildings include three churches, Council’s Civic Centre, and the Fire Station. Commercial buildings such as the Pharmacy and The Ritz Hotel complement the public buildings and are of significant heritage value. The precinct has experienced a rapid transition from single storey detached dwellings and low rise public buildings to medium and high density residential and commercial development. 4. Town Centre South The Town Centre South precinct which falls in Kogarah Municipality has the greatest density of commercial development in the Town Centre.
Ormonde Parade is a well defined street with retail and commercial buildings on the street alignment. On the southern side, these buildings range in height from two storeys to ten storeys, while on the northern side, the Supercentre defines the street edge. Railway Parade is less defined with a mix of retail, residential and commercial land uses.

Hurstville Final Report __________________________________________________________________________________________________________________
_______________________________________________________________________________ Southern Alliance Valuation Services Pty Ltd – Hurstville Final Report – BD 1 July 2015 Page 7 of 49
1.0 GENERAL DESCRIPTION OF LOCAL GOVERNMENT AREA (Cont.)
Connections are poor between the two sides of the town. The Supercentre is only permeable at three points along its entire length. The Supercentre’s vehicular access to the Town Centre is via the overbridge and through the Supercentre car park. Severe traffic congestion is experienced in this area of the city. (N.B. this is currently being addressed by the Hurstville MasterPlan)
1.1.3 Industrial
There are two main areas of industrial development. The first, located at Kingsgrove, consists of large scale development along Vanessa Street and The Crescent with some smaller scale development along Commercial Road. The second area, located at Peakhurst, consists of a mixture of small to large sized development and is bordered by Boundary Road, Forest Road, Roberts Avenue, Lorraine Street and Stanley Street.
There are two smaller pockets of industrial development located along Forest Road at Penshurst and Hurstville.
(Source: Hurstville City Council Web Site & Printed Information from Hurstville City Council)

Hurstville Final Report __________________________________________________________________________________________________________________
_______________________________________________________________________________ Southern Alliance Valuation Services Pty Ltd – Hurstville Final Report – BD 1 July 2015 Page 8 of 49
2.0 NUMBER OF VALUATIONS IN THE ZONE CATEGORIES
2.1 Zone Category Break-Up
2.1.1 Table: All Zones
Zone Category Break-Up as at 29 October 15
Residential 19,782 92.40% Business 869 4.06% Industrial 368 1.72% Open Space 229 1.07% Special Uses 145 0.68% Recreational Waterways 1 0.005% Unzoned Deferred Matter 16 0.075%
Totals 21,410 100.00%
2.1.2 Table: Residential Uses
Residential Uses Break-Up as at 29 October 15
Single Dwelling Sites 18,377 92.90% Medium Density 771 3.90% High Density 634 3.20%
Totals 19,782 100.00%

Hurstville Final Report __________________________________________________________________________________________________________________
_______________________________________________________________________________ Southern Alliance Valuation Services Pty Ltd – Hurstville Final Report – BD 1 July 2015 Page 9 of 49
2.0 NUMBER OF VALUATIONS IN THE ZONE CATEGORIES (Cont.)
2.1.3 Graph: All Zones
2.1.4 Graph: Residential Uses

Hurstville Final Report __________________________________________________________________________________________________________________
_______________________________________________________________________________ Southern Alliance Valuation Services Pty Ltd – Hurstville Final Report – BD 1 July 2015 Page 10 of 49
3.0 TOWN PLANNING & ZONING INSTRUMENTS All Councils are required to produce plans to manage the local environment within their area.
These plans set out the broad framework for development requirements to ensure that the quality of life for local residents is maintained and enhanced. The principal planning document is the Hurstville Local Environmental Plan (LEP) which covers the entire local government area. Beneath this sits a range of Development Control Plans (DCPs) which deal with specific areas or issues. 3.1 Current Planning Instruments within Hurstville City
3.1.1 Hurstville Local Environmental Plan(s) (as amended); implemented 7 December 2012
Local environmental plans (LEPs) guide planning decisions in local government areas, through zoning and development controls. They allow councils to manage the ways in which land is used and are the primary planning tool to shape the future of communities. They establish what types of development may be permitted on a parcel of land and control the form and location of new developments, protect open space, environmentally-sensitive areas and employment lands. Every council in NSW must have an LEP, which is developed in consultation with the local community and approved by the NSW Minister for Planning. Hurstville LEP 2012 has been made by the Minister for Planning and takes effect from Friday 7 December 2012. Hurstville LEP 2012 applies to all land within the Hurstville LGA, excluding land identified as “deferred matters” in the Hurstville City Centre to which Hurstville LEP 1994 applies. The LEP comprises the written Instrument and a range of maps including land zoning, floor space ratio, height of buildings, heritage and other maps.
Hurstville LEP 1994
Hurstville LEP 1994 applies only to the “deferred matters” as shown on the Land Application Map in Hurstville LEP 2012. These lands are zoned 3(b) City Centre Business Zone. The “deferred matters” include certain land in the Hurstville Civic Precinct, Treacy Street car park and the Westfield site.
Background on Hurstville LEP 2012
As part of the State Government’s major planning reforms, in 2008 Council resolved to prepare a new Comprehensive Local Environmental Plan (LEP 2012) to replace the Hurstville Local Environmental Plan 1994.
Hurstville LEP 2012 commenced on 7 December 2012. The draft LEP was prepared in accordance with the NSW Government’s Standard Instrument. The LEP was informed by a series of Discussion Papers and community feedback.

Hurstville Final Report __________________________________________________________________________________________________________________
_______________________________________________________________________________ Southern Alliance Valuation Services Pty Ltd – Hurstville Final Report – BD 1 July 2015 Page 11 of 49
3.0 TOWN PLANNING & ZONING INSTRUMENTS (Cont.) Hurstville LEP 2012 (Amendment No.1)
Hurstville LEP 2012 (Amendment No.1) commenced on 13 September 2013. This amendment applied to certain land in Beverly Hills and Kingsgrove on the southern side of the M5 Freeway. This land was formerly in the Canterbury Local Governmental Area. Amendment No.1 included the subject land within the Hurstville LEP 2012. Hurstville LEP 2012 (Amendment No.2)
Hurstville LEP 2012 (Amendment No.2) commenced on 4 April 2014. This amendment included 31 new heritage items on the heritage list (Schedule 5) and amended the Heritage Maps in the LEP. Hurstville LEP 2012 (Amendment No.3)
Hurstville LEP 2012 (Amendment No. 3) commenced on 24 July 2015. This amendment applied to land in the Hurstville City Centre, excluding the “deferred matters”. It included new zoning, height of buildings, floor space ratio and other maps for the City Centre. It also includes provisions for land identified as ‘deferred matters’.
The deferred matters include certain land in the Hurstville Civic Precinct, Treacy Street car park and the Westfield site. The planning controls in Hurstville LEP 1994 continue to apply to the deferred matters.
Hurstville LEP 2012 (Amendment No.4)
Hurstville LEP 2012 (Amendment No. 4) commenced on 24 July 2015. Amendment No. 4 corrected an inconsistency in the adopted maps of Hurstville LEP 2012 (Amendment No 3).
(Source: Hurstville City Council Website).
3.1.4 Development Control Plan (DCP) 1 (last amended 4 June 2014, eff. 12 June 2014) On 7 December 2012 Hurstville Local Environmental Plan 2012 (HLEP 2012) commenced. LEP 2012 applies to all land within the Hurstville Local Government Area (except the Hurstville City Centre). Amendments to DCP 1 were made to make it consistent with the provisions and controls in HLEP 2012. The above DCP 1 amendments were adopted 12 June 2013, and commenced on 24 June 2013. DCP 1 includes planning controls for development within Hurstville local government area, except for developments within Hurstville City Centre. Applicants must address the relevant sections of DCP 1 when proposing works within this jurisdiction.

Hurstville Final Report __________________________________________________________________________________________________________________
_______________________________________________________________________________ Southern Alliance Valuation Services Pty Ltd – Hurstville Final Report – BD 1 July 2015 Page 12 of 49
3.0 TOWN PLANNING & ZONING INSTRUMENTS (Cont.)
3.1.5 Development Control Plan (DCP) 2 (last amended 17 September 2014, eff. 24 July 2015)
Applies to land identified as ‘Hurstville City Centre’, excluding land identified as ‘deferred matters’ on the Land Application Map as shown in Appendix 1 of the DCP. The deferred matters include certain land in the Hurstville Civic Precinct, Treacy Street car park and the Westfield site.
DCP 2 – Am. 6 provides the planning controls for commercial, mixed-use and residential development including car parking rates. The plan commences on 24 July 2015.
DCP 2 – Am. 5 applies only to those sites identified as “deferred matters” on the Land Application Map as shown in Appendix 1 of the DCP. The deferred matters include certain land in the Hurstville Civic Precinct, Treacy Street car park and the Westfield site.
3.1.6 Hurstville MasterPlan
Hurstville City Council's Hurstville City Centre Concept Master Plan is a 10-point strategy to improvement public infrastructure and amenity in Hurstville CBD and uphold the City's status as southern Sydney's regional centre. It includes:
1. Building our City to Protect our Suburbs – Council is committed to improving the City Centre and attracting high quality commercial and retail ventures that will create additional jobs and services for our community
2. A New Bus Interchange - a new bus interchange will enable seamless coordination of local bus services and regional buses that are expected to travel through the City in future
3. A New Civic Precinct – creation of a new Civic Precinct on the current Council Civic Centre block will provide new public spaces, entertainment and community facilities and commercial buildings
4. Better North-South Connections - improved connections across the railway line to link the Forest Road and Ormonde Parade precincts in our City Centre.
5. Improved Railway Station Access - improved access to the railway station including a new entry near the bus interchange, along with improved escalator and lift access
6. More Open Space - establishment of a series of public spaces throughout the City Centre to provide communtiy space and better pedestrian access
7. Greening the City Centre - a program of sustainability and amenity improvements including the planting of street trees and landscaping of key gateway sites and public spaces, and the encouragement of environmentally friendly buildings in Hurstville CBD
8. Improved traffic flow and additional public parking - review of the traffic system to make vehicular movements more efficient and the City Centre easier to navigate, and to identify future locations for additional public parking
9. Increased employment - encourage more employment opportunities through increased commercial development in the City Centre
10. Funding options for public facilities - investigate innovative funding methods for new public infrastructure including ‘value capture’ from future private development.
(Source: Hurstville City Council Website).

Hurstville Final Report __________________________________________________________________________________________________________________
_______________________________________________________________________________ Southern Alliance Valuation Services Pty Ltd – Hurstville Final Report – BD 1 July 2015 Page 13 of 49
4.0 IDENTIFIED SIGNIFICANT CHANGES IN USE OR DEVELOPMENTS OF PROPERTY AND OTHER FACTORS WHICH MAY AFFECT VALUATIONS
4.1 Hurstville City Centre Planning Project
Background
Council commenced work on the preparation of a new suite of planning controls for the Hurstville City Centre in August 2008. The planning controls include draft Hurstville LEP (Hurstville City Centre) 2014 (draft LEP) and amendments to Development Control Plan No. 2 – Hurstville City Centre (Draft DCP 2).
The new planning controls will ensure that Hurstville City Centre is informed by the principles in the Hurstville City Centre Masterplan 2004. It will also strengthen Hurstville City’s position as a strategic Major Centre, in line with objectives and targets in the NSW Government’s Metropolitan Plan for Sydney 2036, the draft Metropolitan Strategy for Sydney to 2031 and Draft South Subregional Strategy 2007.
Timeline – latter events
17/7/2014 – 14/8/2014 Public Exhibition of draft LEP (Hurstville City Centre) 2014 and draft amendments to DCP 2 – Hurstville City Centre. Documents available to view via Councils website.
20 submissions were received during the public exhibition of the draft LEP and draft DCP 2.
17/9/2014 Report to Council on submissions received as part of the public
exhibition. Council adopted the draft LEP and forward the draft LEP to Department of Planning and Environment. Council adopted the draft DCP 2 at this meeting.
30/10/2014 Draft LEP forwarded to the Department for making. 10/7/2015 Hurstville LEP 2012 (Amendment 3) made. 24/7/2015 Hurstville LEP 2012 and DCP 2 commence.
With the commencement of the amendments to Hurstville LEP 2012 and the DCP 2 a suite of planning controls were introduced/amended including, but not limited to: maximum building height, maximum floor space ratio, land reservation & heritage affected properties and active street frontages.
Additionally, a rezoning of the land within Hurstville City Centre occurred. In general, lands previously zoned: ‘Zone No.3(b) – City Centre Business Zone’ and ‘Zone No.3(d) – City Centre Commercial Core’, under the Hurstville LEP 1994, were rezoned to ‘B4 – Mixed Use’ and ‘B3 – Commercial Core’ respectively under the amendments to Hurstville LEP 2012.
Additional information and exact confirmation on individually affected properties can either be found via Hurstville Council’s website or the NSW Legislation website.

Hurstville Final Report __________________________________________________________________________________________________________________
_______________________________________________________________________________ Southern Alliance Valuation Services Pty Ltd – Hurstville Final Report – BD 1 July 2015 Page 14 of 49
4.0 IDENTIFIED SIGNIFICANT CHANGES IN USE OR DEVELOPMENTS OF PROPERTY AND OTHER FACTORS WHICH MAY AFFECT VALUATIONS (Cont.)
4.2 Property Market Overview
Australia’s residential property market exhibited mixed levels of growth over the 2014/15 financial year. The CoreLogic RP Data Home Value Index illustrates the combined capital city index rose 9.8% over the 12 months ending 30 June 2015. According to the index, Sydney residential properties showed an increase of 16.2% over the 12 months ending 30 June 2015 with Melbourne being the closest capital city to Sydney in terms of growth recording 10.2% over the same period. It is evident that the Sydney and Melbourne property markets have continued to increase in value at a faster pace than other Australian capital cities over the 2014/15 financial year. Some pockets of Sydney and noticeably some components of the Hurstville LGA had recorded stronger growth than others, however as a whole the Hurstville LGA moved homogenously showing considerable growth. The continued growth in the Sydney and Melbourne property markets and the imbalance between owner-occupied finance vs. investor finance has drawn the attention of regulatory bodies including the Australian Prudential Regulation Authority (APRA). APRA highlighted in December 2014 that authorised deposit-taking institutes (ADIs) must not exceed growth in investor loans above 10% per annum. Furthermore, in July 2015 APRA announced an increase in capital requirements for Australian residential mortgage exposures under the internal ratings-based (IRB) approach which would see the average risk weight of residential mortgage exposures using the IRB approach increase to at least 25% by mid-2016, from an average of around 17% at the end of June 2015. All big four banks (ANZ, NAB, Westpac & Commonwealth) increased the variable interest rates on residential investor loans between 0.27 and 0.29 percentage points over the two weeks ending 4 August 2015. Westpac notes the increases are a response following the introduction of investor lending growth benchmarks set by APRA. Furthermore, from 14 October 2015 to 23 October 2015, all big four banks increased their variable interest rates on residential owner-occupier and investor home loans between 15 and 20 basis points – with all four banks citing the decision was partly attributable to the requirement to increase the amount of capital applied to residential mortgages.
SQM Research has reported a notable increase in Sydney residential property listings over the year ending September 2015, whilst the national listing numbers declined over the same period. SQM noted Sydney residential listing numbers rose 7.6% over the month of September 2015 and rose 11.1% over the 12 months ending 30 September 2015 compared to the national residential listing numbers decreasing 0.1% over the 12 months ending 30 September 2015. Furthermore, Australian Property Monitors (APM) research indicates Sydney’s residential auction clearance rates last peaked at 89% in May / June 2015 which have since steadily declined to a clearance rate of 65% on Saturday 17 October. Expanding on the above, the information suggest that some of the heat of the Sydney residential property market – which was exhibited in the first half of 2015 – may have dissipated in recent months. However, as at date of report, there is no available information to suggest that in recent months the above has had any direct impact on residential property values.

Hurstville Final Report __________________________________________________________________________________________________________________
_______________________________________________________________________________ Southern Alliance Valuation Services Pty Ltd – Hurstville Final Report – BD 1 July 2015 Page 15 of 49
4.0 IDENTIFIED SIGNIFICANT CHANGES IN USE OR DEVELOPMENTS OF PROPERTY AND OTHER FACTORS WHICH MAY AFFECT VALUATIONS (Cont.) Overall, retail property has benefited from an uplift in family net worth, driven by the increases in residential dwelling values, which help support discretionary spending and spending on consumer / household goods. Density / development sites continued to perform well over the 2014/15 financial year. Generally, residential development continues to outprice commercial development as the highest and best use and as such, sites with residential development potential remain in high demand across southern Sydney. Industrial property in the St George locale performed well over the 2015 financial year, following a few years of subdued activity. Industrial properties in St George largely recorded positive growth around 10% or slightly greater. Individual pockets can move against the trend for varying reasons, however on the whole properties within the City of Hurstville were relatively consistent. Aircraft Noise - Aircraft noise is a continuing factor within the Hurstville Local Government Area, however any affectation is reflected in the relevant market evidence. Aircraft Movements and Airport Operational Statistics are available at the following web site www.airservicesaustralia.com.
4.3 Economy Overview
The following statement was issued by the Reserve Bank of Australia for the monetary policy decision held 7 July 2015 and provides a concise summary on the outlook for national and global economies as at the 2015 base date:- International Economic Conditions:
The Board's discussion about economic conditions opened with the observation that economic growth in Australia's major trading partners appeared to have been around average in the June quarter. Consumption growth had been little changed for most trading partners in recent months, although it was perhaps a bit stronger in the United States and somewhat weaker in China. The level of consumption in Japan remained well below that seen prior to the increase in the consumption tax in 2014. Core inflation rates had been stable in year-ended terms over recent months and remained below the targets of most central banks. Members also observed that trade volumes, particularly within the Asian region, appeared to have fallen recently. Consistent with this observation, growth in industrial production across a number of east Asian economies had slowed a little.
In China, there had been little change in the monthly indicators of economic activity, although conditions had been a bit more positive in some sectors than early in 2015. The Chinese property market had improved somewhat; residential property prices overall had risen for the first time in a year and floor space sold had increased in the past few months. Members reflected that the recent easing in monetary conditions would provide additional support to the property market and growth more broadly, although it could be some time before a significant pick-up in construction activity began. Recent efforts by central government authorities to increase infrastructure investment further and reform local government financing arrangements were also expected to support investment.
Commodity prices overall had fallen since the previous meeting, driven by iron ore and oil prices. Growth in crude steel production had been modest and steel prices had fallen noticeably over the past month. Iron ore production in China had continued to decline. Shipments of iron ore from Australia and Brazil appeared to have increased in June, which contributed to lower iron ore prices over the past month.

Hurstville Final Report __________________________________________________________________________________________________________________
_______________________________________________________________________________ Southern Alliance Valuation Services Pty Ltd – Hurstville Final Report – BD 1 July 2015 Page 16 of 49
4.0 IDENTIFIED SIGNIFICANT CHANGES IN USE OR DEVELOPMENTS OF PROPERTY AND OTHER FACTORS WHICH MAY AFFECT VALUATIONS (Cont.)
Following quite strong output growth in Japan in the March quarter, more timely indicators pointed to modest growth in the June quarter. Labour market conditions had continued to improve, resulting in the unemployment rate falling further and the ratio of jobs to applicants continuing to rise. Wage growth and financial market measures of inflation expectations were higher than a year earlier and were expected to feed into higher core inflation over time. Members considered the importance for Japan of policy reforms designed to address some longer-term structural challenges, such as the ageing of the population.
In the United States, recent data pointed to moderate growth in economic activity in the June quarter following weakness in the March quarter. The labour market had strengthened further, with growth in non-farm payrolls employment rebounding in April and May and the unemployment rate falling. While there had been some increase in measures of wage growth, core measures of inflation remained below the Federal Reserve's inflation target.
In the euro area, the available indicators pointed to modest economic growth and above-average sentiment in the June quarter, continuing the recent trend of improved conditions in the euro area as a whole. Members noted that exports had made a significant contribution to the pick-up in growth in the region but investment was still well below the levels seen prior to the global financial crisis. The unemployment rate had continued to fall modestly since its peak two years earlier, but varied sharply across the euro area; the unemployment rate was highest in Greece, where output was more than 25 per cent below its level prior to the financial crisis.
Domestic Economic Conditions:
Members noted that output had increased by 0.9 per cent in the March quarter and by 2.3 per cent over the year. Resource exports had made a significant contribution to growth, reflecting better-than-usual weather conditions in the quarter. Dwelling investment had remained strong and while consumption growth had picked up over the past year or so, it had remained below average. Business investment had contracted in the quarter and there had been little growth in public demand. More recent economic indicators suggested that domestic demand had continued to grow at a below-average pace over recent months, but that labour market conditions had continued to improve.
Members observed that consumption grew faster than household income over the year to the March quarter. As a result, the saving ratio had declined further, although it remained well above the level it had been over much of the past 25 years. Year-ended growth in retail sales had been little changed over recent months and liaison suggested that this was likely to have continued into June. Retail sales growth had been relatively strong in New South Wales and Victoria but weaker in Queensland and Western Australia, in line with observed differences in economic conditions across the country. At the same time, surveys indicated that consumers had viewed their financial situation as being above average over the past year, notwithstanding the relatively weak growth in labour incomes. Members observed that this was likely to reflect the very low level of interest rates and strong growth in net household wealth.

Hurstville Final Report __________________________________________________________________________________________________________________
_______________________________________________________________________________ Southern Alliance Valuation Services Pty Ltd – Hurstville Final Report – BD 1 July 2015 Page 17 of 49
4.0 IDENTIFIED SIGNIFICANT CHANGES IN USE OR DEVELOPMENTS OF PROPERTY AND OTHER FACTORS WHICH MAY AFFECT VALUATIONS (Cont.)
Dwelling investment increased by 9 per cent over the year to the March quarter. An increase in the construction of new dwellings accounted for most of this growth, but the alterations and additions component had also contributed more recently, recording the first increase in a year in the March quarter. Forward-looking indicators pointed to further strong growth in dwelling investment in the period ahead. Members noted that there had been ongoing divergence in conditions in established housing markets across the country, as well as between houses and apartments. Housing prices had continued to rise rapidly in Sydney and to a lesser extent in Melbourne. Elsewhere, there had been little change in housing prices over the past six months or so. Prices of apartments had been growing less rapidly than those of houses, which members considered to be consistent with the relatively strong growth in the supply of higher-density housing in many capital cities.
Growth in housing credit overall had been stable over recent months at around 7 per cent on an annualised basis, while growth in lending to investors had been steady at a bit above 10 per cent. Members observed that the household debt-to-income ratio, calculated by netting funds held in mortgage offset accounts from total household debt to the financial sector, had increased over the year to March but had not exceeded previous peaks. Members discussed the fact that high housing prices had different implications for existing home owners, who benefited from increased wealth, and potential new home owners, who were finding it more difficult to finance a home purchase.
Investment in both the mining and non-mining sectors appeared to have fallen in the March quarter, although the split between the two components remained subject to some uncertainty. Profits for non-mining firms had increased by 6 per cent over the past year. More recent survey measures of business conditions, confidence and capacity utilisation had picked up to be around, or even above, their long-run averages. In contrast, private non-residential building approvals had remained weak.
The monthly trade data suggested that resource exports, including iron ore and coal, had declined in the June quarter. Coal exports had been affected by the severe storms in the Hunter region of New South Wales in late April. Members noted that there had been further signs of growth in service exports, in part a response to the depreciation of the exchange rate. Over the past year, net service exports had made a similar contribution to output growth as exports of iron ore, even though total import volumes had increased in the March quarter.
Labour force data indicated further signs of improvement in May. Employment growth had picked up over the year to exceed the rate of population growth. As a result, the unemployment rate had been relatively stable since the latter part of 2014 and had fallen slightly in May to 6 per cent. Members observed that employment growth had been strongest in household services and that employment and vacancies had been growing for business services but had remained little changed in the goods sector. As with other state-based indicators, employment growth and job vacancies had been strongest in New South Wales and Victoria. Forward-looking labour market indicators had been somewhat mixed over recent months. The ABS measure of firms' job vacancies overall suggested that demand for labour could be sufficient to maintain a stable or even falling unemployment rate in the near term, while other forward-looking indicators suggested only modest growth in employment in coming months.
Hurstville Final Report __________________________________________________________________________________________________________________
_______________________________________________________________________________ Southern Alliance Valuation Services Pty Ltd – Hurstville Final Report – BD 1 July 2015 Page 18 of 49
4.0 IDENTIFIED SIGNIFICANT CHANGES IN USE OR DEVELOPMENTS OF PROPERTY AND OTHER FACTORS WHICH MAY AFFECT VALUATIONS (Cont.)
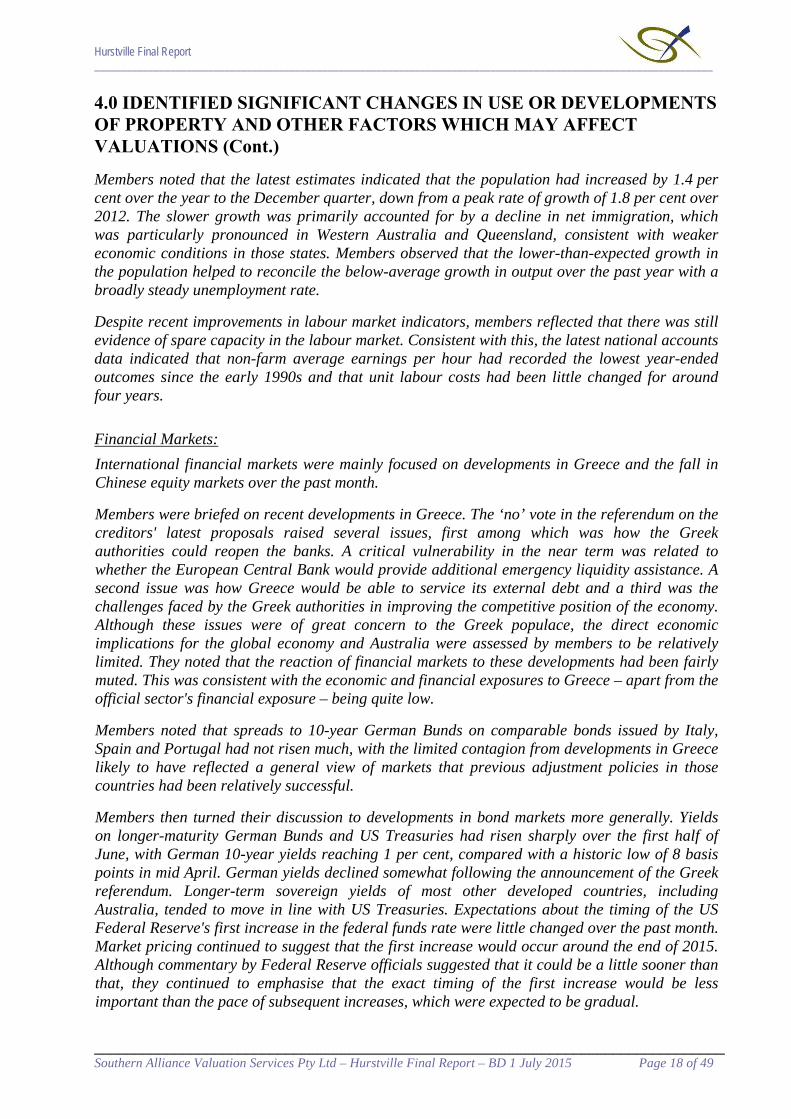
Members noted that the latest estimates indicated that the population had increased by 1.4 per cent over the year to the December quarter, down from a peak rate of growth of 1.8 per cent over 2012. The slower growth was primarily accounted for by a decline in net immigration, which was particularly pronounced in Western Australia and Queensland, consistent with weaker economic conditions in those states. Members observed that the lower-than-expected growth in the population helped to reconcile the below-average growth in output over the past year with a broadly steady unemployment rate.
Despite recent improvements in labour market indicators, members reflected that there was still evidence of spare capacity in the labour market. Consistent with this, the latest national accounts data indicated that non-farm average earnings per hour had recorded the lowest year-ended outcomes since the early 1990s and that unit labour costs had been little changed for around four years.
Financial Markets:
International financial markets were mainly focused on developments in Greece and the fall in Chinese equity markets over the past month.
Members were briefed on recent developments in Greece. The ‘no’ vote in the referendum on the creditors' latest proposals raised several issues, first among which was how the Greek authorities could reopen the banks. A critical vulnerability in the near term was related to whether the European Central Bank would provide additional emergency liquidity assistance. A second issue was how Greece would be able to service its external debt and a third was the challenges faced by the Greek authorities in improving the competitive position of the economy. Although these issues were of great concern to the Greek populace, the direct economic implications for the global economy and Australia were assessed by members to be relatively limited. They noted that the reaction of financial markets to these developments had been fairly muted. This was consistent with the economic and financial exposures to Greece – apart from the official sector's financial exposure – being quite low.
Members noted that spreads to 10-year German Bunds on comparable bonds issued by Italy, Spain and Portugal had not risen much, with the limited contagion from developments in Greece likely to have reflected a general view of markets that previous adjustment policies in those countries had been relatively successful.
Members then turned their discussion to developments in bond markets more generally. Yields on longer-maturity German Bunds and US Treasuries had risen sharply over the first half of June, with German 10-year yields reaching 1 per cent, compared with a historic low of 8 basis points in mid April. German yields declined somewhat following the announcement of the Greek referendum. Longer-term sovereign yields of most other developed countries, including Australia, tended to move in line with US Treasuries. Expectations about the timing of the US Federal Reserve's first increase in the federal funds rate were little changed over the past month. Market pricing continued to suggest that the first increase would occur around the end of 2015. Although commentary by Federal Reserve officials suggested that it could be a little sooner than that, they continued to emphasise that the exact timing of the first increase would be less important than the pace of subsequent increases, which were expected to be gradual.

Hurstville Final Report __________________________________________________________________________________________________________________
_______________________________________________________________________________ Southern Alliance Valuation Services Pty Ltd – Hurstville Final Report – BD 1 July 2015 Page 19 of 49
4.0 IDENTIFIED SIGNIFICANT CHANGES IN USE OR DEVELOPMENTS OF PROPERTY AND OTHER FACTORS WHICH MAY AFFECT VALUATIONS (Cont.)
The People's Bank of China (PBC) eased monetary policy further in June by cutting benchmark deposit and lending rates by 25 basis points, citing low inflation and a consequent increase in real interest rates. In addition, the PBC announced cuts to the reserve requirement ratio for selected financial institutions. The Chinese authorities had also announced a proposal to allow banks more flexibility in their choice of funding mix and asset allocation, which could lead to an increase in the supply of credit over time.
The Reserve Bank of New Zealand lowered its policy rate by 25 basis points, to 3.25 per cent, citing the decline in New Zealand's terms of trade and the disinflationary effect of stronger-than-expected labour force growth.
Global equity markets fell by 3 per cent over the course of June, with broad-based falls and price movements generally tending to reflect fluctuations in sentiment about Greece. The Chinese equity market also fell sharply in June, partly in response to what was only a modest tightening of restrictions on margin lending. Mainland share prices were still well above their levels of a year earlier but the sharpness of the recent fall prompted the Chinese authorities to announce a number of measures, including an indefinite suspension of initial public offerings, an equity stabilisation fund and a funding facility for brokers. The Australian equity market underperformed several other advanced economy markets in June, mainly reflecting falls in resources and consumer sector share prices.
Global foreign exchange markets were relatively subdued in June. The euro recorded only a modest and short-lived fall when markets opened after the announcement of the Greek referendum result. The Australian dollar was 3 per cent lower against the US dollar and on a trade-weighted basis.
Corporate bond issuance in Australia had been strong over the course of 2015 to date, particularly by resource companies, although much of the increase reflected refinancing.
Pricing of Australian money market instruments suggested that the cash rate target was expected to remain unchanged at the present meeting.
4.4 Court Cases The High Court decision Maurici v Deputy Commissioner of Land Tax requires that the valuation be made free of any influence of scarcity. In effect, the valuer is required to have regard to the whole market and not just the vacant land sales. In order to fulfil this requirement Southern Alliance Valuation Services Pty Ltd had regard to all the sales evidence.
Hurstville Final Report __________________________________________________________________________________________________________________
_______________________________________________________________________________ Southern Alliance Valuation Services Pty Ltd – Hurstville Final Report – BD 1 July 2015 Page 20 of 49
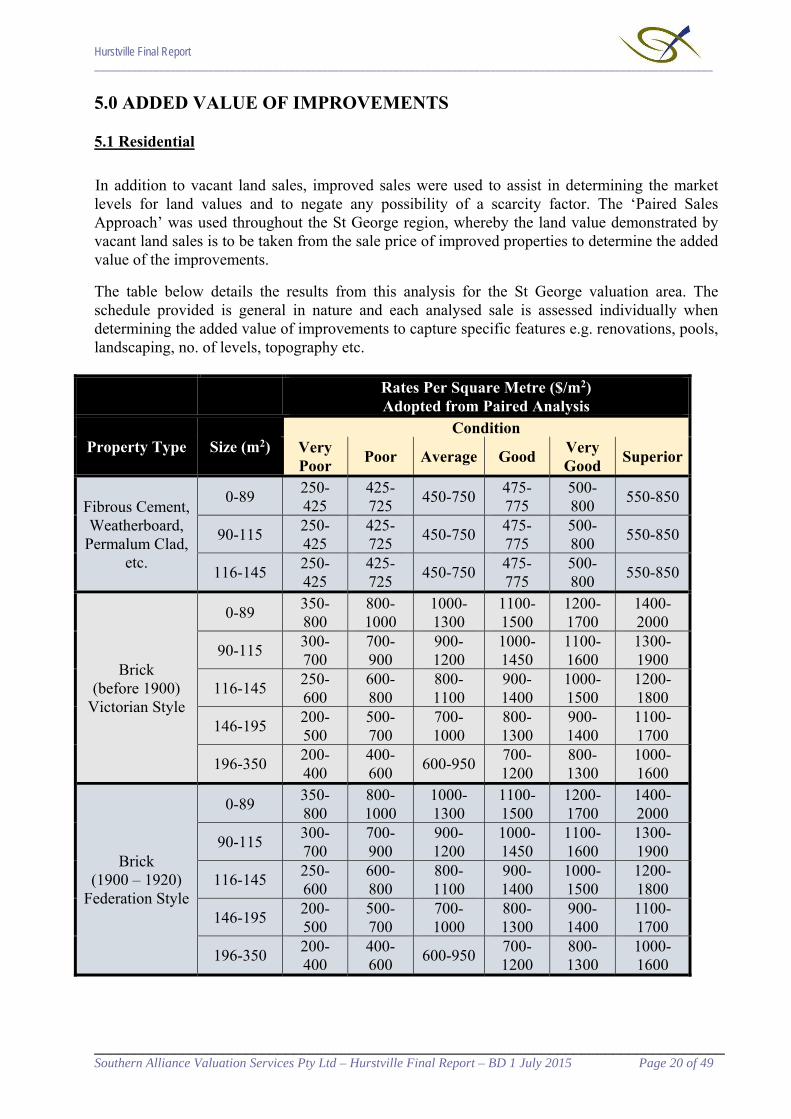
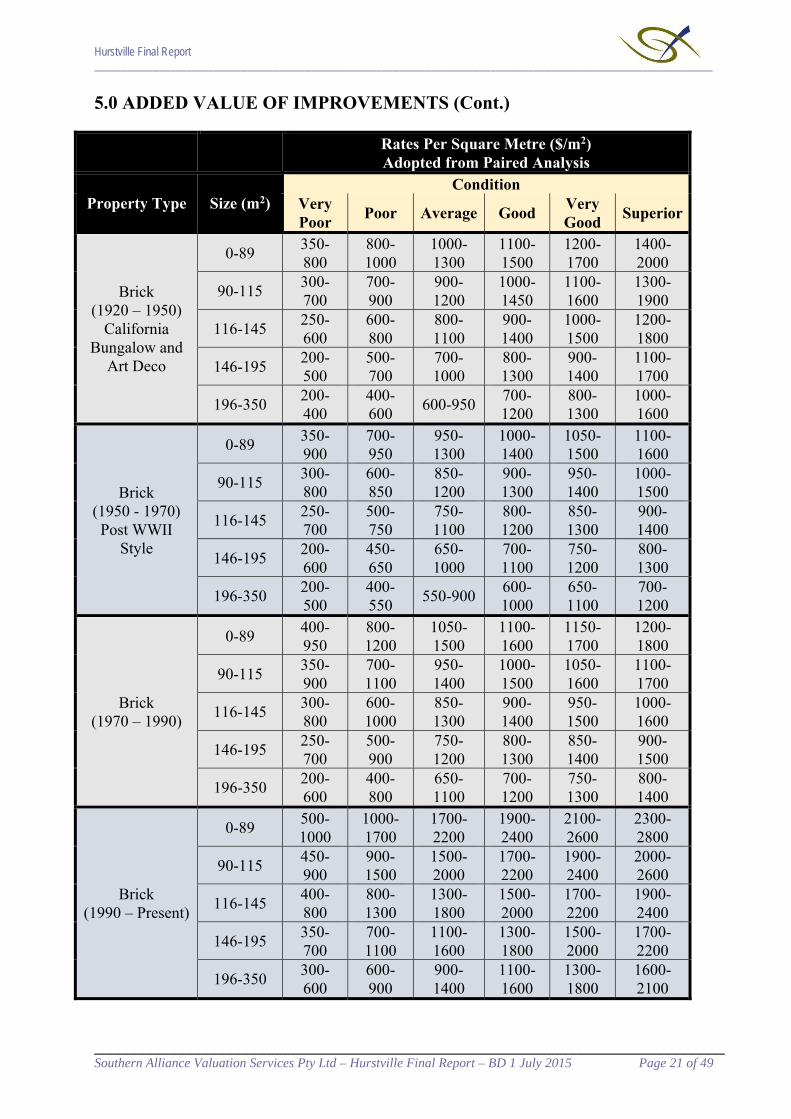
5.0 ADDED VALUE OF IMPROVEMENTS 5.1 Residential
In addition to vacant land sales, improved sales were used to assist in determining the market levels for land values and to negate any possibility of a scarcity factor. The ‘Paired Sales Approach’ was used throughout the St George region, whereby the land value demonstrated by vacant land sales is to be taken from the sale price of improved properties to determine the added value of the improvements.
The table below details the results from this analysis for the St George valuation area. The schedule provided is general in nature and each analysed sale is assessed individually when determining the added value of improvements to capture specific features e.g. renovations, pools, landscaping, no. of levels, topography etc.
Rates Per Square Metre ($/m2) Adopted from Paired Analysis
Property Type Size (m2) Condition
Very Poor
Poor Average Good Very Good
Superior
Fibrous Cement, Weatherboard,
Permalum Clad, etc.
0-89 250-425
425-725
450-750 475-775
500-800
550-850
90-115 250-425
425-725
450-750 475-775
500-800
550-850
116-145 250-425
425-725
450-750 475-775
500-800
550-850
Brick (before 1900)
Victorian Style
0-89 350-800
800-1000
1000-1300
1100-1500
1200-1700
1400-2000
90-115 300-700
700-900
900-1200
1000-1450
1100-1600
1300-1900
116-145 250-600
600-800
800-1100
900-1400
1000-1500
1200-1800
146-195 200-500
500-700
700-1000
800-1300
900-1400
1100-1700
196-350 200-400
400-600
600-950 700-1200
800-1300
1000-1600
Brick (1900 – 1920)
Federation Style
0-89 350-800
800-1000
1000-1300
1100-1500
1200-1700
1400-2000
90-115 300-700
700-900
900-1200
1000-1450
1100-1600
1300-1900
116-145 250-600
600-800
800-1100
900-1400
1000-1500
1200-1800
146-195 200-500
500-700
700-1000
800-1300
900-1400
1100-1700
196-350 200-400
400-600
600-950 700-1200
800-1300
1000-1600
Hurstville Final Report __________________________________________________________________________________________________________________
_______________________________________________________________________________ Southern Alliance Valuation Services Pty Ltd – Hurstville Final Report – BD 1 July 2015 Page 21 of 49
5.0 ADDED VALUE OF IMPROVEMENTS (Cont.)
Rates Per Square Metre ($/m2) Adopted from Paired Analysis
Property Type Size (m2) Condition
Very Poor
Poor Average Good Very Good
Superior
Brick (1920 – 1950)
California Bungalow and
Art Deco
0-89 350-800
800-1000
1000-1300
1100-1500
1200-1700
1400-2000
90-115 300-700
700-900
900-1200
1000-1450
1100-1600
1300-1900
116-145 250-600
600-800
800-1100
900-1400
1000-1500
1200-1800
146-195 200-500
500-700
700-1000
800-1300
900-1400
1100-1700
196-350 200-400
400-600
600-950 700-1200
800-1300
1000-1600
Brick (1950 - 1970) Post WWII
Style
0-89 350-900
700-950
950-1300
1000-1400
1050-1500
1100-1600
90-115 300-800
600-850
850-1200
900-1300
950-1400
1000-1500
116-145 250-700
500-750
750-1100
800-1200
850-1300
900-1400
146-195 200-600
450-650
650-1000
700-1100
750-1200
800-1300
196-350 200-500
400-550
550-900 600-1000
650-1100
700-1200
Brick (1970 – 1990)
0-89 400-950
800-1200
1050-1500
1100-1600
1150-1700
1200-1800
90-115 350-900
700-1100
950-1400
1000-1500
1050-1600
1100-1700
116-145 300-800
600-1000
850-1300
900-1400
950-1500
1000-1600
146-195 250-700
500-900
750-1200
800-1300
850-1400
900-1500
196-350 200-600
400-800
650-1100
700-1200
750-1300
800-1400
Brick (1990 – Present)
0-89 500-1000
1000-1700
1700-2200
1900-2400
2100-2600
2300-2800
90-115 450-900
900-1500
1500-2000
1700-2200
1900-2400
2000-2600
116-145 400-800
800-1300
1300-1800
1500-2000
1700-2200
1900-2400
146-195 350-700
700-1100
1100-1600
1300-1800
1500-2000
1700-2200
196-350 300-600
600-900
900-1400
1100-1600
1300-1800
1600-2100

Hurstville Final Report __________________________________________________________________________________________________________________
_______________________________________________________________________________ Southern Alliance Valuation Services Pty Ltd – Hurstville Final Report – BD 1 July 2015 Page 22 of 49
5.0 ADDED VALUE OF IMPROVEMENTS (Cont.)
Rates Per Square Metre ($/m2) Adopted from Paired Analysis
Property Type Size (m2) Condition
Very Poor
Poor Average Good Very Good
Superior
Project Home Presentation
(Modern)
0-89 500-1500
1500-2200
1900-2400
2100-2600
2300-2800
2500-3000
90-115 450-1300
1300-2000
1700-2200
1900-2400
2100-2600
2300-2800
116-145 400-1100
1100-1800
1500-2000
1700-2200
1900-2400
2100-2600
146-195 350-900
900-1600
1300-1800
1500-2000
1700-2200
1900-2400
196-350 300-700
700-1400
1100-1600
1300-1800
1500-2000
1700-2200
Architectural Design
(Modern)
0-89 1000-2000
2000-3400
3400-4100
3600-4400
3800-4700
4000-5000
90-115 850-1850
1850-3150
3150-3850
3350-4150
3550-4450
3750-4750
116-145 700-1700
1700-2900
2900-3600
3100-3900
3300-4200
3500-4500
146-195 550-1550
1550-2650
2650-3350
2850-3650
3050-3950
3250-4250
196-350 400-1400
1400-2400
2400-3100
2600-3400
2800-3700
3000-4000

Hurstville Final Report __________________________________________________________________________________________________________________
_______________________________________________________________________________ Southern Alliance Valuation Services Pty Ltd – Hurstville Final Report – BD 1 July 2015 Page 23 of 49
5.0 ADDED VALUE OF IMPROVEMENTS (Cont.) 5.1.1 Paired Analysis Examples of Paired Analysis within St George Area:
Vacant Site sale at 2 Southern Street, Oatley. Sold 25 October 2014 for $1,200,000. Dimensions: 17.68 x 40.23. Area: 711.27m2.
Paired with:- 29 Yarran Road, Oatley. Sold 2 May 2015 for $1,460,000. Dimensions: 17.12 x 41.09. Area: 703.2m2.
Circa late 1960’s / early 1970’s, single storey with sub-floor, brick and part weatherboard dwelling with brick perimeter wall foundation and tiled roof. Accommodation generally consists of 5 bedrooms, 3 bathrooms and a DLUG UMR. Partly renovated / updated throughout. Modern renovated kitchen and ensuite. Main bathroom appears to be have been renovated circa 1990’s. In-ground pool. GBA: 190m2 (approx.), excluding garage 33m2 (approx.), under house storage 30m2 (approx.) and rear verandah 18m2 (approx.). After allowing for size, location, date, topography etc. shows $209,000 (equates to $1,100/m2) for this type of improvement and $52,150 for existing garage, under house storage, in-ground pool, rear verandah, driveways, paths, landscaping and fencing - Total: $261,150. Or paired with:- 23 Yarran Road, Oatley. Sold 23 March 2015 for $1,750,000. Dimensions: 20.12 / 15.8 x 35.05 / 36.39 IRR. Area: 691.4m2.
Circa 2004, double storey, brick dwelling with concrete slab foundation and tiled roof. Accommodation generally consists of 5 bedrooms, 3 bathrooms and a DLUG UMR. Dwelling appears to be mostly original since date of construction, however well maintained with a good standard of finish. In-ground pool. GBA: 255m2 (approx.), excluding garage 32m2 (approx.) and rear entertainment area 23m2 (approx.). After allowing for size, location, date, topography etc. shows $420,750 (equates to $1,650/m2) for this type of improvement and $84,050 for existing garage, rear entertainment area, in-ground pool, driveways, paths, landscaping and fencing - Total: $504,800. Or paired with:- 12 Lloyd Street, Oatley. Sold 18 October 2014 for $1,400,000. Dimensions: 15.24 x 45.72. Area: 696.77m2.
Circa 1960’s single storey, brick dwelling with brick perimeter wall foundation and tiled roof. Accommodation generally consists of 3 bedrooms, 1 bathrooms and a detached SLUG with work shed, garden storage and additional water closet. Dwelling appears to be mostly original, however well maintained. GBA: 150m2 (approx.), excluding garage/workshop/storage/w.c. 51m2 (approx.). After allowing for size, location, date, topography etc. shows $150,000 (equates to $1,000/m2) for this type of improvement and $28,300 for existing garage/workshop/storage/w.c., driveways, paths, landscaping and fencing - Total: $178,300.

Hurstville Final Report __________________________________________________________________________________________________________________
_______________________________________________________________________________ Southern Alliance Valuation Services Pty Ltd – Hurstville Final Report – BD 1 July 2015 Page 24 of 49
5.0 ADDED VALUE OF IMPROVEMENTS (Cont.)
Vacant Site sale at 25 The Esplanade, South Hurstville. Sold 18 October 2014 for $1,261,000. Dimensions: 13.41 x 50.29. Area: 670.3m2. Paired with:- 82 Greenacre Road, Connells Point. Sold 25 September 2015 for $2,230,000. Dimensions: 13.41 x 50.11. Area: 670.3m2.
Circa 2009, architecturally designed double storey rendered brick dwelling with concrete slab foundation and corrugated metal roof. Accommodation generally consists of 5 bedrooms (2 with ensuites and WIR), 4 bathrooms and a DLUG UMR. In-ground pool and rear entertainment deck. Front and rear balconies. GBA: 360m2 (approx.), excluding garage 33m2 (approx.), rear entertainment deck 25m2 (approx.), front balcony 13m2 (approx.) and rear balcony 49m2 (approx.). After allowing for size, location, date, topography etc. shows $936,000 (equates to $2,600/m2) for this type of improvement and $122,200 for existing garage, in-ground pool, rear entertainment deck, front & rear balconies, driveways, paths, landscaping and fencing - Total: $1,058,200.
Or paired with:-
17 Waitara Parade, Hurstville Grove. Sold 28 March 2015 for $1,480,000. Dimensions: 13.41 x 45.72. Area: 613.11m2.
Circa 1910’s single storey, brick dwelling with sandstone perimeter wall foundation and tiled roof. Accommodation generally consists of 3 bedrooms, 2 bathrooms and a detached 4 car LUG (fibrous cement construction). Dwelling appears updated throughout, with updated kitchen and bathrooms – overall, very well maintained. Front verandah, rear covered entertainment deck. GBA: 120m2 (approx.), excluding garage 54m2 (approx.), front verandah 10m2 (approx.) and rear deck 22m2 (approx.). After allowing for size, location, date, topography etc. shows $144,000 (equates to $1,200/m2) for this type of improvement and $36,200 for existing garage, front verandah, rear deck, driveways, paths, landscaping and fencing - Total: $180,200.

Hurstville Final Report __________________________________________________________________________________________________________________
_______________________________________________________________________________ Southern Alliance Valuation Services Pty Ltd – Hurstville Final Report – BD 1 July 2015 Page 25 of 49
5.0 ADDED VALUE OF IMPROVEMENTS (Cont.) Vacant Site sale at 46 Wentworth Avenue, Blakehurst.
Sold 20 September 2014 for $1,055,000. Dimensions: 14.71 / 14.12 x 63.6 / 61.49. Area: 885.2m2. Paired with:- 39 Lynwood Street, Blakehurst. Sold 1 November 2014 for $1,580,000. Dimensions: 15.24 x 49.1. Area: 748.28m2.
Circa 2010, architecturally designed (project home style) split three level brick dwelling with concrete slab foundation and tiled roof. Accommodation generally consists of 5 bedrooms, 3 bathrooms and on-site parking for 3 cars (no garage). Front balconies and rear patio. Minimal landscaping works. GBA: 290m2 (approx.), excluding front balconies 13m2 (approx.) and rear patio 7m2 (approx.). After allowing for size, location, date, topography etc. shows $464,000 (equates to $1,600/m2) for this type of improvement and $23,300 for front balconies, rear patio, driveways, paths, landscaping and fencing - Total: $487,300.
Or paired with:-
28 Wentworth Avenue, Blakehurst. Sold 13 December 2014 for $1,371,000. Dimensions: 13.41 x 63.8 / 64.13. Area: 853.6m2.
Circa 1960’s, two storey brick dwelling with brick perimeter wall and concrete slab foundation with tiled roof. Accommodation generally consists of 4 bedrooms, 2 bathrooms and no garage or on-site parking. In-ground pool (empty at DOS) and rear balcony. GBA: 200m2 (approx.) excluding rear balcony 10m2 (approx.). After allowing for size, location, date, topography etc. shows $200,000 (equates to $1,000/m2) for this type of improvement and $19,000 for in-ground pool, rear balcony, driveway (layback only), paths, landscaping and fencing - Total: $219,000.
Vacant Site sale at 63 Mountview Avenue, Beverly Hills. Sold 17 December 2014 for $820,000. Dimensions: 13.59 / 13.69 x 34.14 / 34.37. Area: 417.3m2. Paired with:- 94 Mountview Avenue, Narwee. Sold 13 September 2014 for $920,000. Dimensions: 13 x 33.53. Area: 435.89m2.
Circa 1960, single storey, brick dwelling with brick perimeter wall foundation and tiled roof. Accommodation generally consists of 3 bedrooms, 1 bathrooms and a detached DLUG (fibrous cement construction). Original throughout, moderately well maintained. GBA: 110m2 (approx.), excluding garage 30m2 (approx.) and front verandah 9m2 (approx.). After allowing for size, location, date, topography etc. shows $104,500 (equates to $950/m2) for this type of improvement and $14,850 for existing garage, front verandah, driveways, paths, landscaping and fencing - Total: $119,350.

Hurstville Final Report __________________________________________________________________________________________________________________
_______________________________________________________________________________ Southern Alliance Valuation Services Pty Ltd – Hurstville Final Report – BD 1 July 2015 Page 26 of 49
5.0 ADDED VALUE OF IMPROVEMENTS (Cont.) Vacant Site sale at 5 Warraba Street, Hurstville.
Sold 24 November 2014 for $985,000. Dimensions: 12.19 x 41.45. Area: 505.28m2. Paired with:- 23 Louis Terrace, Hurstville. Sold 8 November 2014 for $1,110,000. Dimensions: 12.19 x 45.72. Area: 557.33m2. Circa 1920’s, single storey, brick dwelling with brick perimeter wall foundation and tiled roof. Accommodation generally consists of 3 bedrooms, 1 bathroom and a detached SLUG with adjoining car port. Overall, original throughout and in average condition. GBA: 118m2 (approx.), excluding garage 23m2 (approx.), car port 17m2 (approx.), front verandah 8m2 (approx.) and rear entertaining area 20m2 (approx.). After allowing for size, location, date, topography etc. shows $106,200 (equates to $900/m2) for this type of improvement and $21,900 for existing garage, car port, front verandah, rear entertaining area, driveways, paths, landscaping and fencing - Total: $128,100. Or paired with:- 16 Emily Street, Hurstville. Sold 13 November 2014 for $1,720,000. Dimensions: 12.19 x 36.58. Area: 442.6m2. Brand new, double storey, rendered brick dwelling with concrete slab foundation and corrugated metal roof. Accommodation generally consists of 5 bedrooms, 4 bathrooms and a DLUG (under the main roof). Property also has 2 front balconies, a rear balcony and a rear patio. Overall, very good condition / construction quality. GBA: 302m2 (approx.), excluding garage 30m2 (approx.), front balconies 14m2 (approx.), rear balcony 16m2 (approx.) & rear patio 16m2 (approx.). After allowing for size, location, date, topography etc. shows $604,000 (equates to $2,000/m2) for this type of improvement and $75,800 for existing garage, front balconies, rear balcony, rear patio, driveways, paths, landscaping and fencing - Total: $679,800.
Or paired with:- 6 Joan Street, Hurstville. Sold 3 February 2015 for $1,210,000. Dimensions: 14.02 x 39.62. Area: 555.47m2. Circa 1910’s, single storey, brick dwelling with brick perimeter wall foundation and tiled roof. Accommodation generally consists of 3 bedrooms, 1 bathroom and a detached SLUG. Overall, original throughout and in average condition. GBA: 120m2 (approx.), excluding garage 20m2 (approx.), front verandah 10m2 (approx.) and rear entertaining area 20m2 (approx.). After allowing for size, location, date, topography etc. shows $156,000 (equates to $1,300/m2) for this type of improvement and $28,250 for existing garage, front verandah, driveways, paths, landscaping and fencing - Total: $184,250.

Hurstville Final Report __________________________________________________________________________________________________________________
_______________________________________________________________________________ Southern Alliance Valuation Services Pty Ltd – Hurstville Final Report – BD 1 July 2015 Page 27 of 49
5.0 ADDED VALUE OF IMPROVEMENTS (Cont.)
Vacant Site sale at 4 Turon Avenue, Kingsgrove. Sold 28 March 2015 for $1,100,000. Dimensions: 21.52 / 21.54 x 25.24 / 26.18. Area: 553.3m2. Paired with:- 64 Glenwall Street, Kingsgrove. Sold 12 June 2015 for $1,600,000. Dimensions: 24.54 / 19.68 x 22.15 / 26.75. Area: 531.1m2. Circa 2006, modern double storey, brick dwelling with concrete slab foundation and tiled roof. Accommodation generally consists of 5 bedrooms, 3 bathrooms and a DLUG (under the main roof). Property also has a front balcony and a rear patio. Overall, good-very good condition / construction quality. GBA: 265m2 (approx.), excluding garage 48m2 (approx.), front balcony 3m2 (approx.) & rear patio 40m2 (approx.). After allowing for size, location, date, topography etc. shows $424,000 (equates to $1,600/m2) for this type of improvement and $71,000 for existing garage, front balcony, rear patio, solar panels, driveways, paths, landscaping and fencing - Total: $495,000.
Vacant Site sale at 2 Primrose Avenue, Sandringham. Sold 29 November 2014 for $2,800,000. Dimensions: 15.95 / 15.77 x 57.53 / 58.09. Area: 859.9m2.
Paired with:- 110 Ida Street, Sandringham. Sold 4 February 2015 for $5,500,000. Dimensions: 23.295 / 23.165 x 34.98 / 38.35. Area: 847.3m2.
Modern, architecturally designed, two storey rendered brick dwelling with concrete slab foundation and reinforced concrete roof. Accommodation generally consists of 4 bedrooms, 4 bathrooms and 4 car garage. Other areas include front balconies and side/rear balcony. Overall, superior build quality with decorative ceilings. Extensive use of Italian marble and mosaic tiling throughout. Master bedroom with spa. Guest suite/wing. Internal gym and steam room. Heated in-ground pool and additional roof top (in-ground/in-roof) plunge pool/spa. Manicured gardens. Extensive paved areas including front entry to residence and rear courtyard. GBA: 420m2 (approx.), excluding garage 70m2 (approx.), front balconies 30m2 (approx.) and side/rear balcony 32m2 (approx.). After allowing for size, location, date, topography etc. shows $1,680,000 (equates to $4,000/m2) for this type of improvement and $423,000 for existing garage, in-ground pool, rooftop plunge pool/spa, front balconies, side/rear balcony, driveways, paths, landscaping and fencing - Total: $2,103,000.

Hurstville Final Report __________________________________________________________________________________________________________________
_______________________________________________________________________________ Southern Alliance Valuation Services Pty Ltd – Hurstville Final Report – BD 1 July 2015 Page 28 of 49
5.0 ADDED VALUE OF IMPROVEMENTS (Cont.)
Vacant Site sale at 24 Vivian Street, Bexley. Sold 20 September 2014 for $1,110,000. Dimensions: 15.24 x 43.74 / 43.89. Area: 676.6m2.
Paired with:-
53 Bruce Street, Bexley. Sold 20 September 2014 for $1,280,000. Dimensions: 15.24 x 42.44. Area: 646.79m2.
Circa 1920, single storey, brick dwelling with concrete slab foundation and tiled roof. Accommodation generally consists of 3 bedrooms, 1 bathroom and a SLUG (under the main roof). Property also has a front verandah and a rear covered deck. Overall, good-very good condition with renovated kitchen and bathroom. GBA: 140m2 (approx.), excluding garage 18m2 (approx.), front verandah 10m2 (approx.) & rear deck 22m2 (approx.). After allowing for size, location, date, topography etc. shows $175,000 (equates to $1,250/m2) for this type of improvement and $24,900 for existing garage, front verandah, rear deck, driveways, paths, landscaping and fencing - Total: $199,900.
Vacant Site sale at 40 Ada St, Bexley.
Sold 29 September 2014 for $1,000,000. Dimensions: 13.56 x 39.62. Area: 537.25m2.
Paired with:-
4 Moore Street, Bexley. Sold 19 January 2015 for $1,520,000. Dimensions: 12.19 x 46.76 / 46.63. Area: 569m2.
Circa 2000’s, double storey, brick dwelling with concrete slab foundation and tiled roof. Accommodation generally consists of 5 bedrooms, 3 bathrooms and a DLUG (under the main roof). Property also has an outbuilding (detached living area) adjacent to the in-ground pool and a rear entertainment area adjoining the house. Overall, in good-very good condition with a recently renovated kitchen. GBA: 250m2 (approx.), excluding garage 32m2 (approx.), rear outbuilding 40m2 (approx.) & rear entertaining area 25m2 (approx.). After allowing for size, location, date, topography etc. shows $400,000 (equates to $1,600/m2) for this type of improvement and $91,000 for existing garage, outbuilding, in-ground pool, rear entertaining area, driveways, paths, landscaping and fencing - Total: $491,000. Or paired with:- 132 Croydon Road, Bexley. Sold 6 January 2015 for $1,100,000. Dimensions: 14.15 x 40.23. Area: 569.25m2.
Circa 1920’s, single storey, rendered brick dwelling with brick perimeter wall foundation and tiled roof. Accommodation generally consists of 3 bedrooms, 2 bathrooms and a detached DLUG with storage space / workshop. Property also has a front verandah and a rear covered deck. Overall, appears to be in good condition and externally renovated. GBA: 140m2 (approx.), excluding garage/workshop 46m2 (approx.), front verandah 9m2 (approx.) & rear deck 14m2 (approx.). After allowing for size, location, date, topography etc. shows $168,000 (equates to $1,200/m2) for this type of improvement and $38,000 for existing garage, front verandah, rear deck, driveways, paths, landscaping and fencing - Total: $206,000.

Hurstville Final Report __________________________________________________________________________________________________________________
_______________________________________________________________________________ Southern Alliance Valuation Services Pty Ltd – Hurstville Final Report – BD 1 July 2015 Page 29 of 49
5.0 ADDED VALUE OF IMPROVEMENTS (Cont.)
5.2 Commercial / Retail / Industrial:
Due to the lack of sufficient vacant land sales in the St George area for the above zone categories, the Replacement Cost approach was applied when analysing sales evidence. The Replacement Cost approach is based upon the principle that the informed purchaser would pay no more than the cost to reproduce the sale property. Hence the methodology used on analysis is as follows: Replacement Cost Methodology: Reasonable allowance for refurbishment costs added to the sale price to bring the
improvements to an as new replacement standard where the returns would be equivalent to as new.
An appropriate entrepreneurial profit and risk allowance. On average between 10% – 15% in the St George valuation area.
Allowance for interest on funds during the hypothetical construct to completion period. This is inclusive of holding charges and construction costs. Depending on borrowings from 6% up to 8.5% was applied.
The adjusted sale price can now be analysed for land content by using industry accepted cost estimates for the as new building and development expenses. As a general summary, the cost new applied in the St George districts were as follows: Single storey retail shop $900 to $1,400 m2 gross building area Two storey retail shop with office above $1,200 to $1,600 m2 gross building area Two storey retail shop with residential above $1,500 to $2,000 m2 gross building area Industrial (depending on construction type) $650 to $800 m2 gross building area
The residual amount following this exercise will show the adjusted land value at the base date.
Other costs accounted for are: All professional fees Costs of site works in preparation for building Cost of stamp duty and legal charges on purchase of site
Costs of rates and taxes over development period
Loss of interest on capital outlaid on purchase of site Loss of interest on capital outlaid on construction (av. 50% of dev. period). Legal costs and commission on sale for development sites. Critical to the analysis is that the added value only is to be captured and taken from the Sale Price to show the Residual Land Value.

Hurstville Final Report __________________________________________________________________________________________________________________
_______________________________________________________________________________ Southern Alliance Valuation Services Pty Ltd – Hurstville Final Report – BD 1 July 2015 Page 30 of 49
6.0 CHANGES TO COMPONENTS ILLUSTRATED BY CHANGES TO THE EXISTING VALUE RELATIONSHIPS.
From the analysed sales evidence available at the commencement and during the programme, the amount of variation applied to the value of properties within each zone & component is as follows:
6.1 Value Levels - Typical Properties
Typical Single Dwelling Site – Kimberley Rd, Hurstville Dimensions : 12.19m x 42.67m Site Area : 520.15m2 BD 07/14 Land Value : $754,000 Factor Update : 1.233 BD 07/15 Land Value : $930,000 Typical Single Dwelling Site – Myall St, Oatley Dimensions : 13.41m x 36.88m Site Area : 494.56m2 BD 07/14 Land Value : $661,000 Factor Update : 1.180 BD 07/15 Land Value : $780,000 Typical Single Dwelling Site – Highland Rd, Peakhurst Dimensions : 14.94m x 37.19m Site Area : 499.5m2 BD 07/14 Land Value : $555,000 Factor Update : 1.249 BD 07/15 Land Value : $693,000 Typical Waterfront Property – Marine Dr, Oatley Dimensions : 12.19m / HWM x 93.88m / 94.87m Site Area : 1,144m2 BD 07/14 Land Value : $1,080,000 Factor Update : 1.194 BD 07/15 Land Value : $1,290,000

Hurstville Final Report __________________________________________________________________________________________________________________
_______________________________________________________________________________ Southern Alliance Valuation Services Pty Ltd – Hurstville Final Report – BD 1 July 2015 Page 31 of 49
6.0 CHANGES TO COMPONENTS ILLUSTRATED BY CHANGES TO THE EXISTING VALUE RELATIONSHIPS (Cont.)
Typical Home Unit Site (3 storey walk-up) – Oxford St, Mortdale Dimensions : 30.18m x 35.79m Site Area : 1,081 m2 Development : 12 x 2 bedroom units (90.08m2) BD 07/14 Land Value : $1,820,000 ($151,667 per site) Factor Update : 1.258 BD 07/15 Land Value : $2,290,000 ($190,833 per site)
Typical Villa Home/Townhouse Site (single & 2 storey) – Wattle St, Peakhurst Dimensions : 19.51m / 19.74m x 63.83m / 65.79m Site Area : 1,258 m2 Development : 4 Villas (312.5 m2) BD 07/14 Land Value : $1,240,000 ($310,000 per site) Factor Update : 1.250 BD 07/15 Land Value : $1,550,000 ($387,500 per site)
Typical Retail Property – Forest Rd, Hurstville Dimensions : 6.07 / 6.12 x 42.29 / 42.57m Site Area : 259.3 m2 BD 07/14 Land Value : $1,740,000 Rate per metre frontage: $286,656 / $6,710 m2 Factor Update : 1.046 BD 07/15 Land Value : $1,820,000 Rate per metre frontage: $299,835 / $7019 m2
Typical Commercial Property – Woodville St, Hurstville
Dimensions : 43.395m / 41.115m x 42.13m / 49.135m Site Area : 1,821m2 Floor Space Ratio : 4.5:1 BD 07/14 Land Value : $5,860,000 Factor Update : 1.188 BD 07/15 Land Value : $6,960,000 Rate per square metre : $3,822 (site area) or $849 (FSR) Typical Industrial Site – Stanley St, Peakhurst Dimensions : 30m x 83.82m Site Area : 2,554m2 BD 07/14 Land Value : $1,200,000 Rate per square metre : $470 Factor Update : 1.067 BD 07/15 Land Value : $1,280,000 Rate per square metre : $501

Hurstville Final Report __________________________________________________________________________________________________________________
_______________________________________________________________________________ Southern Alliance Valuation Services Pty Ltd – Hurstville Final Report – BD 1 July 2015 Page 32 of 49
6.0 CHANGES TO COMPONENTS ILLUSTRATED BY CHANGES TO THE EXISTING VALUE RELATIONSHIPS (Cont.) 6.2 Value Totals
District 140 - Hurstville LGA BD 14 & 15 LV Totals at 29 October 2014
Zone & / or Category
Total of 2014 LV's as at 29 October
2015
Total of 2015 LV's as at 29 October
2015
2014-2015 Factor
Variation
% of Cat. to Total District Value 2014
% of Cat. to Total District Value 2015
The below figures exclude the November Supplementary Import
Single Dwelling Sites
$11,178,726,070 $13,863,351,910 1.240 73.88% 74.53%
Medium Density Sites
$1,104,637,000 $1,382,016,000 1.251 7.30% 7.43%
High Density Sites
$1,053,368,000 $1,322,556,000 1.256 6.96% 7.11%
Business $1,114,969,020 $1,279,563,840 1.148 7.37% 6.88%
Industrial $368,530,790 $402,364,220 1.092 2.44% 2.16%
Open Space $58,950,880 $66,957,870 1.136 0.39% 0.36%
Special Uses $170,076,270 $195,384,630 1.149 1.12% 1.05%
Recreational Waterways
$1,500 $1,500 1.000 0.00% 0.00%
Unzoned Deferred Matters
$82,099,000 $87,740,000 1.069 0.54% 0.47%
Total LV $15,131,358,530 $18,599,935,970 1.229

Hurstville Final Report __________________________________________________________________________________________________________________
_______________________________________________________________________________ Southern Alliance Valuation Services Pty Ltd – Hurstville Final Report – BD 1 July 2015 Page 33 of 49
6.0 CHANGES TO COMPONENTS ILLUSTRATED BY CHANGES TO THE EXISTING VALUE RELATIONSHIPS (Cont.) 6.3 Component Movement Graphs
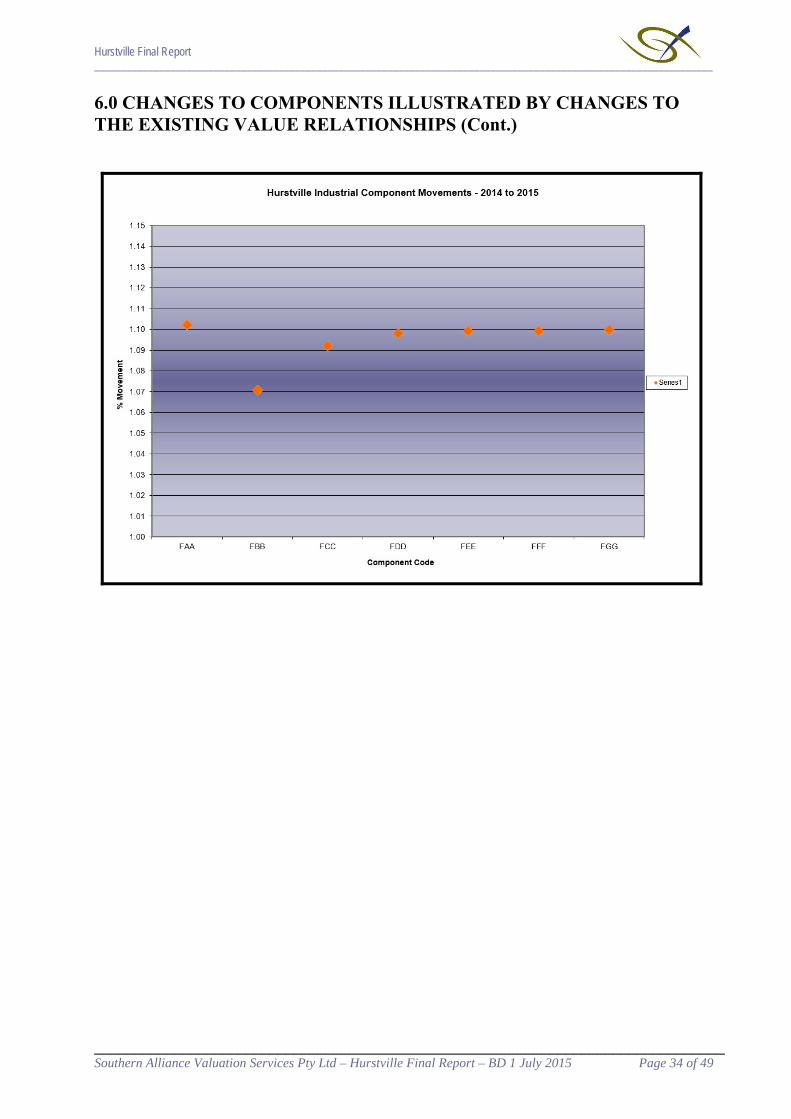
Hurstville Final Report __________________________________________________________________________________________________________________
_______________________________________________________________________________ Southern Alliance Valuation Services Pty Ltd – Hurstville Final Report – BD 1 July 2015 Page 34 of 49
6.0 CHANGES TO COMPONENTS ILLUSTRATED BY CHANGES TO THE EXISTING VALUE RELATIONSHIPS (Cont.)

Hurstville Final Report __________________________________________________________________________________________________________________
_______________________________________________________________________________ Southern Alliance Valuation Services Pty Ltd – Hurstville Final Report – BD 1 July 2015 Page 35 of 49
7.0 MARKET COMMENTARY:
7.1 Residential Overall, the residential market within the Hurstville LGA exhibited signs of strong positive growth over the 12 months ending 30 June 2015. As a whole, components zoned ‘R2 – Low Density Residential’ and ‘R3 – Medium Density Residential’ recorded growth of 24% and 27% respectively. On average, residential land components, depending on locality and development potential, moved within a band of 18.1% and 36% between the Base Date 1 July 2014 and 1 July 2015. Some single residential component areas in the ‘R2’ zone that had shown considerable growth over the 2015 valuing year are:
Component Suburb(s) XAA (30.2%) XBB (33.4%)
Beverly Hills Kingsgrove
High growth component/s: attributable to the demographic of the market seeking close proximity to railway station/s and commercial hubs. Additionally, the demographic of the market seeking close proximity to the suburb of Hurstville. The prospective property purchaser may have been priced out of the suburb of Hurstville.
XNN (36%)
Riverwood (north of the East Hills railway line)
High growth component. There is a small sample of sales evidence for this component and, as at date of report, there are no known town planning amendments which would assist in explaining the sharp increase in values. However, the locale’s proximity to Riverwood’s town centre, railway station and the M5 junction at Belmore Road may appeal to some demographics of the marketplace.
Other residential component areas which showed substantial growth over the 2015 valuing year include:
Component Suburb(s) TCC (33.3%)
Narwee, Penshurst & Mortdale (Potential Dual Occupancy Sites)
High growth component: partly attributable to the increase demand for housing and the demographic of the market seeking more affordable housing outside of, however within close proximity of, the suburb of Hurstville.
SRH (30.5%) Hurstville High growth component/s – small / single residential siteswithin the ‘R3’ zone: attributable to the locale of R3 zones, in regards to distance to amenities and public transport, coupled with the development upside of future amalgamation to form a medium density residential (villa / townhouse) development site.
SRM (27%) Mortdale / Penshurst
SRN (29.9%) Narwee / Beverly Hills
SRR (34%) Riverwood
Density sites within the ‘R2’ and ‘R3’ zone showed good growth with all components moving within a band of 24.2% - 26.2% over the 2015 valuation year. Density sites continue to be in demand as developers seek quality assets which can meet the market demand for residential property while providing more affordable housing options.

Hurstville Final Report __________________________________________________________________________________________________________________
_______________________________________________________________________________ Southern Alliance Valuation Services Pty Ltd – Hurstville Final Report – BD 1 July 2015 Page 36 of 49
7.0 MARKET COMMENTARY (Cont.) Factors which are considered to be contributing to the current residential market conditions are:
A Low Cash Rate (in historic terms), as at: o 1 Jul 2014 2.5% o 4 Feb 2015 2.25% (decrease of 25 basis points) o 6 May 2015 2.00% (decrease of 25 basis points) o 1 Jul 2015 2.00%
High capital growth in Sydney Dwelling Values – CoreLogic / RP Data Home Value Index notes Sydney residential property values are 16.2% higher over the year ending 30 June 2015 –which is larger in growth than the combined capital cities which recorded 9.8% over the same period.
Having regard to Sydney’s low rental growth of 2.5% over the 12 months ending 30 June 2015 in comparison to growth in dwelling values over the same period – consequently, Sydney residential yields have compressed 0.2% and 0.6% over the quarter and year ending 30 June 2015 respectively. Thus, gross rental yields are 3.2% and 4.2% respectively for Sydney houses and units. (Source – CoreLogic / RP Data).
Sydney maintaining a low/strong residential rental vacancy rate – 1.8% for June 2015, which is marginally lower than the 1.9% and 2% recorded for June 2014 & June 2013 respectively. (Source – SQM Research).
Selling time/duration for Sydney residential dwellings decreasing by 1 day and 6 days respectively over the quarter and year ending 30 June 2015 (Source – CoreLogic / RP Data).
Sydney residential dwelling vendor discounting increasing by 0.7 and 1.1 percentage points respectively over the quarter and year ending 30 June 2015. (Source – CoreLogic / RP Data).
Increases in Sydney residential property listings whilst the national listing numbers decreased – Sydney listing numbers rising 7.6% over the month of September 2015 and rising 11.1% over the 12 months ending 30 September 2015 compared to the national listing numbers decreasing 0.1% over the 12 months ending 30 September 2015. (Source – SQM Research)
Sydney’s auction clearance rates peaking at 89% on two weekends in May 2015 and one weekend in June 2015. This compares to clearance rates in Sydney in the low 70 per cent range for June 2014. Sydney’s auction clearance rates have reduced since peaking in May / June 2015 – recording a clearance rate of 65% on Saturday 17 October 2015. (Source – Australian Property Monitors).
All four big banks increasing investor variable interest rates between 0.27 and 0.29 percentage points over the two weeks ending 4 August 2015. Increases attributable to the banks’ response to Australian Prudential Regulation Authority’s (APRAs) demand that housing investor loan growth has to slow to less than 10 per cent a year (Source – Sydney Morning Herald & ABC).
APRA announced in July 2015 an increase in capital requirements for Australian residential mortgage exposures under the Internal Ratings-Based (IRB) Approach. The average risk weight of residential mortgage exposures using the IRB approach will increase to at least 25 per cent by mid-2016, from an average of around 17 per cent at the end of June 2015. (Source – RBA: Financial Stability Review ‘Box C’).
Having regard to the above, from 14 October 2015 to 23 October 2015, all big four banks increased their variable interest rates on residential owner-occupier and investor home loans between 15 and 20 basis points – with all four banks citing the decision was partly attributable to the requirement to increase the amount of capital applied to residential mortgages.
Hurstville Final Report __________________________________________________________________________________________________________________
_______________________________________________________________________________ Southern Alliance Valuation Services Pty Ltd – Hurstville Final Report – BD 1 July 2015 Page 37 of 49
7.0 MARKET COMMENTARY (Cont.)
Increase in housing credit growth from 4.6% (2013) to 6.4% (2014) and to 7.3% (2015) – 12 month growth for years ending 30 June. (Source – RBA: Financial Aggregates).
All Groups CPI increasing 1.5% over the 12 months ending 30 June 2015 (Source – Australian Bureau of Statistics).
Australian GDP (chain volume measure) grew by 2.0% (seasonally adjusted) over the 12 months ending 30 June 2015 (Source – Australian Bureau of Statistics).
Australian Real GDP forecast to expand by 2.4% in 2015/16 and 3.1% in 2016/17. (Source – NAB, Global & Australian Forecasts – October 2015)
The Australian unemployment rate is at 6.2% in September 2015 (seasonally adjusted). (Source – Australian Bureau of Statistics).
Australian unemployment rate forecast to decrease slightly to 6% by end 2015/16 and to 5.75% by end 2016/17. (Source – NAB, Global & Australian Forecasts – October 2015)
National annual population growth of 1.4% (as at 31 March 2015), down from 1.7% (as at 31 March 2014) and down from the previous peak of 1.8% recorded over 2012. (Source – Australian Bureau of Statistics).
Wage Price Index (total hourly rates of pay excluding bonuses) recording a +2.3% annual change over the 12 months ending 30 June 2015 – down from +2.6% annual change over the 12 months ending 30 June 2014. (Source – Australian Bureau of Statistics).
Declining Australian Dollar (AUD vs. USD) – falling from $0.94 as at June 2014 to $0.77 as at June 2015 (approx.).
Please note: It is important to point out land value assessed at 1 July 2015 takes into account market conditions at that point in time and the further impact of factors such as interest rate increases/decreases, national and global economies, unemployment etc. can only be assessed by monitoring future market transactions.

Hurstville Final Report __________________________________________________________________________________________________________________
_______________________________________________________________________________ Southern Alliance Valuation Services Pty Ltd – Hurstville Final Report – BD 1 July 2015 Page 38 of 49
7.0 MARKET COMMENTARY (Cont.)
7.1.2Sale and Resales within Hurstville LGA (2014/15) * Excludes related party resales and resales which have been redeveloped
173 Croydon Road, Hurstville Sold 15 March 2014 - $1,060,000 Shows an increase of 5.66%, which equates to an
approximate increase of 0.44% per month. Resold 21 April 2015 - $1,120,000 *Appears to have resold in similar condition
49A Douglas Haig Street, Oatley Sold 7 February 2014 - $1,342,000 Shows an increase of 18.41%, which equates to an
approximate increase of 1.15% per month. Resold 9 May 2015 - $1,589,000 *Assumed to have resold in similar condition
2A Edmund Street, Beverly Hills Sold 10 February 2015 - $950,000 Shows an increase of 18.42%, which equates to an
approximate increase of 3.68% per month. Resold 18 July 2015 - $1,125,000 *Assumed to have resold in similar condition
22 Fleming Street, Beverly Hills Sold 24 January 2014 - $1,050,000 Shows an increase of 24.76%, which equates to an
approximate increase of 1.38% per month. Resold 4 July 2015 - $1,310,000 *Appears to have sold slightly updated – new carpet and paint throughout certain areas
41 Jacques Avenue, Peakhurst Sold 15 April 2014 - $900,000 Shows an increase of 50%, which equates to an
approximate increase of 3.57% per month. Resold 5 June 2015 - $1,350,000 *Appears to have resold in similar condition
5 Raymond Street, Oatley Sold 30 May 2014 - $1,215,000 Shows an increase of 15.23%, which equates to an
approximate increase of 1.09% per month. Resold 22 July 2015 - $1,400,000 *Appears to have resold in similar condition
193 Stoney Creek Road, Beverly HillsSold 29 March 2014 - $640,000 Shows an increase of 25%, which equates to an
approximate increase of 3.57% per month. Resold 1 November 2014 - $800,000 *Assumed to have resold in similar condition

Hurstville Final Report __________________________________________________________________________________________________________________
_______________________________________________________________________________ Southern Alliance Valuation Services Pty Ltd – Hurstville Final Report – BD 1 July 2015 Page 39 of 49
7.0 MARKET COMMENTARY (Cont.)
193 Stoney Creek Road, Beverly HillsSold 1 November 2014 - $800,000 Shows an increase of 18.78%, which equates to an
approximate increase of 2.68% per month. Resold 5 June 2015 - $950,288 *Assumed to have resold in similar condition
75 Webb Street, Riverwood Sold 8 March 2014 - $620,000 Shows an increase of 43.55%, which equates to an
approximate increase of 2.56% per month. Resold 1 August 2015 - $890,000 *Appears to have resold with a slightly updated interior (new paint), some landscape works and a newly painted driveway.
250 Gloucester Road, Hurstville Sold 31 May 2014 - $1,015,000 Shows an increase of 28.09%, which equates to an
approximate increase of 2.55% per month. Resold 30 April 2015 - $1,300,000 *Appears to have resold in similar condition
158 Gloucester Road, Hurstville Sold 7 February 2015 - $984,000 Shows an increase of 20.73%, which equates to an
approximate increase of 5.18% per month. Resold 4 June 2015 - $1,188,000 *Appears to have resold with a renovated kitchen and bathroom
4A Berkeley Street, Peakhurst HeightsSold 29 April 2014 - $770,000 Shows an increase of 15.58%, which equates to an
approximate increase of 1.42% per month. Resold 12 March 2015 $890,000 *Assumed to have resold in similar condition

Hurstville Final Report __________________________________________________________________________________________________________________
_______________________________________________________________________________ Southern Alliance Valuation Services Pty Ltd – Hurstville Final Report – BD 1 July 2015 Page 40 of 49
7.0 MARKET COMMENTARY (Cont.)
7.1.3 Change in Median Values
The most recent results from the Department of Housing Sales Tables (March Quarter 15 – Non-Strata) available at time of reporting indicate the following:
Location Median Value Change in Median (Qtly) Change in Median (Annual) Hurstville (LGA)
$1,073,000 4.9% 12.9%
Greater Sydney
$752,000 -7.7% 10.6%
Please note a variety of factors can contribute to anomalies in the sale price and the end statistical data. The above information is viewed as a reference only for reporting purposes.
7.1.4 Building Approvals
Residential building approval statistics are used in both the public and private sectors as a leading indicator of the general level of economic activity, employment and investment.
Residential building approvals are compiled from permits issued by: local government authorities and other principal certifying authorities; contracts let or day labour work authorised by Commonwealth, state, semi-government and local government authorities, and; major building approvals in areas not subject to normal administrative approval e.g. building on remote mine sites.
A dwelling (or residential building) is defined as: A residential building is a building consisting of one or more dwelling units. Residential buildings can be either houses or other residential buildings.
An other residential building is a building other than a house primarily used for long-term residential purposes. An other residential building contains more than one dwelling unit. Other residential buildings are coded to the following categories: semi-detached, row or terrace house or townhouse with one storey; semi-detached, row or terrace house or townhouse with two or more storeys; flat, unit or apartment in a building of one or two storeys; flat, unit or apartment in a building of three storeys; flat, unit or apartment in a building of four or more storeys; flat, unit or apartment attached to a house; other/number of storeys unknown. The latter two categories are included with the semi-detached, row or terrace house or townhouse.
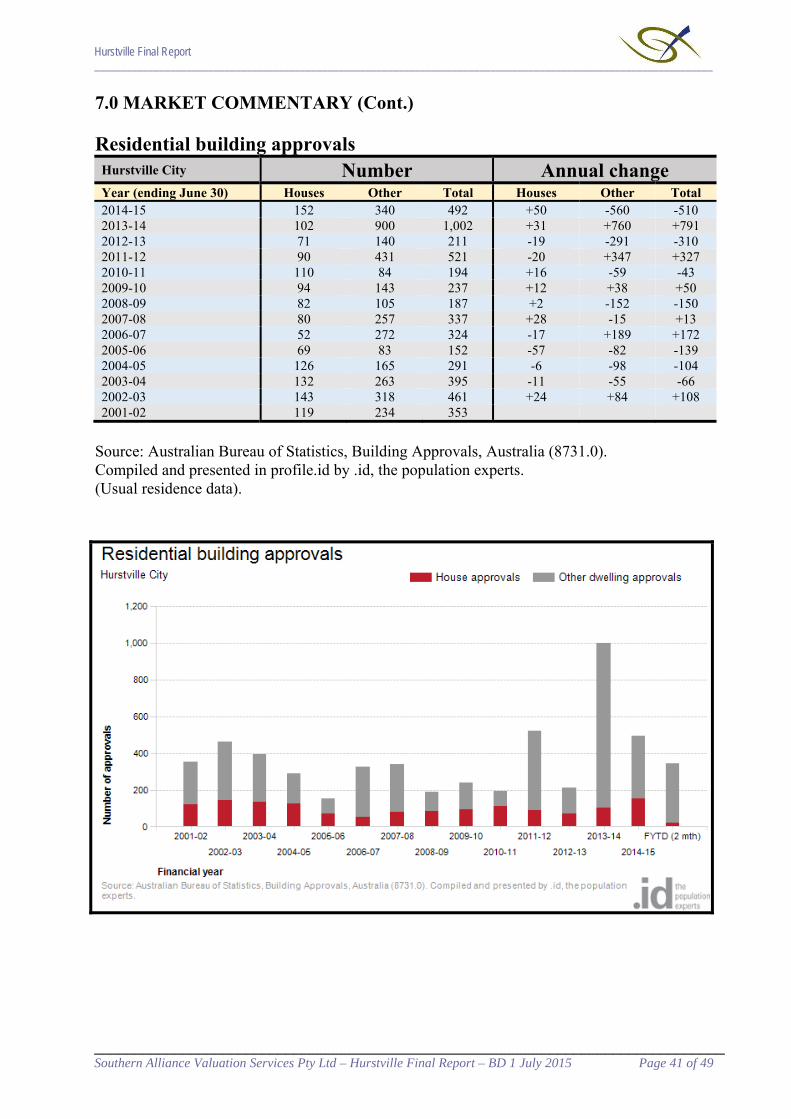
Hurstville Final Report __________________________________________________________________________________________________________________
_______________________________________________________________________________ Southern Alliance Valuation Services Pty Ltd – Hurstville Final Report – BD 1 July 2015 Page 41 of 49
7.0 MARKET COMMENTARY (Cont.)
Residential building approvals
Hurstville City Number Annual change Year (ending June 30) Houses Other Total Houses Other Total 2014-15 152 340 492 +50 -560 -510 2013-14 102 900 1,002 +31 +760 +791 2012-13 71 140 211 -19 -291 -310 2011-12 90 431 521 -20 +347 +327 2010-11 110 84 194 +16 -59 -43 2009-10 94 143 237 +12 +38 +50 2008-09 82 105 187 +2 -152 -150 2007-08 80 257 337 +28 -15 +13 2006-07 52 272 324 -17 +189 +172 2005-06 69 83 152 -57 -82 -139 2004-05 126 165 291 -6 -98 -104 2003-04 132 263 395 -11 -55 -66 2002-03 143 318 461 +24 +84 +108 2001-02 119 234 353
Source: Australian Bureau of Statistics, Building Approvals, Australia (8731.0). Compiled and presented in profile.id by .id, the population experts. (Usual residence data).

Hurstville Final Report __________________________________________________________________________________________________________________
_______________________________________________________________________________ Southern Alliance Valuation Services Pty Ltd – Hurstville Final Report – BD 1 July 2015 Page 42 of 49
7.0 MARKET COMMENTARY (Cont.)
7.2 Commercial / Retail As a whole, from 1 July 2014 to 1 July 2015, commercial and retail property markets within the Hurstville LGA recorded mixed levels of growth. Overall, zones ‘B1 – Neighbourhood Centre’, ‘B2 – Local Centre’, ‘B3 – Commercial Core’ and ‘B4 – Mixed Use’ recorded growth of 23%, 12%, 2.6% and 23.4% respectively. Individual components within each business zone show varying levels of growth for numerous reasons including, but not limited to, location, development potential and access to infrastructure / public transport – however, as a whole, business zoned components generally moved within a band of 0% - 38.9% over the 2015 valuation year. Density / development sites continued to perform well over the 2015 valuation year. Generally, residential development continues to outprice commercial development as the highest and best use and as such, sites with residential development potential remain in high demand across the Hurstville LGA. Components ‘BWB – high rise / mixed development sites B1’, ‘BWW – high rise / mixed development sites B2’ and ‘HDS – high rise / mixed development sites B4’ exhibited growth of 21.2%, 19.8% and 14% respectively over the 2015 valuing year. Expanding on the above, the introduction of the ‘B3 – Commercial Core’ zoning within the Hurstville City Centre does not permit the incorporation of residential uses within any future development for those properties zoned ‘B3’. Subsequently component ‘HCS – Major Centre Office Developments Hurstville’ recorded nil growth over the 2015 valuation year, highlighting the subdued demand for office space / office sites within the Hurstville City Centre. Some retail components comprise pockets of retail land throughout the LGA of Hurstville which may move non-homogenously over time. For example, strong growth was exhibited by component ‘BNC – Neighbourhood Centre Retail’ in the ‘B1’ zone, moving at 38.9% over the 2015 valuation year. It should be noted however, the 38.9% growth exhibited by component BNC was centralised along a retail strip at Oatley, whereas, the majority of the component moved at approximately 10% from base date 1 July 2014 to base date 1 July 2015 – the 10% growth generally more in-line with the retail component ‘BLC (9.1%)’ in zone ‘B2’. Different pockets of retail properties can move against the trend for a varying number of reasons, including but not limited to, location to public transport, proximity to infrastructure, surrounding amenity, demand for surrounding residential property, increases / decreases in surrounding residential property values and increases / decreases in density & population of the surrounding locale. Growth in retail spending (and ultimately retail asset values) is being supported by various factors. For example, increases in household net worth, driven by the uplift in residential dwelling values, are resulting in providing support for discretionary retail spending and retail spending on household goods. Additionally, a low Australian dollar and low interest rates are providing some overall support to retail properties and retail land values. Colliers International report that Neighbourhood Retail properties for the first half of 2015 illustrate a prime yield range from 6.50% up to 7.75% and a secondary yield range from 8.00% up to 10.00%. Additionally, Colliers International report that Sub-Regional shopping centres’ for the first half of 2015 exhibit a prime yield range from 6.50% up to 7.50% and a secondary yield range from 7.50% up to 9.50%.

Hurstville Final Report __________________________________________________________________________________________________________________
_______________________________________________________________________________ Southern Alliance Valuation Services Pty Ltd – Hurstville Final Report – BD 1 July 2015 Page 43 of 49
7.0 MARKET COMMENTARY (Cont.)
7.3 Industrial
Overall, the industrial market within Hurstville LGA showed signs of positive growth with the ‘IN2 – Light Industrial’ zone recording 9.2% growth over the 12 months ending 30 June 2015. Five (5) out of seven (7) industrial components moved within a band of 9.4% - 10.2% over the 2015 valuation year, with the remaining two (2) industrial components recording growth of 7.2% and 17% over the same period. Certain components can move against the trend for a varying number of reasons, however overall the industrial market for the Hurstville LGA was fairly consistent. Southern Sydney’s industrial property market has experienced increasing demand from property developers acquiring quality industrial sites zoned to be redeveloped from industrial uses to high-rise residential and mixed use developments. As a result of the above, the current industrial supply is decreasing, proving to be a catalyst for driving competition in the industrial sector. Although the majority of the industrial redevelopment demand in Southern Sydney is around the suburbs of Botany, Mascot, Wolli Creek and the like, the reduction in stock creates a lack of supply for the current industrial market for the aforementioned suburbs, thus, potentially driving demand for industrial properties further south/south west to established industrial precincts within the St George and surrounding area. Colliers International report as a result of high density residential demand and a shortage of industrial sites within Southern Sydney, the average prime industrial yields in the area have compressed to their lowest levels since June 2008, being 6.38% as at September 2015.

Hurstville Final Report __________________________________________________________________________________________________________________
_______________________________________________________________________________ Southern Alliance Valuation Services Pty Ltd – Hurstville Final Report – BD 1 July 2015 Page 44 of 49
8.0 MANAGEMENT OF COMPONENTS, VERIFICATION & HANDCRAFTING
Southern Alliance Valuation Services Pty Ltd undertook a restructure for all of the existing Component Codes within the Hurstville Local Government Area for the Base Date 1 July 2013. This was due to the introduction of a new LEP. All entries are now correctly aligned with HLEP 2012.
8.1 Verification
As part of Southern Alliance Valuation Services contract with Land & Property Information and the Valuer General, a certain percentage of properties within the Hurstville LGA is to be verified annually to ensure correctness of values. High risk properties require annual verification, moderate risk properties are to be verified every 3 years, and low risk properties every 6 years. This provides for more frequent review of individual land values and Components for the more complex and contentious valuation.
The components that have been targeted/completed for verification within the Hurstville LGA during 2014/15 are as follows:
Residential Component(s): AHE (19), CAA (477), MXX (87), WFF (351), XGG (1108) Commercial Component(s): HCS (15), HDS (98) Industrial Component(s): FAA (147), FBB (102), FCC (42), FDD (12), FEE (7), FFF (15), FGG (43) Other Component(s): PPI (2), RDD (5), SJL (1)
A full list of individually verified land values, including the numbers and percentages of properties verified in each risk rating and the Components reviewed is annexed to this report (and can also be found in the Hurstville 2015 VAR).

Hurstville Final Report __________________________________________________________________________________________________________________
_______________________________________________________________________________ Southern Alliance Valuation Services Pty Ltd – Hurstville Final Report – BD 1 July 2015 Page 45 of 49
9.0 QUALITY ASSURANCE
In accordance with Southern Alliance Valuation Services own internal QA manual and the Office of the Valuer General guidelines, the following quality checks have been made in the delivery of services:
Ensuring all properties have been valued. Ensuring the valuations are within the set parameters. That a zone/component code integrity check has been made. An in depth value check on those properties that have considerably higher values in relation
to the average for land. Ensure that current and proposed Development Control Plans and planning changes that
affect the valuations have been taken into account. Where the land value of a property has been amended on objection, the alignment of values
with nearby properties has been checked. That all Statutory concession valuations and allowances have been supplied, including –
o Allowances for development on and off the land. o Heritage Values. o Land Rating Factors. o Apportionment of Values. o Mixed Development Apportionment Factors.
The following statistical checks have been carried out for residential zoned properties.
9.1 Coefficient of Dispersion (COD)
This measures the relative consistency and, when viewed with the other measures, the relative accuracy of values in relation to the sales. It shows the amount of variation or the consistency of the values and also the relative accuracy of the values as the relationship between values and sales widens.
The accepted measure for the COD is 0 – 15.
9.2 Mean Value to Price Ratio (MVP)
This calculates the mean relative accuracy, or level of values, relative to the sales. It shows the mean level of accuracy of the values assigned compared to the sales evidence. The MVP is to be calculated only in single dwelling residential categories, including rural home site areas.
The accepted measure for the MVP is 85-100%.
9.3 Price Related Differential (PRD)
This test measures the progressive value to sale relativity across the range of values in the sample. It demonstrates the variations of relativity between the sales and the assigned values and indicates if there is a progressive change in relativity across the value range.
The accepted measure for the PRD is 0.98 – 1.03.

Hurstville Final Report __________________________________________________________________________________________________________________
_______________________________________________________________________________ Southern Alliance Valuation Services Pty Ltd – Hurstville Final Report – BD 1 July 2015 Page 46 of 49
9.0 QUALITY ASSURANCE (Cont.)
Please find below an overview of the statistical analysis (as exhibited in the Land & Property Information – Mass Valuation Statistical Check Report):
District: 140 – Hurstville Base Date 01 July 2015
Zone Description No. of
Entries COD MVP PRD COAVC
B1 Neighbourhood
Centre 119 1.91 95.24% 1.00 6.75
B2 Local Centre 472 4.56 92.24% 1.00 0.54 B3 Commercial Core 95 3.19 93.17% 1.00 0.28 B4 Mixed Use 182 8.85 89.57% 1.00 32.55 IN2 Light Industrial 368 2.57 96.91% 0.99 2.26
R2 Low Density Residential
18,702 4.44 91.68% 1.00 5.77
R3 Medium Density
Residential 1,078 3.36 94.84% 1.00 3.92
RE1 Public Recreation 226 RE2 Private Recreation 2 SP2 Infrastructure 145
W2 Recreational Waterways
1
Z UNZONED DEFFERED MATTER
16
9.4 Subsequent Valuations upon Objection / Reascertainment
Southern Alliance Valuation Services’ internal valuation system identifies any property which has been subject to an objection. Upon identification, the selected valuer will review the objection, confirm the new land value (if appropriate) and review and alter (if needed) the surrounding land values that may have been affected due to the change in land value for the property subject to objection. An overview of all properties within the Hurstville LGA subject to an objection, and subsequent actions taken, are listed within the 2015 VAR.

Hurstville Final Report __________________________________________________________________________________________________________________
_______________________________________________________________________________ Southern Alliance Valuation Services Pty Ltd – Hurstville Final Report – BD 1 July 2015 Page 47 of 49
10.0 CONCLUSION
10.1 Purpose of this Report The purpose of this report is to describe the process and considerations for the 1 July 2015 Valuation of Hurstville Local Government Area. The report has been produced on behalf of the Valuer General. The land values have been specifically made for rating and taxing purposes. Land values produced as part of this process should not be used for any other purpose without the specific agreement of the Valuer General. Land values must have regard to specific requirements and assumptions in rating and taxing legislation. Consequently these valuations may vary from market levels. The land values have been determined using a methodology prescribed by the Rating and Taxing Valuation Procedures Manual. The Manual allows mass valuation methodologies that involve assessing large numbers of properties as a group to be utilised where appropriate. Mass valuations, however are utilised worldwide for rating and taxing purposes to deliver valuations within an acceptable market range. Town planning, land use and other market information contained in this report has been compiled base on enquires undertaken during the valuation process. Third parties should make their own inquiries into these details and should not rely on the contents of this report. The Valuer General disclaims any liability to any person who acts or omits to act on the basis of the information contained in this report. More information on the valuation process is available from the Land and Property Information website at www.lpi.nsw.gov.au/valuation.
10.2 Signatory
Murray Edmondson St.George Area Manager Southern Alliance Valuation Services Pty Ltd
Hurstville Final Report __________________________________________________________________________________________________________________
_______________________________________________________________________________ Southern Alliance Valuation Services Pty Ltd – Hurstville Final Report – BD 1 July 2015 Page 48 of 49
REPORT ANNEXURES

Hurstville Final Report __________________________________________________________________________________________________________________
_______________________________________________________________________________ Southern Alliance Valuation Services Pty Ltd – Hurstville Final Report – BD 1 July 2015 Page 49 of 49
VERIFICATION ANNEXURE(S)
“A full list of individually verified land values, including the numbers and percentages of properties verified in each risk rating and the Components reviewed is annexed to this report (and can also be found in the Hurstville 2015 VAR).”

Zone
Section 6.1.3 (t) (iii) Verification by Component - 15 October 2014 - 15 October 2015Component Code: Total No.
Verified:
No. Records: Verified by Risk Rating
1 2 3 District: 140-Hurstville
B1 Neighbourhood Centre BNC 27NEIGHBOURHOOD CENTRE RETAI 111 7 10424.3% 6.3% 93.7%
B1 Neighbourhood Centre BWB 3HIGH RISE/MIXED DEVELOPMENT 8 3 537.5% 37.5% 62.5%
B2 Local Centre BLC 192LOCAL CENTRE RETAIL 430 21 40944.7% 4.9% 95.1%
B2 Local Centre BWW 7HIGH RISE/MIXED DEVELOPMENT 42 5 3716.7% 11.9% 88.1%
B3 Commercial Core HCS 15MAJOR CENTRE OFFICE DEVELOP 15 11 4 Component Reviewed100.0% 73.3% 26.7%
B3 Commercial Core HRS 9HURSTVILLE RETAIL/NARROW SIT 80 8 57 1511.3% 10.0% 71.3% 18.8%
B4 Mixed Use HDS 98HIGH RISE/MIXED DEVELOPMENT 99 16 8399.0% 16.2% 83.8%
B4 Mixed Use HNS 15B4 HURSTVILLE RETAIL NARROW 84 7 7717.9% 8.3% 91.7%
IN2 Light Industrial FAA 147PEAKHURST-SITES UP TO 1000 M2 147 14 133 Component Reviewed100.0% 9.5% 90.5%
IN2 Light Industrial FBB 102PEAKHURST-SITES 1000 to 3500 M2 102 5 97 Component Reviewed100.0% 4.9% 95.1%
IN2 Light Industrial FCC 42PEAKHURST-SITES 3500 to 2 HA 42 4 38 Component Reviewed100.0% 9.5% 90.5%
IN2 Light Industrial FDD 12KINGSGROVE-SITES UP TO 1000 M2 12 3 9 Component Reviewed100.0% 25.0% 75.0%
IN2 Light Industrial FEE 7KINGSGROVE-SITES 1000 TO 3500 M 7 3 4 Component Reviewed100.0% 42.9% 57.1%
IN2 Light Industrial FFF 15KINGSGROVE-SITES 3500 M2 AND A 15 7 8 Component Reviewed100.0% 46.7% 53.3%
IN2 Light Industrial FGG 43BEVERLY HILLS / HURSTVILLE / PE 43 6 37 Component Reviewed100.0% 14.0% 86.0%
7/10/2015 Section 6.1.3 (t)(iii) - Page: 392_

Zone
Section 6.1.3 (t) (iii) Verification by Component - 15 October 2014 - 15 October 2015Component Code: Total No.
Verified:
No. Records: Verified by Risk Rating
1 2 3 District: 140-Hurstville
R2 Low Density Residential AHE 19HIGH DENSITY SITES R2 19 3 16 Component Reviewed100.0% 15.8% 84.2%
R2 Low Density Residential AVE 20MEDIUM DENSITY SITES R2 758 14 37 7072.6% 1.8% 4.9% 93.3%
R2 Low Density Residential CAA 477POTENTIAL DUAL OCC SITES-HURS 477 9 9 459 Component Reviewed100.0% 1.9% 1.9% 96.2%
R2 Low Density Residential LGG 24RESIDENTIAL - LUGARNO 1768 14 2 17521.4% 0.8% 0.1% 99.1%
R2 Low Density Residential MRR 17MAIN ROADS 782 8 5 7692.2% 1.0% 0.6% 98.3%
R2 Low Density Residential MXX 87MISCELLANEOUS 93 5 2 8693.5% 5.4% 2.2% 92.5%
R2 Low Density Residential TCC 10POTENTIAL DUAL OCC SITES-NAR 549 10 2 5371.8% 1.8% 0.4% 97.8%
R2 Low Density Residential TDD 8POTENTIAL DUAL OCC SITES-RIVE 389 8 3812.1% 2.1% 97.9%
R2 Low Density Residential WFF 351RESIDENTIAL WATERFRONTS 351 7 134 210 Component Reviewed100.0% 2.0% 38.2% 59.8%
R2 Low Density Residential XAA 11RESIDENTIAL - BEVERLY HILLS 646 9 6371.7% 1.4% 98.6%
R2 Low Density Residential XBB 13RESIDENTIAL - KINGSGROVE 1275 12 12631.0% 0.9% 99.1%
R2 Low Density Residential XCC 39RESIDENTIAL - HURSTVILLE 2967 27 36 29041.3% 0.9% 1.2% 97.9%
R2 Low Density Residential XEE 14RESIDENTIAL - PENSHURST 698 10 8 6802.0% 1.4% 1.1% 97.4%
R2 Low Density Residential XFF 23RESIDENTIAL - BEVERLY HILLS/NA 1759 15 2 17421.3% 0.9% 0.1% 99.0%
R2 Low Density Residential XGG 1108RESIDENTIAL - MORTDALE/PEAKH 1108 16 3 1089 Component Reviewed100.0% 1.4% 0.3% 98.3%
7/10/2015 Section 6.1.3 (t)(iii) - Page: 393_

Zone
Section 6.1.3 (t) (iii) Verification by Component - 15 October 2014 - 15 October 2015Component Code: Total No.
Verified:
No. Records: Verified by Risk Rating
1 2 3 District: 140-Hurstville
R2 Low Density Residential XHH 18RESIDENTIAL - OATLEY 1538 14 4 15201.2% 0.9% 0.3% 98.8%
R2 Low Density Residential XJJ 15RESIDENTIAL - MORTDALE 508 9 5 4943.0% 1.8% 1.0% 97.2%
R2 Low Density Residential XKK 16RESIDENTIAL - PEAKHURST / PEAK 1328 11 1 13161.2% 0.8% 0.1% 99.1%
R2 Low Density Residential XLL 7RESIDENTIAL - PEAKHURST (WEST 313 5 1 3072.2% 1.6% 0.3% 98.1%
R2 Low Density Residential XMM 14RESIDENTIAL - RIVERWOOD/PEAK 1116 8 3 11051.3% 0.7% 0.3% 99.0%
R2 Low Density Residential XNN 4RESIDENTIAL - (NORTH OF EAST HI 260 2 2581.5% 0.8% 99.2%
R3 Medium Density Residential AHH 13DENSITY (HOME UNIT & FLAT) SIT 613 7 22 5842.1% 1.1% 3.6% 95.3%
R3 Medium Density Residential AVV 2MEDIUM DENSITY (VILLA & TH) SI 14 2 1 1114.3% 14.3% 7.1% 78.6%
R3 Medium Density Residential SRH 3SMALL LOTS / SINGLE RES HURSTV 49 3 5 416.1% 6.1% 10.2% 83.7%
R3 Medium Density Residential SRM 5SMALL LOTS / SINGLE RES MORTD 85 5 1 795.9% 5.9% 1.2% 92.9%
R3 Medium Density Residential SRN 4SMALL LOTS / SINGLE RES NARWE 45 4 1 408.9% 8.9% 2.2% 88.9%
R3 Medium Density Residential SRR 20SMALL LOTS / SINGLE RES RIVERW 272 16 1 2557.4% 5.9% 0.4% 93.8%
RE1 Public Recreation PPP 5PARKS 226 4 3 2192.2% 1.8% 1.3% 96.9%
RE2 Private Recreation PPI 2PRIVATE RECREATION 2 2 Component Reviewed100.0% 100.0%
SP2 Infrastructure RDD 5RESERVED ROAD 5 3 2 Component Reviewed100.0% 60.0% 40.0%
7/10/2015 Section 6.1.3 (t)(iii) - Page: 394_

Zone
Section 6.1.3 (t) (iii) Verification by Component - 15 October 2014 - 15 October 2015Component Code: Total No.
Verified:
No. Records: Verified by Risk Rating
1 2 3 District: 140-Hurstville
SP2 Infrastructure ZBB 5SPECIAL USES - BUSINESS 18 3 10 527.8% 16.7% 55.6% 27.8%
SP2 Infrastructure ZFF 4SPECIAL USES - INDUSTRIAL 8 3 1 450.0% 37.5% 12.5% 50.0%
SP2 Infrastructure ZSS 7MISCELLANEOUS - SPECIAL USES 114 6 5 1036.1% 5.3% 4.4% 90.4%
W2 Recreational Waterways SJL 1RECREATIONAL WATERWAYS 1 1 Component Reviewed100.0% 100.0%
Z UNZONED DEFERRED MATTER
DMM 13DEFERRED MATTER 16 8 881.3% 50.0% 50.0%
Total Verified 311821407
7/10/2015 Section 6.1.3 (t)(iii) - Page: 395_

Zone 2011 2012 2013 2014 2015
Section 6.1.3 (t) (iv) Verification by Zone - 15 October 2014 - 15 October 2015
B1 Neighbourhood Centre 1 84 30
B2 Local Centre 3 251 198
B3 Commercial Core 2 62 7 24
B4 Mixed Use 5 13 49 2 113
IN2 Light Industrial 368
R2 Low Density Residential 4055 1839 3801 4914 2294
R3 Medium Density Residential 45 7 8 56 47
RE1 Public Recreation 2 188 3 26 5
RE2 Private Recreation 2
SP2 Infrastructure 110 3 4 21
W2 Recreational Waterways 1
Z UNZONED DEFERRED MATTER
1 2 13
4217Total Verified 2051 3931 5344 3116
7/10/2015 Section 6.1.3 (t)(iv) - Page: 396_