14 chapter iii research methodology 3.1 research...
TRANSCRIPT

31
14 CHAPTER III
RESEARCH METHODOLOGY
3.1 Research Method
According to Sugiyono (2009, p. 9), there are three kinds of research methods based
on natural settings object level, they are: experimental research, survey, and
naturalistic. The experimental research method is very unnatural because it is done in
a laboratory where the condition is controlled so that it is free from external influences.
Survey research methods are conducted in public places, which is naturalistic (not
artificial), but researchers conduct treatment when collecting data such as surveys and
interviews. While naturalistic research method is done in a natural place and without
any treatment from researchers for collecting data.
Sugiyono (2009, p. 11) further argued that the naturalistic method is qualitative
while experimental and survey methods are quantitative. Quantitative research is
research used to examine a population or a particular sample with data collection is
generally done randomly, using research instruments for data collection, as well as
statistical data analysis for testing the research’s hypothesis (Sugiyono, 2009, p. 12).
The object of this research is the consumers Bank Syariah Mandiri in Bandung. This
research is conducted in a public place and use the questionnaire as the tool to collect
data. The data then processed using Structural Equation Modeling, a multivariate
statistical analysis. Therefore the method in this research is surveys and it is
quantitative.
32
However, this study also uses the qualitative method, namely literature study for
collecting data. According to Sugiyono (2009, p. 422), a result of a research will be
more credible if the results are supported by data from documents that have high
credibility.
To achieve convincing results, this study collects data from documents that are still
related to research variables by using literature study techniques. These documents
include company reports, reports from survey agencies, and reports from state
institutions, books, and international journals.
3.2 Operational Variable
According to Sugiyono (2009, pp. 59–61), there are five kinds of variables in a
study, namely independent, dependent, moderator, control, and intervening.
Sugiyono (2009, p. 59) stated that the independent variable is a variable that
influences or causes change on the dependent variable. In SEM independent variable
is referred to as an exogenous variable. There are two independent variables in this
research which are Religiosity (X1) and Corporate Reputation (X2).
Sugiyono (2009, p. 59) added, the dependent variable is a variable that is influenced,
or it is a result of the existence of an independent variable. In SEM dependent variable
is referred to as endogenous variable. In this research Consumer Loyalty (Y) is the
dependent variable.
33
The following is the independent variables and a dependent variable of this research
along with its indicators:
1. Religiosity as the independent variable (X1), with an indicator as follow:
Intrapersonal Religiosity (X1.1)
2. Corporate reputation as the independent variable (X2), with indicators as
follow:
Emotional Appeal (X2.1)
Products and Services (X2.2)
Social Responsibility (X2.3)
3. Consumer loyalty as the dependent variable (Y), with indicators as follows:
Cognitive Loyalty (Y.1)
Affective Loyalty (Y.2)
Conative Loyalty (Y.3)
Action Loyalty (Y.4)
Based on the theoretical framework of this study, the operationalization variable
of this study can be made as follow:
34
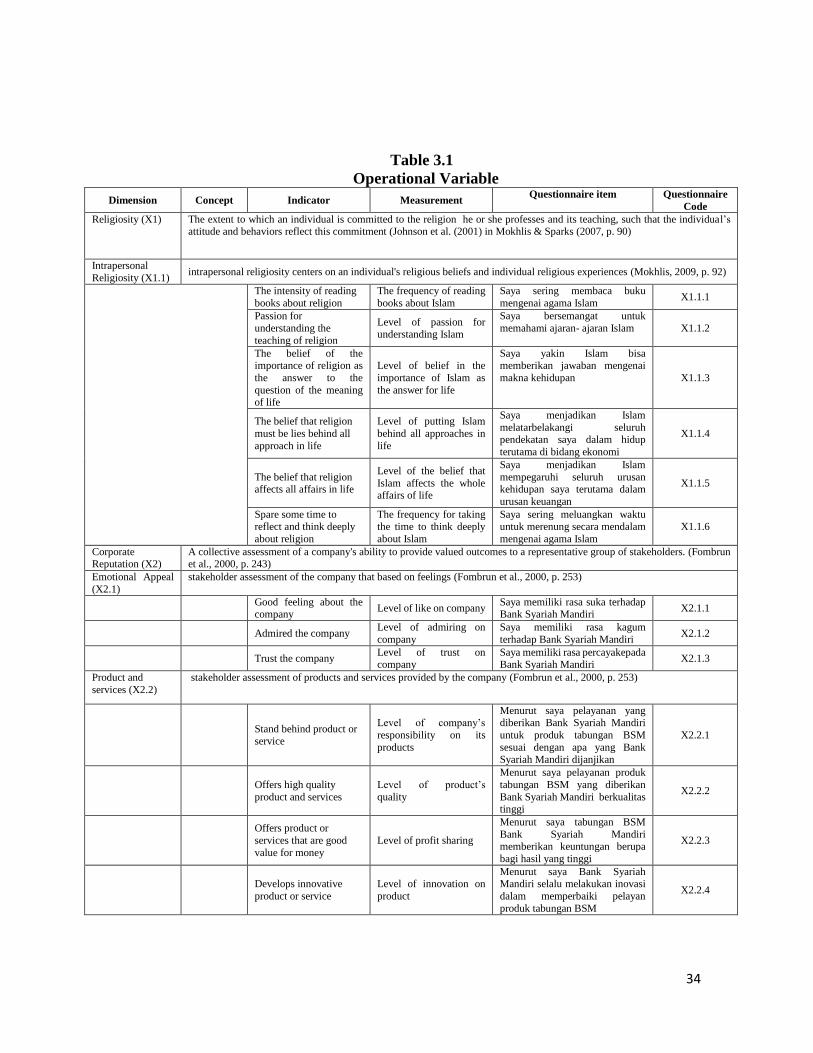
Table 3.17
Operational Variable
Dimension Concept Indicator Measurement Questionnaire item Questionnaire
Code
Religiosity (X1)
The extent to which an individual is committed to the religion he or she professes and its teaching, such that the individual’s attitude and behaviors reflect this commitment (Johnson et al. (2001) in Mokhlis & Sparks (2007, p. 90)
Intrapersonal
Religiosity (X1.1) intrapersonal religiosity centers on an individual's religious beliefs and individual religious experiences (Mokhlis, 2009, p. 92)
The intensity of reading
books about religion
The frequency of reading
books about Islam
Saya sering membaca buku
mengenai agama Islam X1.1.1
Passion for
understanding the
teaching of religion
Level of passion for understanding Islam
Saya bersemangat untuk
memahami ajaran- ajaran Islam X1.1.2
The belief of the importance of religion as
the answer to the
question of the meaning of life
Level of belief in the
importance of Islam as
the answer for life
Saya yakin Islam bisa memberikan jawaban mengenai
makna kehidupan X1.1.3
The belief that religion
must be lies behind all
approach in life
Level of putting Islam
behind all approaches in
life
Saya menjadikan Islam
melatarbelakangi seluruh pendekatan saya dalam hidup
terutama di bidang ekonomi
X1.1.4
The belief that religion affects all affairs in life
Level of the belief that
Islam affects the whole affairs of life
Saya menjadikan Islam
mempegaruhi seluruh urusan kehidupan saya terutama dalam
urusan keuangan
X1.1.5
Spare some time to
reflect and think deeply
about religion
The frequency for taking
the time to think deeply
about Islam
Saya sering meluangkan waktu
untuk merenung secara mendalam
mengenai agama Islam
X1.1.6
Corporate Reputation (X2)
A collective assessment of a company's ability to provide valued outcomes to a representative group of stakeholders. (Fombrun et al., 2000, p. 243)
Emotional Appeal
(X2.1)
stakeholder assessment of the company that based on feelings (Fombrun et al., 2000, p. 253)
Good feeling about the company
Level of like on company Saya memiliki rasa suka terhadap Bank Syariah Mandiri
X2.1.1
Admired the company Level of admiring on
company
Saya memiliki rasa kagum
terhadap Bank Syariah Mandiri X2.1.2
Trust the company Level of trust on company
Saya memiliki rasa percayakepada Bank Syariah Mandiri
X2.1.3
Product and
services (X2.2)
stakeholder assessment of products and services provided by the company (Fombrun et al., 2000, p. 253)
Stand behind product or
service
Level of company’s
responsibility on its
products
Menurut saya pelayanan yang diberikan Bank Syariah Mandiri
untuk produk tabungan BSM
sesuai dengan apa yang Bank Syariah Mandiri dijanjikan
X2.2.1
Offers high quality
product and services
Level of product’s
quality
Menurut saya pelayanan produk
tabungan BSM yang diberikan
Bank Syariah Mandiri berkualitas tinggi
X2.2.2
Offers product or
services that are good
value for money
Level of profit sharing
Menurut saya tabungan BSM
Bank Syariah Mandiri memberikan keuntungan berupa
bagi hasil yang tinggi
X2.2.3
Develops innovative
product or service
Level of innovation on
product
Menurut saya Bank Syariah Mandiri selalu melakukan inovasi
dalam memperbaiki pelayan
produk tabungan BSM
X2.2.4
35
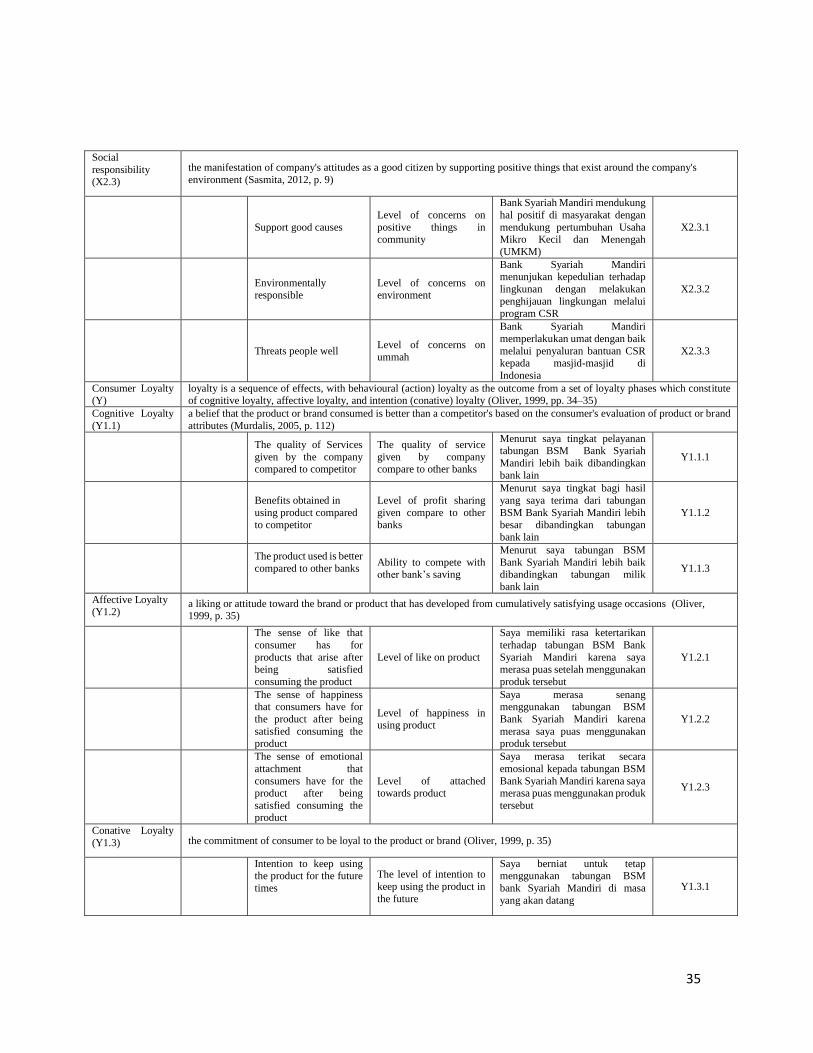
Social
responsibility (X2.3)
the manifestation of company's attitudes as a good citizen by supporting positive things that exist around the company's
environment (Sasmita, 2012, p. 9)
Support good causes
Level of concerns on
positive things in community
Bank Syariah Mandiri mendukung
hal positif di masyarakat dengan
mendukung pertumbuhan Usaha Mikro Kecil dan Menengah
(UMKM)
X2.3.1
Environmentally responsible
Level of concerns on environment
Bank Syariah Mandiri menunjukan kepedulian terhadap
lingkunan dengan melakukan
penghijauan lingkungan melalui
program CSR
X2.3.2
Threats people well Level of concerns on
ummah
Bank Syariah Mandiri
memperlakukan umat dengan baik
melalui penyaluran bantuan CSR kepada masjid-masjid di
Indonesia
X2.3.3
Consumer Loyalty (Y)
loyalty is a sequence of effects, with behavioural (action) loyalty as the outcome from a set of loyalty phases which constitute of cognitive loyalty, affective loyalty, and intention (conative) loyalty (Oliver, 1999, pp. 34–35)
Cognitive Loyalty
(Y1.1)
a belief that the product or brand consumed is better than a competitor's based on the consumer's evaluation of product or brand
attributes (Murdalis, 2005, p. 112)
The quality of Services
given by the company compared to competitor
The quality of service
given by company compare to other banks
Menurut saya tingkat pelayanan tabungan BSM Bank Syariah
Mandiri lebih baik dibandingkan
bank lain
Y1.1.1
Benefits obtained in
using product compared
to competitor
Level of profit sharing
given compare to other
banks
Menurut saya tingkat bagi hasil
yang saya terima dari tabungan
BSM Bank Syariah Mandiri lebih
besar dibandingkan tabungan
bank lain
Y1.1.2
The product used is better
compared to other banks
Ability to compete with other bank’s saving
Menurut saya tabungan BSM
Bank Syariah Mandiri lebih baik dibandingkan tabungan milik
bank lain
Y1.1.3
Affective Loyalty (Y1.2)
a liking or attitude toward the brand or product that has developed from cumulatively satisfying usage occasions (Oliver, 1999, p. 35)
The sense of like that
consumer has for
products that arise after being satisfied
consuming the product
Level of like on product
Saya memiliki rasa ketertarikan
terhadap tabungan BSM Bank
Syariah Mandiri karena saya merasa puas setelah menggunakan
produk tersebut
Y1.2.1
The sense of happiness that consumers have for
the product after being
satisfied consuming the product
Level of happiness in using product
Saya merasa senang menggunakan tabungan BSM
Bank Syariah Mandiri karena
merasa saya puas menggunakan produk tersebut
Y1.2.2
The sense of emotional
attachment that
consumers have for the product after being
satisfied consuming the product
Level of attached towards product
Saya merasa terikat secara
emosional kepada tabungan BSM
Bank Syariah Mandiri karena saya merasa puas menggunakan produk
tersebut
Y1.2.3
Conative Loyalty
(Y1.3) the commitment of consumer to be loyal to the product or brand (Oliver, 1999, p. 35)
Intention to keep using the product for the future
times
The level of intention to
keep using the product in
the future
Saya berniat untuk tetap menggunakan tabungan BSM
bank Syariah Mandiri di masa
yang akan datang
Y1.3.1
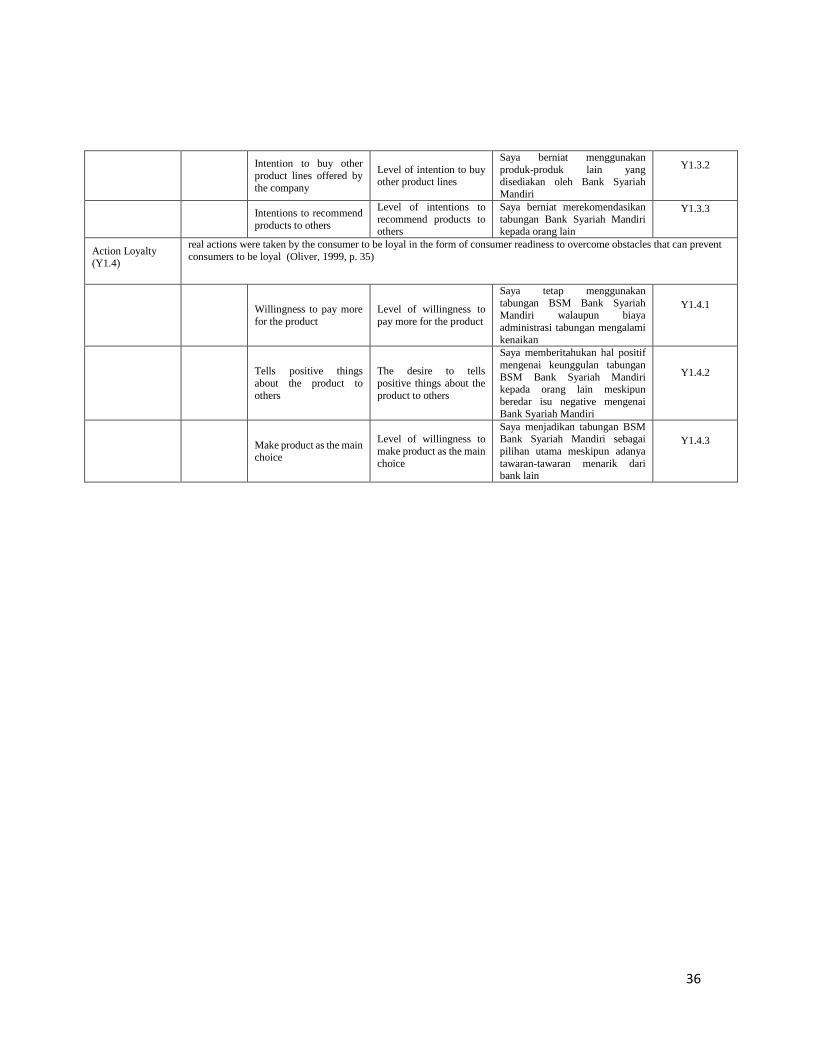
36
Intention to buy other
product lines offered by
the company
Level of intention to buy other product lines
Saya berniat menggunakan
produk-produk lain yang disediakan oleh Bank Syariah
Mandiri
Y1.3.2
Intentions to recommend
products to others
Level of intentions to
recommend products to others
Saya berniat merekomendasikan
tabungan Bank Syariah Mandiri kepada orang lain
Y1.3.3
Action Loyalty (Y1.4)
real actions were taken by the consumer to be loyal in the form of consumer readiness to overcome obstacles that can prevent
consumers to be loyal (Oliver, 1999, p. 35)
Willingness to pay more
for the product
Level of willingness to
pay more for the product
Saya tetap menggunakan
tabungan BSM Bank Syariah
Mandiri walaupun biaya
administrasi tabungan mengalami
kenaikan
Y1.4.1
Tells positive things
about the product to
others
The desire to tells
positive things about the
product to others
Saya memberitahukan hal positif
mengenai keunggulan tabungan
BSM Bank Syariah Mandiri kepada orang lain meskipun
beredar isu negative mengenai
Bank Syariah Mandiri
Y1.4.2
Make product as the main choice
Level of willingness to
make product as the main
choice
Saya menjadikan tabungan BSM Bank Syariah Mandiri sebagai
pilihan utama meskipun adanya
tawaran-tawaran menarik dari bank lain
Y1.4.3
37
3.3 Data Source, Determination, and Obtaining
3.3.1 Data Source
According to Sugiyono (2009, p. 137), based on its source, there are two
types of data, namely primary and secondary data. Primary data is data obtained
by collecting data directly from the data source. On the contrary, secondary data
is data obtained indirectly from data sources, but through other media such as
reports.
This study uses both primary and secondary data. The primary data in this
research obtained through questionnaires from consumers of Bank Syariah
Mandiri Bandung. While the secondary data in this study comes from literature
such as scientific journals and books, as well as reports on Islamic banking
published by government agencies, survey agencies, companies, and
consultants.
3.3.2 Data Determination
Population is a generalisation area that includes objects/subjects that have
a particular characteristic set by to be studied and then taken the conclusion.
Population includes not only the number of the population but also includes the
characteristics of the object/subject being studied (Sugiyono, 2009, p. 15). The
population of this research is the consumers of Bank Syariah Mandiri in
Bandung.
38
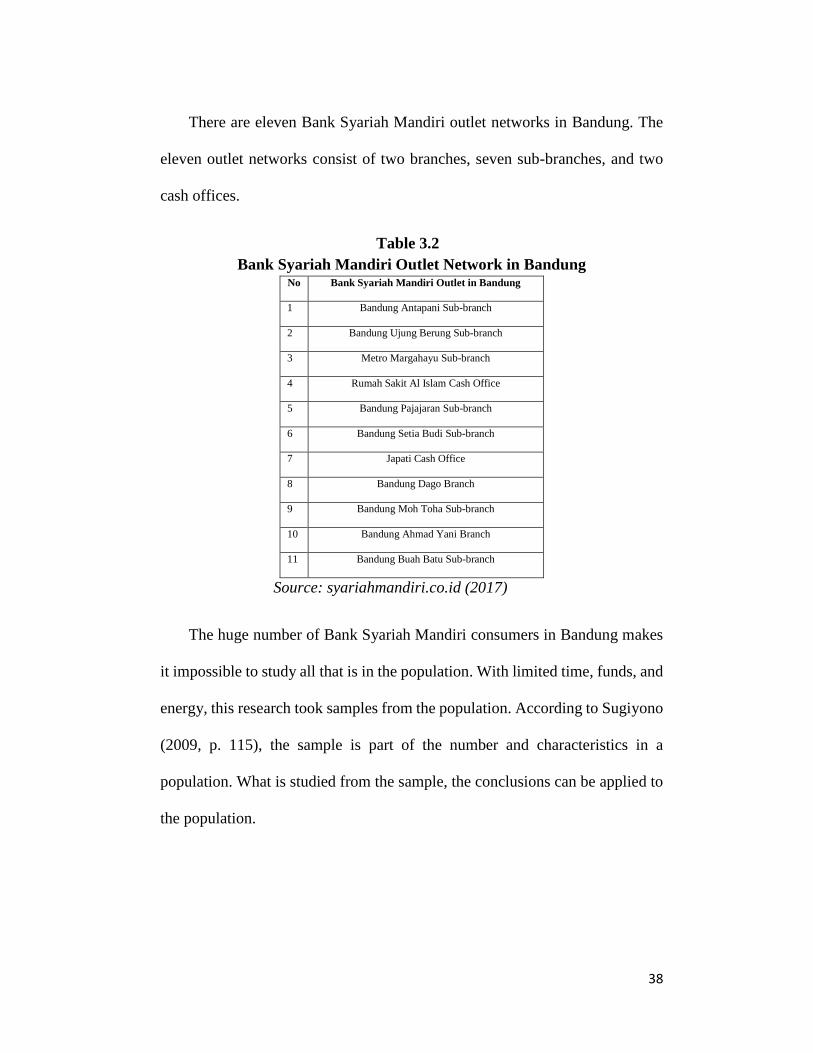
There are eleven Bank Syariah Mandiri outlet networks in Bandung. The
eleven outlet networks consist of two branches, seven sub-branches, and two
cash offices.
Table 3.28
Bank Syariah Mandiri Outlet Network in Bandung No Bank Syariah Mandiri Outlet in Bandung
1 Bandung Antapani Sub-branch
2 Bandung Ujung Berung Sub-branch
3 Metro Margahayu Sub-branch
4 Rumah Sakit Al Islam Cash Office
5 Bandung Pajajaran Sub-branch
6 Bandung Setia Budi Sub-branch
7 Japati Cash Office
8 Bandung Dago Branch
9 Bandung Moh Toha Sub-branch
10 Bandung Ahmad Yani Branch
11 Bandung Buah Batu Sub-branch
Source: syariahmandiri.co.id (2017)
The huge number of Bank Syariah Mandiri consumers in Bandung makes
it impossible to study all that is in the population. With limited time, funds, and
energy, this research took samples from the population. According to Sugiyono
(2009, p. 115), the sample is part of the number and characteristics in a
population. What is studied from the sample, the conclusions can be applied to
the population.

39
Hair et al., (2010, p. 47) stated that the number of samples needs to be taken
from research that uses multivariate analysis is at least five times the number of
parameters/indicators used in research. Based on this calculation, the minimal
number of respondents need to be taken for this study are:
n = numbers of indicators x 5
n = 28 x 5
n = 140
So a minimal number of sample needed in this study are as many as 140
respondents.
This study uses a proportional purposive sampling technique; this sampling
technique determines based on specific considerations (Sugiyono, 2009, p.
122). The considerations used in determining the sample of this research are:
1. Respondent is a Muslim
2. Respondent is domiciled in Bandung
3. Respondent uses BSM saving
The consideration of making BSM savings consumers as respondent is
because saving BSM is the product most in demand by consumers (Syariah
Mandiri 2016, p. 69). Therefore, it is expected that the data collection process
will be easier because there are many users of BSM savings. In addition, BSM
savings is the featured product of Bank Syariah Mandiri.
40
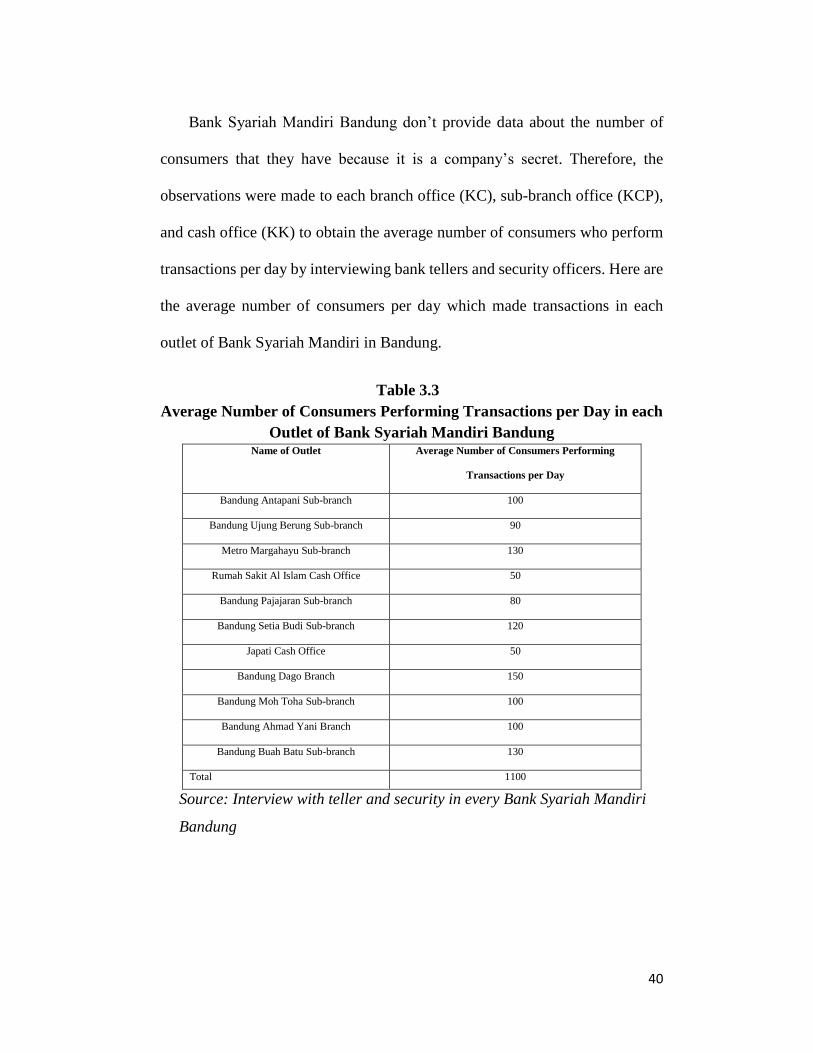
Bank Syariah Mandiri Bandung don’t provide data about the number of
consumers that they have because it is a company’s secret. Therefore, the
observations were made to each branch office (KC), sub-branch office (KCP),
and cash office (KK) to obtain the average number of consumers who perform
transactions per day by interviewing bank tellers and security officers. Here are
the average number of consumers per day which made transactions in each
outlet of Bank Syariah Mandiri in Bandung.
Table 3.39
Average Number of Consumers Performing Transactions per Day in each
Outlet of Bank Syariah Mandiri Bandung Name of Outlet Average Number of Consumers Performing
Transactions per Day
Bandung Antapani Sub-branch 100
Bandung Ujung Berung Sub-branch 90
Metro Margahayu Sub-branch 130
Rumah Sakit Al Islam Cash Office 50
Bandung Pajajaran Sub-branch 80
Bandung Setia Budi Sub-branch 120
Japati Cash Office 50
Bandung Dago Branch 150
Bandung Moh Toha Sub-branch 100
Bandung Ahmad Yani Branch 100
Bandung Buah Batu Sub-branch 130
Total 1100
Source: Interview with teller and security in every Bank Syariah Mandiri
Bandung

41
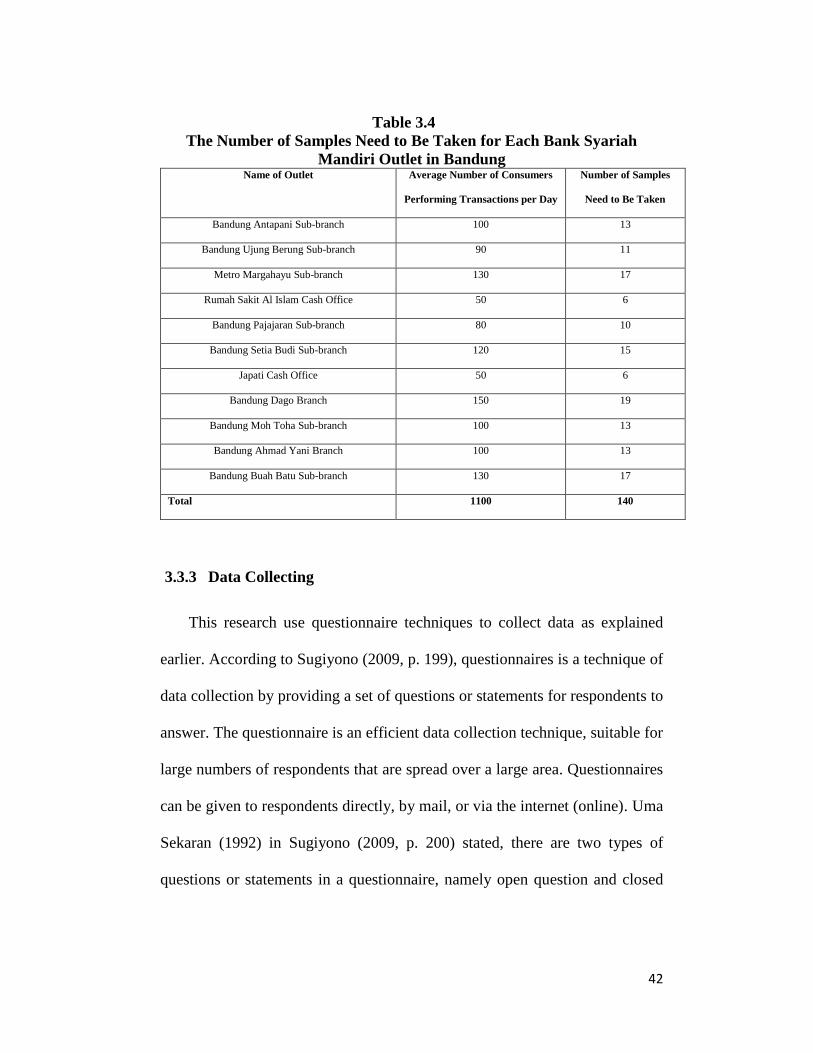
After knowing the population and the minimum number of samples need
to be taken, then it was necessary to determine the number of samples
proportionally for each outlet using purposive sampling formula (Sugiyono,
2009, p. 128).
𝑛𝑖 =𝑁𝑖
n𝑁
Explanation:
ni = the number of samples that need to be taken for a particular
outlet
Ni = the population in a particular outlet
n = Total population of every outlet
N = the number of samples that needed for the research
By using purposive sampling formula, here are the number of samples
needed for each outlet of Bank Syariah Mandiri in Bandung:
42
Table 3.410
The Number of Samples Need to Be Taken for Each Bank Syariah
Mandiri Outlet in Bandung Name of Outlet Average Number of Consumers
Performing Transactions per Day
Number of Samples
Need to Be Taken
Bandung Antapani Sub-branch 100 13
Bandung Ujung Berung Sub-branch 90 11
Metro Margahayu Sub-branch 130 17
Rumah Sakit Al Islam Cash Office 50 6
Bandung Pajajaran Sub-branch 80 10
Bandung Setia Budi Sub-branch 120 15
Japati Cash Office 50 6
Bandung Dago Branch 150 19
Bandung Moh Toha Sub-branch 100 13
Bandung Ahmad Yani Branch 100 13
Bandung Buah Batu Sub-branch 130 17
Total 1100 140
3.3.3 Data Collecting
This research use questionnaire techniques to collect data as explained
earlier. According to Sugiyono (2009, p. 199), questionnaires is a technique of
data collection by providing a set of questions or statements for respondents to
answer. The questionnaire is an efficient data collection technique, suitable for
large numbers of respondents that are spread over a large area. Questionnaires
can be given to respondents directly, by mail, or via the internet (online). Uma
Sekaran (1992) in Sugiyono (2009, p. 200) stated, there are two types of
questions or statements in a questionnaire, namely open question and closed
43
question. Open questions are questions that expect respondents to provide
answers in the form of a description. Meanwhile, closed questions are questions
that expect respondents to give a short answer or choose one alternative answer
to the question that available. The answer to a closed question can take the form
of ordinal data, nominal data, and interval data.
This research has the large sample size, which is 140 respondents, spread
to eleven outlet in Bandung. Therefore, the questionnaire is the suitable data
collection technique for this research. The questionnaire of this study was
distributed directly to the respondents in eleven Bank Syariah Mandiri outlets
in Bandung.
This research’s questionnaire is divided into two parts. The first part is the
questions about the respondent's personal information, such as sex, age,
occupation, and income. The second part is a set of questions to investigate the
influence of Religiosity and Corporate Reputation on Consumer Loyalty. The
answer to the statement on this part was measured using a Likert scale.
According to Sugiyono (2009, p. 132), the Likert scale is used for opinions,
attitudes, and perceptions of respondents about social phenomena. In this study
social phenomena has been explicitly defined by researchers in the form of
questionnaires based on research variables. The statements contained in the
second part of the research questionnaire are closed statement. Respondents
44
were only required to respond to the statement on the scale available based on
respondents' opinions, attitudes, and perceptions.
Sugiyono (2009, p. 202) stated, empirically it is suggested the ideal amount
of item of question or statement for a questionnaire are 20 to 30. This research
questionnaire has 28 statement, and hence it can be said this questionnaire is
ideal.
3.4 Validity and Reliability Test
3.4.1 Validity Test
Based on Sarjono & Julianita (2015, p. 35), the validity test is used to gauge
the ability of indicator (manifest) to measure the research dimension (latent). If
a measurement has a high degree of validity, it means the measurement can
measure what it should be measured, and vice versa (Sugiyono, 2009, p. 172).
High validity also means respondents can understand the questions or
statements in the questionnaire.
According to Malhotra (2010) in Rinaldi (2013), there are three types of
validity test :
1. Content Validity
Content validity is the extent measurement represents the dimension of
variables. It shows whether the items in the questionaires represents the
construct appropriately.
45
2. Cirterion Validity
It examines whether the measurement scale appears as expected in
relation to other variables, that chosen as research criteria.
3. Construct Validity
Construct validity examines the characteristic of the construct. It
measures based on the pattern of interrelationship between question
items in the construct. The items that measure the same construct should
have strong inter-correlations
This reseach uses content and construct validity. The content validity test
is done in this chapter, while contruct validity will be done in Chapter 4. This
study does not use criterion validity, because there are no specific measurement
criteria. According to Kane (2001) in Rinaldi (2013), the criteria validity is used
in a study if there was an appropriate criterion size.
Validity testing should be done on every item in a questionnaire. According
to Aaker et al., (2011) in Rinaldi (2013), content validity is done by using
Pearson product moment. This validity test in this reseach is done using SPSS
version 23. The criterias for an item of questionaire in order to be consider valid
are as follow:
1. If the value of rvalue is positive and rresult > rtable , the item in the questionaire
is considered to be valid
46
2. If the value of rvalue is negative and rvalue < rtable , the item in the questionaire
is considered to be not valid
The coeficcient of rtable is come from product moment table with α = 5%
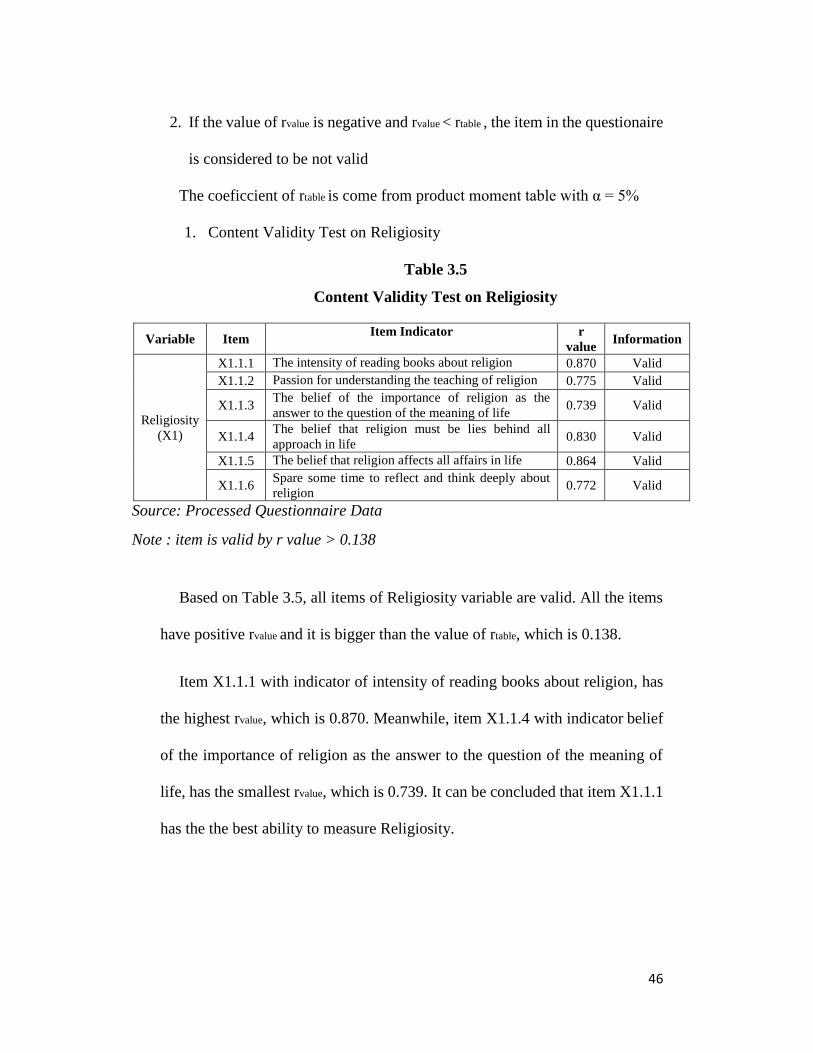
1. Content Validity Test on Religiosity
Table 3.5
Content Validity Test on Religiosity
Variable Item Item Indicator r
value Information
Religiosity
(X1)
X1.1.1 The intensity of reading books about religion 0.870 Valid
X1.1.2 Passion for understanding the teaching of religion 0.775 Valid
X1.1.3 The belief of the importance of religion as the
answer to the question of the meaning of life 0.739 Valid
X1.1.4 The belief that religion must be lies behind all
approach in life 0.830 Valid
X1.1.5 The belief that religion affects all affairs in life 0.864 Valid
X1.1.6 Spare some time to reflect and think deeply about
religion 0.772 Valid
Source: Processed Questionnaire Data
Note : item is valid by r value > 0.138
Based on Table 3.5, all items of Religiosity variable are valid. All the items
have positive rvalue and it is bigger than the value of rtable, which is 0.138.
Item X1.1.1 with indicator of intensity of reading books about religion, has
the highest rvalue, which is 0.870. Meanwhile, item X1.1.4 with indicator belief
of the importance of religion as the answer to the question of the meaning of
life, has the smallest rvalue, which is 0.739. It can be concluded that item X1.1.1
has the the best ability to measure Religiosity.
47
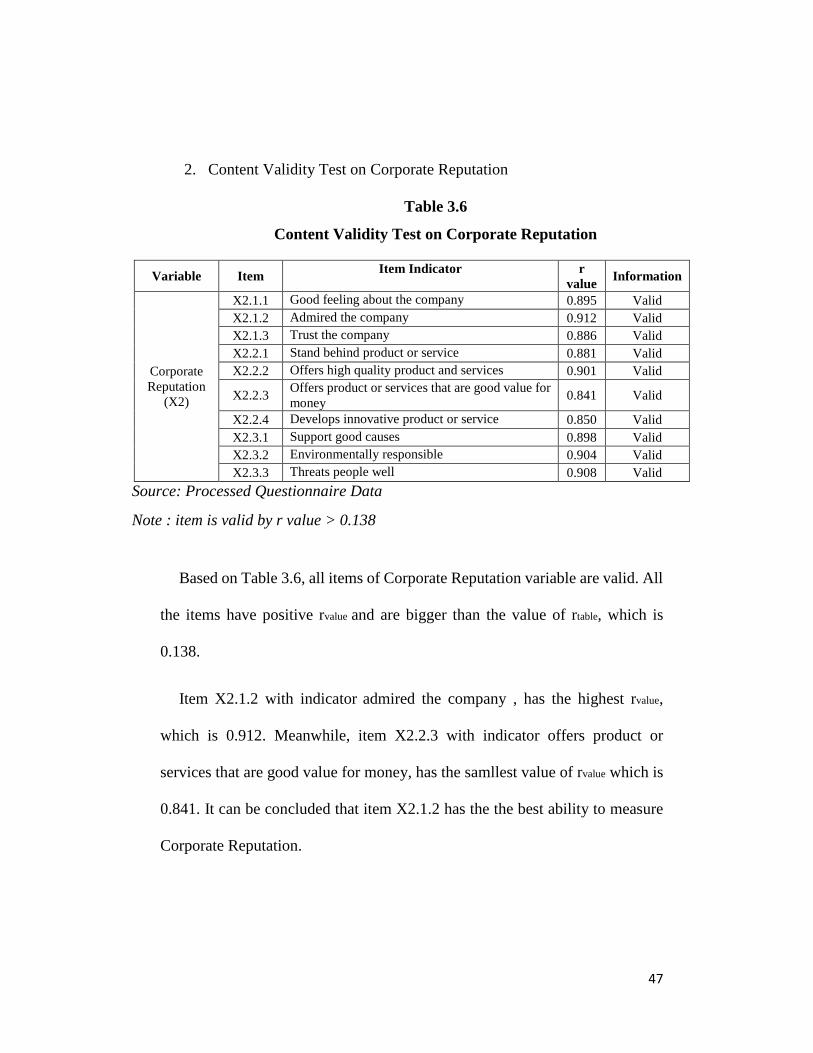
2. Content Validity Test on Corporate Reputation
Table 3.6
Content Validity Test on Corporate Reputation
Variable Item Item Indicator r
value Information
Corporate
Reputation
(X2)
X2.1.1 Good feeling about the company 0.895 Valid
X2.1.2 Admired the company 0.912 Valid
X2.1.3 Trust the company 0.886 Valid
X2.2.1 Stand behind product or service 0.881 Valid
X2.2.2 Offers high quality product and services 0.901 Valid
X2.2.3 Offers product or services that are good value for
money 0.841 Valid
X2.2.4 Develops innovative product or service 0.850 Valid
X2.3.1 Support good causes 0.898 Valid
X2.3.2 Environmentally responsible 0.904 Valid
X2.3.3 Threats people well 0.908 Valid
Source: Processed Questionnaire Data
Note : item is valid by r value > 0.138
Based on Table 3.6, all items of Corporate Reputation variable are valid. All
the items have positive rvalue and are bigger than the value of rtable, which is
0.138.
Item X2.1.2 with indicator admired the company , has the highest rvalue,
which is 0.912. Meanwhile, item X2.2.3 with indicator offers product or
services that are good value for money, has the samllest value of rvalue which is
0.841. It can be concluded that item X2.1.2 has the the best ability to measure
Corporate Reputation.

48
3. Content Validity Test on Consumer Loyalty
Table 3.7
Content Validity Test on Consumer Loyalty
Variablele Item Item Indicator R value Information
Consumer
Loyalty (Y)
Y1.1.1 The quality of Services given by the company
compared to competitor 0.870 Valid
Y1.1.2 Benefits obtained in using product compared to competitor
0.876 Valid
Y1.1.3 The product used is better compared to other banks
0.914 Valid
Y1.2.1 The sense of like that consumer has for products that arise after being satisfied consuming the product
0.918 Valid
Y1.2.2 The sense of happiness that consumers have for the
product after being satisfied consuming the product 0.911 Valid
Y1.2.3 The sense of emotional attachment that consumers have for the product after being satisfied consuming the
product 0.889 Valid
Y1.3.1 Intention to keep using the product for the future times
0.879 Valid
Y1.3.2 Intention to buy other product lines offered by the
company 0.853 Valid
Y1.3.3 Intentions to recommend products to others 0.882 Valid
Y1.4.1 Willingness to pay more for the product 0.818 Valid
Y1.4.2 Tells positive things about the product to others 0.861 Valid
Y1.4.3 Make product as the main choice 0.865 Valid
Source: Processed Questionnaire Data
Note : item is valid by r value > 0.138
Based on Table 3.6, all items of Consumer Loyalty variable are valid. All
the items have positive rvalue and are bigger than the value of rtable, which is
0.138.
Item Y1.2.1 with indicator the sense of like that consumer has for products
that arise after being satisfied consuming the product, has the highest rvalue,
which is 0.918. Meanwhile, item X1.4.1 with willingness to pay more for the
product, has the samllest value of rvalue which is 0.818. It can be concluded that
item X1.2.1 has the the best ability to measure Consumer Loyalty.
49
3.4.2 Reliability Test
According to Sugiyono (2009, p. 172), the reliability test use to measure the
reliability of a research instrument. Instruments are said to be reliable when it
can generate the same data or result if it is use multiple times to measure the
same object. Meanwhile, according to Sarjono & Julianita (2015, p. 35), a
reliability test is performed to measure the consistency level of the manifest
variable (indicator) in measuring its latent construct (dimension).
Malhotra (2010, p. 319-320) in Rinaldi (2013) said there are three types of
reliability:
1. Test-restest reliability
Test-retest reliability is a an approach to assess a measurement
reliability by giving respondent the same measurement to respondent
at two different times. This method is used to test the reliability of
instruments over time.
2. Alternative form-reliability
Alternative form-reliability is an extended form of test-retest
reliability. The approach assess a measurement by giving the same
respondent two different types of same measurement at different
times.
3. Internal Consistency
50
Internal consistency is the standard and commonly use to measure
item’s reliabilty. This method use cornbach’s alpha and only done in
one time.
Acoording to Streiner (2003, p.10) in Rinaldi (2013), internal consistency
reliablility is the most efficent method to test reability of a measurement. It does
not need two different types of the same measurement and only done once. This
research use internal consistency reliablity because it is more efficienct
compare to test-retest and alternative-form reliability. The internal consisteny
reability test is done by using SPSS version 23. Accroding to Malhotra
(2010:319), cornbach alpha measure based on cornach alpha scale from 0 to 1.
Below are the intepretation of the cornbach alpha value:
Corncah Alpha <0.60 means unreliable
Corncah Alpha 0.60 > α > 0.69 means marginal reliable
Corncah Alpha 0.70 > α > 0.79 means reliable
Corncah Alpha 0.80 > α > 0.89 means very reliable
Corncah Alpha > 0.90 means highly reliable
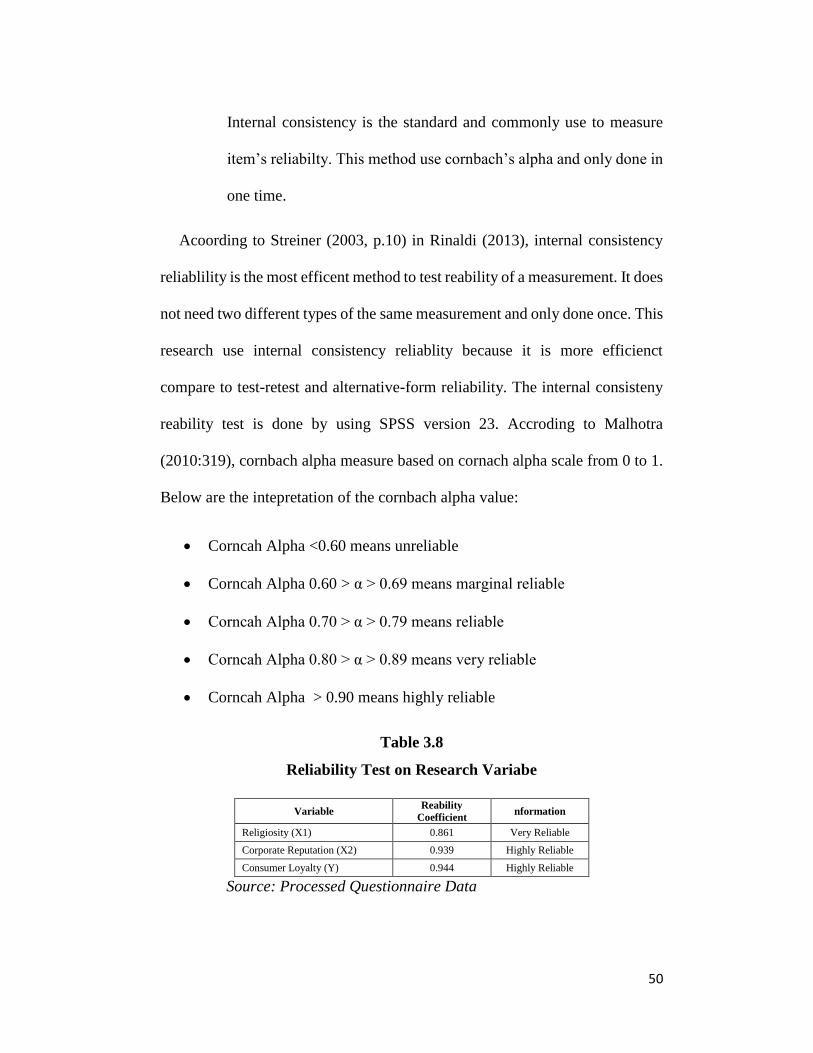
Table 3.8
Reliability Test on Research Variabe
Variable Reability
Coefficient nformation
Religiosity (X1) 0.861 Very Reliable
Corporate Reputation (X2) 0.939 Highly Reliable
Consumer Loyalty (Y) 0.944 Highly Reliable
Source: Processed Questionnaire Data
51
Based on Table 3.8, Religiosity, Corporate Reputation, and Consumer
Loyalty have cronbach alpha value > 0.6. Items of Corporate Reputation and
Consumer Loyalty is more consistent in measuring its variable compared to the
items of Religiosity. Overall, the items of reseach questionaires are very reliable
and this reseach can be conducted on future times.
3.4.3 Variable Measurement
As explained before, the answers to this research questionnaire are measured
with Likert scale. According to Sugiyono (2009, p. 132), the Likert scale is used
for measuring attitudes and perceptions of respondents about social phenomena.
In this research social phenomena have been specified by researchers in the
form of questionnaire statements based on research variables.
Furthermore Sugiyono (2009, p. 133) said that the answer to the question or
statement of the questionnaire using Likert scale has a gradation from very
positive to very negative. Gradation of answer from the Likert scale is as
follows:
a. Strongly agree
b. Agree
c. Neutral
d. Disagree
e. Strongly disagree
52
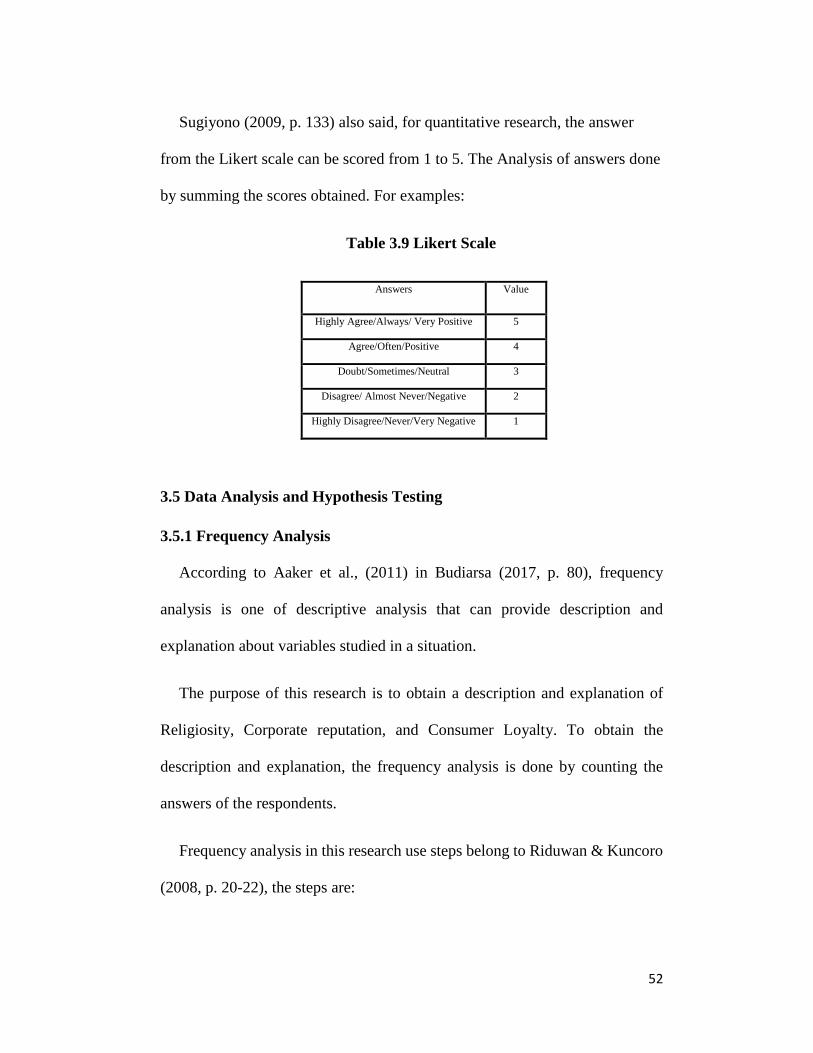
Sugiyono (2009, p. 133) also said, for quantitative research, the answer
from the Likert scale can be scored from 1 to 5. The Analysis of answers done
by summing the scores obtained. For examples:
Table 3.9 Likert Scale
Answers Value
Highly Agree/Always/ Very Positive 5
Agree/Often/Positive 4
Doubt/Sometimes/Neutral 3
Disagree/ Almost Never/Negative 2
Highly Disagree/Never/Very Negative 1
3.5 Data Analysis and Hypothesis Testing
3.5.1 Frequency Analysis
According to Aaker et al., (2011) in Budiarsa (2017, p. 80), frequency
analysis is one of descriptive analysis that can provide description and
explanation about variables studied in a situation.
The purpose of this research is to obtain a description and explanation of
Religiosity, Corporate reputation, and Consumer Loyalty. To obtain the
description and explanation, the frequency analysis is done by counting the
answers of the respondents.
Frequency analysis in this research use steps belong to Riduwan & Kuncoro
(2008, p. 20-22), the steps are:
53
1. Calculate answers from each item of questionnaire
2. Calculates the total score on each item questionnaire. This is done by
multiplying the frequency of respondents who answer on particular answer
with the answer value
3. Determine the ideal score for each item of the questionnaire. The number
of respondents in this research is 218 people, then the ideal score for each
item questionnaire is the highest value, which is five. The value is then
multiplied by the number of respondents. Then the ideal score for each item
questionnaire is 1090
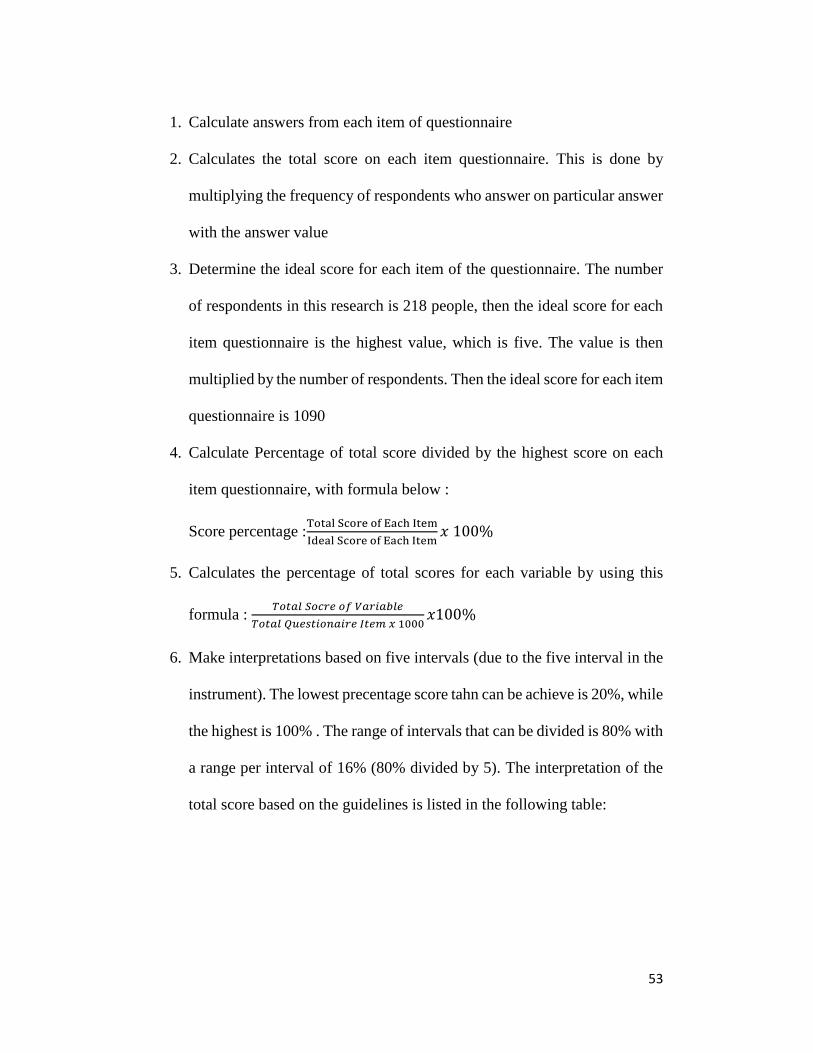
4. Calculate Percentage of total score divided by the highest score on each
item questionnaire, with formula below :
Score percentage :Total Score of Each Item
Ideal Score of Each Item𝑥 100%
5. Calculates the percentage of total scores for each variable by using this
formula : 𝑇𝑜𝑡𝑎𝑙 𝑆𝑜𝑐𝑟𝑒 𝑜𝑓 𝑉𝑎𝑟𝑖𝑎𝑏𝑙𝑒
𝑇𝑜𝑡𝑎𝑙 𝑄𝑢𝑒𝑠𝑡𝑖𝑜𝑛𝑎𝑖𝑟𝑒 𝐼𝑡𝑒𝑚 𝑥 1000𝑥100%
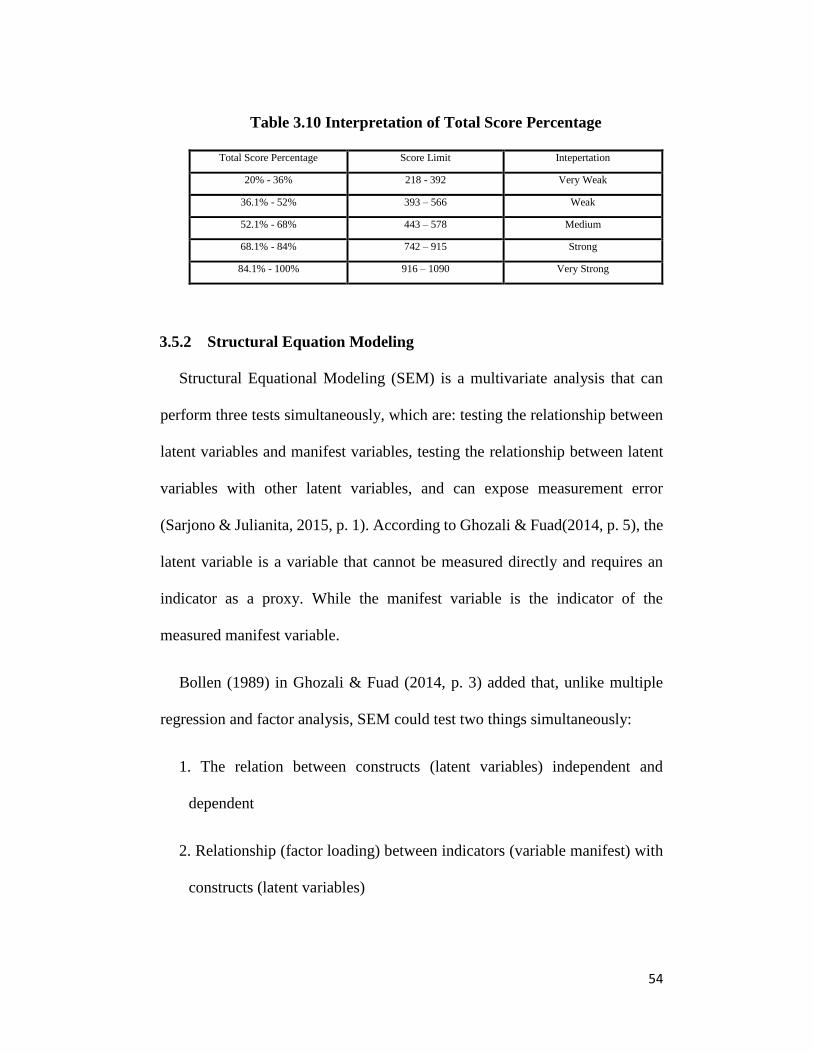
6. Make interpretations based on five intervals (due to the five interval in the
instrument). The lowest precentage score tahn can be achieve is 20%, while
the highest is 100% . The range of intervals that can be divided is 80% with
a range per interval of 16% (80% divided by 5). The interpretation of the
total score based on the guidelines is listed in the following table:
54
Table 3.10 Interpretation of Total Score Percentage
Total Score Percentage Score Limit Intepertation
20% - 36% 218 - 392 Very Weak
36.1% - 52% 393 – 566 Weak
52.1% - 68% 443 – 578 Medium
68.1% - 84% 742 – 915 Strong
84.1% - 100% 916 – 1090 Very Strong
3.5.2 Structural Equation Modeling
Structural Equational Modeling (SEM) is a multivariate analysis that can
perform three tests simultaneously, which are: testing the relationship between
latent variables and manifest variables, testing the relationship between latent
variables with other latent variables, and can expose measurement error
(Sarjono & Julianita, 2015, p. 1). According to Ghozali & Fuad(2014, p. 5), the
latent variable is a variable that cannot be measured directly and requires an
indicator as a proxy. While the manifest variable is the indicator of the
measured manifest variable.
Bollen (1989) in Ghozali & Fuad (2014, p. 3) added that, unlike multiple
regression and factor analysis, SEM could test two things simultaneously:
1. The relation between constructs (latent variables) independent and
dependent
2. Relationship (factor loading) between indicators (variable manifest) with
constructs (latent variables)
55
Ghozali & Fuad (2014, p. 3)then added that the ability of the SEM allows
researchers to:
1. Testing the measurement instrument error which is an integral part of
SEM
2. Conducting hypothesis testing simultaneously by performing factor
analysis
SEM analysis in this research is done with software LISREL (Linear
Structural Relationship) version 8.8 (full version). According to Ghozali &
Fuad (2014, p. 4), LISREL is the only sophisticated SEM software program
that can identify various problems. SEM can even do things not be possible with
other SEM software like AMOS and EQS. Also, LISREL tends to be more
informative in presenting statistical results so that the cause of unfit of a model
and modification model can quickly be known.
According to Budiarsa (2017, p. 82) quoted Hair et al. (2010: 696-712) in
Ghozali and Fuad (2008,9), The process of conducting SEM analysis are the
following steps:
1. Model Conceptualization
According to Ghozali & Fuad (2014, p. 7), the conceptualization
stage relates to the development of hypotheses based on theories as for
56
the basis of connecting latent variables to other latent variables, as well
as between latent variables and their indicators.
Model conceptualization in this research has been done with
literature study in chapter two. The chapter explains the relationship
between variables and the relationship of variables between the
indicators
2. Designing Path Diagram
Ghozali & Fuad (2014, p. 8) stated that constructing path diagrams
will allow researchers to visualize hypotheses that have been proposed
in the conceptualization stage of the model, even though LISREL can
still work without the preparation of flowcharts.
Ghozali & Fuad (2014, p. 8) added, designing path diagram can
provide other benefits such as reducing the level of error when building
a model on LISREL and helping to modify the model if the model is not
fit.
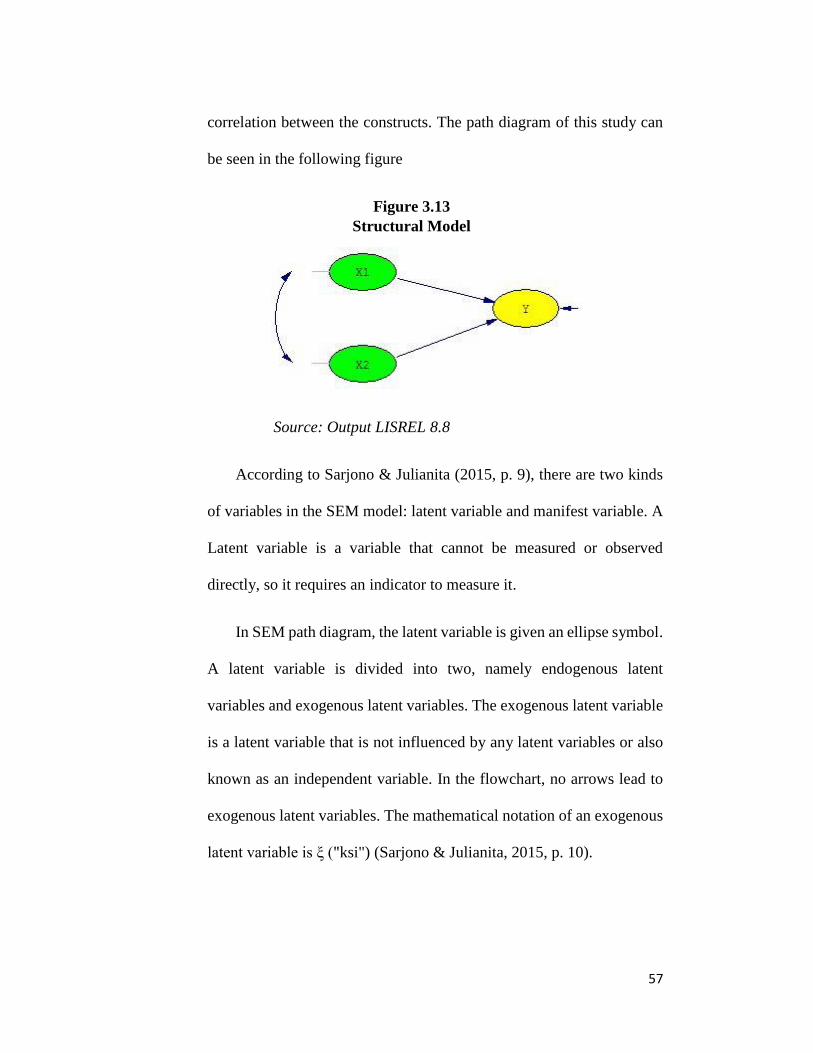
According to Hair et al., (2010:697-698) in Budiarsa (2017, p. 83),
in the path diagram, the construct relationship is expressed through two
arrows, the straight arrow indicating the causal relationship between one
construct with another dashed lines with arrows at the end showing the
57
correlation between the constructs. The path diagram of this study can
be seen in the following figure
Figure 3.13
Structural Model
Source: Output LISREL 8.8
According to Sarjono & Julianita (2015, p. 9), there are two kinds
of variables in the SEM model: latent variable and manifest variable. A
Latent variable is a variable that cannot be measured or observed
directly, so it requires an indicator to measure it.
In SEM path diagram, the latent variable is given an ellipse symbol.
A latent variable is divided into two, namely endogenous latent
variables and exogenous latent variables. The exogenous latent variable
is a latent variable that is not influenced by any latent variables or also
known as an independent variable. In the flowchart, no arrows lead to
exogenous latent variables. The mathematical notation of an exogenous
latent variable is ξ ("ksi") (Sarjono & Julianita, 2015, p. 10).
58
In contrast to an exogenous latent variable, the endogenous latent
variable is a latent variable that influenced by another latent variable.
The endogenous latent variable is also commonly called the dependent
variable. In the flowchart, there are always arrows leading to
endogenous latent variables and the mathematical notation is η ("eta")
(Sarjono & Julianita, 2015, p. 10).
Meanwhile, the manifest variable is a variable that acts as an
indicator for latent variable. Manifest variables are known also known
as observed variables or measurable variables. According to Hair et al.,
(1995) in Sarjono & Julianita (2015, p. 11), the manifest variable is the
observed value for specific points of the questionnaire question. In the
SEM Path Diagram, the manifest variable is symbolized as a square or
rectangle. Here is the SEM model of this research.
59
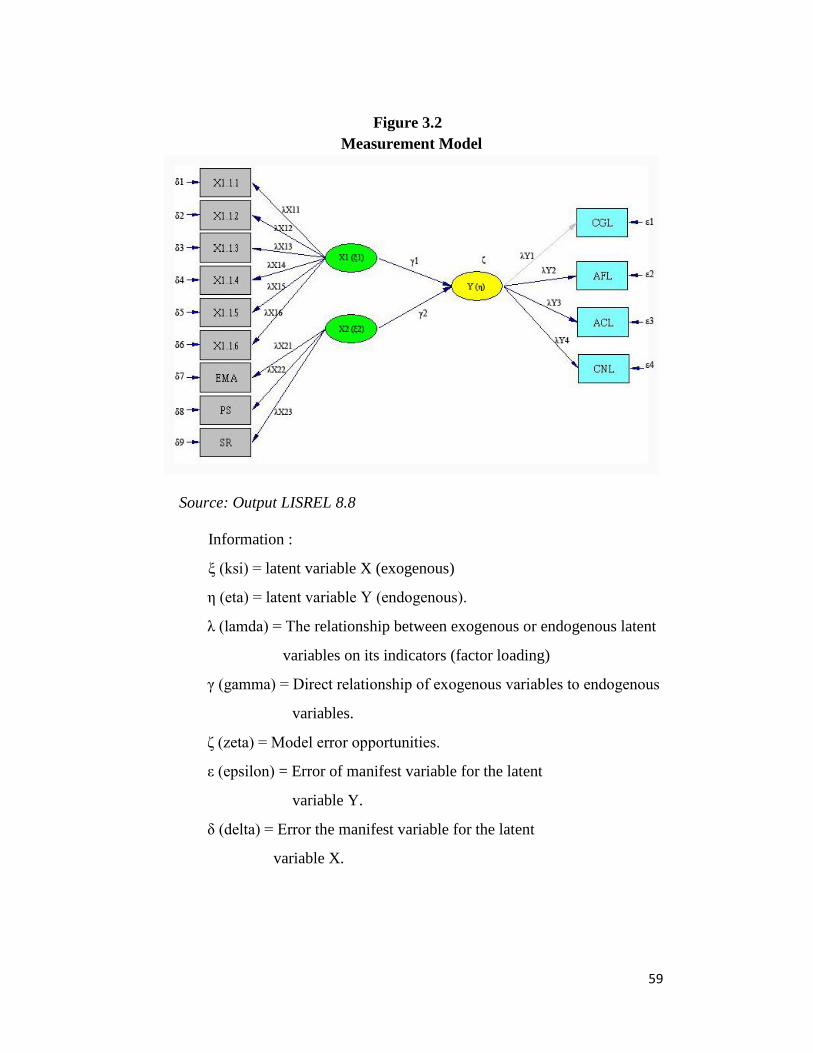
Figure 3.24
Measurement Model
Source: Output LISREL 8.8
Information :
ξ (ksi) = latent variable X (exogenous)
η (eta) = latent variable Y (endogenous).
λ (lamda) = The relationship between exogenous or endogenous latent
variables on its indicators (factor loading)
γ (gamma) = Direct relationship of exogenous variables to endogenous
variables.
ζ (zeta) = Model error opportunities.
ε (epsilon) = Error of manifest variable for the latent
variable Y.
δ (delta) = Error the manifest variable for the latent
variable X.
60
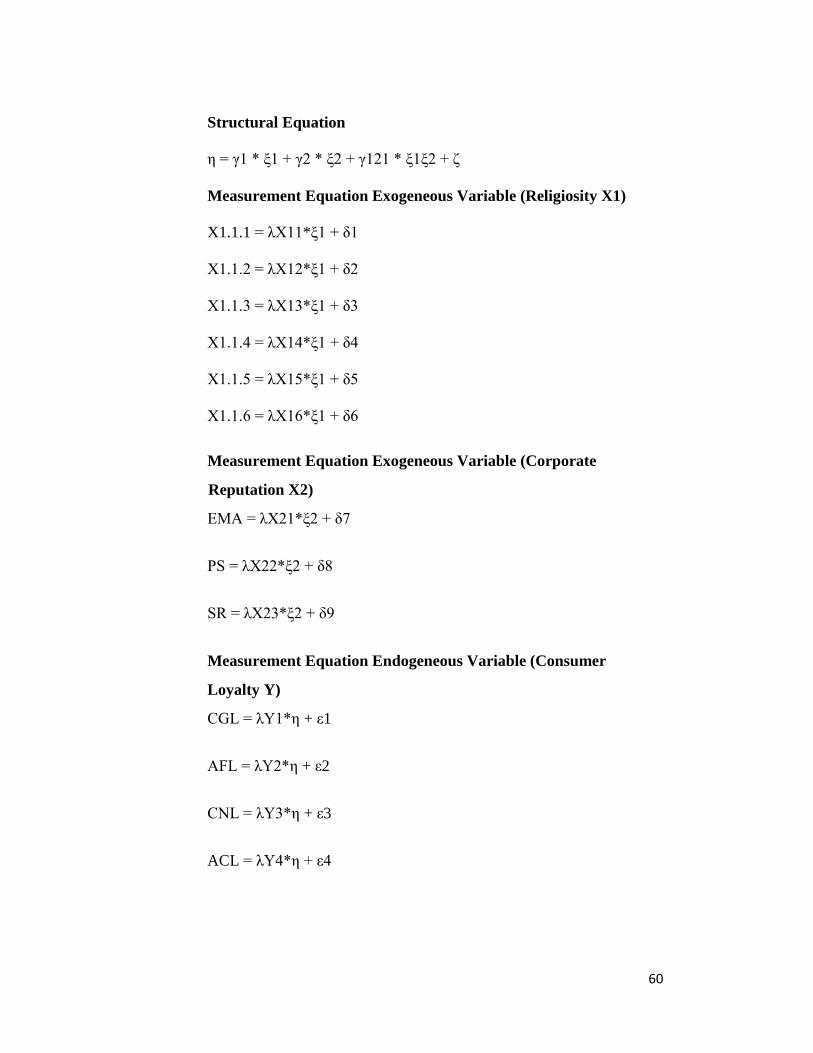
Structural Equation
η = γ1 * ξ1 + γ2 * ξ2 + γ121 * ξ1ξ2 + ζ
Measurement Equation Exogeneous Variable (Religiosity X1)
X1.1.1 = λX11*ξ1 + δ1
X1.1.2 = λX12*ξ1 + δ2
X1.1.3 = λX13*ξ1 + δ3
X1.1.4 = λX14*ξ1 + δ4
X1.1.5 = λX15*ξ1 + δ5
X1.1.6 = λX16*ξ1 + δ6
Measurement Equation Exogeneous Variable (Corporate
Reputation X2)
EMA = λX21*ξ2 + δ7
PS = λX22*ξ2 + δ8
SR = λX23*ξ2 + δ9
Measurement Equation Endogeneous Variable (Consumer
Loyalty Y)
CGL = λY1*η + ε1
AFL = λY2*η + ε2
CNL = λY3*η + ε3
ACL = λY4*η + ε4
61
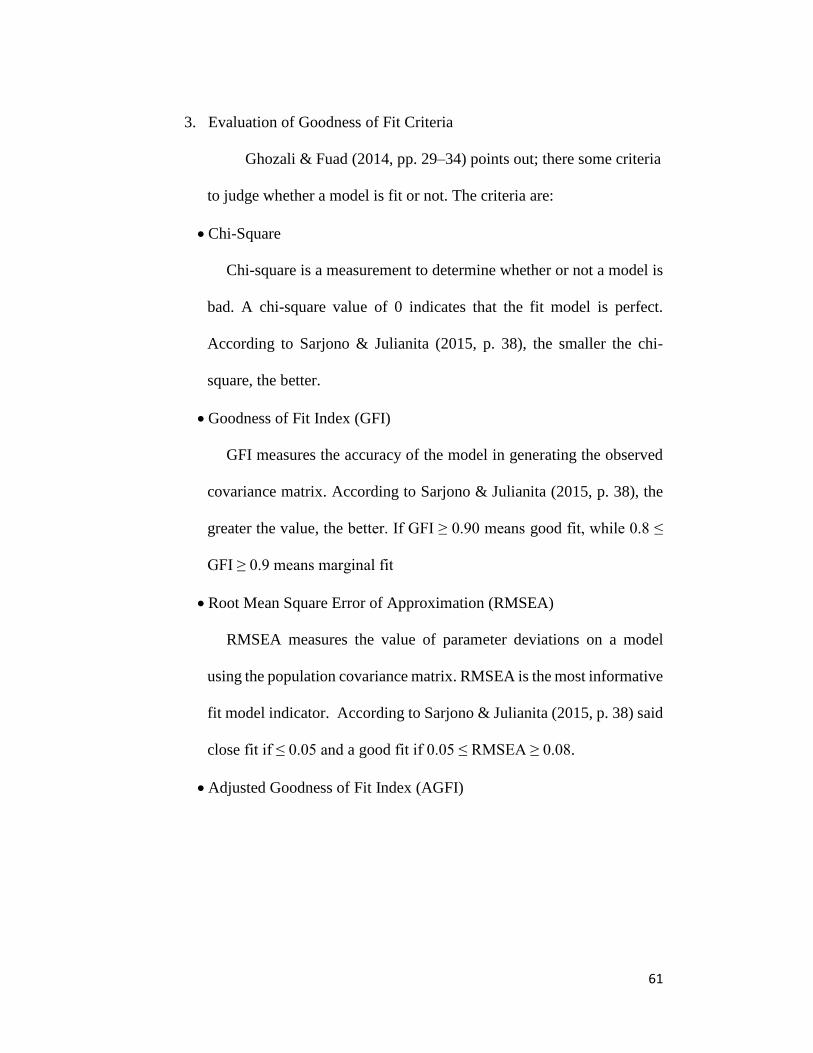
3. Evaluation of Goodness of Fit Criteria
Ghozali & Fuad (2014, pp. 29–34) points out; there some criteria
to judge whether a model is fit or not. The criteria are:
Chi-Square
Chi-square is a measurement to determine whether or not a model is
bad. A chi-square value of 0 indicates that the fit model is perfect.
According to Sarjono & Julianita (2015, p. 38), the smaller the chi-
square, the better.
Goodness of Fit Index (GFI)
GFI measures the accuracy of the model in generating the observed
covariance matrix. According to Sarjono & Julianita (2015, p. 38), the
greater the value, the better. If GFI ≥ 0.90 means good fit, while 0.8 ≤
GFI ≥ 0.9 means marginal fit
Root Mean Square Error of Approximation (RMSEA)
RMSEA measures the value of parameter deviations on a model
using the population covariance matrix. RMSEA is the most informative
fit model indicator. According to Sarjono & Julianita (2015, p. 38) said
close fit if ≤ 0.05 and a good fit if 0.05 ≤ RMSEA ≥ 0.08.
Adjusted Goodness of Fit Index (AGFI)
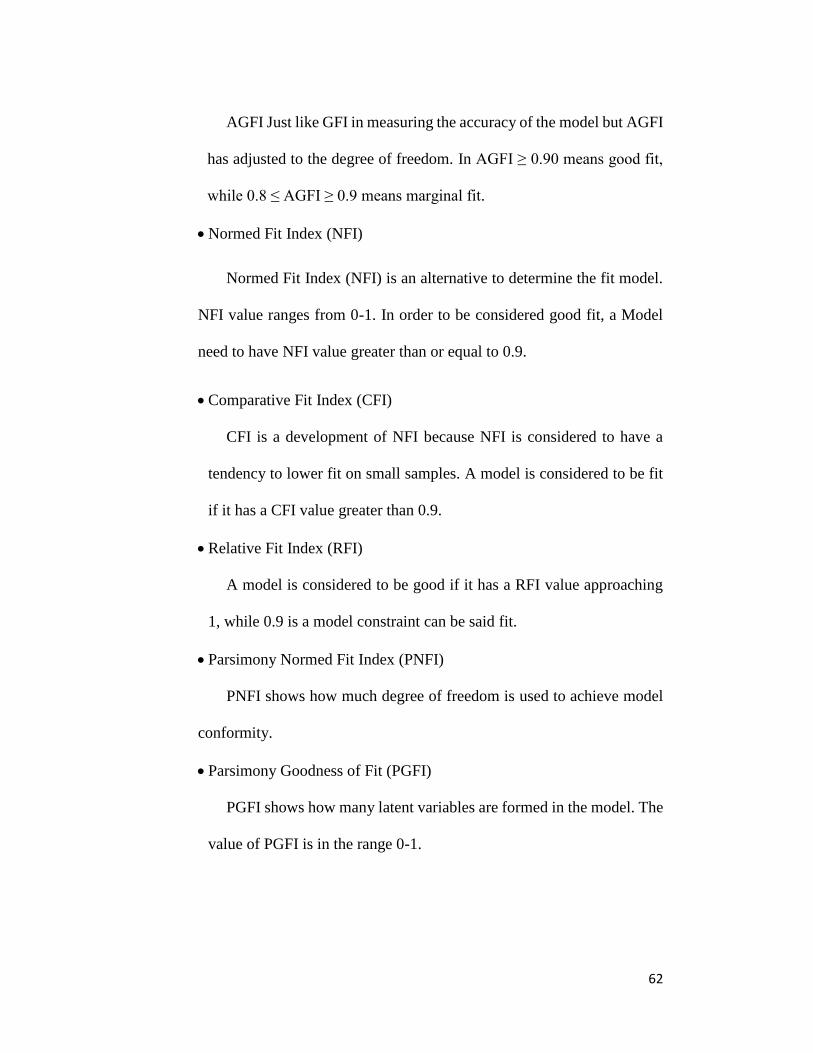
62
AGFI Just like GFI in measuring the accuracy of the model but AGFI
has adjusted to the degree of freedom. In AGFI ≥ 0.90 means good fit,
while 0.8 ≤ AGFI ≥ 0.9 means marginal fit.
Normed Fit Index (NFI)
Normed Fit Index (NFI) is an alternative to determine the fit model.
NFI value ranges from 0-1. In order to be considered good fit, a Model
need to have NFI value greater than or equal to 0.9.
Comparative Fit Index (CFI)
CFI is a development of NFI because NFI is considered to have a
tendency to lower fit on small samples. A model is considered to be fit
if it has a CFI value greater than 0.9.
Relative Fit Index (RFI)
A model is considered to be good if it has a RFI value approaching
1, while 0.9 is a model constraint can be said fit.
Parsimony Normed Fit Index (PNFI)
PNFI shows how much degree of freedom is used to achieve model
conformity.
Parsimony Goodness of Fit (PGFI)
PGFI shows how many latent variables are formed in the model. The
value of PGFI is in the range 0-1.
63
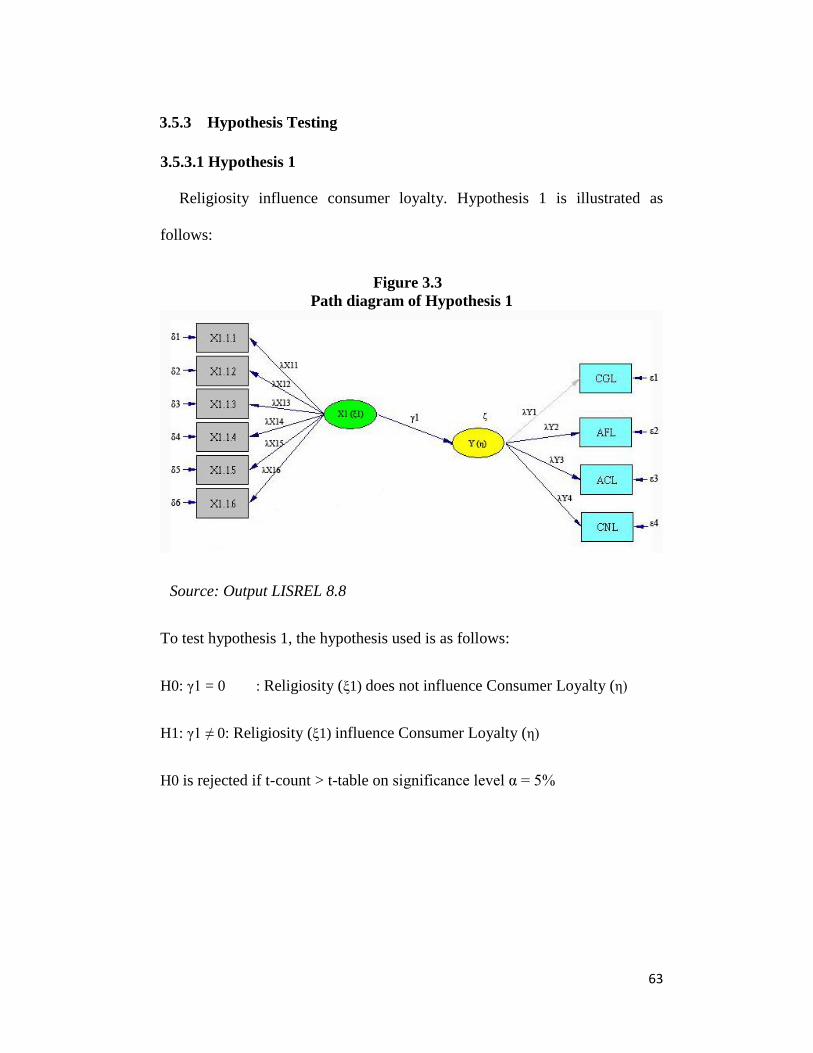
3.5.3 Hypothesis Testing
3.5.3.1 Hypothesis 1
Religiosity influence consumer loyalty. Hypothesis 1 is illustrated as
follows:
Figure 3.35
Path diagram of Hypothesis 1
Source: Output LISREL 8.8
To test hypothesis 1, the hypothesis used is as follows:
H0: γ1 = 0 : Religiosity (ξ1) does not influence Consumer Loyalty (η)
H1: γ1 ≠ 0: Religiosity (ξ1) influence Consumer Loyalty (η)
H0 is rejected if t-count > t-table on significance level α = 5%
64
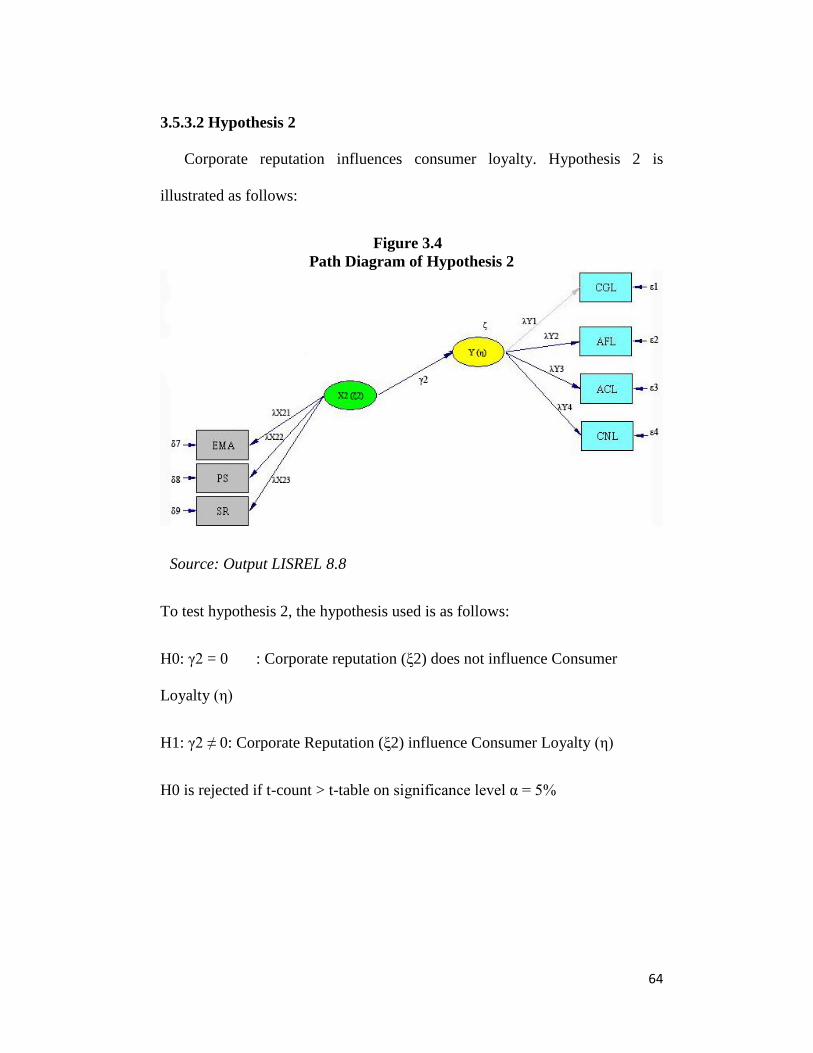
3.5.3.2 Hypothesis 2
Corporate reputation influences consumer loyalty. Hypothesis 2 is
illustrated as follows:
Figure 3.46
Path Diagram of Hypothesis 2
Source: Output LISREL 8.8
To test hypothesis 2, the hypothesis used is as follows:
H0: γ2 = 0 : Corporate reputation (ξ2) does not influence Consumer
Loyalty (η)
H1: γ2 ≠ 0: Corporate Reputation (ξ2) influence Consumer Loyalty (η)
H0 is rejected if t-count > t-table on significance level α = 5%

65
3.5.3.3 Hypothesis 3
Religiosity and Corporate Reputation influence consumer loyalty.
Hypothesis 3 is illustrated as follows:
Figure 3.57
Path Diagram of Hypothesis 3
Source: Output LISREL 8.8
To test hypothesis 3, the hypothesis used is as follows:
H0: γ12 = 0 : Religiosity (ξ1) and corporate reputation (ξ2) does not
influence consumer loyalty (η)
H1: γ12 ≠ 0 : Religiosity (ξ1) and corporate reputation (ξ2) influence
consumer loyalty (η)

66
H0 is rejected if t-count > t-table on significance level α = 5%