13th national convention on statistics (ncs) edsa … 5-3...page 1 of 28 13th national convention on...
TRANSCRIPT
Page 1 of 28
13th National Convention on Statistics (NCS)
EDSA Shangri-La Hotel, Mandaluyong City
October 3-4, 2016
Maternal Health Care Expenditures in the Philippines, 2012-2014
by
Rachel H. Racelis, Fe Vida N. Dy-Liacco, Alejandro N. Herrin, Laurita R. Mendoza, Racquel Dolores V. Sabeñano and
Michael L. Taningco
For additional information, please contact:
Author’s Name Rachel H. Racelis
Designation UP Professor/Consultant Author’s name Fe Vida N. Dy-Liacco, Alejandro N. Herrin, Laurita R. Mendoza,
Racquel Dolores V. Sabeñano and Michael L. Taningco Designation Consultant, Consultant, Planning Officer IV, Senior Statistical
Specialist and Statistical Analyst Affiliation WHO, WHO, DOH, PSA, PSA
Address UP School of Urban and Regional Planning, E. Jacinto Street, Diliman, Quezon City, 1101 Metro Manila
Tel. No. 920-6853 Email [email protected]
Page 2 of 28
MATERNAL HEALTH CARE EXPENDITURES IN THE PHILIPPINES, 2012-20141
by
Rachel H. Racelis, Fe Vida N. Dy-Liacco, Alejandro N. Herrin, Laurita R. Mendoza, Racquel Dolores V. Sabeñano and Michael L. Taningco2
ABSTRACT
The Philippine government routinely compiles data related to maternal health
and maternal health care services including maternal deaths, birth delivery by attendance and by place, and pre-natal and post-partum care. This paper attempts to contribute to this existing collection of data by providing information on the financing aspect or the expenditure side of maternal health care in the Philippines. And alongside, a limited profiling of the cases and their expenditures is done on the maternal cases who had experienced health problems or complications related to pregnancy and/or delivery. Maternal health expenditures are examined using three data sources: the full health accounts, government hospital billing records data, and the PhilHealth component of the health accounts. The health accounts data come from two Department of Health/World Health Organization (DOH/WHO) studies that applied the System of Health Accounts (SHA) 2011 to Philippine data; thus, these health accounts are also referred to as the SHA-based Philippine National Health Accounts or the PNHA-SHA. From the 2012 to 2014 PNHA-SHA estimates the following are examined: expenditures for maternal conditions in the context of reproductive health expenditures and total current health expenditures in the country; and expenditures for maternal conditions by health financing schemes. From the 2012 billing data of discharges of one government hospital and the PhilHealth component of the 2012 PNHA-SHA further detail on expenditures related to maternal conditions are studied: by specific type of maternal condition and by age of maternal case; and by region of maternal case and by type of facility that provided health care (PhilHealth data only).
Keywords: Philippine national health accounts, System of Health Accounts 2011, SHA-based Philippine national health accounts, maternal health care expenditures, maternal cases profile
1 Paper prepared for the 13th National Convention on Statistics, Edsa Shangrila Hotel, Mandaluyong City,
Philippines, October 3-4, 2016 (https://www.psa.gov.ph/ncs/13th) 2 University of the Philippines, DOH/WHO-NHA Project, DOH/WHO-NHA Project, Department of Health,
Philippine Statistics Authority and Philippine Statistics Authority, respectively.

Page 3 of 28
Maternal Health Care Expenditures in the Philippines, 2012-2014
by
Rachel H. Racelis, Fe Vida N. Dy-Liacco, Alejandro N. Herrin, Laurita R. Mendoza, Racquel Dolores V. Sabeñano and Michael L. Taningco
1. Introduction
Maternal health as goal and/or target is present in both the Millennium Development Goals (MDGs) and Sustainable Development Goals (SDGs). At the United Nations (UN) Conference on Sustainable Development held in Rio de Janeiro in June 2012 an agreement was reached to develop a set of international development goals as a follow-up to the MDGs. On 25 September 2015, world leaders at the UN Sustainable Development Summit adopted the “2030 Agenda for Sustainable Development”, which includes a set of 17 Sustainable Development Goals (SDGs) that would be in effect from 2016 to 2030 (UN 2015; UNDP 2016). The SDGs build on the MDGs which was adopted in 2000 and which had 8 goals the world committed to achieving by 2015. While immense progress has been made on the MDGs, more needs to be done to maintain the momentum gained. The new 17 SDGs go much further than the 8 MDGs, with a broader sustainability agenda addressing the root causes of poverty and the universal need for development. In the MDGs, one goal set was Goal 5: Improve maternal health; and, more specifically, the target set in the Philippines’ National Objectives for Health on this MDG was to reduce maternal mortality by 75% from 1990 to 2015 (DOH 2012). The pursuit of continuing improvement in maternal health is articulated in SDG 3 and a selected target. SDG 3 is to “ensure healthy lives and promote the well-being for all at all ages” (UNDP 2016). And one of the SDG 3 targets is the following: “By 2030, reduce the global maternal mortality ratio to less than 70 per 100,000 live births”. The MDGs and SDGs set the directions that countries in the world including the Philippines are taking in terms of their own maternal health goals and targets.
In the Philippines, maternal deaths are tracked in the Field Health Service Information System (FHSIS) and reported annually in the Philippine Health Statistics by the Department of Health (DOH) (DOH 2013b; DOH 2013a). The FHSIS also reports on government health service statistics related to maternal health care including those on family planning, birth delivery by attendance and by place, and pre-natal and post-partum care. Similarly, the National Demographic and Health Surveys (NDHS) which is conducted every five years collects data on maternal health care, specifically those related to contraceptive use, pre-natal care, child birth and post-natal care (PSA and ICF 2014). More specifically, the 2013 NDHS reports on MDG 5 indicators including the following: percentage of births attended by skilled health personnel; adolescent birth rate; antenatal care coverage; contraceptive prevalence rate; and percentage with unmet need for family planning. There is also some data collected in the NDHS about problems experienced during pregnancy that were indicative of specific maternal conditions (e.g., vaginal bleeding, paleness/anemia, irregular blood pressure, sugar imbalance, vomiting, urinary tract infection) and about problems that were general not indicative of specific maternal conditions (e.g., headache, dizziness, blurred vision, swollen face, swollen hands or feet, body pain, breathing difficulty, cold/cough/flu/fever). There is also some data collected about problems experienced around the time of delivery (e.g., long labor of more than 12 hours, excessive bleeding, high fever with bad-smelling vaginal discharge, loss of consciousness).
While there is some information in the NDHS about what is going on with women in between pregnancy/prenatal care and delivery, the types of data collected about health problems related to pregnancy is understandably limited to what the survey respondents could provide. More precise characterization about who experience health problems or complications related
Page 4 of 28
to pregnancy/delivery, what types of complications are experienced and where complication-related care is sought can be generated using data from patient-level data such as those found in health providers patient records and health insurance claims records. There has been some effort to use such data to monitor patients of government health providers in general (e.g., HOMIS hospital statistical reports include data on government hospital patients, inpatient and outpatient, such as by disease type and by age) but these would obviously not provide much detail specifically about women experiencing problems or complications during pregnancy and delivery, a gap so far in the existing health information reporting system.
An important aspect of the maternal health situation in the country is its financing – that
is, the resources or expenditures that go towards maternal health care and the uses of these resources. At the level of the individual woman, the importance of the financing aspect is indicated by a finding from the 2013 NDHS: about 37% of women interviewed gave “cost too much” as the reason for not delivering in a health facility. Expenditures for health care in the country are reported in the Philippine National Health Accounts (PNHA) on an annual basis. The PNHA is part of the Philippine statistical system and has been produced officially by the Philippine Statistics Authority or PSA (formerly by the National Statistical Coordination Board) since the late 1990s. In 2013 the DOH advocated expanding the PNHA to address the increasing information needs of health policy making – in particular, through the adoption of the System of Health Accounts (SHA) 2011 which is the international standard for health accounting currently recommended by the World Health Organization (OECD, Eurostat and WHO 2011). In the period 2013-2015, the DOH with support from the WHO conducted studies to pilot-test the use of the SHA 2011 in Philippine health accounting. The studies produced SHA-based Philippine health accounts estimates for the years 2012 to 2014, referred to as the PNHA-SHA estimates. In the PNHA-SHA, health expenditures are reported with new breakdowns including, among others, by financing scheme, by health provider and by characteristics of the health care beneficiary such as by type of disease or health condition. It is in the classification of expenditures by disease that expenditures for maternal health care can be quantified from a SHA-based health accounts such as the PNHA-SHA. The present PNHA system does not report expenditures by type of disease but a shift of the PNHA to the new system based on SHA 2011 would eventually make such additional expenditure breakdown available on a routine basis. In the meantime, the DOH/WHO health accounts studies are the primary sources of comprehensive national level expenditures data on maternal health care for the Philippines for a selected number of years.
This paper examines expenditures for maternal health conditions using three data
sources. Health accounts data provides the overall picture: comprehensive and national level estimates of expenditures with detail by type of financing. Total billing data for discharges from one government hospital for 2012 (i.e., discharges of the Baguio General Hospital and Medical Center) provides additional detail on expenditures by specific type of maternal condition and by age of the woman. The 2012 PNHA-SHA data for the PhilHealth component provides additional detail on expenditures by type of maternal condition, by age, by region and by type of health facility. (PhilHealth is the Philippine Health Insurance Corporation or PHIC.) The latter two data sets are used as well to profile women who had health problems or complications related to pregnancy/delivery, what types of complications and where care for complications was sought. The profile of maternal cases is an attempt of this paper to contribute towards filling some of the gap in maternal health data in the FHSIS and the NDHS described previously.
As background and context, the maternal mortality situation in the Philippines is first presented in this introduction. Section 2 describes the concepts, methods and data used in the paper. Section 3 presents findings on expenditures on maternal conditions from the health accounts. Section 4 presents findings on expenditures and profiles of maternal cases from the Baguio General Hospital data and the PNHA-SHA data on the PhilHealth component. Section 5 concludes the paper.
Page 5 of 28
Background on maternal mortality in the Philippines
The data used in this background comes from the Philippine Health Statistics (PHS) publications, specifically for the years 2000, 2005, 2009 and 2013 (DOH 2000, 2005, 2009 and 2013a). In these publications, maternal mortality or maternal death is defined as the death of a woman while pregnant or within 42 days of termination of pregnancy, irrespective of the duration and the site of the pregnancy, from any cause related to or aggravated by the pregnancy or its management, but not from accidental or incidental causes. Maternal death rate for a given year is defined as the number of maternal deaths per 1,000 live births, with both numerator and denominator of the rate as reported for the indicated year.
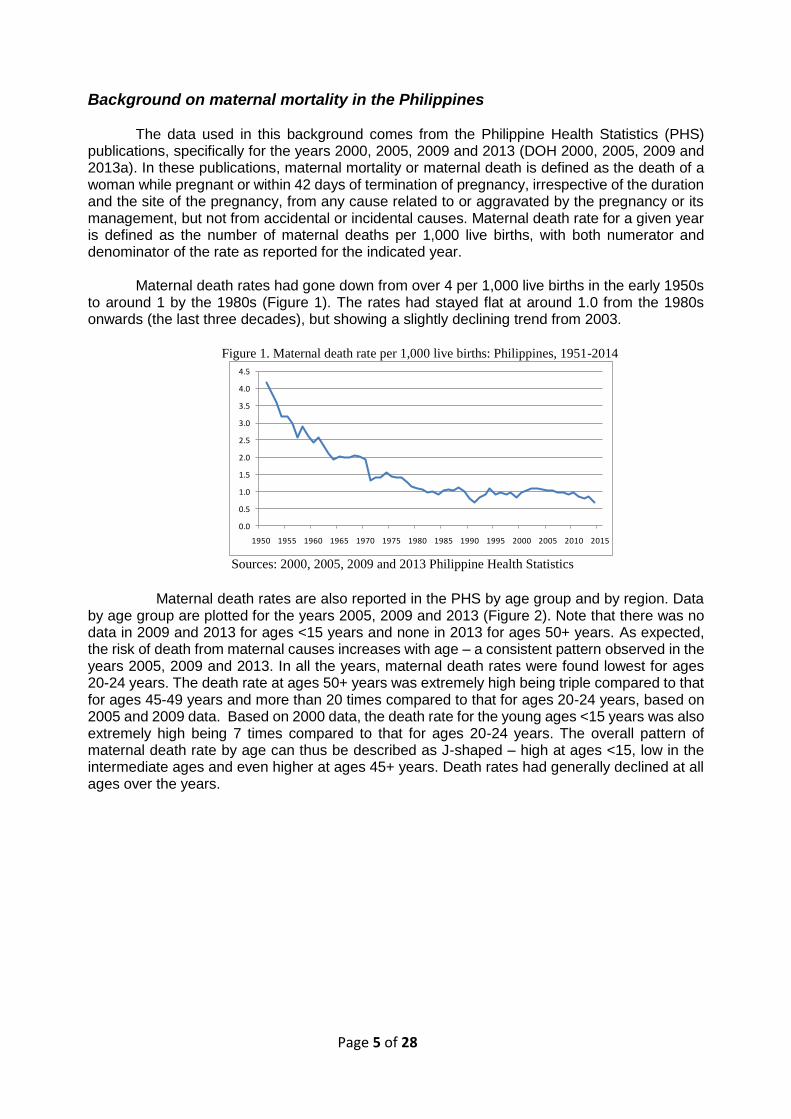
Maternal death rates had gone down from over 4 per 1,000 live births in the early 1950s
to around 1 by the 1980s (Figure 1). The rates had stayed flat at around 1.0 from the 1980s onwards (the last three decades), but showing a slightly declining trend from 2003.
Figure 1. Maternal death rate per 1,000 live births: Philippines, 1951-2014
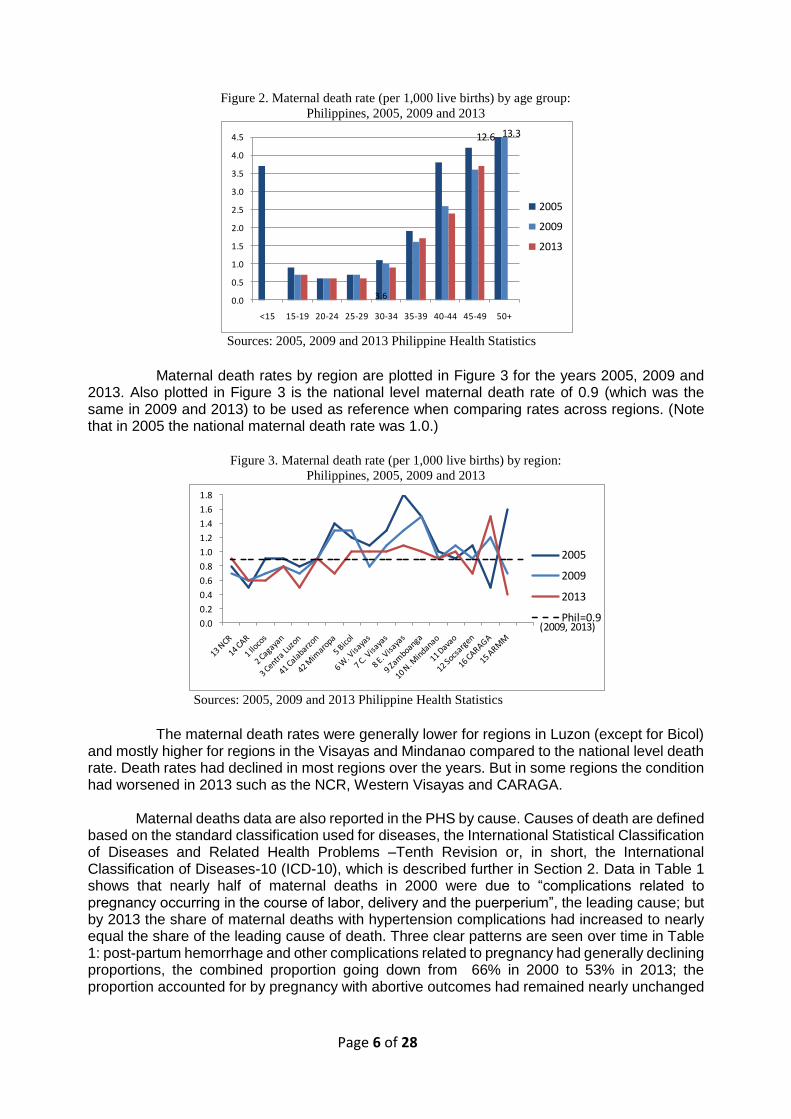
Sources: 2000, 2005, 2009 and 2013 Philippine Health Statistics Maternal death rates are also reported in the PHS by age group and by region. Data by age group are plotted for the years 2005, 2009 and 2013 (Figure 2). Note that there was no data in 2009 and 2013 for ages <15 years and none in 2013 for ages 50+ years. As expected, the risk of death from maternal causes increases with age – a consistent pattern observed in the years 2005, 2009 and 2013. In all the years, maternal death rates were found lowest for ages 20-24 years. The death rate at ages 50+ years was extremely high being triple compared to that for ages 45-49 years and more than 20 times compared to that for ages 20-24 years, based on 2005 and 2009 data. Based on 2000 data, the death rate for the young ages <15 years was also extremely high being 7 times compared to that for ages 20-24 years. The overall pattern of maternal death rate by age can thus be described as J-shaped – high at ages <15, low in the intermediate ages and even higher at ages 45+ years. Death rates had generally declined at all ages over the years.
0.0
0.5
1.0
1.5
2.0
2.5
3.0
3.5
4.0
4.5
1950 1955 1960 1965 1970 1975 1980 1985 1990 1995 2000 2005 2010 2015
Page 6 of 28
Figure 2. Maternal death rate (per 1,000 live births) by age group:
Philippines, 2005, 2009 and 2013
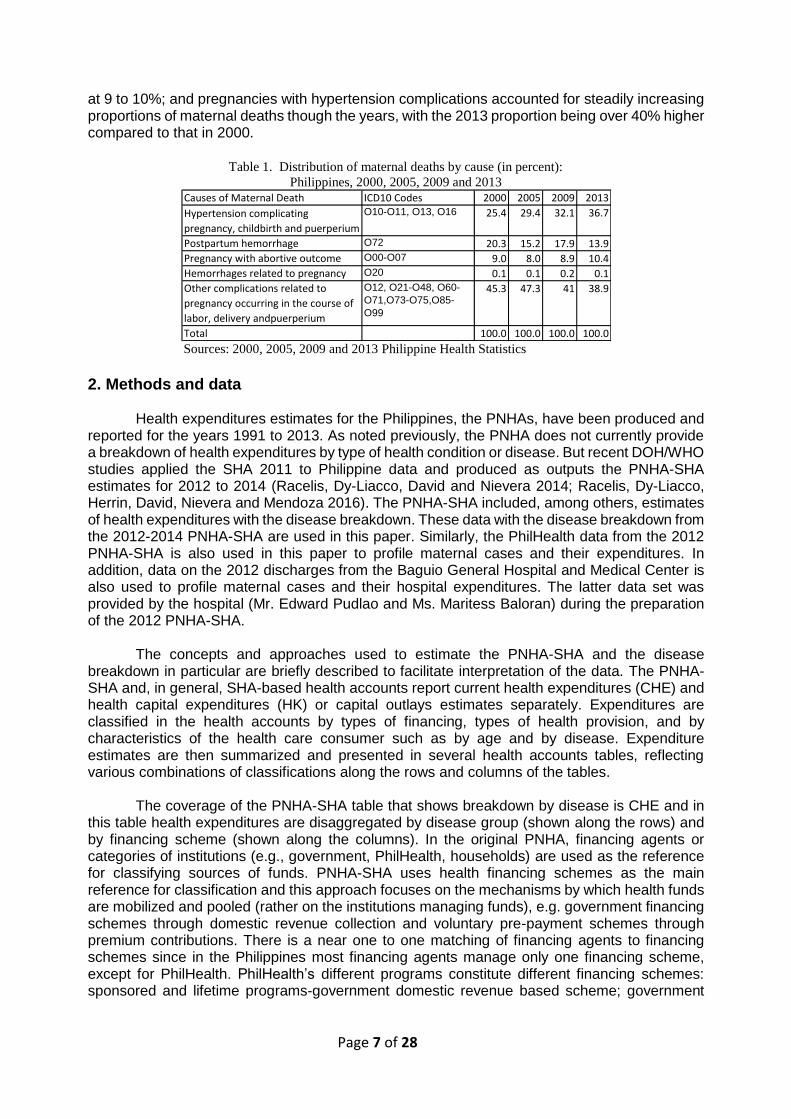
Sources: 2005, 2009 and 2013 Philippine Health Statistics Maternal death rates by region are plotted in Figure 3 for the years 2005, 2009 and 2013. Also plotted in Figure 3 is the national level maternal death rate of 0.9 (which was the same in 2009 and 2013) to be used as reference when comparing rates across regions. (Note that in 2005 the national maternal death rate was 1.0.)
Figure 3. Maternal death rate (per 1,000 live births) by region:
Philippines, 2005, 2009 and 2013
Sources: 2005, 2009 and 2013 Philippine Health Statistics The maternal death rates were generally lower for regions in Luzon (except for Bicol) and mostly higher for regions in the Visayas and Mindanao compared to the national level death rate. Death rates had declined in most regions over the years. But in some regions the condition had worsened in 2013 such as the NCR, Western Visayas and CARAGA.
Maternal deaths data are also reported in the PHS by cause. Causes of death are defined based on the standard classification used for diseases, the International Statistical Classification of Diseases and Related Health Problems –Tenth Revision or, in short, the International Classification of Diseases-10 (ICD-10), which is described further in Section 2. Data in Table 1 shows that nearly half of maternal deaths in 2000 were due to “complications related to pregnancy occurring in the course of labor, delivery and the puerperium”, the leading cause; but by 2013 the share of maternal deaths with hypertension complications had increased to nearly equal the share of the leading cause of death. Three clear patterns are seen over time in Table 1: post-partum hemorrhage and other complications related to pregnancy had generally declining proportions, the combined proportion going down from 66% in 2000 to 53% in 2013; the proportion accounted for by pregnancy with abortive outcomes had remained nearly unchanged
3.60.0
0.5
1.0
1.5
2.0
2.5
3.0
3.5
4.0
4.5
<15 15-19 20-24 25-29 30-34 35-39 40-44 45-49 50+
2005
2009
2013
12.6 13.3
0.0
0.2
0.4
0.6
0.8
1.0
1.2
1.4
1.6
1.8
2005
2009
2013
Phil=0.9(2009, 2013)
Page 7 of 28
at 9 to 10%; and pregnancies with hypertension complications accounted for steadily increasing proportions of maternal deaths though the years, with the 2013 proportion being over 40% higher compared to that in 2000.
Table 1. Distribution of maternal deaths by cause (in percent):
Philippines, 2000, 2005, 2009 and 2013
Sources: 2000, 2005, 2009 and 2013 Philippine Health Statistics
2. Methods and data Health expenditures estimates for the Philippines, the PNHAs, have been produced and
reported for the years 1991 to 2013. As noted previously, the PNHA does not currently provide a breakdown of health expenditures by type of health condition or disease. But recent DOH/WHO studies applied the SHA 2011 to Philippine data and produced as outputs the PNHA-SHA estimates for 2012 to 2014 (Racelis, Dy-Liacco, David and Nievera 2014; Racelis, Dy-Liacco, Herrin, David, Nievera and Mendoza 2016). The PNHA-SHA included, among others, estimates of health expenditures with the disease breakdown. These data with the disease breakdown from the 2012-2014 PNHA-SHA are used in this paper. Similarly, the PhilHealth data from the 2012 PNHA-SHA is also used in this paper to profile maternal cases and their expenditures. In addition, data on the 2012 discharges from the Baguio General Hospital and Medical Center is also used to profile maternal cases and their hospital expenditures. The latter data set was provided by the hospital (Mr. Edward Pudlao and Ms. Maritess Baloran) during the preparation of the 2012 PNHA-SHA.
The concepts and approaches used to estimate the PNHA-SHA and the disease
breakdown in particular are briefly described to facilitate interpretation of the data. The PNHA-SHA and, in general, SHA-based health accounts report current health expenditures (CHE) and health capital expenditures (HK) or capital outlays estimates separately. Expenditures are classified in the health accounts by types of financing, types of health provision, and by characteristics of the health care consumer such as by age and by disease. Expenditure estimates are then summarized and presented in several health accounts tables, reflecting various combinations of classifications along the rows and columns of the tables.
The coverage of the PNHA-SHA table that shows breakdown by disease is CHE and in
this table health expenditures are disaggregated by disease group (shown along the rows) and by financing scheme (shown along the columns). In the original PNHA, financing agents or categories of institutions (e.g., government, PhilHealth, households) are used as the reference for classifying sources of funds. PNHA-SHA uses health financing schemes as the main reference for classification and this approach focuses on the mechanisms by which health funds are mobilized and pooled (rather on the institutions managing funds), e.g. government financing schemes through domestic revenue collection and voluntary pre-payment schemes through premium contributions. There is a near one to one matching of financing agents to financing schemes since in the Philippines most financing agents manage only one financing scheme, except for PhilHealth. PhilHealth’s different programs constitute different financing schemes: sponsored and lifetime programs-government domestic revenue based scheme; government
Causes of Maternal Death ICD10 Codes 2000 2005 2009 2013
Hypertension complicating
pregnancy, childbirth and puerperium
O10-O11, O13, O16 25.4 29.4 32.1 36.7
Postpartum hemorrhage O72 20.3 15.2 17.9 13.9
Pregnancy with abortive outcome O00-O07 9.0 8.0 8.9 10.4
Hemorrhages related to pregnancy O20 0.1 0.1 0.2 0.1
Other complications related to
pregnancy occurring in the course of
labor, delivery andpuerperium
O12, O21-O48, O60-
O71,O73-O75,O85-
O99
45.3 47.3 41 38.9
Total 100.0 100.0 100.0 100.0

Page 8 of 28
and private sector programs-social health insurance schemes; and individually-paying (IPP) and overseas workers programs (OWP)-voluntary government based financing schemes.
A set of broad disease categories are defined in the SHA 2011(shown in Table 2) and
the coverage of each category is defined using the ICD-10. The ICD is a system of categories to which entities considered ill or injured are assigned according to established criteria. The ICD is used to translate diagnoses of diseases and other health problems from words into an alphanumeric code (WHO 2011); for example, the ICD-10 codes in 3 characters (longer codes for subcategories of diseases or conditions) for “rabies”, “eclampsia”, “false labor” and “hypothermia” are A82, O15, O47 and T68, respectively. The intent of the ICD is to allow the systematic recording, analysis and comparison of mortality and morbidity data collected in different countries and at different times. In terms of practical uses, the ICD has become the international standard diagnostic classification for general epidemiological analyses and many health management purposes. It is used to classify diseases and other health problems recorded on many types of health and vital records. Its original use was to classify causes of mortality as recorded in death registrations. Later, its scope was extended to include diagnoses in morbidity such as those recorded in clinic and hospital patient files and those recorded in health insurance benefit claims.
The disease category that is the focus of this paper is the category “DIS.2.1 Maternal
conditions” in the SHA 2011 and the coverage of this category are ICD-10 codes “O00 to O99” (see list of codes and descriptions in the Appendix.). The category DIS.2.1 belongs to the broad category “DIS.2 Reproductive health”. The other categories under DIS.2 are “DIS.2.2 Perinatal conditions” and “DIS.2.3 Unspecified reproductive health conditions (not elsewhere classified)”.
The individual level records of total billing for the 2012 discharges of Baguio General
Hospital and the data for PhilHealth from the 2012 PNHA-SHA (also total billing) include ICD-10 codes for the type of disease or medical diagnosis. The maternal cases were extracted from the two data sets based on the ICD-10 codes, and the selected cases and their expenditures analyzed according to categories of maternal conditions and age, and, for PhilHealth data, also according to region and health provider. For purposes of this paper, the grouping of maternal conditions based on ICD-10 categories was reduced to 12 groups (shown in Table 4). The listing of ICD-10 codes belonging to each of the 12 groups is given in the Appendix.
3. Expenditures on maternal conditions in the PNHA-SHA 2012-2014
The expenditures data on maternal conditions presented in this section come from the DOH/WHO studies that produced estimates of the PNHA-SHA for the years 2012, 2013 and 2014 (Racelis,Dy-Liacco, David and Nievera 2014; Racelis, Dy-Liacco, Herrin, David, Nievera and Mendoza 2016). Maternal health care expenditures are examined within the context of national current health expenditures (Table 2) and in terms of its financing (Table 3).
National current health expenditures Current health expenditures in the Philippines in 2012, 2013 and 2014 were estimated at
Php457.9 billion, Php524.9 billion, and Php566.4 billion, respectively (Table 2). Another Php13.4 billion, Php6.0 billion and Php11.4 billion for the same years were estimated to have been spent for health capital formation (Racelis, Dy-Liacco, Herrin, David, Nievera and Mendoza 2016). Altogether, current health expenditures plus capital formation expenditures constituted about 4.46%, 4.60% and 4.57% of the gross domestic product or the GDP in the years 2012, 2013 and 2014, respectively.

Page 9 of 28
Current health expenditures for maternal conditions
Table 2. Current health expenditures by disease group: Philippines, 2012-2014
Note: Revisions were made in the disease classification of some of the expenditure
items of DIS.2 in the 2012-2014 PNHA-SHA after the source paper was completed.
Expenditures for the category “DIS.2.1 Maternal conditions” amounted to about P43.2,
P46.4 and P49.8 billion in 2012, 2013 and 2014, respectively, in current prices. These constituted roughly 9% of total current health expenditures (about one-third of the share of spending for DIS.1 infectious diseases, one-fourth of the share for DIS.4 non-communicable diseases, and comparable to the share for DIS.5 injuries) and around 55% of “DIS.2 Reproductive health” CHE in those years (Table 2).
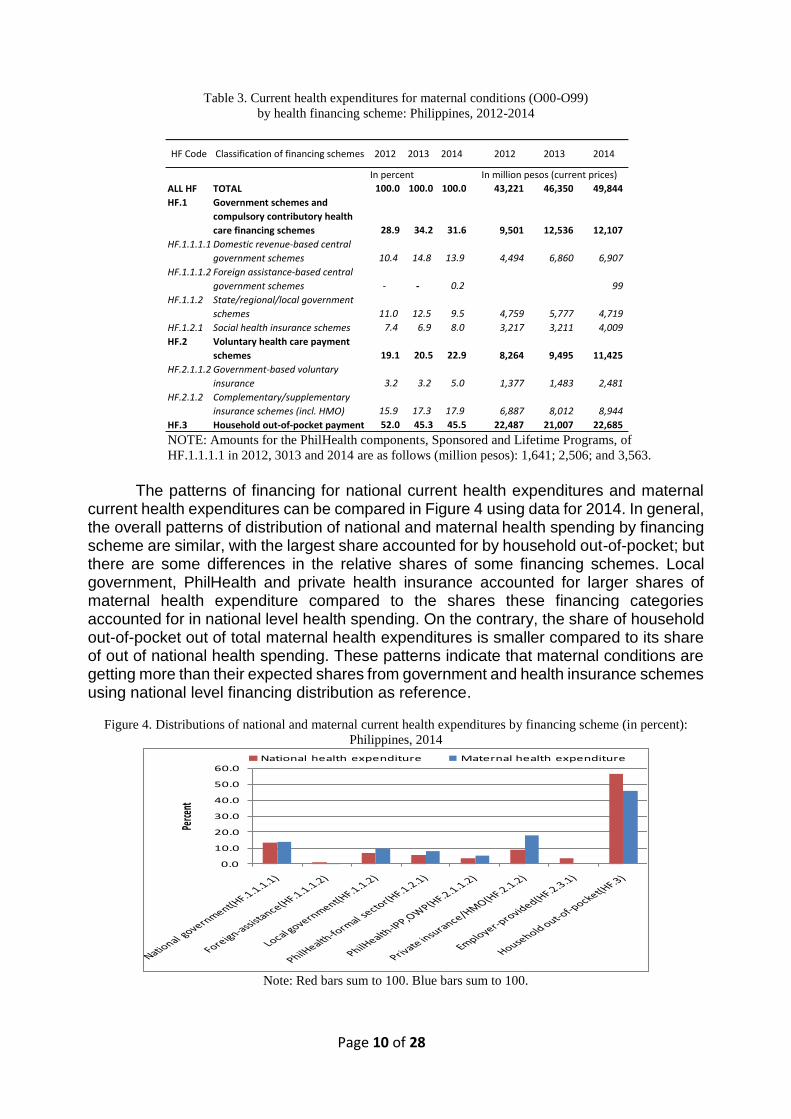
Current health expenditures for maternal conditions by financing scheme
About 52% of expenditures for maternal conditions were paid for by household out-of-pocket in 2012 but the percentage had declined to about 45% in 2013 and 2014 (Table 3). On the other hand, the shares accounted for by national government scheme (including sponsored and lifetime programs of PhilHealth), social health insurance schemes (government and private sector programs of PhilHealth) and voluntary government based financing schemes (individually-paying and overseas workers programs of PhilHealth) had all increased over the three years. Overall, the share of PhilHealth components combined had increased over the three years: 14% in 2012; 16% in 2013; and 20% in 2014. The percentage accounted for by local government schemes had stayed at 10% to 12% in the three years showing no definite pattern of change in the period.
DIS Code Classification of diseases / conditions 2012 2013 2014 2012 2013 2014
In percent In million pesos (current prices)
ALL DIS TOTAL 100.0 100.0 100.0 457,899 524,863 566,388
DIS.1 Infectious and parasitic diseases 25.8 26.1 25.9 118,174 136,782 146,768
DIS.2 Reproductive health 17.2 16.7 16.0 78,853 87,617 90,750
DIS.2.1 Maternal conditions 9.4 8.8 8.8 43,221 46,350 49,844
DIS.2.2 Perinatal conditions 5.8 6.1 5.9 26,615 31,812 33,402
DIS.2.nec Unspecified reproductive health
conditions (n.e.c.) 2.0 1.8 1.3 9,017 9,455 7,504
DIS.3 Nutritional deficiencies 1.7 2.3 2.0 7,971 12,161 11,121
DIS.4 Noncommunicable diseases 33.9 32.8 32.8 155,085 172,210 185,596
DIS.5 Injuries 9.5 9.4 9.3 43,363 49,349 52,573
DIS.6 Non-disease specific 4.7 4.2 5.3 21,551 22,035 29,904
DIS.nec Other and unspecified diseases/
conditions (n.e.c.) 7.2 8.5 8.8 32,900 44,708 49,675
Page 10 of 28
Table 3. Current health expenditures for maternal conditions (O00-O99)
by health financing scheme: Philippines, 2012-2014
NOTE: Amounts for the PhilHealth components, Sponsored and Lifetime Programs, of
HF.1.1.1.1 in 2012, 3013 and 2014 are as follows (million pesos): 1,641; 2,506; and 3,563.
The patterns of financing for national current health expenditures and maternal current health expenditures can be compared in Figure 4 using data for 2014. In general, the overall patterns of distribution of national and maternal health spending by financing scheme are similar, with the largest share accounted for by household out-of-pocket; but there are some differences in the relative shares of some financing schemes. Local government, PhilHealth and private health insurance accounted for larger shares of maternal health expenditure compared to the shares these financing categories accounted for in national level health spending. On the contrary, the share of household out-of-pocket out of total maternal health expenditures is smaller compared to its share of out of national health spending. These patterns indicate that maternal conditions are getting more than their expected shares from government and health insurance schemes using national level financing distribution as reference.
Figure 4. Distributions of national and maternal current health expenditures by financing scheme (in percent):
Philippines, 2014
Note: Red bars sum to 100. Blue bars sum to 100.
HF Code Classification of financing schemes 2012 2013 2014 2012 2013 2014
In percent In million pesos (current prices)
ALL HF TOTAL 100.0 100.0 100.0 43,221 46,350 49,844
HF.1 Government schemes and
compulsory contributory health
care financing schemes 28.9 34.2 31.6 9,501 12,536 12,107
HF.1.1.1.1 Domestic revenue-based central
government schemes 10.4 14.8 13.9 4,494 6,860 6,907
HF.1.1.1.2 Foreign assistance-based central
government schemes - - 0.2 99
HF.1.1.2 State/regional/local government
schemes 11.0 12.5 9.5 4,759 5,777 4,719
HF.1.2.1 Social health insurance schemes 7.4 6.9 8.0 3,217 3,211 4,009
HF.2 Voluntary health care payment
schemes 19.1 20.5 22.9 8,264 9,495 11,425
HF.2.1.1.2 Government-based voluntary
insurance 3.2 3.2 5.0 1,377 1,483 2,481
HF.2.1.2 Complementary/supplementary
insurance schemes (incl. HMO) 15.9 17.3 17.9 6,887 8,012 8,944
HF.3 Household out-of-pocket payment 52.0 45.3 45.5 22,487 21,007 22,685
0.0
10.0
20.0
30.0
40.0
50.0
60.0
Perce
nt
National health expenditure Maternal health expenditure
Page 11 of 28
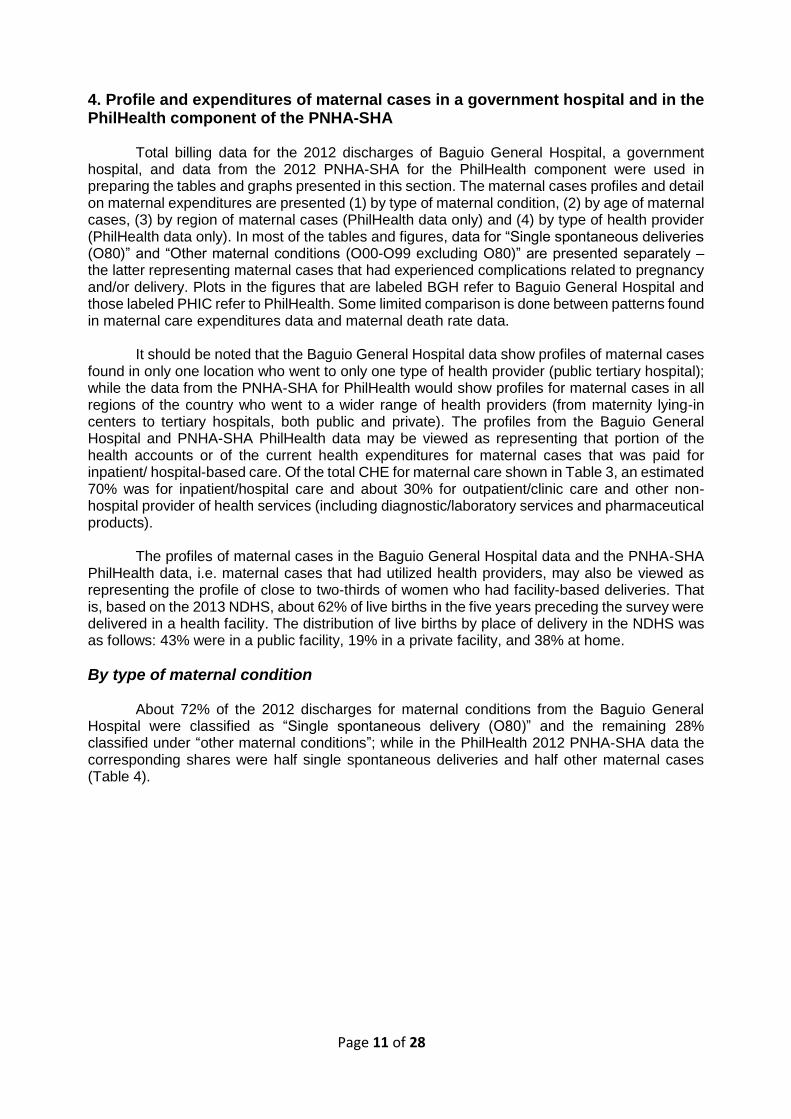
4. Profile and expenditures of maternal cases in a government hospital and in the PhilHealth component of the PNHA-SHA
Total billing data for the 2012 discharges of Baguio General Hospital, a government hospital, and data from the 2012 PNHA-SHA for the PhilHealth component were used in preparing the tables and graphs presented in this section. The maternal cases profiles and detail on maternal expenditures are presented (1) by type of maternal condition, (2) by age of maternal cases, (3) by region of maternal cases (PhilHealth data only) and (4) by type of health provider (PhilHealth data only). In most of the tables and figures, data for “Single spontaneous deliveries (O80)” and “Other maternal conditions (O00-O99 excluding O80)” are presented separately – the latter representing maternal cases that had experienced complications related to pregnancy and/or delivery. Plots in the figures that are labeled BGH refer to Baguio General Hospital and those labeled PHIC refer to PhilHealth. Some limited comparison is done between patterns found in maternal care expenditures data and maternal death rate data.
It should be noted that the Baguio General Hospital data show profiles of maternal cases
found in only one location who went to only one type of health provider (public tertiary hospital); while the data from the PNHA-SHA for PhilHealth would show profiles for maternal cases in all regions of the country who went to a wider range of health providers (from maternity lying-in centers to tertiary hospitals, both public and private). The profiles from the Baguio General Hospital and PNHA-SHA PhilHealth data may be viewed as representing that portion of the health accounts or of the current health expenditures for maternal cases that was paid for inpatient/ hospital-based care. Of the total CHE for maternal care shown in Table 3, an estimated 70% was for inpatient/hospital care and about 30% for outpatient/clinic care and other non-hospital provider of health services (including diagnostic/laboratory services and pharmaceutical products).
The profiles of maternal cases in the Baguio General Hospital data and the PNHA-SHA
PhilHealth data, i.e. maternal cases that had utilized health providers, may also be viewed as representing the profile of close to two-thirds of women who had facility-based deliveries. That is, based on the 2013 NDHS, about 62% of live births in the five years preceding the survey were delivered in a health facility. The distribution of live births by place of delivery in the NDHS was as follows: 43% were in a public facility, 19% in a private facility, and 38% at home.
By type of maternal condition
About 72% of the 2012 discharges for maternal conditions from the Baguio General Hospital were classified as “Single spontaneous delivery (O80)” and the remaining 28% classified under “other maternal conditions”; while in the PhilHealth 2012 PNHA-SHA data the corresponding shares were half single spontaneous deliveries and half other maternal cases (Table 4).

Page 12 of 28
Table 4. Percentage distributions of maternal cases and hospital payments (current prices) by type of maternal
condition, Baguio General Hospital 2012 and PhilHealth component of the 2012 PNHA-SHA
But in terms of the value of hospital billing, other maternal cases or the cases with complications accounted for disproportionately larger shares of 42% for Baguio General Hospital (versus 28% of the number of discharges or cases) and 74% for PhilHealth (versus 50% of the number of discharges or cases), indicating that maternal cases with complications are more costly. This is shown later on in Figure 5.
When individual categories of “other maternal conditions” were ranked from largest to smallest in terms of the value of aggregate expenditures for the condition, “Single delivery by caesarian section (O82)” was found at the top, accounting for the single largest shares in 2012 at 14.9% and 26.9% of total expenditures for other maternal conditions for Baguio General Hospital and PhilHealth, respectively. The top five conditions, in turn, accounted for about 55% and 50% of other maternal expenditures of the two institutions, respectively. The top 11 conditions for the Baguio General Hospital and top 17 conditions for PhilHealth accounted for about 85% of other maternal conditions expenditures. The top-ranked other maternal conditions included in the 85% were generally common to both the Baguio General Hospital and PhilHealth, and these included the following (list not according to ranking except for “O82”):
“Single delivery by caesarian section (O82)” "Long labor (O63)" "Obstructed labor due to malposition and malpresentation of fetus (O64)” "Obstructed labor due to maternal pelvic abnormality (O65)" "Ectopic pregnancy (O00)" "Other abnormal products of conception (O02)" "Spontaneous abortion (O03)" "Unspecified abortion (O06)" "Gestational [pregnancy-induced] hypertension (O14)” "Other disorders of amniotic fluid and membranes (O41)" "Premature rupture of membranes (O42)"
Baguio General Hospital PhilHealth in PNHA-SHA
Maternal
cases
Hospital
billing
Maternal
cases
Hospital
billing Maternal conditions
7.4 20.4 555 8,492 ALL maternal cases, cases in thousand/billing in million pesos
100.0 100.0 100.0 100.0 ALL maternal cases, percent
72.3 58.0 50.3 26.3 Single spontaneous delivery (O80)
27.7 42.0 49.7 73.7 All other maternal cases (O00-O99 excluding O80)
100.0 100.0 100.0 100.0 All other maternal cases (O00-O99 excluding O80), percent
18.2 17.5 5.8 6.1 Abnormal products of conception, including ectopic pregnancy
(O00 to O02)
25.4 10.6 11.9 6.4 Abortions and abortion related conditions (O03-O08)
3.7 6.5 6.3 5.0 Maternal hypertension, including eclampsia (O10-O16)
3.0 2.1 1.9 0.9 Hemorrage in early pregnancy (O20)
1.5 0.9 4.3 2.3 Excessive vomiting, diabetes, and malnutrition in pregnancy, and
abnormal findings in antenatal screening (O20-O29)
0.6 0.8 17.7 20.5 Fetal problems, including complications specific to multiple
gestation (O30-O36)
7.5 7.6 7.9 7.0 Placenta and membrane disorders, antepartum haemorrhage, false
labour (O40-O48)
28.7 36.7 21.0 22.3 Complications of labour and delivery (O60-O71, O73-O75)
1.1 1.1 1.0 0.6 Postpartum hemorrage (O72)
9.8 15.5 21.0 28.1 Assisted single delivery, multiple delivery (O81-O84)
0.5 0.7 1.3 0.8 Complications of the puerperium, disorders of breast and lactation
associated with childbirth, maternal infectious and parasitic
diseases, death from any obstetric cause (O85-O99)
Page 13 of 28
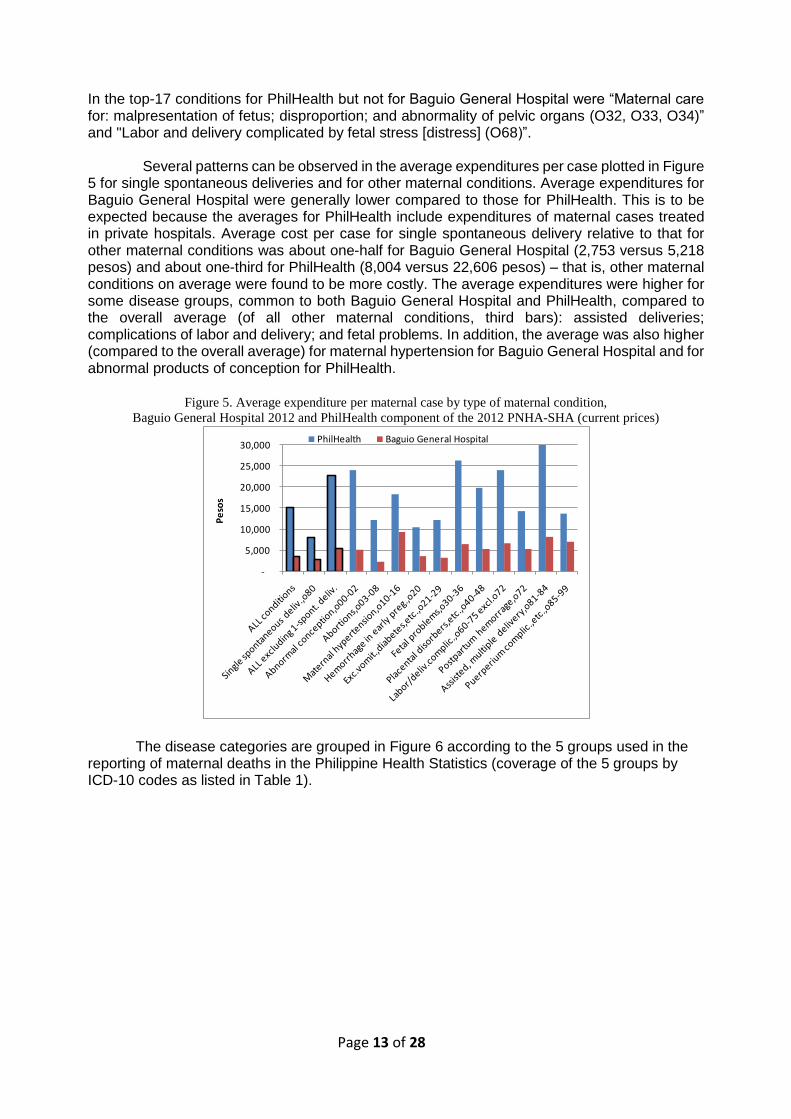
In the top-17 conditions for PhilHealth but not for Baguio General Hospital were “Maternal care for: malpresentation of fetus; disproportion; and abnormality of pelvic organs (O32, O33, O34)” and "Labor and delivery complicated by fetal stress [distress] (O68)”. Several patterns can be observed in the average expenditures per case plotted in Figure 5 for single spontaneous deliveries and for other maternal conditions. Average expenditures for Baguio General Hospital were generally lower compared to those for PhilHealth. This is to be expected because the averages for PhilHealth include expenditures of maternal cases treated in private hospitals. Average cost per case for single spontaneous delivery relative to that for other maternal conditions was about one-half for Baguio General Hospital (2,753 versus 5,218 pesos) and about one-third for PhilHealth (8,004 versus 22,606 pesos) – that is, other maternal conditions on average were found to be more costly. The average expenditures were higher for some disease groups, common to both Baguio General Hospital and PhilHealth, compared to the overall average (of all other maternal conditions, third bars): assisted deliveries; complications of labor and delivery; and fetal problems. In addition, the average was also higher (compared to the overall average) for maternal hypertension for Baguio General Hospital and for abnormal products of conception for PhilHealth.
Figure 5. Average expenditure per maternal case by type of maternal condition,
Baguio General Hospital 2012 and PhilHealth component of the 2012 PNHA-SHA (current prices)
The disease categories are grouped in Figure 6 according to the 5 groups used in the reporting of maternal deaths in the Philippine Health Statistics (coverage of the 5 groups by ICD-10 codes as listed in Table 1).
-
5,000
10,000
15,000
20,000
25,000
30,000
Pe
sos
PhilHealth Baguio General Hospital
Page 14 of 28
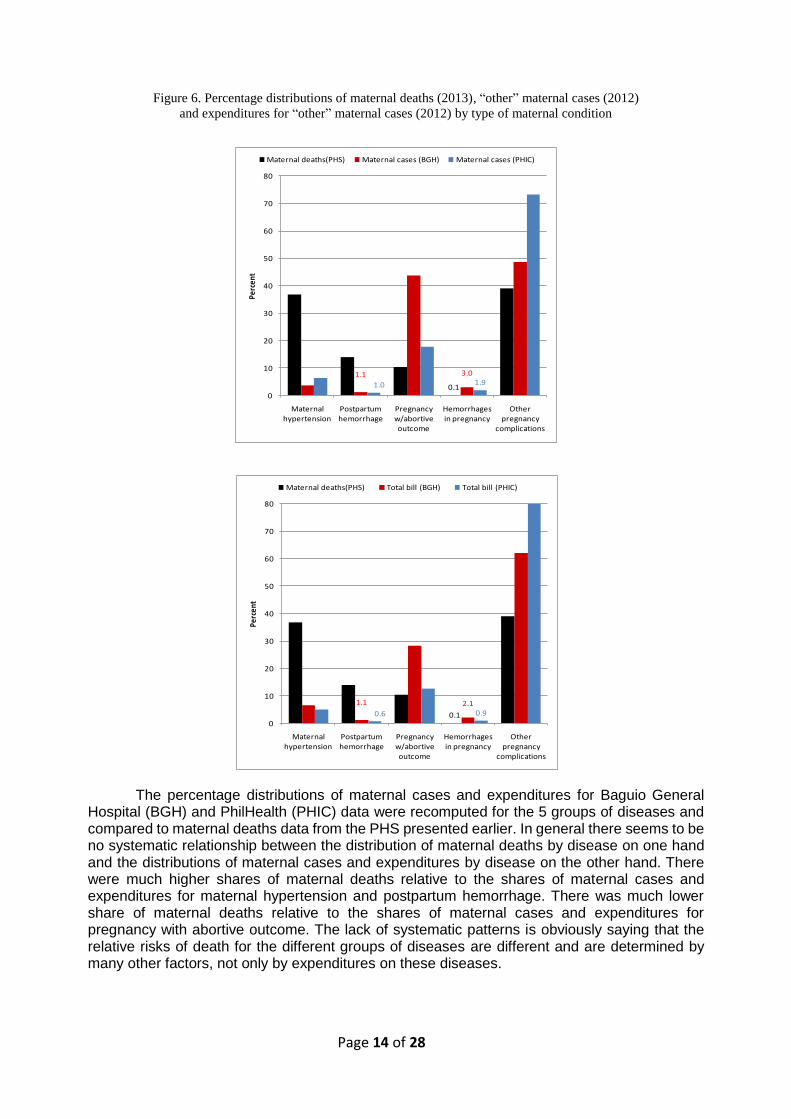
Figure 6. Percentage distributions of maternal deaths (2013), “other” maternal cases (2012)
and expenditures for “other” maternal cases (2012) by type of maternal condition
The percentage distributions of maternal cases and expenditures for Baguio General Hospital (BGH) and PhilHealth (PHIC) data were recomputed for the 5 groups of diseases and compared to maternal deaths data from the PHS presented earlier. In general there seems to be no systematic relationship between the distribution of maternal deaths by disease on one hand and the distributions of maternal cases and expenditures by disease on the other hand. There were much higher shares of maternal deaths relative to the shares of maternal cases and expenditures for maternal hypertension and postpartum hemorrhage. There was much lower share of maternal deaths relative to the shares of maternal cases and expenditures for pregnancy with abortive outcome. The lack of systematic patterns is obviously saying that the relative risks of death for the different groups of diseases are different and are determined by many other factors, not only by expenditures on these diseases.
0.1
1.1 2.1
0.6 0.9
0
10
20
30
40
50
60
70
80
Maternal hypertension
Postpartum hemorrhage
Pregnancy w/abortive outcome
Hemorrhages in pregnancy
Other pregnancy
complications
Perc
ent
Maternal deaths(PHS) Total bill (BGH) Total bill (PHIC)
0.1
1.1 3.0
1.0 1.9
0
10
20
30
40
50
60
70
80
Maternal hypertension
Postpartum hemorrhage
Pregnancy w/abortive outcome
Hemorrhages in pregnancy
Other pregnancy
complications
Perc
ent
Maternal deaths(PHS) Maternal cases (BGH) Maternal cases (PHIC)
Page 15 of 28
By age of maternal cases
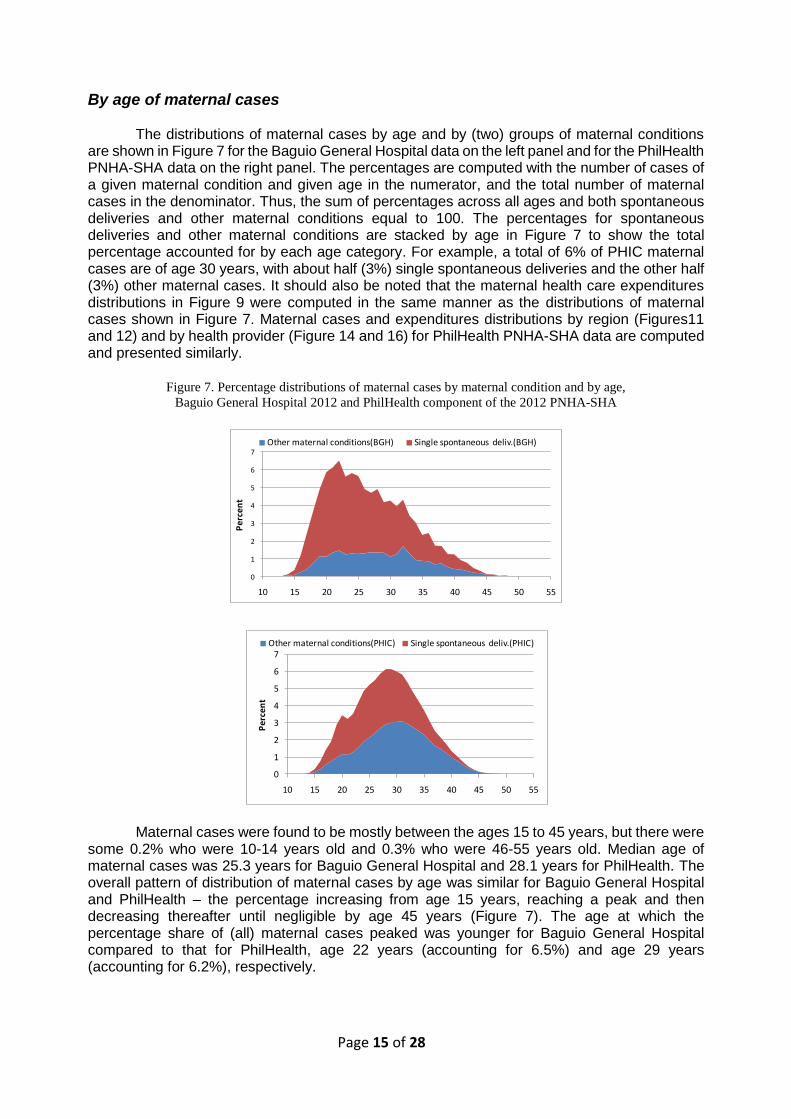
The distributions of maternal cases by age and by (two) groups of maternal conditions are shown in Figure 7 for the Baguio General Hospital data on the left panel and for the PhilHealth PNHA-SHA data on the right panel. The percentages are computed with the number of cases of a given maternal condition and given age in the numerator, and the total number of maternal cases in the denominator. Thus, the sum of percentages across all ages and both spontaneous deliveries and other maternal conditions equal to 100. The percentages for spontaneous deliveries and other maternal conditions are stacked by age in Figure 7 to show the total percentage accounted for by each age category. For example, a total of 6% of PHIC maternal cases are of age 30 years, with about half (3%) single spontaneous deliveries and the other half (3%) other maternal cases. It should also be noted that the maternal health care expenditures distributions in Figure 9 were computed in the same manner as the distributions of maternal cases shown in Figure 7. Maternal cases and expenditures distributions by region (Figures11 and 12) and by health provider (Figure 14 and 16) for PhilHealth PNHA-SHA data are computed and presented similarly.
Figure 7. Percentage distributions of maternal cases by maternal condition and by age,
Baguio General Hospital 2012 and PhilHealth component of the 2012 PNHA-SHA
Maternal cases were found to be mostly between the ages 15 to 45 years, but there were some 0.2% who were 10-14 years old and 0.3% who were 46-55 years old. Median age of maternal cases was 25.3 years for Baguio General Hospital and 28.1 years for PhilHealth. The overall pattern of distribution of maternal cases by age was similar for Baguio General Hospital and PhilHealth – the percentage increasing from age 15 years, reaching a peak and then decreasing thereafter until negligible by age 45 years (Figure 7). The age at which the percentage share of (all) maternal cases peaked was younger for Baguio General Hospital compared to that for PhilHealth, age 22 years (accounting for 6.5%) and age 29 years (accounting for 6.2%), respectively.
0
1
2
3
4
5
6
7
10 15 20 25 30 35 40 45 50 55
Pe
rce
nt
Other maternal conditions(PHIC) Single spontaneous deliv.(PHIC)
0
1
2
3
4
5
6
7
10 15 20 25 30 35 40 45 50 55
Pe
rce
nt
Other maternal conditions(BGH) Single spontaneous deliv.(BGH)
Page 16 of 28
The composition of cases by maternal condition at the peak ages however was different reflecting the findings in Table 4: of the 6.5% at age 22 years for Baguio General Hospital, 5.0% was single spontaneous deliveries and 1.5% was other maternal conditions; and of the 6.2% at age 29 years for PhilHealth, 3.2% was single spontaneous deliveries and 3.0% was other maternal conditions. In general the share of other maternal conditions (relative to all cases at each age) increases with age: the lowest was about 20% of cases at ages 15-19 for Baguio General Hospital and about 35% of cases at ages 20-24 for PhilHealth; and the percentage rising steadily as age increased reaching over 80% of cases by age 45 years for both institutions. These patterns are reflective of the increasing risk of complications in pregnancy and delivery the older the mother is.
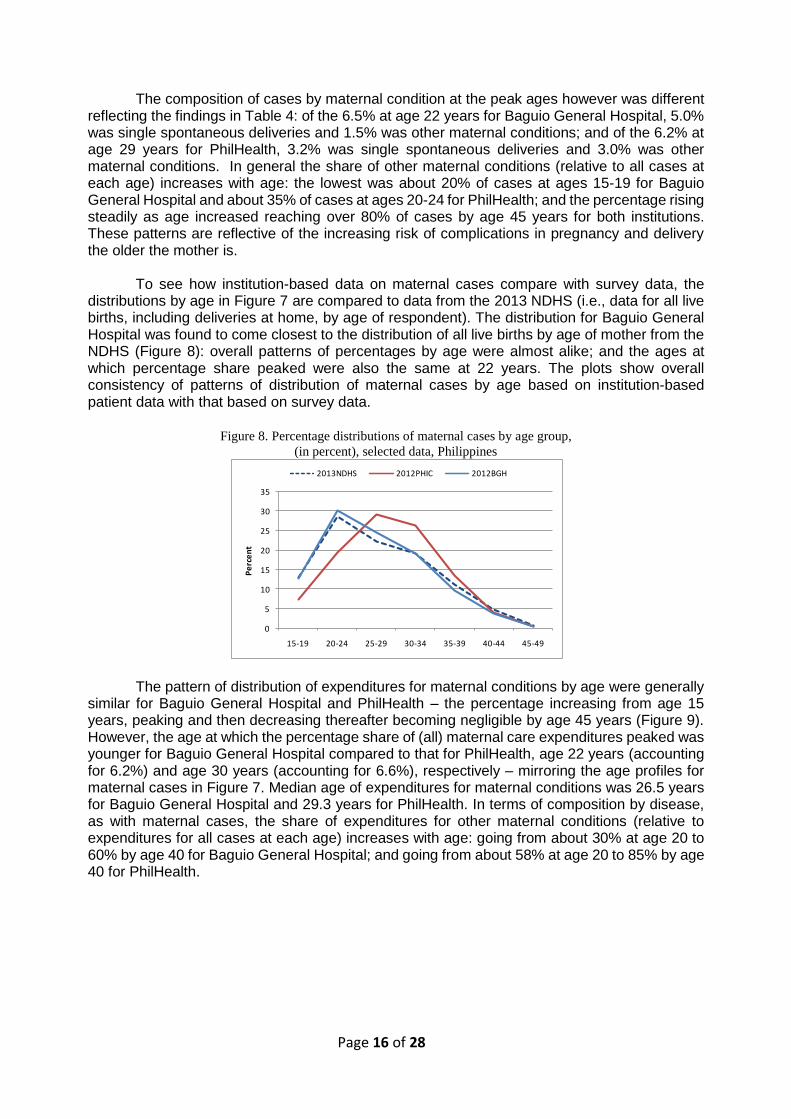
To see how institution-based data on maternal cases compare with survey data, the distributions by age in Figure 7 are compared to data from the 2013 NDHS (i.e., data for all live births, including deliveries at home, by age of respondent). The distribution for Baguio General Hospital was found to come closest to the distribution of all live births by age of mother from the NDHS (Figure 8): overall patterns of percentages by age were almost alike; and the ages at which percentage share peaked were also the same at 22 years. The plots show overall consistency of patterns of distribution of maternal cases by age based on institution-based patient data with that based on survey data.
Figure 8. Percentage distributions of maternal cases by age group,
(in percent), selected data, Philippines
The pattern of distribution of expenditures for maternal conditions by age were generally similar for Baguio General Hospital and PhilHealth – the percentage increasing from age 15 years, peaking and then decreasing thereafter becoming negligible by age 45 years (Figure 9). However, the age at which the percentage share of (all) maternal care expenditures peaked was younger for Baguio General Hospital compared to that for PhilHealth, age 22 years (accounting for 6.2%) and age 30 years (accounting for 6.6%), respectively – mirroring the age profiles for maternal cases in Figure 7. Median age of expenditures for maternal conditions was 26.5 years for Baguio General Hospital and 29.3 years for PhilHealth. In terms of composition by disease, as with maternal cases, the share of expenditures for other maternal conditions (relative to expenditures for all cases at each age) increases with age: going from about 30% at age 20 to 60% by age 40 for Baguio General Hospital; and going from about 58% at age 20 to 85% by age 40 for PhilHealth.
0
5
10
15
20
25
30
35
15-19 20-24 25-29 30-34 35-39 40-44 45-49
Pe
rce
nt
2013NDHS 2012PHIC 2012BGH
Page 17 of 28
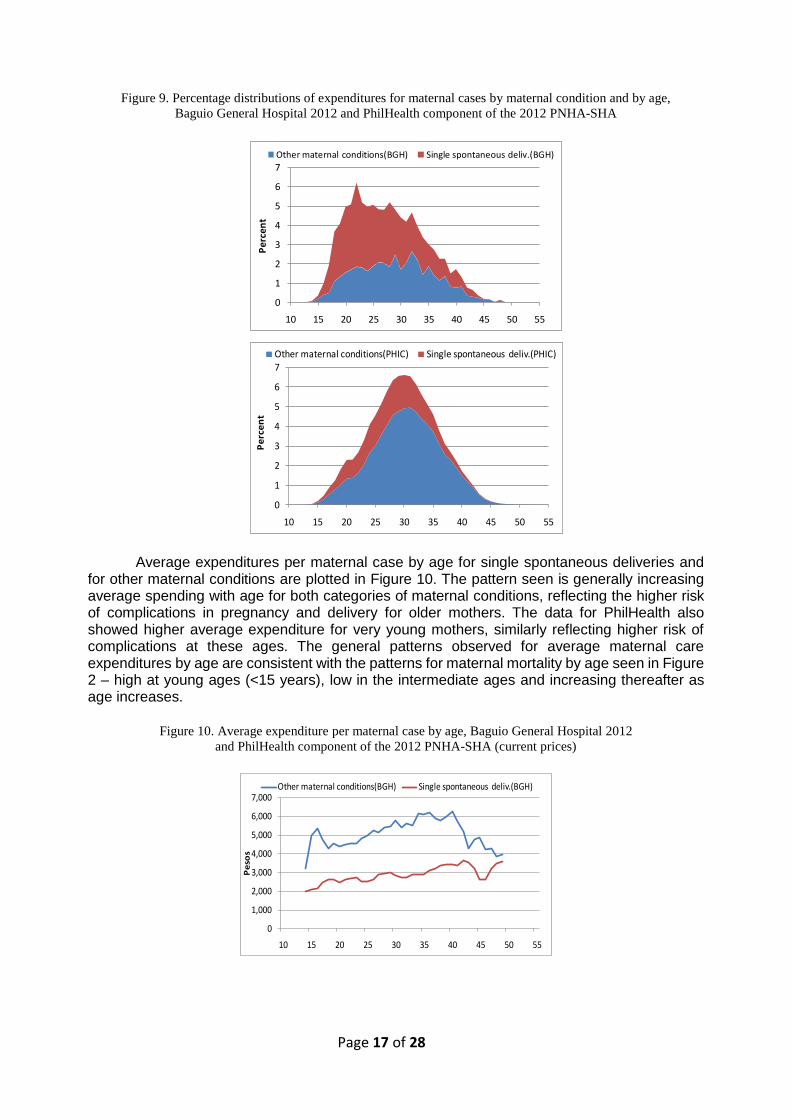
Figure 9. Percentage distributions of expenditures for maternal cases by maternal condition and by age,
Baguio General Hospital 2012 and PhilHealth component of the 2012 PNHA-SHA
Average expenditures per maternal case by age for single spontaneous deliveries and for other maternal conditions are plotted in Figure 10. The pattern seen is generally increasing average spending with age for both categories of maternal conditions, reflecting the higher risk of complications in pregnancy and delivery for older mothers. The data for PhilHealth also showed higher average expenditure for very young mothers, similarly reflecting higher risk of complications at these ages. The general patterns observed for average maternal care expenditures by age are consistent with the patterns for maternal mortality by age seen in Figure 2 – high at young ages (<15 years), low in the intermediate ages and increasing thereafter as age increases.
Figure 10. Average expenditure per maternal case by age, Baguio General Hospital 2012
and PhilHealth component of the 2012 PNHA-SHA (current prices)
0
1
2
3
4
5
6
7
10 15 20 25 30 35 40 45 50 55
Pe
rce
nt
Other maternal conditions(PHIC) Single spontaneous deliv.(PHIC)
0
1
2
3
4
5
6
7
10 15 20 25 30 35 40 45 50 55
Per
cen
t
Other maternal conditions(BGH) Single spontaneous deliv.(BGH)
0
1,000
2,000
3,000
4,000
5,000
6,000
7,000
10 15 20 25 30 35 40 45 50 55
Pe
sos
Other maternal conditions(BGH) Single spontaneous deliv.(BGH)
Page 18 of 28
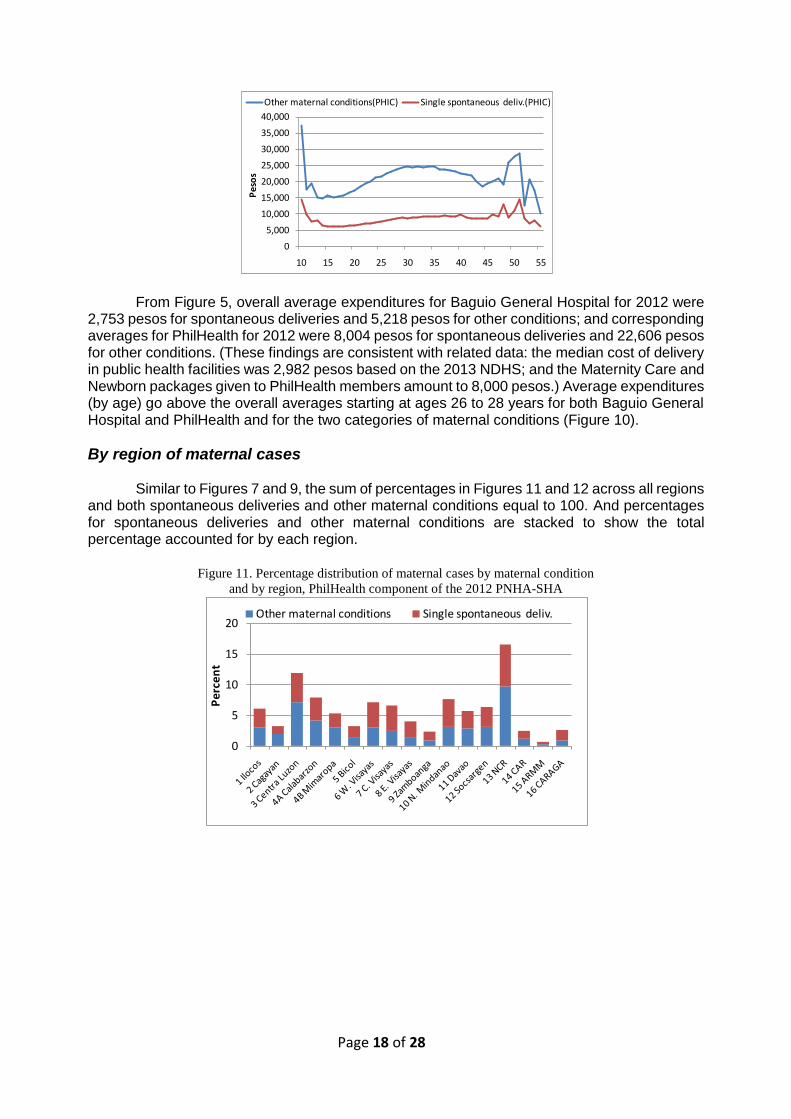
From Figure 5, overall average expenditures for Baguio General Hospital for 2012 were 2,753 pesos for spontaneous deliveries and 5,218 pesos for other conditions; and corresponding averages for PhilHealth for 2012 were 8,004 pesos for spontaneous deliveries and 22,606 pesos for other conditions. (These findings are consistent with related data: the median cost of delivery in public health facilities was 2,982 pesos based on the 2013 NDHS; and the Maternity Care and Newborn packages given to PhilHealth members amount to 8,000 pesos.) Average expenditures (by age) go above the overall averages starting at ages 26 to 28 years for both Baguio General Hospital and PhilHealth and for the two categories of maternal conditions (Figure 10).
By region of maternal cases
Similar to Figures 7 and 9, the sum of percentages in Figures 11 and 12 across all regions and both spontaneous deliveries and other maternal conditions equal to 100. And percentages for spontaneous deliveries and other maternal conditions are stacked to show the total percentage accounted for by each region.
Figure 11. Percentage distribution of maternal cases by maternal condition
and by region, PhilHealth component of the 2012 PNHA-SHA
0
5,000
10,000
15,000
20,000
25,000
30,000
35,000
40,000
10 15 20 25 30 35 40 45 50 55P
eso
s
Other maternal conditions(PHIC) Single spontaneous deliv.(PHIC)
0
5
10
15
20
Pe
rce
nt
Other maternal conditions Single spontaneous deliv.
Page 19 of 28
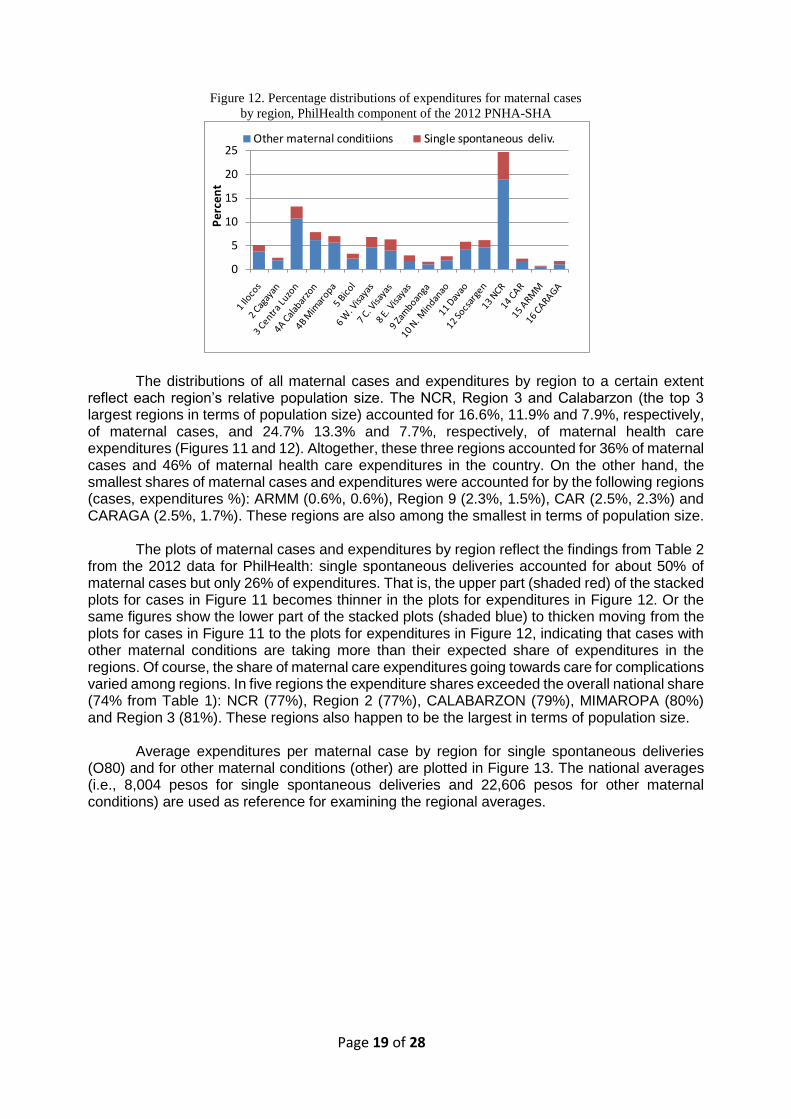
Figure 12. Percentage distributions of expenditures for maternal cases
by region, PhilHealth component of the 2012 PNHA-SHA
The distributions of all maternal cases and expenditures by region to a certain extent reflect each region’s relative population size. The NCR, Region 3 and Calabarzon (the top 3 largest regions in terms of population size) accounted for 16.6%, 11.9% and 7.9%, respectively, of maternal cases, and 24.7% 13.3% and 7.7%, respectively, of maternal health care expenditures (Figures 11 and 12). Altogether, these three regions accounted for 36% of maternal cases and 46% of maternal health care expenditures in the country. On the other hand, the smallest shares of maternal cases and expenditures were accounted for by the following regions (cases, expenditures %): ARMM (0.6%, 0.6%), Region 9 (2.3%, 1.5%), CAR (2.5%, 2.3%) and CARAGA (2.5%, 1.7%). These regions are also among the smallest in terms of population size.
The plots of maternal cases and expenditures by region reflect the findings from Table 2
from the 2012 data for PhilHealth: single spontaneous deliveries accounted for about 50% of maternal cases but only 26% of expenditures. That is, the upper part (shaded red) of the stacked plots for cases in Figure 11 becomes thinner in the plots for expenditures in Figure 12. Or the same figures show the lower part of the stacked plots (shaded blue) to thicken moving from the plots for cases in Figure 11 to the plots for expenditures in Figure 12, indicating that cases with other maternal conditions are taking more than their expected share of expenditures in the regions. Of course, the share of maternal care expenditures going towards care for complications varied among regions. In five regions the expenditure shares exceeded the overall national share (74% from Table 1): NCR (77%), Region 2 (77%), CALABARZON (79%), MIMAROPA (80%) and Region 3 (81%). These regions also happen to be the largest in terms of population size.
Average expenditures per maternal case by region for single spontaneous deliveries
(O80) and for other maternal conditions (other) are plotted in Figure 13. The national averages (i.e., 8,004 pesos for single spontaneous deliveries and 22,606 pesos for other maternal conditions) are used as reference for examining the regional averages.
0
5
10
15
20
25
Pe
rce
nt
Other maternal conditiions Single spontaneous deliv.
Page 20 of 28
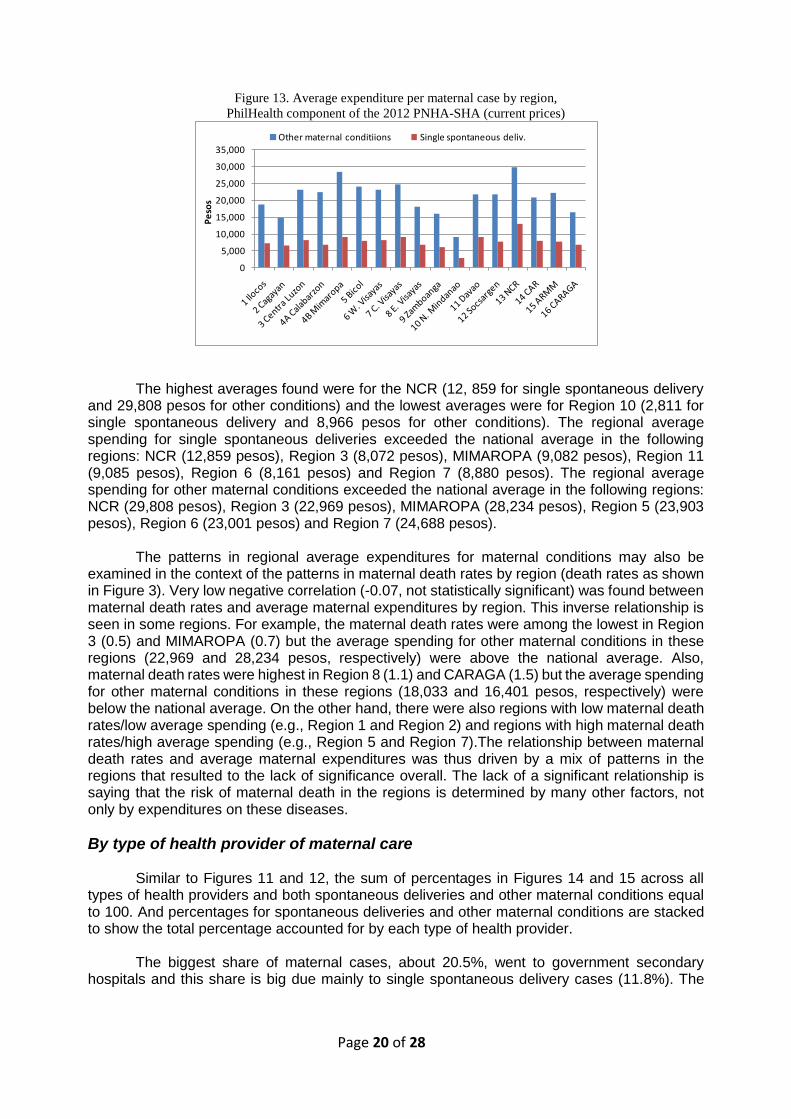
Figure 13. Average expenditure per maternal case by region,
PhilHealth component of the 2012 PNHA-SHA (current prices)
The highest averages found were for the NCR (12, 859 for single spontaneous delivery
and 29,808 pesos for other conditions) and the lowest averages were for Region 10 (2,811 for single spontaneous delivery and 8,966 pesos for other conditions). The regional average spending for single spontaneous deliveries exceeded the national average in the following regions: NCR (12,859 pesos), Region 3 (8,072 pesos), MIMAROPA (9,082 pesos), Region 11 (9,085 pesos), Region 6 (8,161 pesos) and Region 7 (8,880 pesos). The regional average spending for other maternal conditions exceeded the national average in the following regions: NCR (29,808 pesos), Region 3 (22,969 pesos), MIMAROPA (28,234 pesos), Region 5 (23,903 pesos), Region 6 (23,001 pesos) and Region 7 (24,688 pesos).
The patterns in regional average expenditures for maternal conditions may also be
examined in the context of the patterns in maternal death rates by region (death rates as shown in Figure 3). Very low negative correlation (-0.07, not statistically significant) was found between maternal death rates and average maternal expenditures by region. This inverse relationship is seen in some regions. For example, the maternal death rates were among the lowest in Region 3 (0.5) and MIMAROPA (0.7) but the average spending for other maternal conditions in these regions (22,969 and 28,234 pesos, respectively) were above the national average. Also, maternal death rates were highest in Region 8 (1.1) and CARAGA (1.5) but the average spending for other maternal conditions in these regions (18,033 and 16,401 pesos, respectively) were below the national average. On the other hand, there were also regions with low maternal death rates/low average spending (e.g., Region 1 and Region 2) and regions with high maternal death rates/high average spending (e.g., Region 5 and Region 7).The relationship between maternal death rates and average maternal expenditures was thus driven by a mix of patterns in the regions that resulted to the lack of significance overall. The lack of a significant relationship is saying that the risk of maternal death in the regions is determined by many other factors, not only by expenditures on these diseases.
By type of health provider of maternal care
Similar to Figures 11 and 12, the sum of percentages in Figures 14 and 15 across all types of health providers and both spontaneous deliveries and other maternal conditions equal to 100. And percentages for spontaneous deliveries and other maternal conditions are stacked to show the total percentage accounted for by each type of health provider.
The biggest share of maternal cases, about 20.5%, went to government secondary
hospitals and this share is big due mainly to single spontaneous delivery cases (11.8%). The
0
5,000
10,000
15,000
20,000
25,000
30,000
35,000
Pe
sos
Other maternal conditiions Single spontaneous deliv.
Page 21 of 28
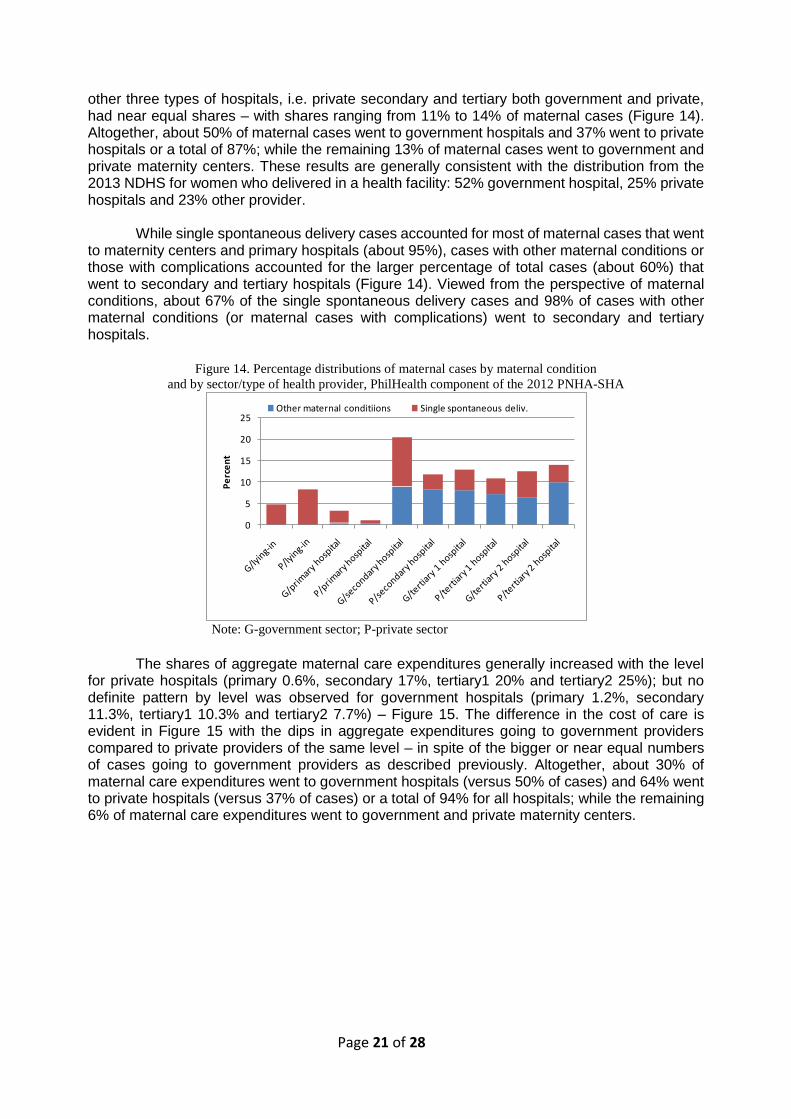
other three types of hospitals, i.e. private secondary and tertiary both government and private, had near equal shares – with shares ranging from 11% to 14% of maternal cases (Figure 14). Altogether, about 50% of maternal cases went to government hospitals and 37% went to private hospitals or a total of 87%; while the remaining 13% of maternal cases went to government and private maternity centers. These results are generally consistent with the distribution from the 2013 NDHS for women who delivered in a health facility: 52% government hospital, 25% private hospitals and 23% other provider.
While single spontaneous delivery cases accounted for most of maternal cases that went
to maternity centers and primary hospitals (about 95%), cases with other maternal conditions or those with complications accounted for the larger percentage of total cases (about 60%) that went to secondary and tertiary hospitals (Figure 14). Viewed from the perspective of maternal conditions, about 67% of the single spontaneous delivery cases and 98% of cases with other maternal conditions (or maternal cases with complications) went to secondary and tertiary hospitals.
Figure 14. Percentage distributions of maternal cases by maternal condition
and by sector/type of health provider, PhilHealth component of the 2012 PNHA-SHA
Note: G-government sector; P-private sector
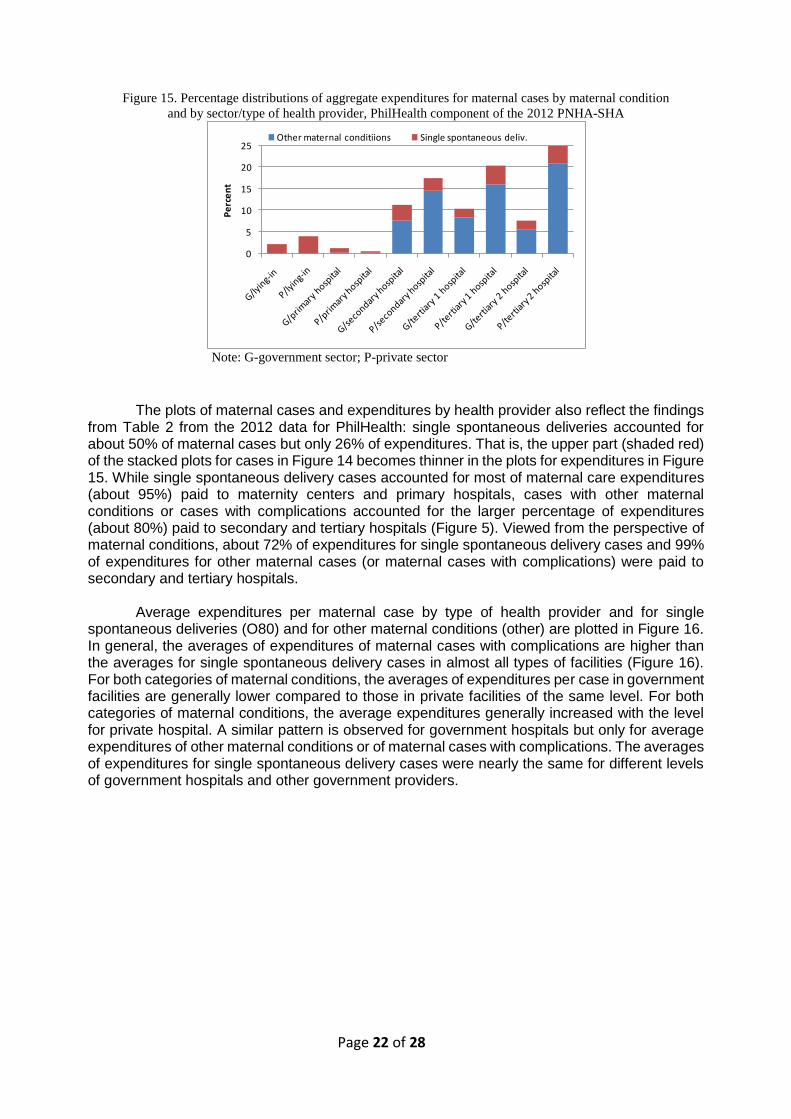
The shares of aggregate maternal care expenditures generally increased with the level
for private hospitals (primary 0.6%, secondary 17%, tertiary1 20% and tertiary2 25%); but no definite pattern by level was observed for government hospitals (primary 1.2%, secondary 11.3%, tertiary1 10.3% and tertiary2 7.7%) – Figure 15. The difference in the cost of care is evident in Figure 15 with the dips in aggregate expenditures going to government providers compared to private providers of the same level – in spite of the bigger or near equal numbers of cases going to government providers as described previously. Altogether, about 30% of maternal care expenditures went to government hospitals (versus 50% of cases) and 64% went to private hospitals (versus 37% of cases) or a total of 94% for all hospitals; while the remaining 6% of maternal care expenditures went to government and private maternity centers.
0
5
10
15
20
25
Pe
rce
nt
Other maternal conditiions Single spontaneous deliv.
Page 22 of 28
Figure 15. Percentage distributions of aggregate expenditures for maternal cases by maternal condition
and by sector/type of health provider, PhilHealth component of the 2012 PNHA-SHA
Note: G-government sector; P-private sector
The plots of maternal cases and expenditures by health provider also reflect the findings
from Table 2 from the 2012 data for PhilHealth: single spontaneous deliveries accounted for about 50% of maternal cases but only 26% of expenditures. That is, the upper part (shaded red) of the stacked plots for cases in Figure 14 becomes thinner in the plots for expenditures in Figure 15. While single spontaneous delivery cases accounted for most of maternal care expenditures (about 95%) paid to maternity centers and primary hospitals, cases with other maternal conditions or cases with complications accounted for the larger percentage of expenditures (about 80%) paid to secondary and tertiary hospitals (Figure 5). Viewed from the perspective of maternal conditions, about 72% of expenditures for single spontaneous delivery cases and 99% of expenditures for other maternal cases (or maternal cases with complications) were paid to secondary and tertiary hospitals.
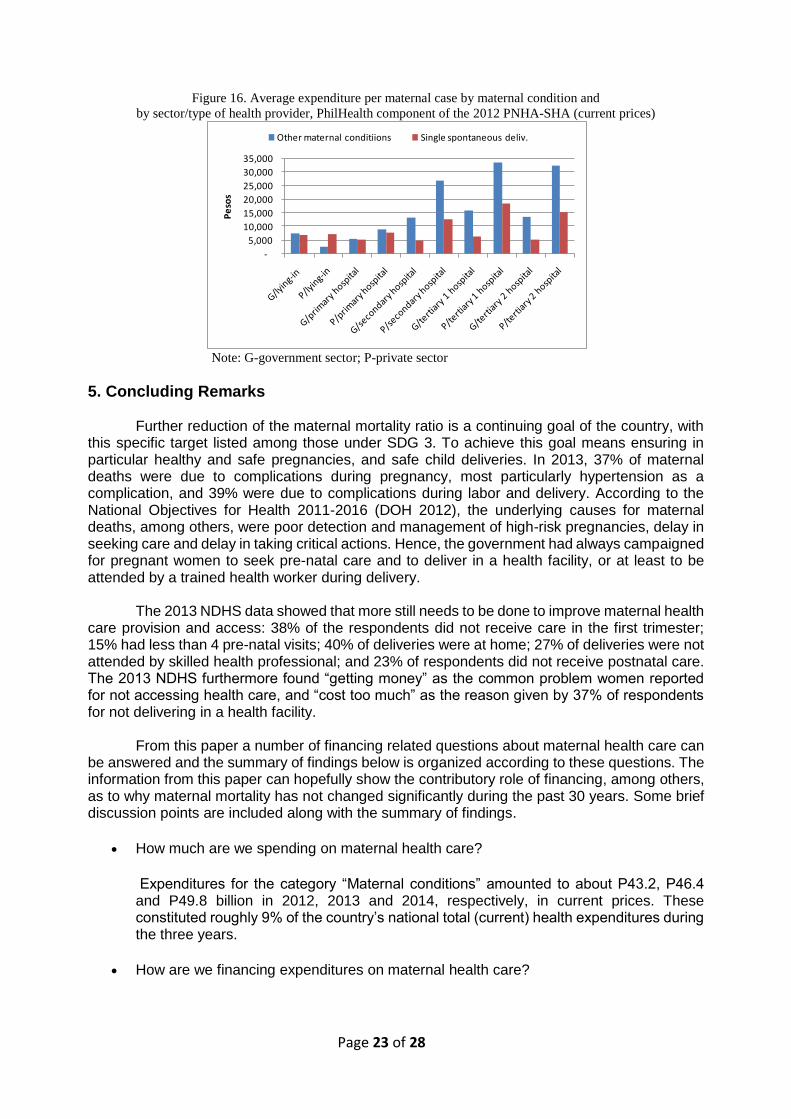
Average expenditures per maternal case by type of health provider and for single
spontaneous deliveries (O80) and for other maternal conditions (other) are plotted in Figure 16. In general, the averages of expenditures of maternal cases with complications are higher than the averages for single spontaneous delivery cases in almost all types of facilities (Figure 16). For both categories of maternal conditions, the averages of expenditures per case in government facilities are generally lower compared to those in private facilities of the same level. For both categories of maternal conditions, the average expenditures generally increased with the level for private hospital. A similar pattern is observed for government hospitals but only for average expenditures of other maternal conditions or of maternal cases with complications. The averages of expenditures for single spontaneous delivery cases were nearly the same for different levels of government hospitals and other government providers.
0
5
10
15
20
25
Pe
rce
nt
Other maternal conditiions Single spontaneous deliv.
Page 23 of 28
Figure 16. Average expenditure per maternal case by maternal condition and
by sector/type of health provider, PhilHealth component of the 2012 PNHA-SHA (current prices)
Note: G-government sector; P-private sector
5. Concluding Remarks Further reduction of the maternal mortality ratio is a continuing goal of the country, with
this specific target listed among those under SDG 3. To achieve this goal means ensuring in particular healthy and safe pregnancies, and safe child deliveries. In 2013, 37% of maternal deaths were due to complications during pregnancy, most particularly hypertension as a complication, and 39% were due to complications during labor and delivery. According to the National Objectives for Health 2011-2016 (DOH 2012), the underlying causes for maternal deaths, among others, were poor detection and management of high-risk pregnancies, delay in seeking care and delay in taking critical actions. Hence, the government had always campaigned for pregnant women to seek pre-natal care and to deliver in a health facility, or at least to be attended by a trained health worker during delivery.
The 2013 NDHS data showed that more still needs to be done to improve maternal health care provision and access: 38% of the respondents did not receive care in the first trimester; 15% had less than 4 pre-natal visits; 40% of deliveries were at home; 27% of deliveries were not attended by skilled health professional; and 23% of respondents did not receive postnatal care. The 2013 NDHS furthermore found “getting money” as the common problem women reported for not accessing health care, and “cost too much” as the reason given by 37% of respondents for not delivering in a health facility.
From this paper a number of financing related questions about maternal health care can
be answered and the summary of findings below is organized according to these questions. The information from this paper can hopefully show the contributory role of financing, among others, as to why maternal mortality has not changed significantly during the past 30 years. Some brief discussion points are included along with the summary of findings.
How much are we spending on maternal health care?
Expenditures for the category “Maternal conditions” amounted to about P43.2, P46.4 and P49.8 billion in 2012, 2013 and 2014, respectively, in current prices. These constituted roughly 9% of the country’s national total (current) health expenditures during the three years.
How are we financing expenditures on maternal health care?
-
5,000
10,000
15,000
20,000
25,000
30,000
35,000
Pe
sos
Other maternal conditiions Single spontaneous deliv.
Page 24 of 28
Household out-of-pocket paid for about 52% of total expenditures for maternal conditions in 2012 and about 45% in 2013 and 2014. The share paid by PhilHealth had increased over the three years: 14% in 2012; 16% in 2013; and 20% in 2014. The percentage accounted for by national and local government schemes had stayed at 15% to 18% in the three years. Maternal conditions expenditures, as with the country’s national health care expenditures in general, are thus financed heavily by household out-of-pocket. And for as long as this financing situation persists, financing or cost of care can remain a barrier to accessing maternal health care for many women – this explains the finding from the 2013 NDHS. Based on data from three years, the financing for maternal care from PhilHealth is increasing, expected to continue in the future and hopefully bring down out-of-pocket health expenditures. An area that should be explored is whether we get better maternal health outcomes with insurance coverage, especially for cases with complications, and how insurance can be used to further improve such outcomes.
Total maternal health care expenditures as summarized in the first two questions cover
inpatient, out-patient and all other types of care (including ancillary services). But recall that the maternal expenditure data of the BGH and PhilHealth was used in the subsequent detailed profiling; and the expenditures of these two institutions cover only inpatient/hospital-based care, which accounts for roughly 70% of total maternal health expenditures. The expenditures described and summarized in the next three questions below cover only those for inpatient/ hospital-based maternal care.
What types of inpatient/hospital-based maternal health care are we paying for?
Maternal health care expenditures at BGH and by PhilHealth pay for two broad categories of care (ICD-10 codes in parenthesis): for “Single spontaneous deliveries (O80)” or normal deliveries; and for “Other maternal conditions (O00-O99 excluding O80)” or care for pregnancy and delivery related complications. Spending by more specific types of care is reported by category of complications. About 58.0% and 26.3% of the total bill paid for maternal health care at the BGH and by PhilHealth, respectively, was for normal deliveries; and the remaining 42% for BGH and 73.7% for PhilHealth was spent on care for complications. “Single delivery by caesarian section (O82)” was the top complication, accounting for the single largest share in 2012 at 14.9% and 26.9% of total expenditures for other maternal conditions for Baguio General Hospital and PhilHealth, respectively. The top five complications, in turn, accounted for about 55% and 50% of other maternal expenditures of the two institutions, respectively.
Average cost per case for single spontaneous delivery and for other maternal conditions were 2,753 pesos and 5,218 pesos, respectively, for BGH and 8,004 pesos and 22,606 pesos, respectively, for PhilHealth. The care for other maternal conditions or the care for complications, on average, was found to be more costly compared to the care for normal births. Average expenditures per case for Baguio General Hospital were generally lower compared to those for PhilHealth since the latter covered cost of care in private hospitals.
Who are providing inpatient/hospital-based maternal health care?
Based on PhilHealth data, about 50% of maternal cases went to government hospitals, 37% to private hospitals and the remaining 13% to government and private maternity centers; but in terms of maternal care expenditures, the shares were 30% government hospitals, 64% private hospitals and 6% maternity centers. Thus, the averages of cost of both spontaneous deliveries and cases with complications were higher in private compared to government hospitals. Single spontaneous delivery cases accounted for
Page 25 of 28
about 95% of maternal cases that went to maternity centers and primary hospitals, and about 40% of maternal cases that went to secondary and tertiary hospitals. In terms of cases with complications, about 98% of these went to secondary and tertiary hospitals. An area to be explored is whether the structure of service utilization (services and provider) consistent with changing causes of maternal mortality. Another area to be explored is whether the delivery system able to deal with complications effectively in the level and type of facility where the cases are handled.
Who are using inpatient/hospital-based maternal health care (by age and region)?
Maternal cases were found to be mostly between the ages 15 to 45 years: the number of cases increasing with age; reaching the highest number of cases at ages 22 years for BGH and 29 years for PhilHealth; and then decreasing thereafter towards the older ages. Less than 1% of cases were either very young (10-14 years) or older than 45 years (46-55 years). The proportions with complications at each age increases with age, reflecting increasing risk of complications the older the mother: about 20% of maternal cases at ages 15-19 and about 80% of cases by age 45 years. Average expenditures per case for single spontaneous deliveries and for cases with complications both increase with age; average expenditures is also high at very young ages, 10-14 years.
The distributions of all maternal cases and expenditures by region to a large extent reflect each region’s relative population size. Based on PhilHealth data, the NCR, Region 3 and Calabarzon (the top 3 largest regions in terms of population size) account for the highest proportions of maternal cases (totaling 36%) and expenditures (totaling46%) in the country. ARMM, Region 9 and CARAGA (the smallest regions in terms of population size) account for the lowest proportions of maternal cases (totaling 5.4%) and expenditures (totaling 3.8%). The highest average expenditures for both single spontaneous delivery and cases with complications were found in the NCR, while the lowest averages were found in Region 10.
Page 26 of 28
References
Department of Health (2000). 2000 Philippine Health Statistics. Manila: DOH, National
Epidemiology Center.
Department of Health (2005). 2005 Philippine Health Statistics. Manila: DOH, National
Epidemiology Center.
Department of Health (2009). 2009 Philippine Health Statistics. Manila: DOH, National
Epidemiology Center.
Department of Health (2013a). 2013 Philippine Health Statistics. Manila: DOH, National
Epidemiology Center.
Department of Health (2013b). Field Health Service Information System Annual Report 2013.
Manila: DOH, National Epidemiology Center.
Department of Health (2012). National Objectives for Health 2011-2016. Manila: DOH, Health
Sector Reform Monograph No. 12, July 2012.
Organization for Economic Cooperation and Development (OECD), Eurostat and World Health
Organization (WHO) (2011). A System of Health Accounts 2011. OECD Publishing, 2011.
Philippine Statistics Authority (PSA) and ICF International (2014). Philippines National
Demographic and Health Survey 2013. Manila, Philippines, and Maryland, USA: PSA and
ICF International, August 2014.
Racelis, R.H., F.V.N. Dy-Liacco, L.C. David and L. Nievera (2014). Health Accounts Estimates of
the Philippines for CY2012 Based on the 2011 System of Health Accounts: Tables, Data
Sources, Estimates and Analysis. Posted on the DOH Integrated eLibrary System.
http://elibrary.doh.gov.ph/InmagicGenie/opac_report.aspx?ReportName=OpacBrief&AC=Q
BE_QUERY&Type=opac
Racelis, Rachel H., Fe Vida N. Dy-Liacco, Alejandro N. Herrin, Lilibeth C. David, Lucille Nievera
and Laurita Mendoza (2016). “Philippine Health Accounts Based on the 2011 System of
Health Accounts for CY 2012 (Revised), 2013 and 2014 (Provisional): Tables, Estimates
and Analysis”, Manila: Department of Health Central ELibrary, January 2016.
http://elibrary.doh.gov.ph/InmagicGenie/DocumentFolder/e000243.pdf
United Nations (2015), General Assembly, 69th Session, 12 August 2015. “Draft outcome document
of the United Nations summit for the adoption of the post-2015 development agenda.”
http://www.un.org/ga/search/view_doc.asp?symbol=A/69/L.85&Lang=E Accessed May
2016.
United Nations Development Programme (UNDP) (2016). Sustainable Development Goals.
http://www.undp.org/content/undp/en/home/sdgoverview/post-2015-development-agenda
Accessed May 2016.
World Health Organization (WHO) (2011). International Statistical Classification of Diseases and
Related Health Problems –10th Revision, Edition 2010. Geneva: WHO Press, 2011.
Page 27 of 28
Appendix
Grouping of maternal conditions by ICD-10 codes (with descriptions of conditions)
Group1: Single spontaneous delivery (O80)
"O80","Single spontaneous delivery"
Group2: Abnormal conception (O00-O02)
"O00","Ectopic pregnancy"
"O01","Hydatidiform mole"
"O02","Other abnormal products of conception"
Group 3: Abortions (O03-O08)
"O03","Spontaneous abortion"
"O04","Medical abortion"
"O05","Other abortion"
"O06","Unspecified abortion"
"O07","Failed attempted abortion"
"O08","Complications following abortion and ectopic and molar pregnancy"
Group 4: Maternal hypertension (O10-O16)
"O10","Pre-existing hypertension complicating pregnancy, childbirth and the"
"O11","Pre-existing hypertensive disorder with superimposed proteinuria"
"O12","Gestational [pregnancy-induced] oedema and proteinuria"
"O13","Gestational [pregnancy-induced] hypertension without significant"
"O14","Gestational [pregnancy-induced] hypertension with significant"
"O15","Eclampsia"
"O16","Unspecified maternal hypertension"
Group 5: Hemorrhage in early pregnancy (O20)
"O20","Haemorrhage in early pregnancy"
Group 6: Excessive vomiting, diabetes, etc. (O21-O29)
"O21","Excessive vomiting in pregnancy"
"O22","Venous complications in pregnancy"
"O23","Infections of genitourinary tract in pregnancy"
"O24","Diabetes mellitus in pregnancy"
"O25","Malnutrition in pregnancy"
"O26","Maternal care for other conditions predominantly related to pregnancy"
"O28","Abnormal findings on antenatal screening of mother"
"O29","Complications of anaesthesia during pregnancy"
Group 7: Fetal problems (O30-O36)
"O30","Multiple gestation"
"O31","Complications specific to multiple gestation"
"O32","Maternal care for known or suspected malpresentation of fetus"
"O33","Maternal care for known or suspected disproportion"
"O34","Maternal care for known or suspected abnormality of pelvic organs"
"O35","Maternal care for known or suspected fetal abnormality and damage"
"O36","Maternal care for other known or suspected fetal problems"
Page 28 of 28
Group 8: Plantental disorders, etc. (O40-O48)
"O40","Polyhydramnios"
"O41","Other disorders of amniotic fluid and membranes"
"O42","Premature rupture of membranes"
"O43","Placental disorders"
"O44","Placenta praevia"
"O45","Premature separation of placenta [abruptio placentae]"
"O46","Antepartum haemorrhage, not elsewhere classified"
"O47","False labour"
"O48","Prolonged pregnancy"
Group 9: Labor/delivery complications (O60-O71, O73-O73)
"O60","Preterm delivery"
"O61","Failed induction of labour"
"O62","Abnormalities of forces of labour"
"O63","Long labour"
"O64","Obstructed labour due to malposition and malpresentation of fetus"
"O65","Obstructed labour due to maternal pelvic abnormality"
"O66","Other obstructed labour"
"O67","Labour and delivery complicated by intrapartum haemorrhage"
"O68","Labour and delivery complicated by fetal stress [distress]"
"O69","Labour and delivery complicated by umbilical cord complications"
"O70","Perineal laceration during delivery"
"O71","Other obstetric trauma"
"O73","Retained placenta and membranes, without haemorrhage"
"O74","Complications of anaesthesia during labour and delivery"
"O75","Other complications of labour and delivery, not elsewhere classified"
Group 10: Postpartum hemorrhage (O72)
"O72","Postpartum haemorrhage"
Group 11: Assisted, multiple delivery (O81-O84)
"O81","Single delivery by forceps and vacuum extractor"
"O82","Single delivery by caesarean section"
"O83","Other assisted single delivery"
"O84","Multiple delivery"
Group 12: Puerperium complications, etc. (O85-O99)
"O85","Puerperal sepsis"
"O86","Other puerperal infections"
"O87","Venous complications in the puerperium"
"O88","Obstetric embolism"
"O89","Complications of anaesthesia during the puerperium"
"O90","Complications of the puerperium, not elsewhere classified"
"O91","Infections of breast associated with childbirth"
"O92","Other disorders of breast and lactation associated with childbirth"
"O95","Obstetric death of unspecified cause"
"O96","Death from any obstetric cause occurring more than 42 days"
"O97","Death from sequelae of direct obstetric causes"
"O98","Maternal infectious and parasitic diseases classifiable elsewhere"
"O99","Other maternal diseases classifiable elsewhere”