13th national convention on statistics (ncs) edsa shangri ... 3-2 determination of... · this is a...
TRANSCRIPT

Page 1 of 20
13th National Convention on Statistics (NCS) EDSA Shangri-La Hotel, Mandaluyong City
October 3-4, 2016
DETERMINATION OF HOUSING ACQUISITION CAPACITY OF HOUSEHOLDS LIVING IN UNACCEPTABLE HOUSING UNITS AND HOUSEHOLDS
WITH RISKS OF EVICTION
by
Eleanore V. Ramos, Maria Praxedes R. Peña, Faith Lea B. Cabrera
For additional information, please contact:
Author’s name Eleanore V. Ramos Designation Statistician III
Research and Information Technology Division Philippine Statistical Research and Training Institute Address J&S Building, 104 Kalayaan Avenue, Diliman, Quezon City 1101
Tel. no. (+632) 4260620 E-mail [email protected]

Page 2 of 20
Determination of Housing Acquisition Capacity of Households
Living in Unacceptable Housing Units and Households with Risks of Eviction
by
Eleanore V. Ramos, Maria Praxedes R. Peña, Faith Lea B. Cabrera
e-mail: [email protected], [email protected],
Housing or shelter is considered as a basic need. The government continually pursues decent housing accessibility of its citizens. Using the 2010 Census of Population and Housing results, the Housing and Urban Development Council and Philippine Statistical Research and Training Institute developed a housing needs framework that identified four types of unacceptable housing units: homeless or not meant for human habitation; dilapidated; marginal; and, rent free lots without consent of owner.
Since the 2010 CPH did not generate household income and expenditure data, the study was not able to estimate the investment that the government may need to subsidize decent housing acquisition of households living in unacceptable housing units.
This research used the results of the 2012 Family Income and Expenditure Survey to estimate that investment. It evaluated the incomes and expenditure of households living in marginal housing units and units on rent free lots without consent of owner in order to determine their affordability levels in acquiring decent housing.
Keywords: housing needs; rent control; housing affordability
I. Background
The universal characteristics of human needs in the modern world include adequate
water and nutritional food, protective housing, security in childhood, physical security, non-hazardous physical environment, non-hazardous work environment, good healthcare, economic security, important primary relationship, safe child bearing, basic education and safe birth control. Basic needs apply to every individual in all situations, and they are met in accordance with environmental, social, cultural, political and economic circumstances. Meeting these basic human needs keeps a man from experiencing poverty.
The Sustainable Development Goals (SDGs) are an international set of goals, targets
and indicators which aim to end poverty, fight inequality and injustice, and tackle climate change by 2030. All UN member states, including the Philippines, are expected to use this as frame for political agendas and policies in the next 15 years. These goals are meant to expand and substantiate the goals and targets, to make them more concrete, achievable and sustainable.
The right to adequate standard of living which includes adequate housing is supported in
the Goal 11 of the SDGs which aims to “make cities and human settlements inclusive, safe

Page 3 of 20
resilient and sustainable”. The target for this goal is to “ensure access for all to adequate, safe and affordable housing and basic services and upgrade slums by 2030.”
Given the dramatic growth of slums and the housing sector’s enormous impact on
economies, asset building and individual wellbeing, it is clear though that housing must remain a priority if we are to build a more sustainable and prosperous future.
The Philippines is one of the developing countries that is experiencing the rapid growth
of cities coupled with increasing rural to urban migration giving birth to mega-cities. Extreme poverty is often concentrated in these mega-cities or urban spaces, and national and city governments struggle to accommodate the rising population in these areas.
Given the commitment of the Philippines through the SDGs, the HUDCC and key shelter
agencies give priority to households who are subject for eviction and eventually relocation from government lands and privately-owned properties.
In addition, the Philippines already have existing laws that may govern how this can be
done. The Urban Development and Housing Act or Republic Act No. 7279 of 1992, more commonly referred to as UDHA and one of the key shelter laws, aims to “uplift the conditions of the underprivileged and homeless citizens in urban areas and in resettlement areas by making available to them decent housing at affordable cost, basic services, and employment opportunities”.
Hence for the PSRTI 2016 research study on estimating housing needs, an
improvement was made on the detailed items of Accumulated or Current Needs by separating the households with tenure of “rent-free without consent of the lot owner” from the bulk of unacceptable type of housing. This particular group is quite important to shelter agencies because these are the households who are subject for eviction and eventually relocation from government lands and privately-owned properties.
This paper will use the estimates of housing needs from the PSRTI 2016 research study
and the results of the 2012 Family Income and Expenditure Survey to estimatethe investment that the government may need to subsidize decent housing acquisition of households living in unacceptable housing units.
The framework in determining the number of households living in unacceptable housing
unitsand households subject for eviction follow the framework used in the estimating the housing needs of PSRTI 2016 research study. This framework is basically an adaptation of the UN Component Method of Estimating Housing Needs.
It should also be noted that data were hierarchically extracted in estimating the housing
needs for the 2016 PSRTI research. The hierarchy of data extraction is as follows:
A. Accumulated Needs 1. HHs in Unacceptable Housing Units
a. Rent-free w/o consent of owner b. Makeshift/salvaged materials c. Homeless d. Dilapidated/ condemned
2. Doubled-up HHs in Acceptable Hus
Page 4 of 20
B. Future/Recurrent Needs
1. Allowance for Inventory losses 2. Increase in HHs (likely to afford to own acceptable HU)
C. Housing Needs Estimate
Understanding the hierarchy of data extraction and the framework used in estimating the housing needs of PSRTI 2016 research study is important because this helps explain why HUDCC and key shelter agencies give priority to households living in unacceptable housing units and households with risks of eviction. This is also consistent to the efforts needed to fulfil the target for SGD goal 11.
The following formula shows how the housing needs in the 2016 PSRTI research study
is computed and what are its components:
Housing Needs = Accumulated or Current Needs + Future or Recurrent Needs where Accumulated Housing needs is computed as follows: Accumulated Housing needs = A1 + A2 where A1 = Number of households living in unacceptable housing units; and A2 = Number of doubled-up households in acceptable HUs. but A1 is composed of the following: • Number of households living in rent-free housing units without consent of
owner; • Number of households living in barong-barong or makeshift/salvaged
materials; • Number of households who are homeless; • Number of households living in dilapidated/condemned housing unit and A2 is composed of the following: • Number of Housing Units (HUs) required for new households; and • Number of HUs to replace housing units lost due to obsolescence, floods,
fire, slum clearance, urban renewal, construction of highways, etc. while Future or Recurrent Needs is computed as follows: Future or Recurrent Needs = F1 + F2 where F1 = Number of HUs as allowance for Inventory losses; and F2 = Number of HUs need for increase in HHs (likely to afford to own
acceptable HUs)
Page 5 of 20
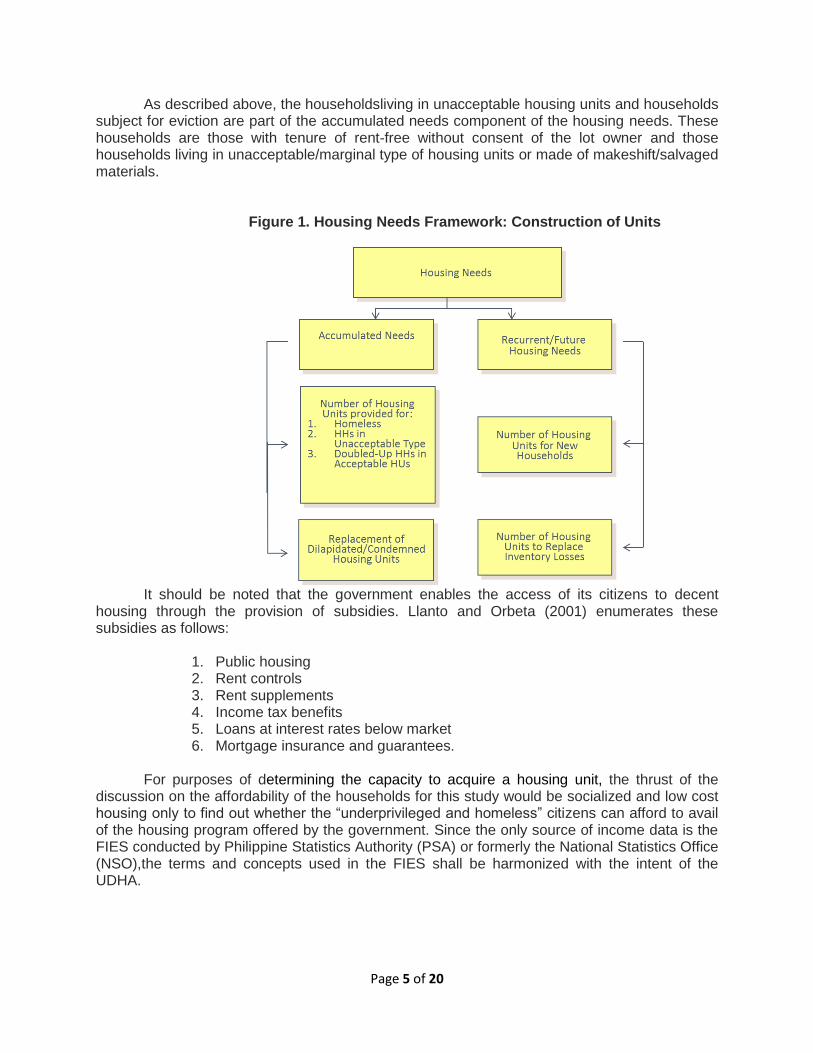
As described above, the householdsliving in unacceptable housing units and households subject for eviction are part of the accumulated needs component of the housing needs. These households are those with tenure of rent-free without consent of the lot owner and those households living in unacceptable/marginal type of housing units or made of makeshift/salvaged materials.
Figure 1. Housing Needs Framework: Construction of Units
It should be noted that the government enables the access of its citizens to decent
housing through the provision of subsidies. Llanto and Orbeta (2001) enumerates these subsidies as follows:
1. Public housing 2. Rent controls 3. Rent supplements 4. Income tax benefits 5. Loans at interest rates below market 6. Mortgage insurance and guarantees.
For purposes of determining the capacity to acquire a housing unit, the thrust of the
discussion on the affordability of the households for this study would be socialized and low cost housing only to find out whether the “underprivileged and homeless” citizens can afford to avail of the housing program offered by the government. Since the only source of income data is the FIES conducted by Philippine Statistics Authority (PSA) or formerly the National Statistics Office (NSO),the terms and concepts used in the FIES shall be harmonized with the intent of the UDHA.
Page 6 of 20
II. Objectives Estimate the investment needed to assist families that are considered to have housing
needs (NCR, Urban, Rural). Specifically it shall:
1. Evaluate incomes of families considered to have housing needs 2. Determine which items have the highest share in the expenditure share of families
considered to have housing needs 3. Estimate monthly savings of families that of families considered to have housing
needs 4. Compare savings, amount of decent housing units – socialized, low cost and
medium cost – and loanable amount being provided by housing finance institutions.
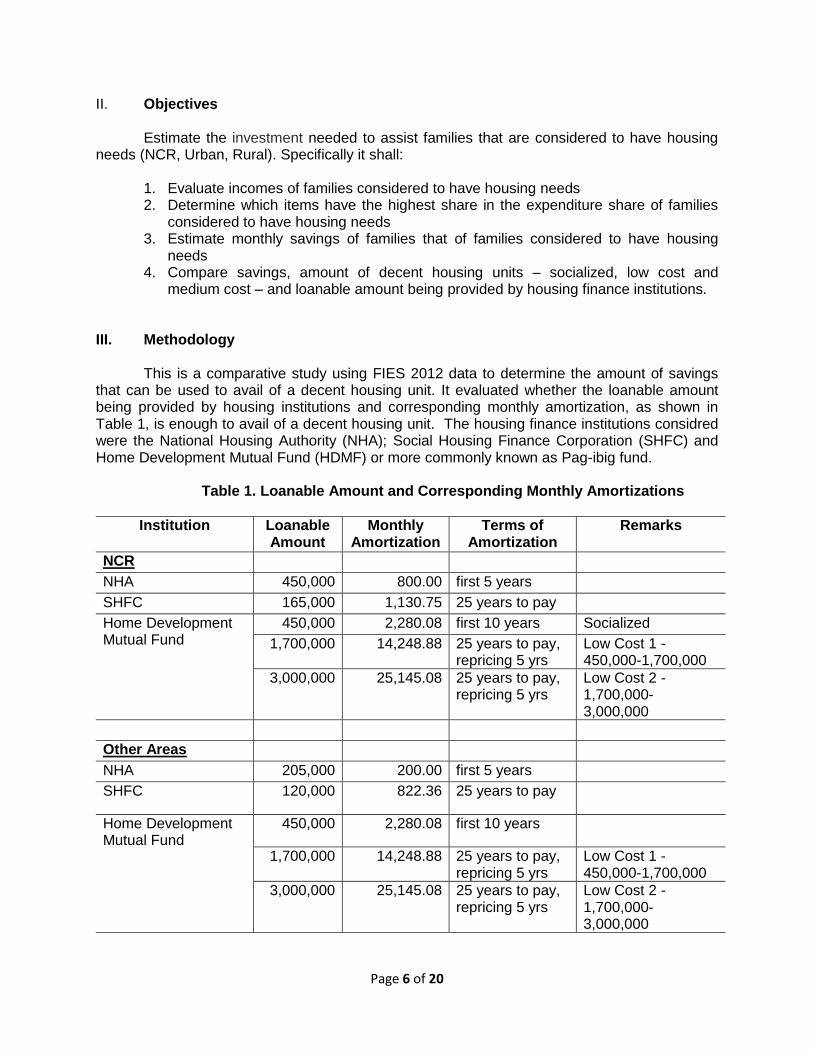
III. Methodology This is a comparative study using FIES 2012 data to determine the amount of savings
that can be used to avail of a decent housing unit. It evaluated whether the loanable amount being provided by housing institutions and corresponding monthly amortization, as shown in Table 1, is enough to avail of a decent housing unit. The housing finance institutions considred were the National Housing Authority (NHA); Social Housing Finance Corporation (SHFC) and Home Development Mutual Fund (HDMF) or more commonly known as Pag-ibig fund.
Table 1. Loanable Amount and Corresponding Monthly Amortizations
Institution Loanable Amount
Monthly Amortization
Terms of Amortization
Remarks
NCR
NHA 450,000 800.00 first 5 years
SHFC 165,000 1,130.75 25 years to pay
Home Development Mutual Fund
450,000 2,280.08 first 10 years Socialized
1,700,000 14,248.88 25 years to pay, repricing 5 yrs
Low Cost 1 - 450,000-1,700,000
3,000,000 25,145.08 25 years to pay, repricing 5 yrs
Low Cost 2 - 1,700,000-3,000,000
Other Areas
NHA 205,000 200.00 first 5 years
SHFC 120,000 822.36 25 years to pay
Home Development Mutual Fund
450,000 2,280.08 first 10 years
1,700,000 14,248.88 25 years to pay, repricing 5 yrs
Low Cost 1 - 450,000-1,700,000
3,000,000 25,145.08 25 years to pay, repricing 5 yrs
Low Cost 2 - 1,700,000-3,000,000

Page 7 of 20
The study consider the three areas.
1. NCR – since this is where most of the informal settlers families can be located 2. Urban – since the rate of development is different between urban and rural
areas. Barangays are considered urban if it has any of the following: with population size of 5,000 or more; with at least one establishment with a minimum of 100 employees; with five or more establishments with 10 to 99 employees, and five or more facilities within the two-kilometer radius from the barangay hall.
3. Rural – some housing units that may be considered as unacceptable in urban areas may be acceptable in a rural areas. Barangays that could not be classified as urban are considered rural.
The three types of housing units studied were:
1. Socialized – PHP 450,000.00 and belowper HUDCC MC No. 1, Feb. 19, 2014 2. Low-cost –
a. Level 1 = above PHP 450,000.00* to PHP 1,700,000.00** (BP 220 standard)per HUDCC MC No. 2, Jun. 8, 2015;
b. Level 2 = above PHP 1,700,000.00 to PHP 3,000,000.00 (PD 957 standard);
Only two of the housing needs indicators mentioned in the framework can be readily are
found in FIES 2012 – rent-free lot without consent of owner and marginal housing units. These were extracted hierarchically to avoid double counting since they are presumed to have overlaps. These can be defined as follows:
1. Rent free lot without consent of owner – This is based on tenure status of lot of
the family or household. Non-ownership of the lot can be reason enough for eviction. This is further magnified by the fact that the household was not able to get consent from the lot owner
a. Own house in rent free lot without consent of owner – materials used for the building of the house was shouldered by the family.
b. Rent free house and lot without consent of owner – the family used an existing structure or housing unit
2. Marginal housing unit – This is based on the construction materials of the housing unit.
a. Roof and walls made of salvaged materials – both the roof and walls were made of salvaged materials
b. Roof made of salvaged materials – the roof was made of salvaged materials but the walls may be built with strong or light materials
c. Walls made of salvaged materials – the roof may be built with strong or light materials but the walls was made of salvaged materials
IV. Results and Discussions
NCR Tables 2 shows that most of those that live in unacceptable housing in NCR own their
house despite living in a rent-free lot without consent of owner. The highest number is reported
Page 8 of 20
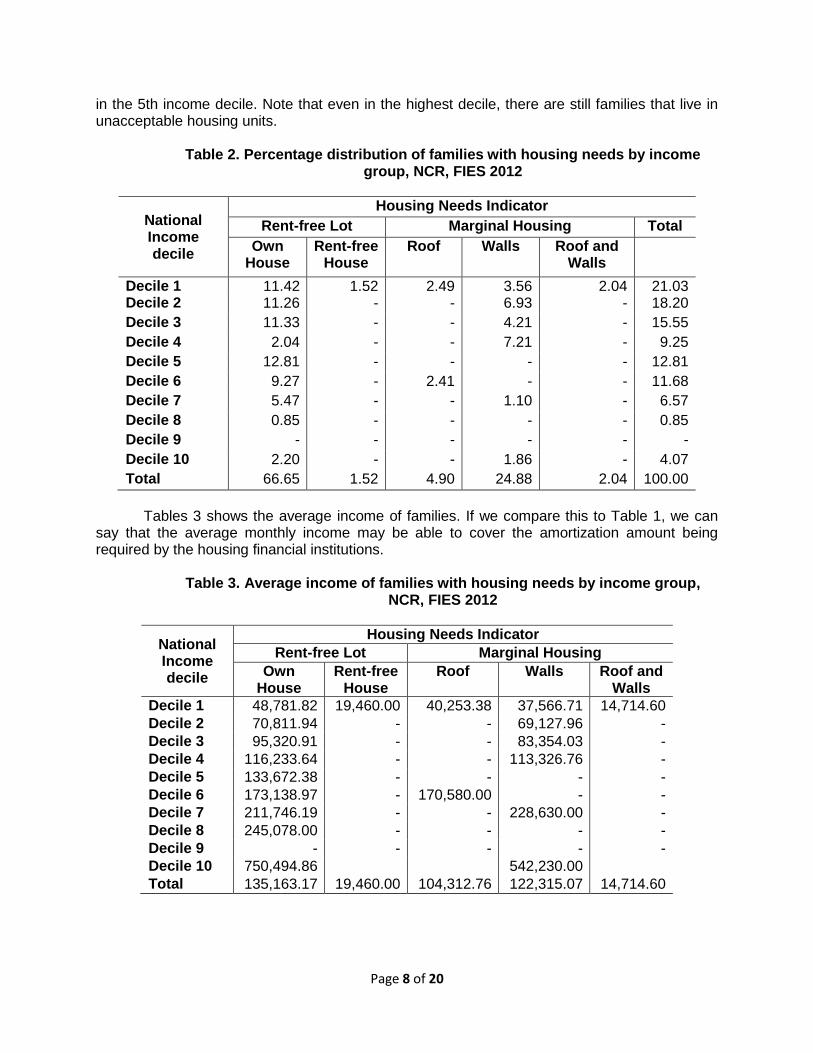
in the 5th income decile. Note that even in the highest decile, there are still families that live in unacceptable housing units.
Table 2. Percentage distribution of families with housing needs by income
group, NCR, FIES 2012
National Income decile
Housing Needs Indicator
Rent-free Lot Marginal Housing Total
Own House
Rent-free House
Roof Walls Roof and Walls
Decile 1 11.42 1.52 2.49 3.56 2.04 21.03 Decile 2 11.26 - - 6.93 - 18.20
Decile 3 11.33 - - 4.21 - 15.55
Decile 4 2.04 - - 7.21 - 9.25
Decile 5 12.81 - - - - 12.81
Decile 6 9.27 - 2.41 - - 11.68
Decile 7 5.47 - - 1.10 - 6.57
Decile 8 0.85 - - - - 0.85
Decile 9 - - - - - -
Decile 10 2.20 - - 1.86 - 4.07
Total 66.65 1.52 4.90 24.88 2.04 100.00
Tables 3 shows the average income of families. If we compare this to Table 1, we can
say that the average monthly income may be able to cover the amortization amount being required by the housing financial institutions.
Table 3. Average income of families with housing needs by income group,
NCR, FIES 2012
National Income decile
Housing Needs Indicator
Rent-free Lot Marginal Housing
Own House
Rent-free House
Roof Walls Roof and Walls
Decile 1 48,781.82 19,460.00 40,253.38 37,566.71 14,714.60
Decile 2 70,811.94 - - 69,127.96 -
Decile 3 95,320.91 - - 83,354.03 -
Decile 4 116,233.64 - - 113,326.76 -
Decile 5 133,672.38 - - - -
Decile 6 173,138.97 - 170,580.00 - -
Decile 7 211,746.19 - - 228,630.00 -
Decile 8 245,078.00 - - - -
Decile 9 - - - - -
Decile 10 750,494.86 542,230.00
Total 135,163.17 19,460.00 104,312.76 122,315.07 14,714.60
Page 9 of 20
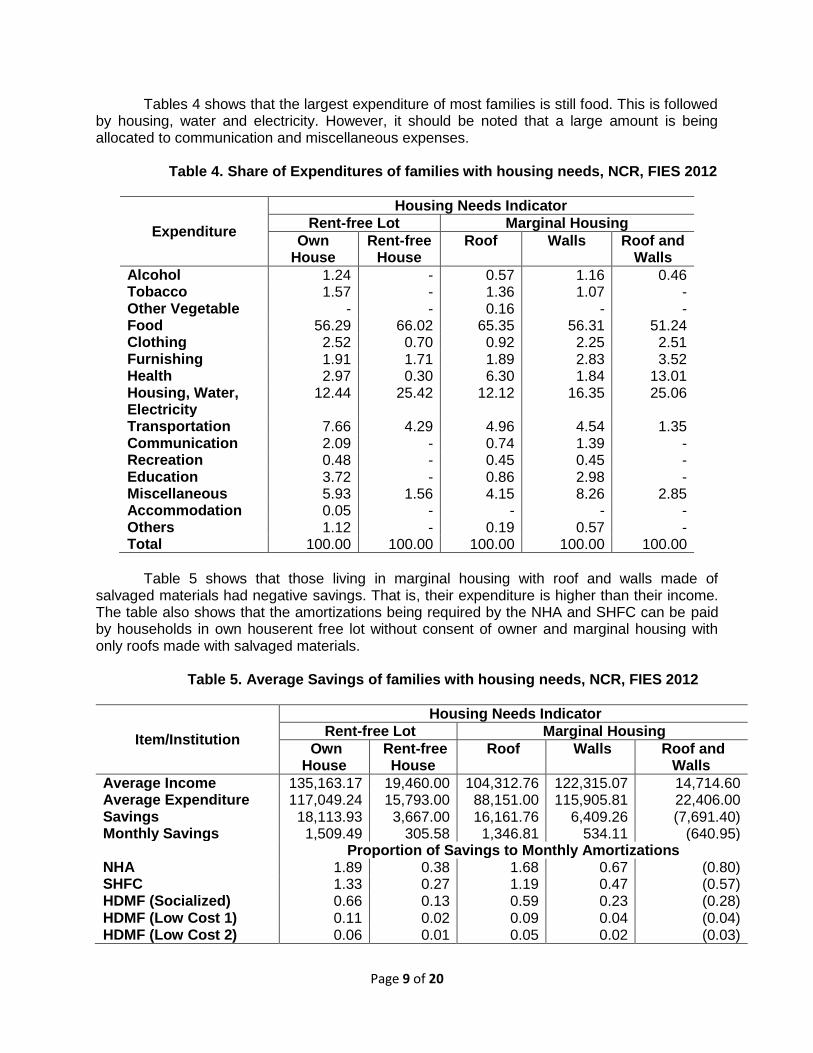
Tables 4 shows that the largest expenditure of most families is still food. This is followed by housing, water and electricity. However, it should be noted that a large amount is being allocated to communication and miscellaneous expenses.
Table 4. Share of Expenditures of families with housing needs, NCR, FIES 2012
Expenditure
Housing Needs Indicator
Rent-free Lot Marginal Housing
Own House
Rent-free House
Roof Walls Roof and Walls
Alcohol 1.24 - 0.57 1.16 0.46 Tobacco 1.57 - 1.36 1.07 - Other Vegetable - - 0.16 - - Food 56.29 66.02 65.35 56.31 51.24 Clothing 2.52 0.70 0.92 2.25 2.51 Furnishing 1.91 1.71 1.89 2.83 3.52 Health 2.97 0.30 6.30 1.84 13.01 Housing, Water, Electricity
12.44 25.42 12.12 16.35 25.06
Transportation 7.66 4.29 4.96 4.54 1.35 Communication 2.09 - 0.74 1.39 - Recreation 0.48 - 0.45 0.45 - Education 3.72 - 0.86 2.98 - Miscellaneous 5.93 1.56 4.15 8.26 2.85 Accommodation 0.05 - - - - Others 1.12 - 0.19 0.57 - Total 100.00 100.00 100.00 100.00 100.00
Table 5 shows that those living in marginal housing with roof and walls made of
salvaged materials had negative savings. That is, their expenditure is higher than their income. The table also shows that the amortizations being required by the NHA and SHFC can be paid by households in own houserent free lot without consent of owner and marginal housing with only roofs made with salvaged materials.
Table 5. Average Savings of families with housing needs, NCR, FIES 2012
Item/Institution
Housing Needs Indicator
Rent-free Lot Marginal Housing
Own House
Rent-free House
Roof Walls Roof and Walls
Average Income 135,163.17 19,460.00 104,312.76 122,315.07 14,714.60 Average Expenditure 117,049.24 15,793.00 88,151.00 115,905.81 22,406.00 Savings 18,113.93 3,667.00 16,161.76 6,409.26 (7,691.40) Monthly Savings 1,509.49 305.58 1,346.81 534.11 (640.95)
Proportion of Savings to Monthly Amortizations
NHA 1.89 0.38 1.68 0.67 (0.80) SHFC 1.33 0.27 1.19 0.47 (0.57) HDMF (Socialized) 0.66 0.13 0.59 0.23 (0.28) HDMF (Low Cost 1) 0.11 0.02 0.09 0.04 (0.04) HDMF (Low Cost 2) 0.06 0.01 0.05 0.02 (0.03)

Page 10 of 20
Item/Institution
Housing Needs Indicator
Rent-free Lot Marginal Housing
Own House
Rent-free House
Roof Walls Roof and Walls
Note: The Monthly amortizations are: NHA - 800.00; SHFC - 1,130.75; HDMF (Socialized) 2,280.08; HDMF (Low Cost 1) 14,248.88; HDMF (Low Cost 2) 25,145.08
Table 6 only considered those that had a negative difference between their savings and
the monthly amortizations. This will mean that help will only be given to those who really can’t afford monthly amortizations. The subsidy is lowest if the loan is from the NHA.
Table 6. Financial support needed by families with housing needs to pay
monthly amortizations to acquire a house, NCR
Item/Institution
Housing Needs Indicator
Total Rent-free Lot Marginal Housing
Own House Rent-free House
Roof Walls Roof and Walls
Families w/ HN 28,099 640 2,067 10,488 862
NHA Difference 709.49 (494.42) 546.81 (265.89) (1,440.95) 4,347,632.42
Subsidy - 316,639.81 - 2,788,812.01 1,242,180.60 SHFC
Difference 378.74 (825.17) 216.06 (596.64) (1,771.70) 8,313,618.50
Subsidy - 528,462.40 - 6,257,850.31 1,527,305.79 HDMF (Socialized)
Difference (770.59) (1,974.50) (933.27) (1,745.97) (2,921.03) 45,676,464.48
Subsidy 21,652,679.93 1,264,529.07 1,928,679.21 18,312,483.08 2,518,093.19 HDMF (Low Cost 1)
Difference (12,739.39) (13,943.30) (12,902.07) (13,714.77) (14,889.83) 550,238,913.58
Subsidy 357,963,991.13 8,929,720.82 26,663,281.60 143,846,045.00 12,835,875.02 HDMF (Low Cost 2)
Difference (23,635.59) (24,839.50) (23,798.27) (24,610.97) (25,786.03) 1,009,584,324.81
Subsidy 664,136,314.93 15,907,986.17 49,181,259.56 258,129,749.08 22,229,015.06
Urban
Table7s 7 shows that most of those that live in unacceptable housing in urban areas also own their house despite living in a rent-free lot without consent of owner. The highest number of families living in unacceptable housing units may be found in the 7th income decile. Same as with NCR, even the highest decile have families that live in unacceptable housing units.
Table 7. Percentage distribution of families with housing needs by income group, Urban Areas except NCR, FIES 2012
National Income decile
Housing Needs Indicator
Rent-free Lot Marginal Housing Total
Own House
Rent-free
House
Roof Walls Roof and
Walls
Page 11 of 20
National Income decile
Housing Needs Indicator
Rent-free Lot Marginal Housing Total
Own House
Rent-free
House
Roof Walls Roof and
Walls
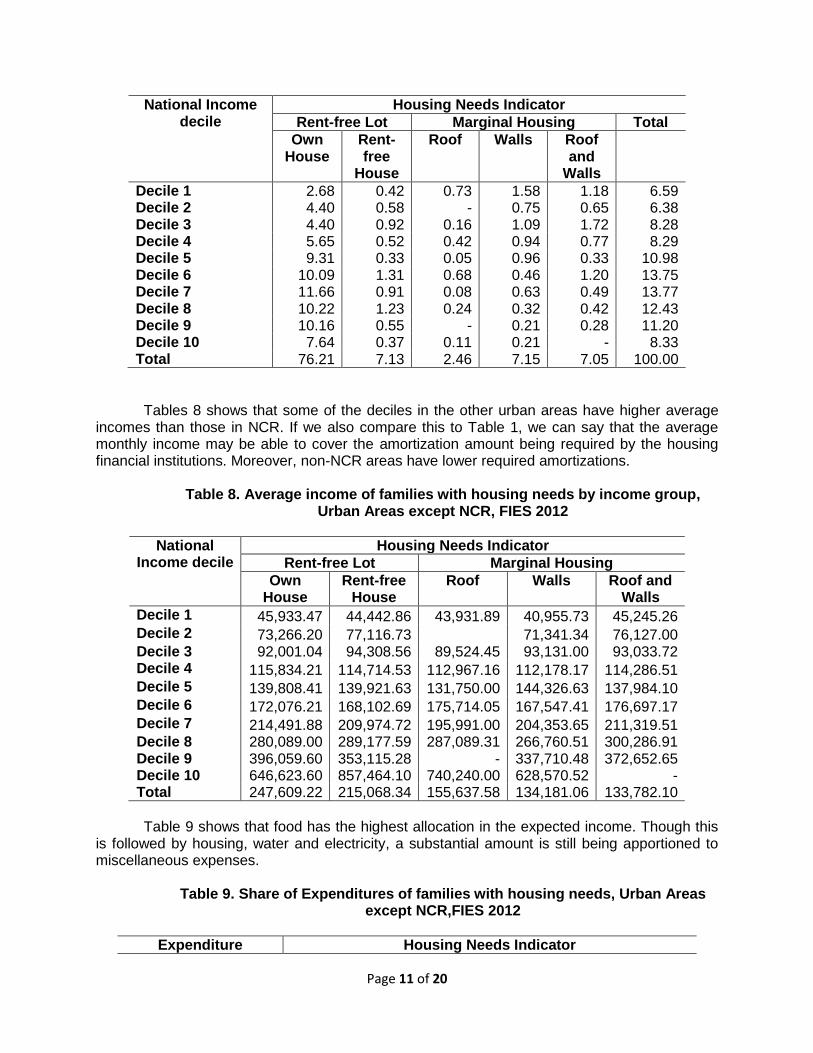
Decile 1 2.68 0.42 0.73 1.58 1.18 6.59 Decile 2 4.40 0.58 - 0.75 0.65 6.38 Decile 3 4.40 0.92 0.16 1.09 1.72 8.28 Decile 4 5.65 0.52 0.42 0.94 0.77 8.29 Decile 5 9.31 0.33 0.05 0.96 0.33 10.98 Decile 6 10.09 1.31 0.68 0.46 1.20 13.75 Decile 7 11.66 0.91 0.08 0.63 0.49 13.77 Decile 8 10.22 1.23 0.24 0.32 0.42 12.43 Decile 9 10.16 0.55 - 0.21 0.28 11.20 Decile 10 7.64 0.37 0.11 0.21 - 8.33 Total 76.21 7.13 2.46 7.15 7.05 100.00
Tables 8 shows that some of the deciles in the other urban areas have higher average incomes than those in NCR. If we also compare this to Table 1, we can say that the average monthly income may be able to cover the amortization amount being required by the housing financial institutions. Moreover, non-NCR areas have lower required amortizations.
Table 8. Average income of families with housing needs by income group,
Urban Areas except NCR, FIES 2012
National Income decile
Housing Needs Indicator
Rent-free Lot Marginal Housing
Own House
Rent-free House
Roof Walls Roof and Walls
Decile 1 45,933.47 44,442.86 43,931.89 40,955.73 45,245.26 Decile 2 73,266.20 77,116.73
71,341.34 76,127.00
Decile 3 92,001.04 94,308.56 89,524.45 93,131.00 93,033.72 Decile 4 115,834.21 114,714.53 112,967.16 112,178.17 114,286.51 Decile 5 139,808.41 139,921.63 131,750.00 144,326.63 137,984.10 Decile 6 172,076.21 168,102.69 175,714.05 167,547.41 176,697.17 Decile 7 214,491.88 209,974.72 195,991.00 204,353.65 211,319.51 Decile 8 280,089.00 289,177.59 287,089.31 266,760.51 300,286.91 Decile 9 396,059.60 353,115.28 - 337,710.48 372,652.65 Decile 10 646,623.60 857,464.10 740,240.00 628,570.52 - Total 247,609.22 215,068.34 155,637.58 134,181.06 133,782.10
Table 9 shows that food has the highest allocation in the expected income. Though this
is followed by housing, water and electricity, a substantial amount is still being apportioned to miscellaneous expenses.
Table 9. Share of Expenditures of families with housing needs, Urban Areas
except NCR,FIES 2012
Expenditure Housing Needs Indicator

Page 12 of 20
Rent-free Lot Marginal Housing
Own House
Rent-free House
Roof Walls Roof and Walls
Alcohol 0.73 0.81 1.10 1.49 1.01 Tobacco 0.98 1.22 1.70 1.37 1.70 Other Vegetable 0.00 - - - - Food 46.39 47.02 52.31 55.60 56.40 Clothing 2.04 2.19 3.91 2.55 1.58 Furnishing 2.21 2.52 2.98 1.73 2.22 Health 3.15 1.28 4.47 1.95 1.49 Housing, Water, Electricity
21.37 19.76 14.16 16.15 19.35
Transportation 6.83 7.15 4.17 5.72 4.63 Communication 2.58 2.87 2.70 1.85 1.86 Recreation 1.25 1.74 0.63 1.69 0.71 Education 2.67 4.75 1.27 1.03 1.91 Miscellaneous 6.47 6.33 5.50 5.01 5.34 Accommodation 0.04 0.38 - 0.09 0.06 Others 3.28 1.99 5.10 3.76 1.75 Total 100.00 100.00 100.00 100.00 100.00
Table 10 shows that amortizations being required by the NHA and SHFC can be paid by all households in the study. However, they are still unable to pay the amortization required by the HDMF.
Table 10. Average Savings of families with housing needs, Urban Areas except
NCR, FIES 2012
Item
Housing Needs Indicator
Rent-free Lot Marginal Housing
Own House
Rent-free House
Roof Walls Roof and Walls
Average Income 247,609.22 215,068.34 155,637.58 134,181.06 133,782.10
Average Expenditure 200,755.35 176,578.69 142,848.83 116,969.71 111,841.23 Savings 46,853.87 38,489.65 12,788.75 17,211.35 21,940.87 Monthly Savings 3,904.49 3,207.47 1,065.73 1,434.28 1,828.41
Institution ProportionofSavingstoMonthlyAmortizations
NHA 19.52 16.04 5.33 7.17 9.14 SHFC 4.75 3.90 1.30 1.74 2.22 HDMF (Socialized) 1.71 1.41 0.47 0.63 0.80 HDMF (Low Cost 1) 0.27 0.23 0.07 0.10 0.13 HDMF (Low Cost 2) 0.16 0.13 0.04 0.06 0.07 Note: The Monthly amortizations are: NHA - 200.00; SHFC - 822.36; HDMF (Socialized) 2,280.08; HDMF (Low Cost 1) 14,248.88; HDMF (Low Cost 2) 25,145.08
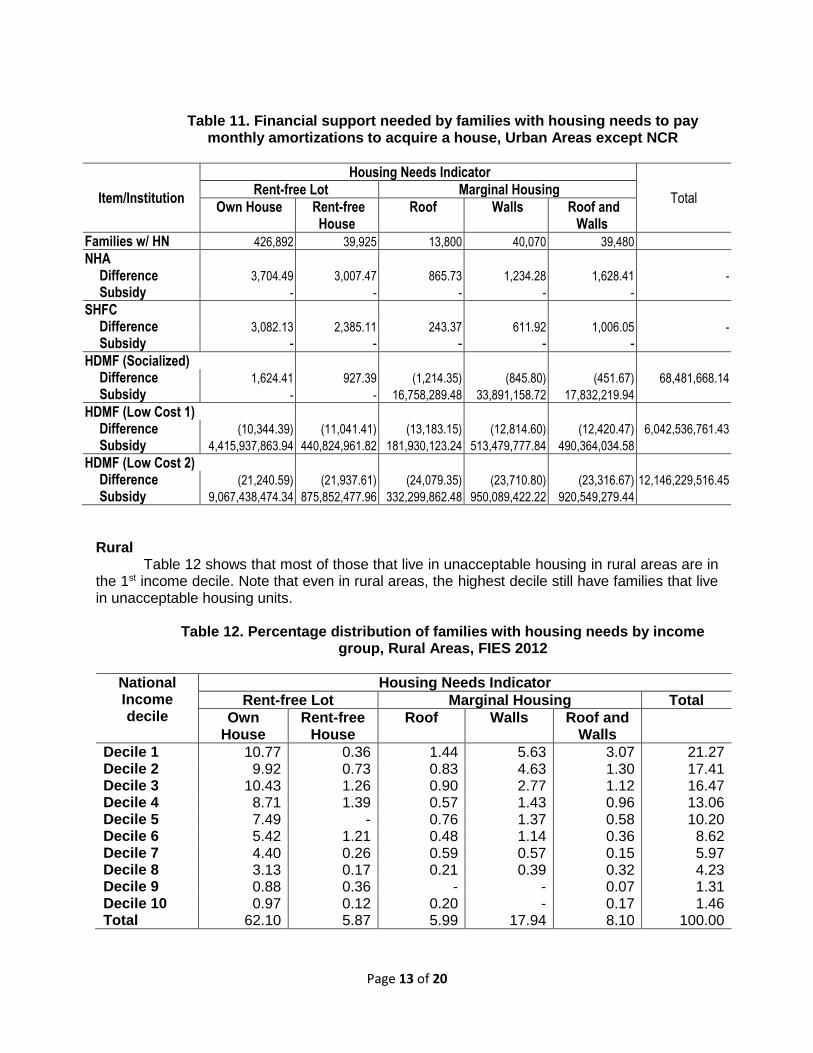
Table 11 only considered those that had a negative difference between their savings and
the monthly amortizations. This will mean that the help will only be given to those who really can’t afford the monthly amortizations. A subsidy will then be needed only if the household will avail an HDMF loan.
Page 13 of 20
Table 11. Financial support needed by families with housing needs to pay
monthly amortizations to acquire a house, Urban Areas except NCR
Item/Institution
Housing Needs Indicator
Total Rent-free Lot Marginal Housing
Own House Rent-free House
Roof Walls Roof and Walls
Families w/ HN 426,892 39,925 13,800 40,070 39,480 NHA
Difference 3,704.49 3,007.47 865.73 1,234.28 1,628.41 -
Subsidy - - - - - SHFC
Difference 3,082.13 2,385.11 243.37 611.92 1,006.05 -
Subsidy - - - - - HDMF (Socialized)
Difference 1,624.41 927.39 (1,214.35) (845.80) (451.67) 68,481,668.14
Subsidy - - 16,758,289.48 33,891,158.72 17,832,219.94 HDMF (Low Cost 1)
Difference (10,344.39) (11,041.41) (13,183.15) (12,814.60) (12,420.47) 6,042,536,761.43
Subsidy 4,415,937,863.94 440,824,961.82 181,930,123.24 513,479,777.84 490,364,034.58 HDMF (Low Cost 2)
Difference (21,240.59) (21,937.61) (24,079.35) (23,710.80) (23,316.67) 12,146,229,516.45
Subsidy 9,067,438,474.34 875,852,477.96 332,299,862.48 950,089,422.22 920,549,279.44
Rural
Table 12 shows that most of those that live in unacceptable housing in rural areas are in the 1st income decile. Note that even in rural areas, the highest decile still have families that live in unacceptable housing units.
Table 12. Percentage distribution of families with housing needs by income
group, Rural Areas, FIES 2012
National Income decile
Housing Needs Indicator
Rent-free Lot Marginal Housing Total
Own House
Rent-free House
Roof Walls Roof and Walls
Decile 1 10.77 0.36 1.44 5.63 3.07 21.27 Decile 2 9.92 0.73 0.83 4.63 1.30 17.41 Decile 3 10.43 1.26 0.90 2.77 1.12 16.47 Decile 4 8.71 1.39 0.57 1.43 0.96 13.06 Decile 5 7.49 - 0.76 1.37 0.58 10.20 Decile 6 5.42 1.21 0.48 1.14 0.36 8.62 Decile 7 4.40 0.26 0.59 0.57 0.15 5.97 Decile 8 3.13 0.17 0.21 0.39 0.32 4.23 Decile 9 0.88 0.36 - - 0.07 1.31 Decile 10 0.97 0.12 0.20 - 0.17 1.46 Total 62.10 5.87 5.99 17.94 8.10 100.00

Page 14 of 20
Tables 13 shows the average income of families in rural areas. Comparing this to Table
1, it seems thatt the average monthly income may be able to cover the amortization amount being required by the housing financial institutions.
Table 13. Average income of families with housing needs by income group,
Rural Areas, FIES 2012
National Income decile
Housing Needs Indicator
Rent-free Lot Marginal Housing
Own House
Rent-free House
Roof Walls Roof and Walls
Decile 1 47,966.96 44,995.61 51,092.61 43,740.55 34,214.95 Decile 2 71,538.20 68,736.48 69,694.45 72,278.90 73,216.12 Decile 3 92,031.80 92,981.52 90,281.18 90,443.50 91,287.19 Decile 4 114,993.87 114,085.52 109,163.76 112,822.11 114,585.73 Decile 5 137,420.99 - 141,511.04 136,806.76 138,661.43 Decile 6 172,183.29 164,177.08 169,558.98 165,727.86 169,467.63 Decile 7 212,638.85 199,608.83 208,905.99 205,966.04 202,886.00 Decile 8 286,956.07 253,532.00 299,160.12 276,420.17 268,407.07 Decile 9 403,027.26 356,273.45 - - 365,825.00 Decile 10 592,691.34 1,420,906.00 689,952.00 - 1,031,849.00 Total 127,384.58 160,459.05 131,635.10 88,931.60 107,292.04
Tables 14 shows that though the largest expenditure of most families in rural areas is
food, the amount allocated for miscellaneous expenses is higher than in urban areas.
Table 14. Share of Expenditures of families with housing needs, Rural Areas,
FIES 2012
Expenditure
Housing Needs Indicator
Rent-free Lot Marginal Housing
Own House
Rent-free House
Roof Walls Roof and Walls
Alcohol 0.82 0.69 1.18 1.30 1.47 Tobacco 1.57 1.02 1.19 1.53 1.83 Other Vegetable 0.04 0.05 0.04 0.03 0.08 Food 58.20 53.96 53.47 62.47 58.89 Clothing 2.22 2.75 2.53 2.10 2.06 Furnishing 1.83 1.82 2.52 2.14 2.13 Health 3.08 2.05 5.21 2.22 1.29 Housing, Water, Electricity
14.19 15.95 13.56 14.44 14.26
Transportation 5.69 5.22 4.67 4.64 4.24 Communication 1.97 1.82 2.23 1.19 1.04 Recreation 0.97 6.33 1.64 0.70 0.83 Education 2.51 2.12 2.34 2.17 2.43

Page 15 of 20
Miscellaneous 5.52 4.71 7.63 4.40 8.37 Accommodation 0.04 - - - - Others 1.35 1.51 1.79 0.67 1.07 Total 100.00 100.00 100.00 100.00 100.00
Table 15 shows that families living in rural areas, but in unacceptable housing units have positive savings. Only a fraction of this will be needed to acquire a decent housing unit.
Table 15. Average Savings of families with housing needs, Rural Areas, FIES
2012
Item
Housing Needs Indicator
Rent-free Lot Marginal Housing
Own House
Rent-free House
Roof Walls Roof and Walls
Average Income 127,384.58 160,459.05 131,635.10 88,931.60 107,292.04 Average Expenditure 106,086.12 111,144.68 107,510.00 82,679.61 83,767.94 Savings 21,298.46 49,314.37 24,125.10 6,251.98 23,524.10 Monthly Savings 1,774.87 4,109.53 2,010.43 521.00 1,960.34 Institution ProportionofSavingstoMonthlyAmortizations NHA 8.87 20.55 10.05 2.60 9.80 SHFC 1.57 3.63 1.78 0.46 1.73 HDMF (Socialized) 0.78 1.80 0.88 0.23 0.86 HDMF (Low Cost 1) 0.12 0.29 0.14 0.04 0.14 HDMF (Low Cost 2) 0.07 0.16 0.08 0.02 0.08 Note: The Monthly amortizations are: NHA - 200.00; SHFC - 1,130.75; HDMF (Socialized) 2,280.08; HDMF (Low Cost 1) 14,248.88; HDMF (Low Cost 2) 25,145.08
Table 16 only considered those that had a negative difference between their savings and
the monthly amortizations. This will mean that the help will only be given to those who really can’t afford the monthly amortizations. The subsidy is lowest if the housing is being availed at the National Housing Authority.
Table 16. Financial support needed by families with housing needs to pay
monthly amortizations to acquire a house,Rural Areas
Item
Housing Needs Indicator
Total Rent-free Lot Marginal Housing
Own House Rent-free House
Roof Walls Roof and Walls
Families w/ HN 193,424 18,278 18,641 55,876 25,234 NHA
Difference 1,574.87 3,909.53 1,810.43 321.00 1,760.34 -
Subsidy - - - - - SHFC
Difference 952.51 3,287.17 1,188.07 (301.36) 1,137.98 16,838,922.81
Subsidy - - - 16,838,922.81 - HDMF (Socialized)
Difference (505.21) 1,829.45 (269.65) (1,759.08) (319.74) 209,105,246.24
Subsidy 97,719,461.59 - 5,026,633.51 98,290,777.08 8,068,374.07 HDMF (Low Cost 1)

Page 16 of 20
Difference (12,474.01) (10,139.35) (12,238.45) (13,727.88) (12,288.54) 3,903,387,141.47
Subsidy 2,412,772,632.79 185,322,970.83 228,137,034.31 767,061,839.64 310,092,663.91 HDMF (Low Cost 2)
Difference (23,370.21) (21,035.55) (23,134.65) (24,624.08) (23,184.74) 7,297,042,409.69
Subsidy 4,520,359,221.59 384,479,355.95 431,253,098.51 1,375,900,090.08 585,050,643.57
V. Conclusions and Recommendations The results show that the acquisition of decent housing units may need to be advocated.
Families or households will be able to pay the amortization being required by NHA if they lessen expenditures in other items. Barring this, the government will need to invest an additional 4.35 million as additional subsidy to assist NCR families that are still unable to pay the amount being required.
HDMF amortizations is very high and households living in unacceptable type are unable
to afford them. Below is the summary of subsidies that may be required:
Table 17. Subsidies that still need to be invested to assist families unable to pay amortization amounts
Loaning Institution Subsidy Needed
NCR Urban Rural
NHA 4,347,632.42 - -
Social Housing Finance Corporation 8,313,618.50 - 16,838,922.81
HDMF (Socialized) 45,676,464.48 68,481,668.14 209,105,246.24
HDMF (Low Cost 1) 550,238,913.58 6,042,536,761.43 3,903,387,141.47
HDMF (Low Cost 2) 1,009,584,324.81 12,146,229,516.45 7,297,042,409.69
VI. References 1. “Sustainable Development Goals,ˮ http://www.un.org/sustainabledevelopment/
sustainable-development-goals/, May 2016. 2. “Medium-Term Philippine Development Plan,ˮ http://www.neda.gov.ph/wp-
content/uploads/2013/10/pdprm2011-2016.pdf, May 2016. 3. “Improved National Framework on Housing Needs and Housing Needs Estimation,”
MC Magtulis, et. al., 11th National Convention on Statistics, Manila, Philippines, 2010.
4. “Methods of Estimating Housing Needs”. Studies in Methods Series F. No. 12, United Nations, New York, 1967.
5. Family Income and Expenditure Survey 2012, National Statistics Office. 6. Final Technical Report of the research project “Development of Shelter Monitoring
and Information System,” Statistical Research and Training Center, 2010. 7. “Estimated Housing Needs based on 2010 Census of Population and Housing” MC
Magtulis and EV Ramos, 12th National Convention on Statistics, 2013. 8. “Subdivision and Condominium buyer's Protective Decree”,Presidential Decree
957,1976. 9. Batas Pambangsa 220, 1982 10. HUDCC Memorandum Circular 01, Feb. 19, 2014.
Page 17 of 20
11. HUDCC Memorandum Circular 02, Jun. 8, 2015 . 12. HUDCC Memorandum Circular 04, Sep. 27, 2006. 13. “The State of Philippine Housing Programs: A Critical Look at How Philippine
Housing Subsidies Work”, GM. Llanto and AC. Orbeta Jr., 2001. 14. “Renters: Who they are? Where they are? Are they protected by the Different Rent
Control Laws?”, MPRPeña, ZAAbanes, MC Magtulis and NR Marquez, 2014 Philippines Statistical Association Inc Annual Conference, September 2014.
15. “Housing Affordability of Prospective Beneficiaries of Government Housing Programs in the Philippines”, MDCabauatan, JE Cruz, NR Marquez, MC Magtulis, and MPRPeña, 2014 Philippines Statistical Association Inc Annual Conference, September 2014.
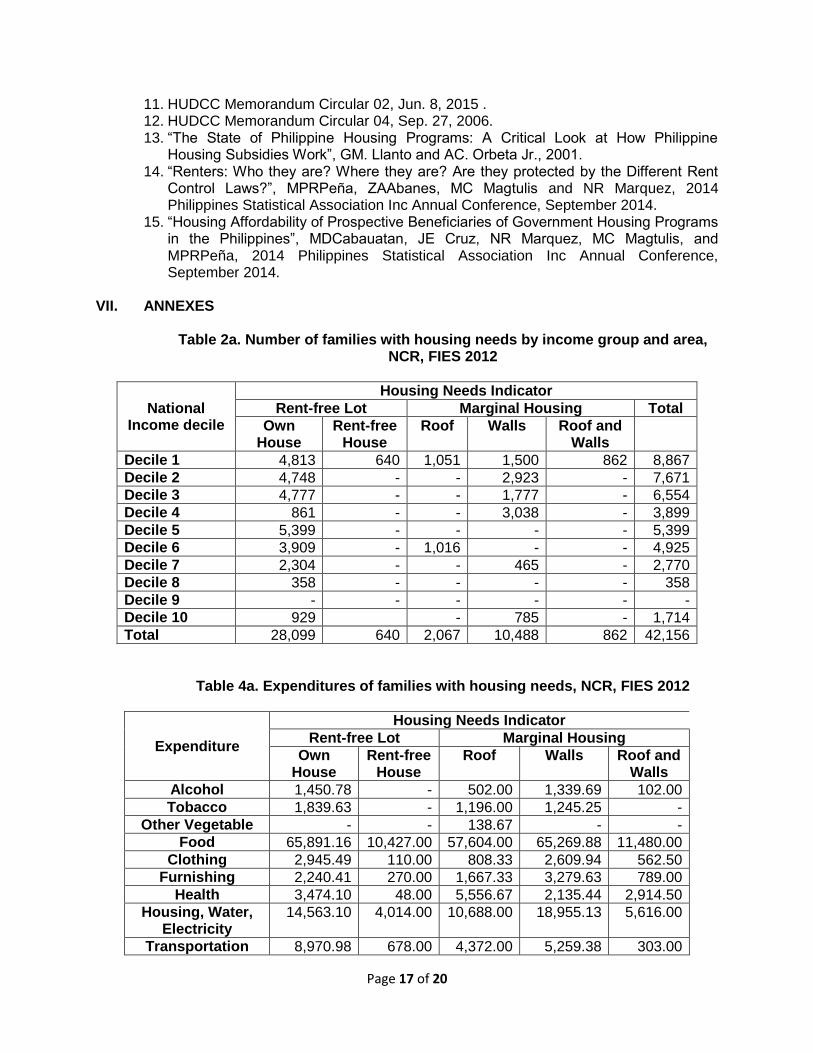
VII. ANNEXES
Table 2a. Number of families with housing needs by income group and area, NCR, FIES 2012
National Income decile
Housing Needs Indicator
Rent-free Lot Marginal Housing Total
Own House
Rent-free House
Roof Walls Roof and Walls
Decile 1 4,813 640 1,051 1,500 862 8,867
Decile 2 4,748 - - 2,923 - 7,671
Decile 3 4,777 - - 1,777 - 6,554
Decile 4 861 - - 3,038 - 3,899
Decile 5 5,399 - - - - 5,399
Decile 6 3,909 - 1,016 - - 4,925
Decile 7 2,304 - - 465 - 2,770
Decile 8 358 - - - - 358
Decile 9 - - - - - -
Decile 10 929 - 785 - 1,714
Total 28,099 640 2,067 10,488 862 42,156
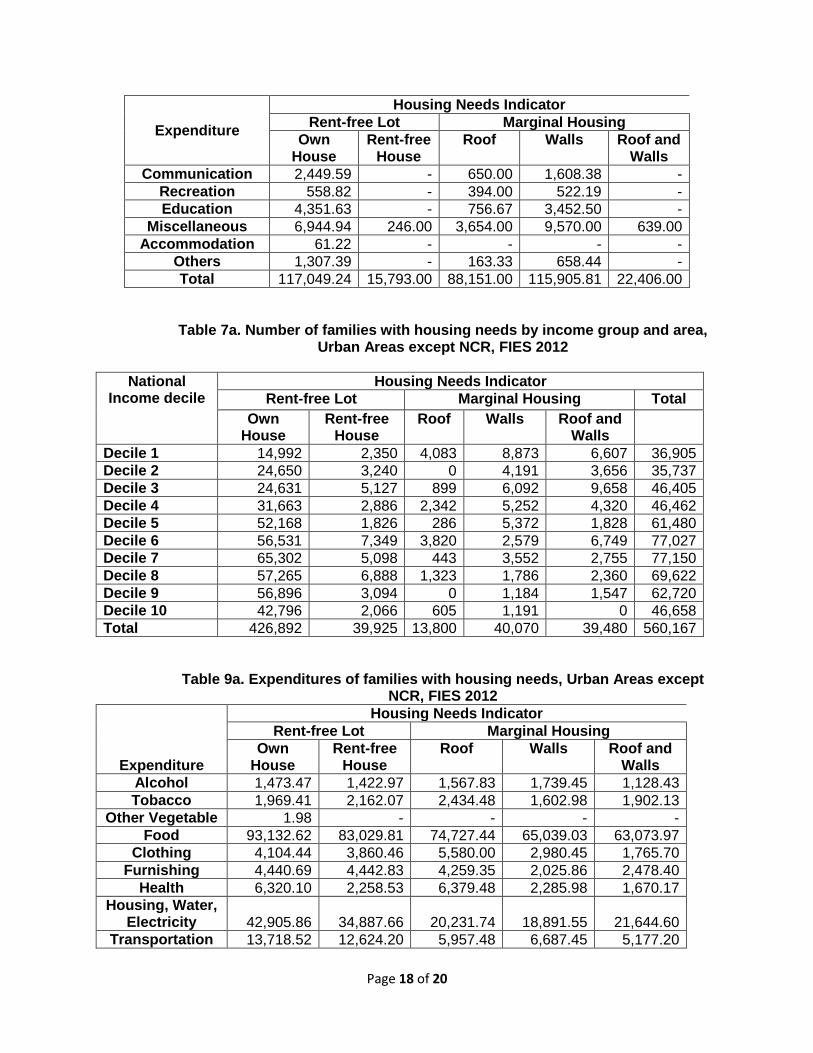
Table 4a. Expenditures of families with housing needs, NCR, FIES 2012
Expenditure
Housing Needs Indicator
Rent-free Lot Marginal Housing
Own House
Rent-free House
Roof Walls Roof and Walls
Alcohol 1,450.78 - 502.00 1,339.69 102.00
Tobacco 1,839.63 - 1,196.00 1,245.25 -
Other Vegetable - - 138.67 - -
Food 65,891.16 10,427.00 57,604.00 65,269.88 11,480.00
Clothing 2,945.49 110.00 808.33 2,609.94 562.50
Furnishing 2,240.41 270.00 1,667.33 3,279.63 789.00
Health 3,474.10 48.00 5,556.67 2,135.44 2,914.50
Housing, Water, Electricity
14,563.10 4,014.00 10,688.00 18,955.13 5,616.00
Transportation 8,970.98 678.00 4,372.00 5,259.38 303.00
Page 18 of 20
Expenditure
Housing Needs Indicator
Rent-free Lot Marginal Housing
Own House
Rent-free House
Roof Walls Roof and Walls
Communication 2,449.59 - 650.00 1,608.38 -
Recreation 558.82 - 394.00 522.19 -
Education 4,351.63 - 756.67 3,452.50 -
Miscellaneous 6,944.94 246.00 3,654.00 9,570.00 639.00
Accommodation 61.22 - - - -
Others 1,307.39 - 163.33 658.44 -
Total 117,049.24 15,793.00 88,151.00 115,905.81 22,406.00
Table 7a. Number of families with housing needs by income group and area, Urban Areas except NCR, FIES 2012
National Income decile
Housing Needs Indicator
Rent-free Lot Marginal Housing Total
Own House
Rent-free House
Roof Walls Roof and Walls
Decile 1 14,992 2,350 4,083 8,873 6,607 36,905
Decile 2 24,650 3,240 0 4,191 3,656 35,737
Decile 3 24,631 5,127 899 6,092 9,658 46,405
Decile 4 31,663 2,886 2,342 5,252 4,320 46,462
Decile 5 52,168 1,826 286 5,372 1,828 61,480
Decile 6 56,531 7,349 3,820 2,579 6,749 77,027
Decile 7 65,302 5,098 443 3,552 2,755 77,150
Decile 8 57,265 6,888 1,323 1,786 2,360 69,622
Decile 9 56,896 3,094 0 1,184 1,547 62,720
Decile 10 42,796 2,066 605 1,191 0 46,658
Total 426,892 39,925 13,800 40,070 39,480 560,167
Table 9a. Expenditures of families with housing needs, Urban Areas except NCR, FIES 2012
Expenditure
Housing Needs Indicator
Rent-free Lot Marginal Housing
Own House
Rent-free House
Roof Walls Roof and Walls
Alcohol 1,473.47 1,422.97 1,567.83 1,739.45 1,128.43
Tobacco 1,969.41 2,162.07 2,434.48 1,602.98 1,902.13
Other Vegetable 1.98 - - - -
Food 93,132.62 83,029.81 74,727.44 65,039.03 63,073.97
Clothing 4,104.44 3,860.46 5,580.00 2,980.45 1,765.70
Furnishing 4,440.69 4,442.83 4,259.35 2,025.86 2,478.40
Health 6,320.10 2,258.53 6,379.48 2,285.98 1,670.17
Housing, Water, Electricity 42,905.86 34,887.66 20,231.74 18,891.55 21,644.60
Transportation 13,718.52 12,624.20 5,957.48 6,687.45 5,177.20

Page 19 of 20
Expenditure
Housing Needs Indicator
Rent-free Lot Marginal Housing
Own House
Rent-free House
Roof Walls Roof and Walls
Communication 5,183.75 5,061.15 3,849.91 2,163.91 2,081.90
Recreation 2,505.69 3,069.80 899.35 1,978.29 792.57
Education 5,362.48 8,394.63 1,820.43 1,209.92 2,134.25
Miscellaneous 12,986.83 11,172.81 7,858.96 5,856.09 5,967.50
Accommodation 71.69 677.97 - 109.09 72.50
Others 6,577.82 3,513.81 7,282.39 4,399.64 1,951.92
Total 200,755.35 176,578.69 142,848.83 116,969.71 111,841.23
Table 12a. Number of families with housing needs by income group and area, Rural Areas, FIES 2012
National Income decile
Housing Needs Indicator
Rent-free Lot Marginal Housing Total
Own House
Rent-free
House
Roof Walls Roof and
Walls
Decile 1 33,531 1,122 4,491 17,545 9,550 66,237
Decile 2 30,895 2,260 2,574 14,433 4,055 54,217
Decile 3 32,476 3,919 2,807 8,629 3,481 51,312
Decile 4 27,117 4,342 1,777 4,449 2,995 40,680
Decile 5 23,333 0 2,364 4,272 1,814 31,783
Decile 6 16,866 3,784 1,499 3,557 1,136 26,842
Decile 7 13,693 817 1,849 1,771 479 18,609
Decile 8 9,753 534 669 1,221 990 13,167
Decile 9 2,750 1,111 0 0 211 4,073
Decile 10 3,010 388 613 0 522 4,533
Total 193,424 18,278 18,641 55,876 25,234 311,453
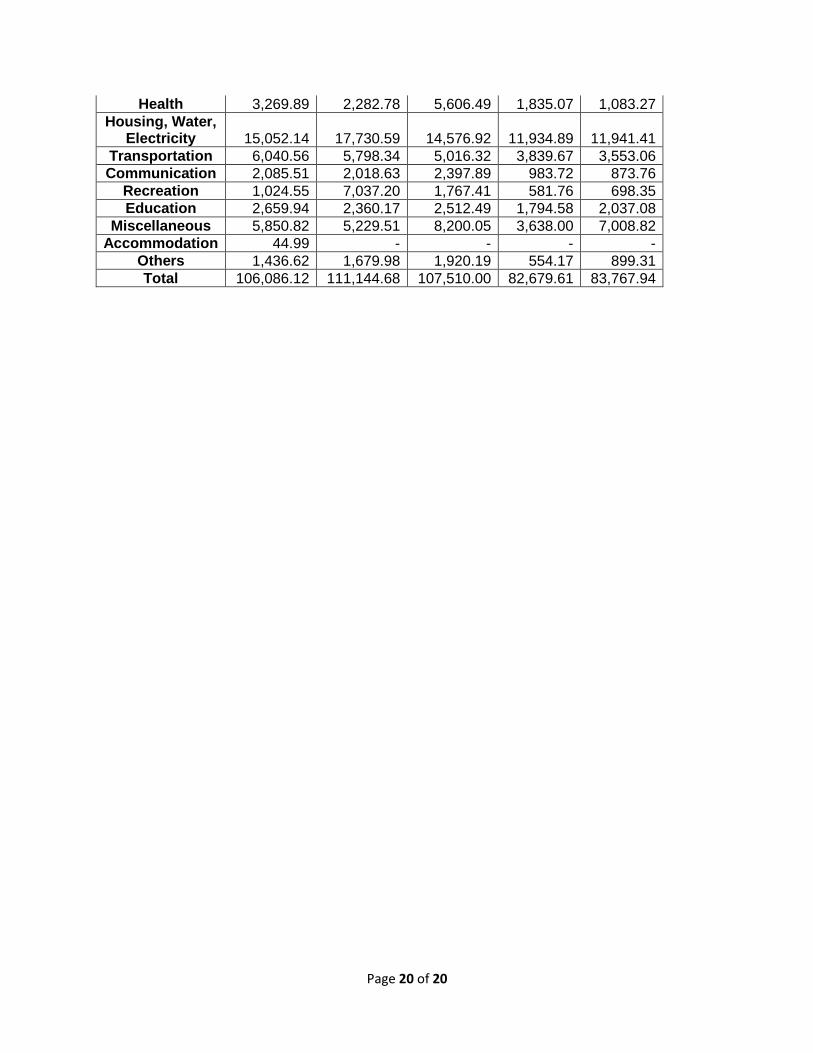
Table 14a. Expenditures of families with housing needs, Rural Areas, FIES 2012
Expenditure
Housing Needs Indicator
Rent-free Lot Marginal Housing
Own House
Rent-free House
Roof Walls Roof and Walls
Alcohol 867.88 769.10 1,268.65 1,071.11 1,235.00
Tobacco 1,667.38 1,128.56 1,280.65 1,267.88 1,532.82
Other Vegetable 41.86 58.85 48.00 21.85 68.82
Food 61,747.26 59,977.24 57,482.11 51,651.08 49,327.10
Clothing 2,357.97 3,052.54 2,722.19 1,739.28 1,724.59
Furnishing 1,938.77 2,021.20 2,710.65 1,766.55 1,784.53
Page 20 of 20
Health 3,269.89 2,282.78 5,606.49 1,835.07 1,083.27
Housing, Water, Electricity 15,052.14 17,730.59 14,576.92 11,934.89 11,941.41
Transportation 6,040.56 5,798.34 5,016.32 3,839.67 3,553.06
Communication 2,085.51 2,018.63 2,397.89 983.72 873.76
Recreation 1,024.55 7,037.20 1,767.41 581.76 698.35
Education 2,659.94 2,360.17 2,512.49 1,794.58 2,037.08
Miscellaneous 5,850.82 5,229.51 8,200.05 3,638.00 7,008.82
Accommodation 44.99 - - - -
Others 1,436.62 1,679.98 1,920.19 554.17 899.31
Total 106,086.12 111,144.68 107,510.00 82,679.61 83,767.94