10681
DESCRIPTION
H2s removalTRANSCRIPT

1
Hydrogen Sulfide ModelingHydrogen Sulfide Modelingand Control Optionsand Control Options
SWANASWANA –– New YorkNew YorkAlbany, New YorkAlbany, New York
Presented By_______________________________________
Gregory P. McCarron, PE
November 7, 2007
2
Outline of PresentationOutline of Presentation
Hydrogen Sulfide Modeling
H2S Control Options
Technology Evaluation
Liquid Scavenger Example
Liquid Redox Example

3
Need for HNeed for H22S ModelsS Models
Treatment System Evaluation/Need Life-cycle evaluation H2S model is critical
Treatment System Selection High Capital, Low Operating Cost Low Capital, High Operating Cost
Treatment System Design

4
SCSSCS’’ Current HCurrent H22S ModelS Model
Based on empirical data from 5-10 landfills
Fast H2S conversion: 4 years after placement
Zero-order Decay
Back-calculate “Availability Factor” basedactual H2S
Use “Availability Factor” to predict future H2S.

5
Availability FactorAvailability Factor
Percent (%) of total H2S that is available orconverted to gas
Based on calibration to actual data
Varies from 0.1 to 0.5
Depends on location / mixing
Moisture and carbon

6
Example HExample H22S ModelS Model
585,714 322,867 126,249738,869656,083459,465H2S weight (lb) 43,463 196,618
7,552 3,947 1,754
7,600
10,161
10,000
10,411
8,800
9,236H2S Model 1,694 5,440
Actuals (avg)
1648 1738 1529154513391057
Total LFG
(scfm) 545 768
12.4 6.9 2.715.713.99.8
Total H2S
(scfm) 0.9 4.2
6.54 3.61 1.418.257.335.13
Total H2S
(MMscf) 0.49 2.20
1.41 1.41 1.421.41
2004 H2S flow
(MMsc)
2.20 2.202.202.20
2003 H2S flow
(MMscf)
2.942.942.942.94
2002 H2S flow
(MMscf)
1.711.711.71
2001 H2S flow
(MMscf) 1.71
0.490.49
2000 H2S flow
(MMscf) * 0.49 0.49
2006 2007 20082005200420032001 2002

7
EREF Study: HEREF Study: H22S ModelingS Modeling
UNH and SCS
10-12 landfills
Compilation and evaluation of existingdata
Supplemental testing
Development of enhanced H2S Model

8
EREF Study: LandfillsEREF Study: Landfillsand Scheduleand Schedule
NY: 2
NJ: 2
CT: 1-2
MA: 5-7
Landfill group is not final yet
November 2007 to October 2008
9
Control TechnologiesControl Technologies
Physical Adsorption
Chemical Adsorption (Solid Scavengers)
Liquid Absorption (Liquid Scavengers)
Liquid-Redox Systems
Chemical Oxidation
Physical Solvent Scrubbing
Biofiltration
Claus Systems

10
Control Technologies for LFGControl Technologies for LFG
Solid Scavengers Iron sponge; Sulfatreat; Sulfabind
Liquid ScavengersEnviroscrub; Sulfaguard
Liquid-Redox Lo-CAT; Mini-CAT
BiofiltrationThiopaq

11
Technology Evaluation (BACT)Technology Evaluation (BACT)
Control Effectiveness
Economic Impacts
Energy Impacts
Environmental Impacts

12
Technology EvaluationTechnology EvaluationLifeLife--CycleCycle
H2S model and projections
Capital costs
Amortization of capital
Operating costs
Cost per ton (over entire term)
Net present value

13
Technology EvaluationTechnology EvaluationLifeLife--CycleCycle
TechnologyTotal Cost(over 10years)
Capital CostAnnualCost
Control Cost(per ton H
2S
removed)*Rank
Iron Sponge $3,820,520 $738,430 $322,965 $38,618 2
SulfaTreat (1 vessel) $2,771,370 $314,630 $277,137 $33,247 1
SulfaTreat (2vessels)
$4,370,240 $821,496 $437,024 $52,428 4
SulfaBind $6,420,760 $2,402,380 $642,076 $76,560 6
Enviroscrub $3,670,040 $295,506 $367,004 $51,936 3SulfaGuard $4,695,280 $424,008 $469,528 $56,569 5
Lo-CAT $10,543,990
$2,868,206 $1,054,399
$110,914 8
Thiopaq $8,198,230 $1,492,326 $819,823 $107,726 7

14
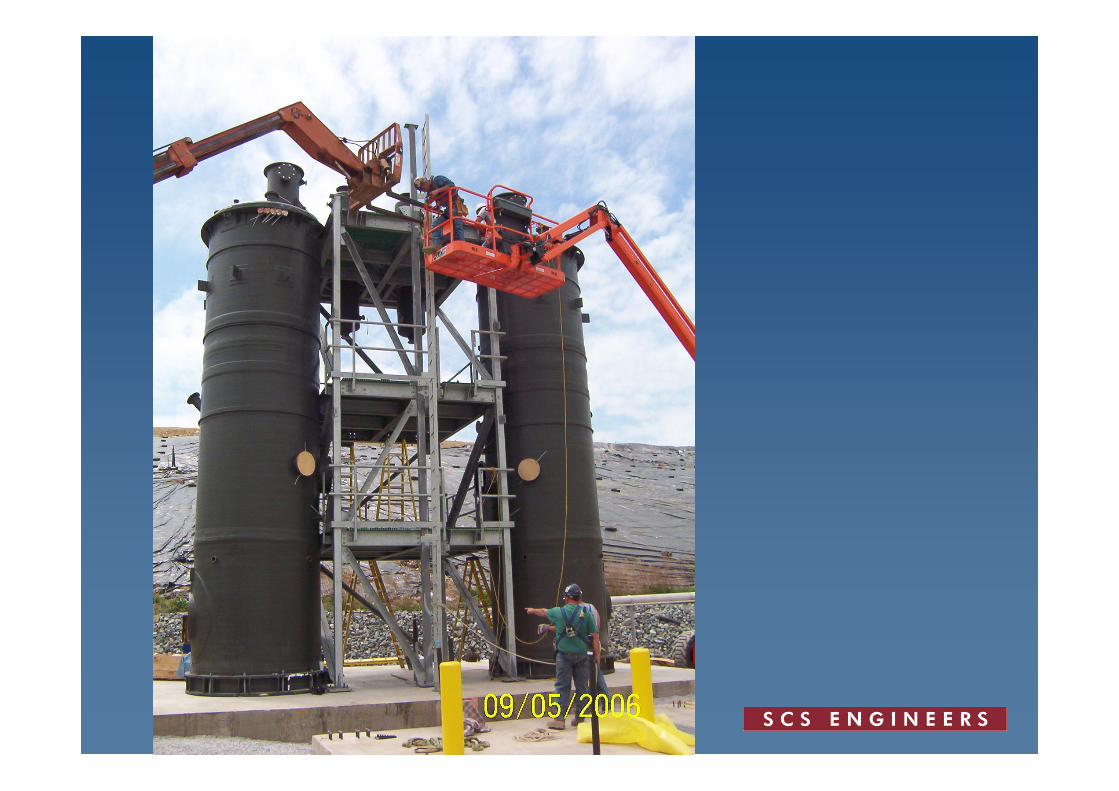
Liquid Scavenger ExampleLiquid Scavenger Example
Sulfur loading: 50 lb/day
1800 scfm; 230 ppm
Sulfatreat technology
Capital cost: $300,000
Annual cost: $300,000 (inc. debt service)

15

16

17
LiquidLiquid RedoxRedox ExampleExample
Sulfur loading: 2000 lb/day
2200 scfm; 6000 ppm
Lo-CAT technology
Capital cost: $3,200,000
Annual cost: $400,000 (w/o debt service)

18
19

20

21

22

23

24
SummarySummary
H2S model is critical
EREF study is underway
Many technologies available
Life-cycle analysis is needed
Facilities are in place at landfills