10.5--performance metric feedback (rubenstein, · pdf file1 performance metrics module 10.5...
TRANSCRIPT

1
Performance MetricsModule 10.5
Krishnan Raghunathan / Linsey RubensteinMichael Miller, Amazon
Presentation for:ESD.60 – Lean/Six Sigma Systems
MIT Leaders for Manufacturing Program (LFM)Summer 2004
These materials were developed as part of MIT's ESD.60 course on "Lean/Six Sigma Systems." In some cases, the materials were produced by the lead instructor, Joel Cutcher-Gershenfeld, and in some cases by student teams
working with LFM alumni/ae. Where the materials were developed by student teams, additional inputs from the faculty and from the technical instructor, Chris Musso, are reflected in some of the text or in an appendix

2
6/9/04 -- 2© Linsey Rubenstein/Krishnan Raghunathan – ESD.60 Lean/Six Sigma Systems, LFM, MIT
OverviewLearning Objectives
Understand how metrics drive behavior and performanceUnderstand the importance of aligning metrics with overall strategyUnderstand basic differences between traditional and lean metrics
Session Design (20-30 min.)Part I: Introduction and Learning Objectives (1-2 min.)Part II: Lesson 1 and Exercise (3-5 min.)Part III: Balanced Scorecard and Lesson 2 (3-5 min.)Part IV: Lesson 3. Differentiate output vs. throughput metrics (5-7 min.)Part V: How does key Lean concepts apply to devising metrics (3-5 min.)Part VI: “Disconnects,” (5-7 min.)
Part I: Introduction Part II: Concepts Part III: Application Part IV: Disconnects Part V: Conclusion

3
6/9/04 -- 3© Linsey Rubenstein/Krishnan Raghunathan – ESD.60 Lean/Six Sigma Systems, LFM, MIT
Measure the Right ThingExercise
After LFM you take a position as a research analyst for Cost-Cutting Air (CCA), a new airline upstart. After running a Pareto Analysis (you are psyched to have the opportunity to use the tools you learned in your LFM Lean Class) you determine that fuel consumption cost is one of your highest controllable costs. You also know that pilots can minimize fuel consumption by taking measures such as turning off the air conditioning when passengers are not on the plane. This is clearly “waste/muda” that can be eliminated… and everyone knows that waste is not an option in a business where every cent counts. You want to impress your new boss, Jimmy Lean and show him how your b-school education really differentiates you from the other young motivated chaps. What metrics might you recommend to encourage pilots to reduce costs? How might you use this metric to reward CCA’s pilots?
Part I: Introduction Part II: Concepts Part III: Application Part IV: Disconnects Part V: Conclusion
4
6/9/04 -- 4© Linsey Rubenstein/Krishnan Raghunathan – ESD.60 Lean/Six Sigma Systems, LFM, MIT
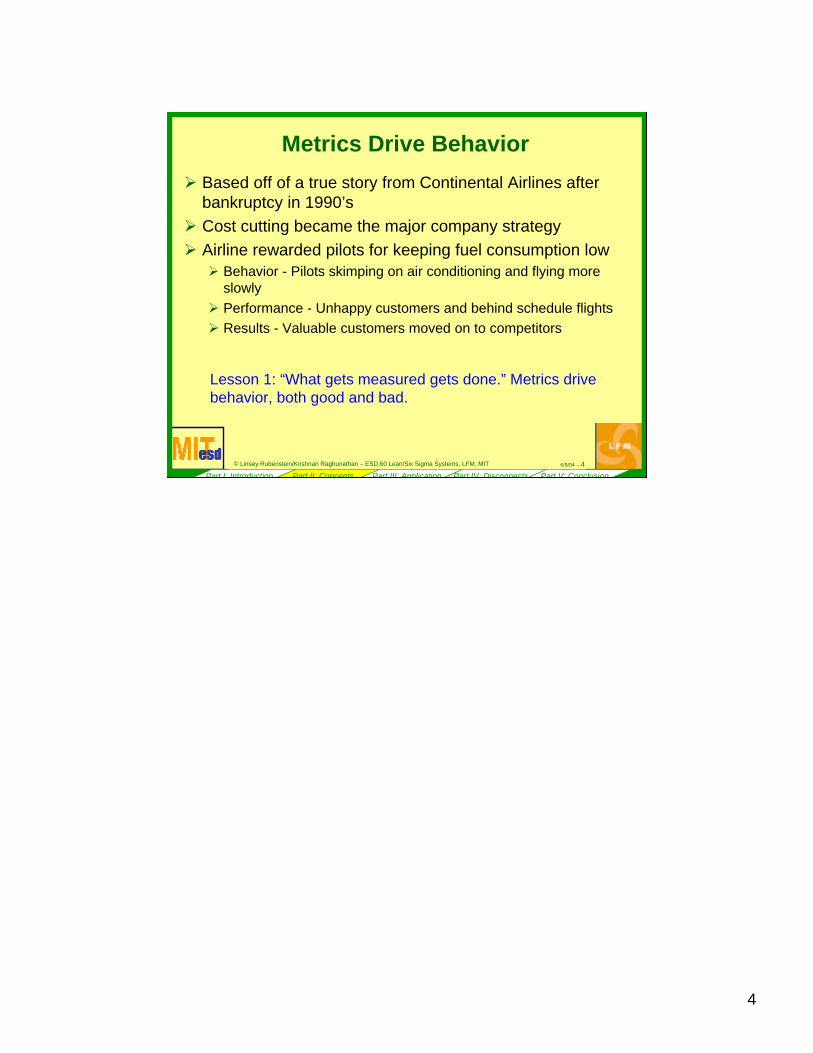
Metrics Drive Behavior
Part I: Introduction Part II: Concepts Part III: Application Part IV: Disconnects Part V: Conclusion
Based off of a true story from Continental Airlines after bankruptcy in 1990’sCost cutting became the major company strategyAirline rewarded pilots for keeping fuel consumption low
Behavior - Pilots skimping on air conditioning and flying more slowlyPerformance - Unhappy customers and behind schedule flightsResults - Valuable customers moved on to competitors
Lesson 1: “What gets measured gets done.” Metrics drive behavior, both good and bad.
5
6/9/04 -- 5© Linsey Rubenstein/Krishnan Raghunathan – ESD.60 Lean/Six Sigma Systems, LFM, MIT
Devising The Right Metrics
Part I: Introduction Part II: Concepts Part III: Application Part IV: Disconnects Part V: Conclusion
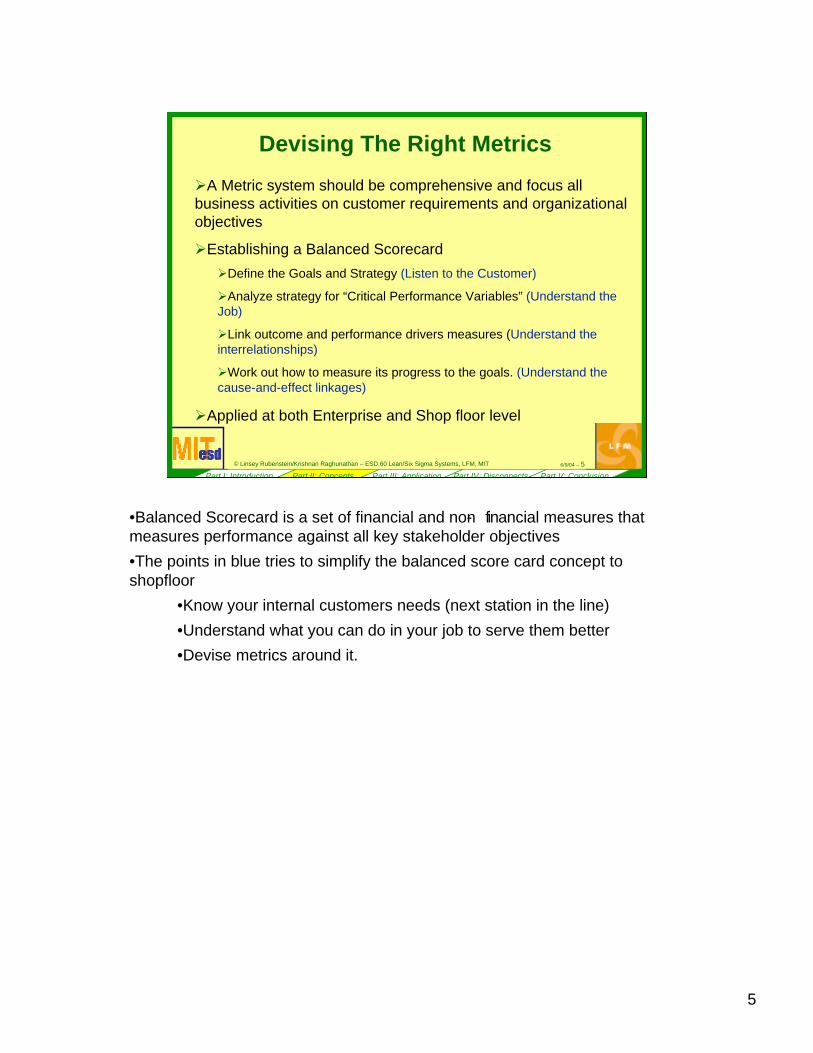
A Metric system should be comprehensive and focus all business activities on customer requirements and organizational objectives
Establishing a Balanced ScorecardDefine the Goals and Strategy (Listen to the Customer)
Analyze strategy for “Critical Performance Variables” (Understand the Job)
Link outcome and performance drivers measures (Understand the interrelationships)
Work out how to measure its progress to the goals. (Understand the cause-and-effect linkages)
Applied at both Enterprise and Shop floor level
•Balanced Scorecard is a set of financial and non- financial measures that measures performance against all key stakeholder objectives•The points in blue tries to simplify the balanced score card concept to shopfloor
•Know your internal customers needs (next station in the line)•Understand what you can do in your job to serve them better•Devise metrics around it.

6
6/9/04 -- 6© Linsey Rubenstein/Krishnan Raghunathan – ESD.60 Lean/Six Sigma Systems, LFM, MIT
Part I: Introduction Part II: Concepts Part III: Application Part IV: Disconnects Part V: Conclusion
Amazon’s Corporate Score-card
CustomerFailed Fast TrackOrder cycle time mean and standard deviation
Cost/UnitThroughput per labor hourUnits shipped per labor hour
QualityInventory Record Defect Rate
OperationsReceived and Shipped units and backlogEx (S&OP adherence)
SafetyLost Time Incidents and RateRecord-able Incidents and Rate
Other Financial and Vendor negotiation metrics
Key Goal: Make online shopping preferred mode for all types of goods
Fast and Free shipping for all types of products
Lesson 2: Metrics must be holistic and align with the business strategy
Scorecards can be applied for day to day operations as well•Shop floor score cards• Example of balance scorecard at shop floor: Amazon warehouse workers has to maintain both a good pickup time (orders picked from inventory) and cycle time per order and they both have opposing needs.
7
6/9/04 -- 7© Linsey Rubenstein/Krishnan Raghunathan – ESD.60 Lean/Six Sigma Systems, LFM, MIT
Part I: Introduction Part II: Concepts Part III: Application Part IV: Disconnects Part V: Conclusion
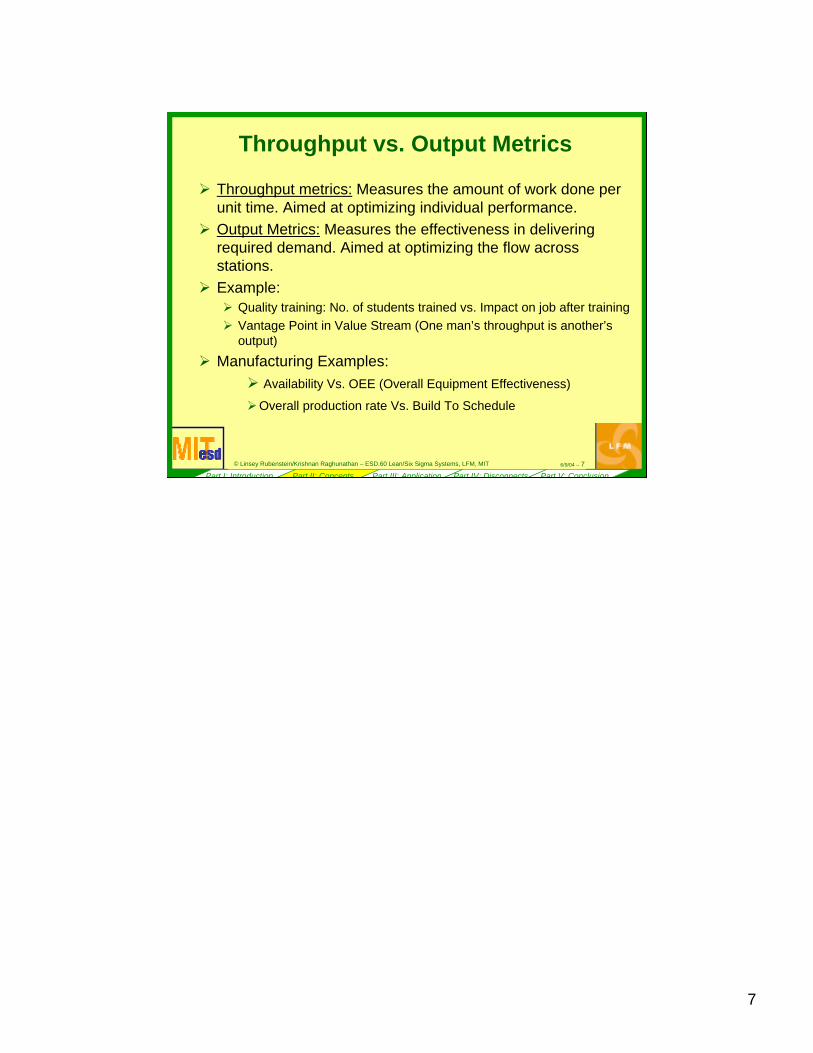
Throughput vs. Output Metrics
Throughput metrics: Measures the amount of work done per unit time. Aimed at optimizing individual performance. Output Metrics: Measures the effectiveness in delivering required demand. Aimed at optimizing the flow across stations. Example:
Quality training: No. of students trained vs. Impact on job after trainingVantage Point in Value Stream (One man’s throughput is another’soutput)
Manufacturing Examples: Availability Vs. OEE (Overall Equipment Effectiveness)
Overall production rate Vs. Build To Schedule

8
6/9/04 -- 8© Linsey Rubenstein/Krishnan Raghunathan – ESD.60 Lean/Six Sigma Systems, LFM, MIT
Part I: Introduction Part II: Concepts Part III: Application Part IV: Disconnects Part V: Conclusion
Traditional vs. Lean MetricsComplex, low volume assembly in aerospace
Jobs behind schedule metricsFocus on accountability and individual performance Assumes every job is equally importantAssumes individual efficiency drives overall performance
Behavior using traditional metricsPerform “easy” jobs first to improve metric (temporarily)Out-of-sequence work“I completed my work…why should I help someone else”Focus on every problem
Flow metricsFocus on global rather than local optimumAssumes some jobs more critical than othersAssumes team drives overall performance
Behavior using lean metricsWork jobs in optimal sequenceIdentify gaps in skillsTeamwork Focus only on problems that impact overall performance
TRADITIONAL LEAN
9
6/9/04 -- 9© Linsey Rubenstein/Krishnan Raghunathan – ESD.60 Lean/Six Sigma Systems, LFM, MIT
Part I: Introduction Part II: Concepts Part III: Application Part IV: Disconnects Part V: Conclusion
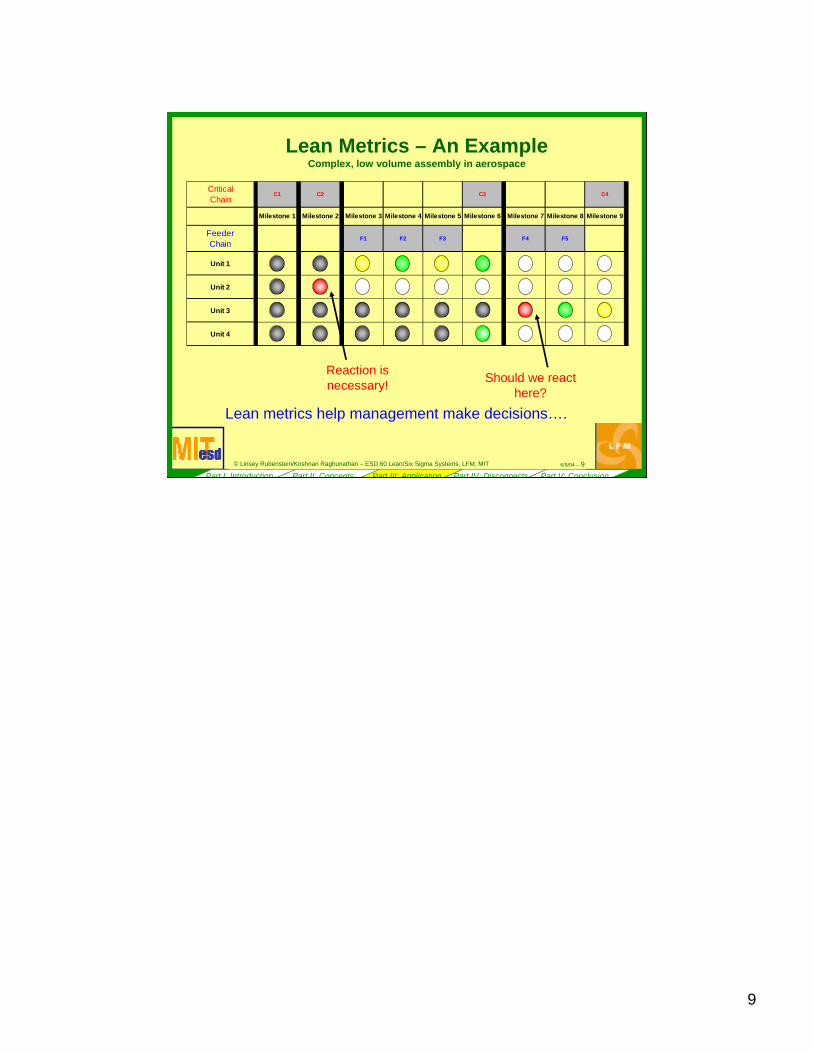
Lean Metrics – An ExampleComplex, low volume assembly in aerospace
CriticalChain
C1 C2 C3 C4
FeederChain
F1 F2 F3 F4 F5
Unit 1
Unit 2
Unit 3
Unit 4
Milestone 1 Milestone 2 Milestone 3 Milestone 4 Milestone 5 Milestone 6 Milestone 7 Milestone 8 Milestone 9
Reaction is necessary! Should we react
here?
Lean metrics help management make decisions….

10
6/9/04 -- 10© Linsey Rubenstein/Krishnan Raghunathan – ESD.60 Lean/Six Sigma Systems, LFM, MIT
This looks easy? Why doesn’t everyone go lean?
Build Product
Manage People
Manage Flow
Measure individual performance
Don’t measureIndividual performance
Core Conflict must be broken!
Lesson 3: Lean metrics optimize global performance
• Create lean teams and devise metrics for the team as opposed to individual
11
6/9/04 -- 11© Linsey Rubenstein/Krishnan Raghunathan – ESD.60 Lean/Six Sigma Systems, LFM, MIT
Part I: Introduction Part II: Concepts Part III: Application Part IV: Disconnects Part V: Conclusion
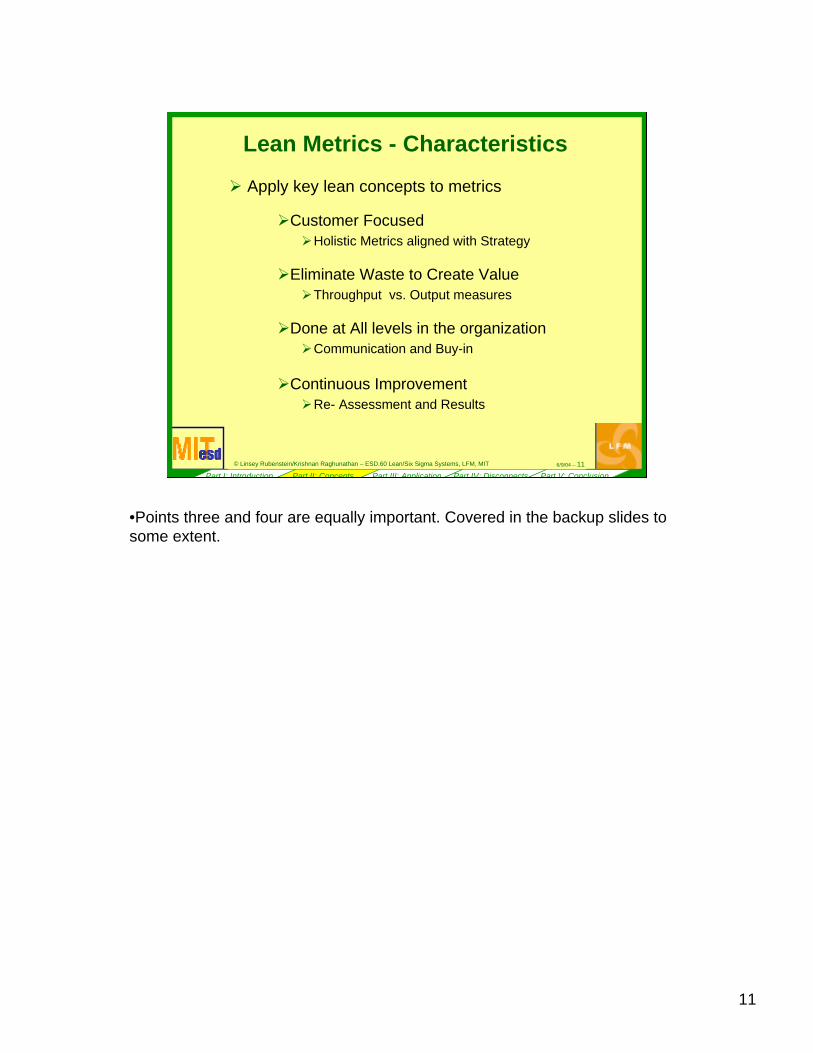
Lean Metrics - Characteristics
Apply key lean concepts to metrics
Customer FocusedHolistic Metrics aligned with Strategy
Eliminate Waste to Create ValueThroughput vs. Output measures
Done at All levels in the organizationCommunication and Buy-in
Continuous ImprovementRe- Assessment and Results
•Points three and four are equally important. Covered in the backup slides to some extent.

12
6/9/04 -- 12© Linsey Rubenstein/Krishnan Raghunathan – ESD.60 Lean/Six Sigma Systems, LFM, MIT
Disconnects
Technical Factors
Reliable and consistent metrics
Vertical and horizontal alignment
Adequate resource commitment
Relevancy of metrics over time
Social Factors
Learning vs. Reporting
Acceptance of measures
Overcoming inertia
Misuse, manipulation, and gaming
Corporate values becomes important hereCulture and integrity indispensable to success.
Right incentives for performance
Part I: Introduction Part II: Concepts Part III: Application Part IV: Disconnects Part V: Conclusion
Reliable Metrics : Accurate, Actionable and TimelyConsistent Metrics
Avoid confusing requirements and expectations internal and external - Balanced Score card
Vertical and Horizontal alignment“Catchball” process to deploy metrics to all levels.
Adequate Resource commitmentManpower, Money, Facilities and Training
Evaluate relevancy over timeLife Cycle management for metrics
Learning vs reportingProcess indicators as diagnostic data, but do not optimize the system to these measures.
Acceptance of measuresDon’t know whyDon’t know how metrics fit into big picture (correlation to end result)
Overcome InertiaAccountability issues
Metrics are mis- used, manipulated, and gamedThey can be manipulated and used to justify present processes
Right Incentives for performance

13
6/9/04 -- 13© Linsey Rubenstein/Krishnan Raghunathan – ESD.60 Lean/Six Sigma Systems, LFM, MIT
BibliographyNovember 2003, Sisk, Michael “Are the Wrong Metrics Driving Your Strategy” Harvard Business ReviewNovember 1999, “Successful Performance Measurement: A Checklist” Harvard Management UpdateAugust 1997, Baker, Bill “Driving Strategy Objectives Through Your Performance Metrics” IQPC, ChicagoJune 2001, Robert, Nicole A. “Design and Analysis of an Enterprise Metric System” Sloan thesisMIT Sloan Professor, Joel Cutcher-Gershenfeld

14
6/9/04 -- 14© Linsey Rubenstein/Krishnan Raghunathan – ESD.60 Lean/Six Sigma Systems, LFM, MIT
Appendix: Instructor’s Comments and Class Discussion on 10.5
Metrics must be assigned a level of prioritySome are necessary but insufficient, others are strictly performance-based
In continuous improvement situation, metrics will get tighter over time
First metrics should deal with stability, second metrics should deal with flow
Metrics are only one factor in organizational behavior. Other important factors:
Character of employees Leadership styles of managersOrganizational rewards and incentivesOrganizational culture: what behavior gets people promoted
15
6/9/04 -- 15© Linsey Rubenstein/Krishnan Raghunathan – ESD.60 Lean/Six Sigma Systems, LFM, MIT
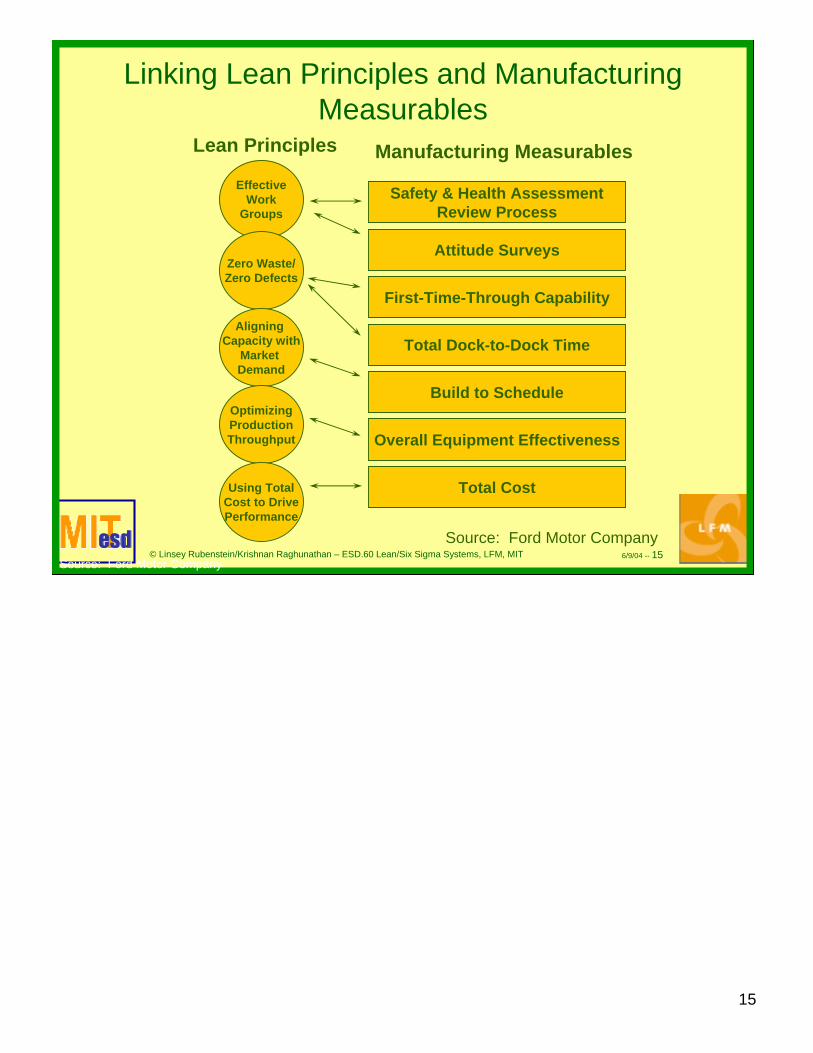
Linking Lean Principles and Manufacturing Measurables
Lean Principles Manufacturing MeasurablesEffective
WorkGroups
Zero Waste/Zero Defects
Aligning Capacity with
Market Demand
OptimizingProductionThroughput
Using TotalCost to DrivePerformance
Safety & Health AssessmentReview Process
Attitude Surveys
First-Time-Through Capability
Total Dock-to-Dock Time
Build to Schedule
Overall Equipment Effectiveness
Total Cost
Source: Ford Motor Company
Source: Ford Motor Company

16
6/9/04 -- 16© Linsey Rubenstein/Krishnan Raghunathan – ESD.60 Lean/Six Sigma Systems, LFM, MIT
Build To Schedule -- What is it?
In Plain Words:A way of knowing if you built the right parts, in the right quantity, in the right order
A Formal Definition: Percent of units scheduled for a given day that are built on the correct day, in the correct quantity and correct mix
BTS = Volume x Mix x Sequence

17
6/9/04 -- 17© Linsey Rubenstein/Krishnan Raghunathan – ESD.60 Lean/Six Sigma Systems, LFM, MIT
Build To Schedule -- Why use it?
Lean Principle:Aligning Capacity with Market Demand
BTS can help. . .Keep changes in volume or mix from swamping or starving departments upstream or downstreamOperate with smaller “floats” -- which increases the need to track BTS Respond to customer demand for “in-line vehicle sequencing” -- which requires BTS

18
6/9/04 -- 18© Linsey Rubenstein/Krishnan Raghunathan – ESD.60 Lean/Six Sigma Systems, LFM, MIT
Sample Lessons from Build To Schedule Data --Volume
Volume PerformanceWeek of: Pieces Scheduled Pieces Produced %
6/2/99 14,650 16,303 100%
6/9/99 16,990 17,317 100%
6/16/99 16,380 15,755 96.18%
Overbuilding here -- probably doneto achieve central performance goals; probably used up more float than expected from feeder departments
No credit for more than 100%
Source: Visteon Company
19
6/9/04 -- 19© Linsey Rubenstein/Krishnan Raghunathan – ESD.60 Lean/Six Sigma Systems, LFM, MIT
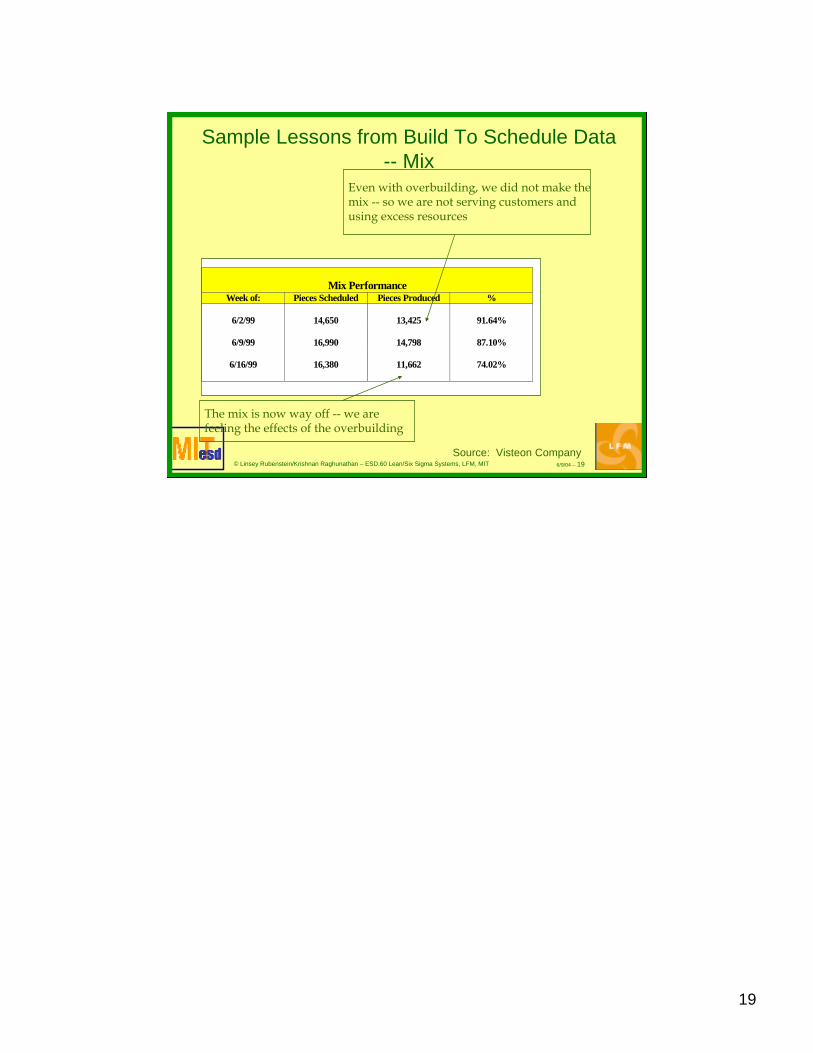
Sample Lessons from Build To Schedule Data -- Mix
Mix PerformanceWeek of: Pieces Scheduled Pieces Produced %
6/2/99 14,650 13,425 91.64%
6/9/99 16,990 14,798 87.10%
6/16/99 16,380 11,662 74.02%
Even with overbuilding, we did not make themix -- so we are not serving customers and using excess resources
The mix is now way off -- we are feeling the effects of the overbuilding
Source: Visteon Company
20
6/9/04 -- 20© Linsey Rubenstein/Krishnan Raghunathan – ESD.60 Lean/Six Sigma Systems, LFM, MIT
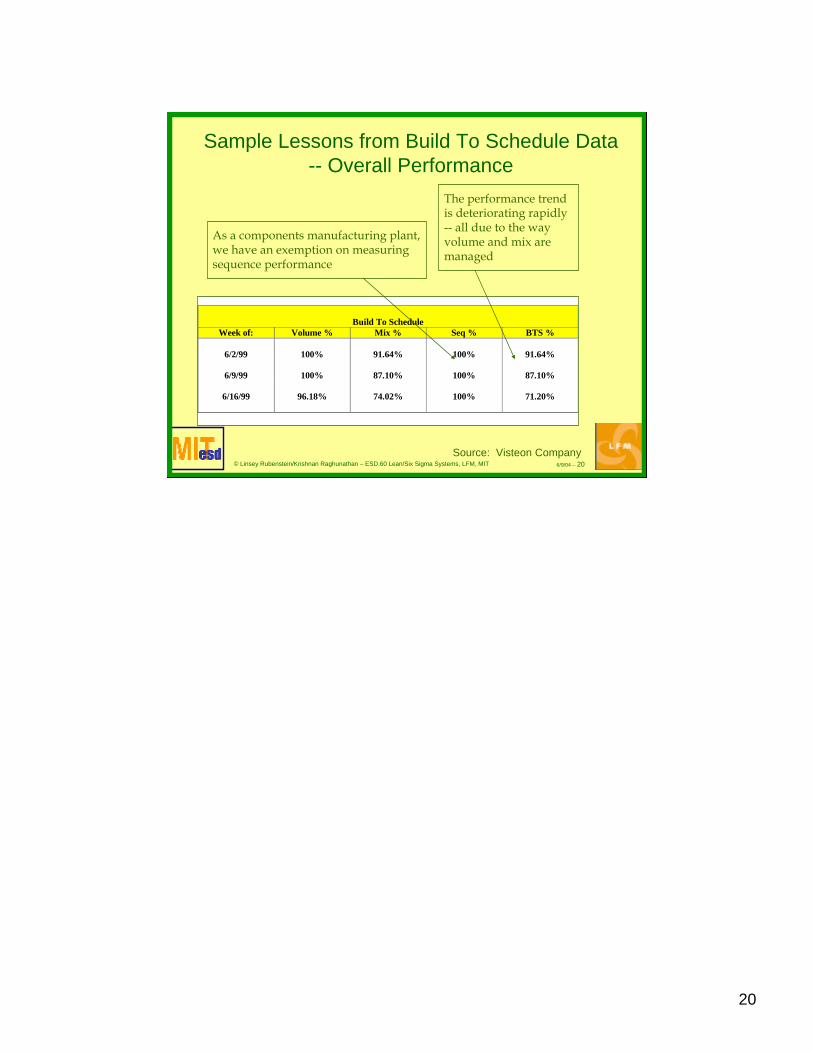
Sample Lessons from Build To Schedule Data -- Overall Performance
Build To ScheduleWeek of: Volume % Mix % Seq % BTS %
6/2/99 100% 91.64% 100% 91.64%
6/9/99 100% 87.10% 100% 87.10%
6/16/99 96.18% 74.02% 100% 71.20%
The performance trendis deteriorating rapidly-- all due to the wayvolume and mix aremanaged
As a components manufacturing plant, we have an exemption on measuringsequence performance
Source: Visteon Company

21
6/9/04 -- 21© Linsey Rubenstein/Krishnan Raghunathan – ESD.60 Lean/Six Sigma Systems, LFM, MIT
Appendix: Instructor’s Guide
• Some examples of manufacturing metrics that are lean like First time through.
Measurables2-3 minTBD
• Summarize the three key lessons and disconnects
Concluding comments 1-2 minTBD
• Important section explain all key points in the disconnects section.
Disconnects5-7 minTBD
• The CCA example; Some thinking on what does lean mean to metrics
Exercises/Activities7-10 minTBD
3
1-2
Slide
• Three key lessons Key Concepts3-5 min
•Talk about linking the three key lessons together. Important to measure right; how to devise right metrics; and what can we learn from lean in devising metrics
Introduction, overview and learning objectives
2-3 min
Additional Talking PointsTopicTime
Part I: Introduction Part II: Concepts Part III: Application Part IV: Disconnects Part V: Conclusion

22
6/9/04 -- 22© Linsey Rubenstein/Krishnan Raghunathan – ESD.60 Lean/Six Sigma Systems, LFM, MIT
Backup Slides
23
6/9/04 -- 23© Linsey Rubenstein/Krishnan Raghunathan – ESD.60 Lean/Six Sigma Systems, LFM, MIT
Communication of MetricsAlign individual performance with strategy
Communicate & EducateSet Stretch goalsLink rewards to performance measures
Measurements are meant to change behaviorChange happens thru people, so everyone needs to see a need to changeTo achieve maximum motivation, goals should be moderately challenging.Resolve issues to achieve goal: Lean metrics not only to evaluate but also to improve.

24
6/9/04 -- 24© Linsey Rubenstein/Krishnan Raghunathan – ESD.60 Lean/Six Sigma Systems, LFM, MIT
Re-AssessmentContinuous Improvement
Metrics Re-Assessment and Results teams at Raytheon TI : PDCA Cycle.
Reassessment/Deployment Team“Catchball” processWhat is the benchmark capability?Next Years Metrics should be?