100 winter 2009 pci journal 100 -...
TRANSCRIPT

Winter 2009 | PCI Journal100
Editor’s quick points
n This paper reports the design, construction, and preliminary results of a three-story precast concrete structure built at half scale and tested under input ground motions on the outdoor shake table at the University of California, San Diego.
n The structure was subjected to 16 significant-input ground mo-tions, and 640 sensors dynamically recorded the development of a number of damage limit states in various elements and connections in the structure.
n This project was funded jointly by the Precast/Prestressed Concrete Institute; the National Science Foundation; the Charles Pankow Foundation; the Network for Earthquake Engineering Simulation; and the precast, prestressed concrete industry.
Preliminary results of the shake-table testing for the development of a diaphragm seismic design methodologyMatthew J. Schoettler, Andrea Belleri, Dichuan Zhang, José I. Restrepo, and Robert B. Fleischman
A four-year-long research project is being undertaken to develop a diaphragm seismic design methodology (DSDM) for precast concrete buildings. The experimental phase of the project1 culminated in July 2008 with the shake-table testing of a three-story, precast concrete building.
The three-story, half-scale test structure was designed to be diaphragm sensitive in flexure with a floor aspect ratio of 3.5. The building included standard precast concrete ele-ments and typical connection details, all built at half scale.
Testing provided a landmark opportunity to analyze a struc-ture of this type under realistic boundary conditions. The unique research opportunity of testing a complete, large-scale structural system was exploited to the fullest extent by subjecting the structure to 16 significant-input ground mo-tions while 640 sensors dynamically recorded the develop-ment of a number of damage-limit states in various elements and connections in the structure. This allowed the project team to investigate the magnitude of floor diaphragm forces, load paths, and connection behavior in the precast concrete building subjected to seismic loading.
100
101PCI Journal | Winter 2009
Connection details between floor elements were selected based on the performance characteristics of individual full-scale connection tests conducted at LU. With strength and deformation capacities determined by LU, the shake-table test was a first step in determining whether the seismic demands exceed the capacities in a system test. Providing reasonable connection deformation demands was another objective for the shake-table program. Other connection behaviors, such as group effects, coupled shear and tensile demands, field details, and cyclic and dynamic loading conditions, were identified as areas of interest that could be most reliably observed with the shake-table test.
Test setup
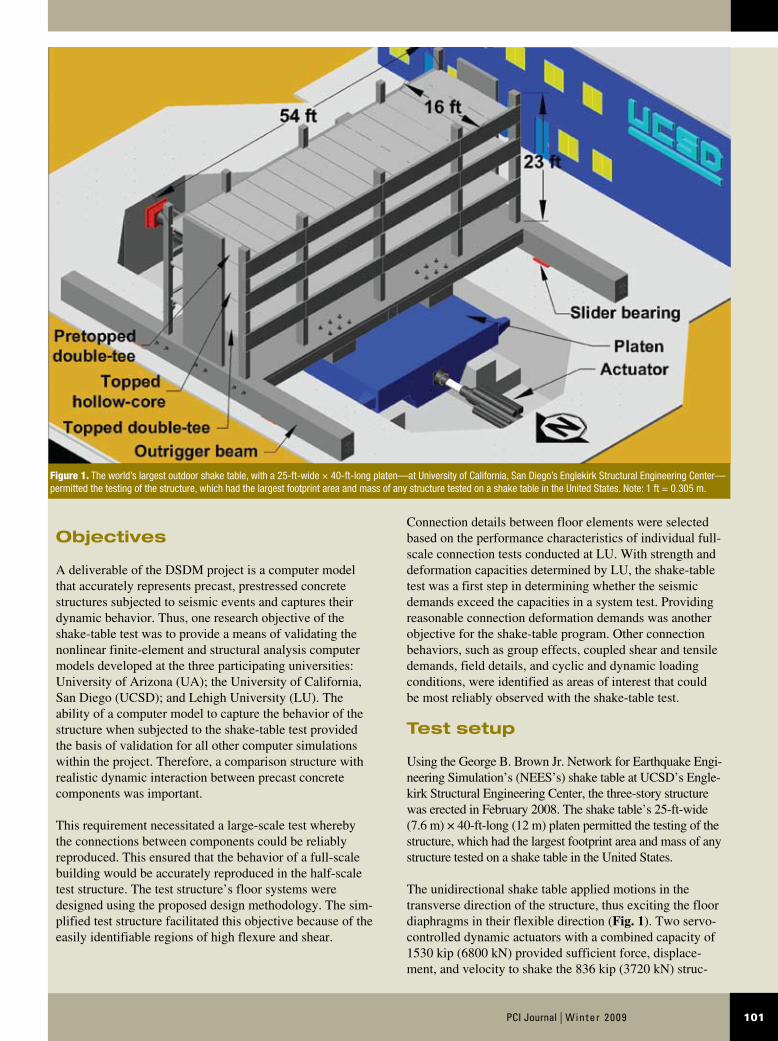
Using the George B. Brown Jr. Network for Earthquake Engi-neering Simulation’s (NEES’s) shake table at UCSD’s Engle-kirk Structural Engineering Center, the three-story structure was erected in February 2008. The shake table’s 25-ft-wide (7.6 m) × 40-ft-long (12 m) platen permitted the testing of the structure, which had the largest footprint area and mass of any structure tested on a shake table in the United States.
The unidirectional shake table applied motions in the transverse direction of the structure, thus exciting the floor diaphragms in their flexible direction (Fig. 1). Two servo-controlled dynamic actuators with a combined capacity of 1530 kip (6800 kN) provided sufficient force, displace-ment, and velocity to shake the 836 kip (3720 kN) struc-
Objectives
A deliverable of the DSDM project is a computer model that accurately represents precast, prestressed concrete structures subjected to seismic events and captures their dynamic behavior. Thus, one research objective of the shake-table test was to provide a means of validating the nonlinear finite-element and structural analysis computer models developed at the three participating universities: University of Arizona (UA); the University of California, San Diego (UCSD); and Lehigh University (LU). The ability of a computer model to capture the behavior of the structure when subjected to the shake-table test provided the basis of validation for all other computer simulations within the project. Therefore, a comparison structure with realistic dynamic interaction between precast concrete components was important.
This requirement necessitated a large-scale test whereby the connections between components could be reliably reproduced. This ensured that the behavior of a full-scale building would be accurately reproduced in the half-scale test structure. The test structure’s floor systems were designed using the proposed design methodology. The sim-plified test structure facilitated this objective because of the easily identifiable regions of high flexure and shear.
Figure 1. The world’s largest outdoor shake table, with a 25-ft-wide × 40-ft-long platen—at University of California, San Diego’s Englekirk Structural Engineering Center—permitted the testing of the structure, which had the largest footprint area and mass of any structure tested on a shake table in the United States. Note: 1 ft = 0.305 m.
Winter 2009 | PCI Journal102
ture. The test structure exceeded the platen’s footprint by a large margin. For this reason, the building was constructed over a sturdy foundation structure tied down to the shake-table platen and extended 15.5 ft (4.72 m) from each side.
The foundation structure transferred the table motion to the ends of the building. The ends of the foundation structure were outfitted with massive outriggers to provide counterbal-ance weight to resist its overturning. The weight of the foun-dation components totaled 536 kip (2380 kN) and included precast concrete outrigger beams, support beams upon which a 7-in.-thick (180 mm) cast-in-place concrete topping was placed, and spacer blocks that sat directly on the shake table.
Post-tensioning bars provided much of the interconnection between precast concrete components and locked the foun-dation to the table by clamping the foundation structure to the table with 7200 kip (32,000 kN) of initial post-tension-ing force. The 7-in.-thick, cast-in-place concrete topping created a stiff and strong diaphragm that was detailed to remain uncracked under the large in-plane inertia forces, thus ensuring consistent boundary conditions for the build-ing throughout testing.
Because of the layout of the vertical components of the lateral-force-resisting system (LFRS) in the structure, much of the overturning moment had to be resisted by outrigger beams running parallel to and off the sides of the table. Rather than transfer this moment back to the table through warping of the foundation, the outrigger beams were made long and massive to counteract the overturning from the walls.
However, the outrigger beams still had to be isolated from the ground surrounding the shake table. To achieve this, hy-drostatic slider bearings with a friction coefficient less than 1% were employed. The bearings slid on mirrored-finish stainless-steel plates. The low friction minimized the effect of disturbing the input energy by introducing undesirable, rectangular, lateral-force-displacement hysteresis. Decom-pression of the slider bearing was undesirable because the pressure of the oil film between the slider and stainless-steel sliding surface would be lost. Therefore, a minimum operating pressure was identified and ensured before testing via low-profile, 400-kip-capacity (1780 kN) hydraulic jacks, which were sandwiched between the slider and the underside of the beam. The pressure of each jack and, for redundancy, each bearing was monitored dynamically.
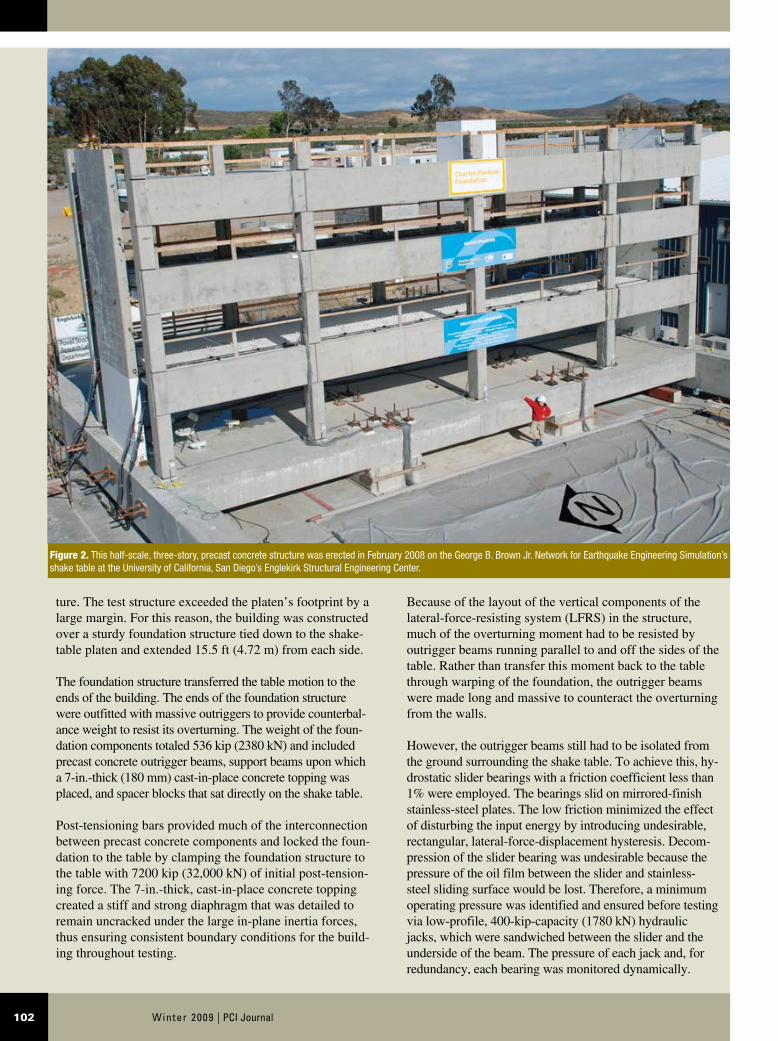
Figure 2. This half-scale, three-story, precast concrete structure was erected in February 2008 on the George B. Brown Jr. Network for Earthquake Engineering Simulation’s shake table at the University of California, San Diego’s Englekirk Structural Engineering Center.
103PCI Journal | Winter 2009
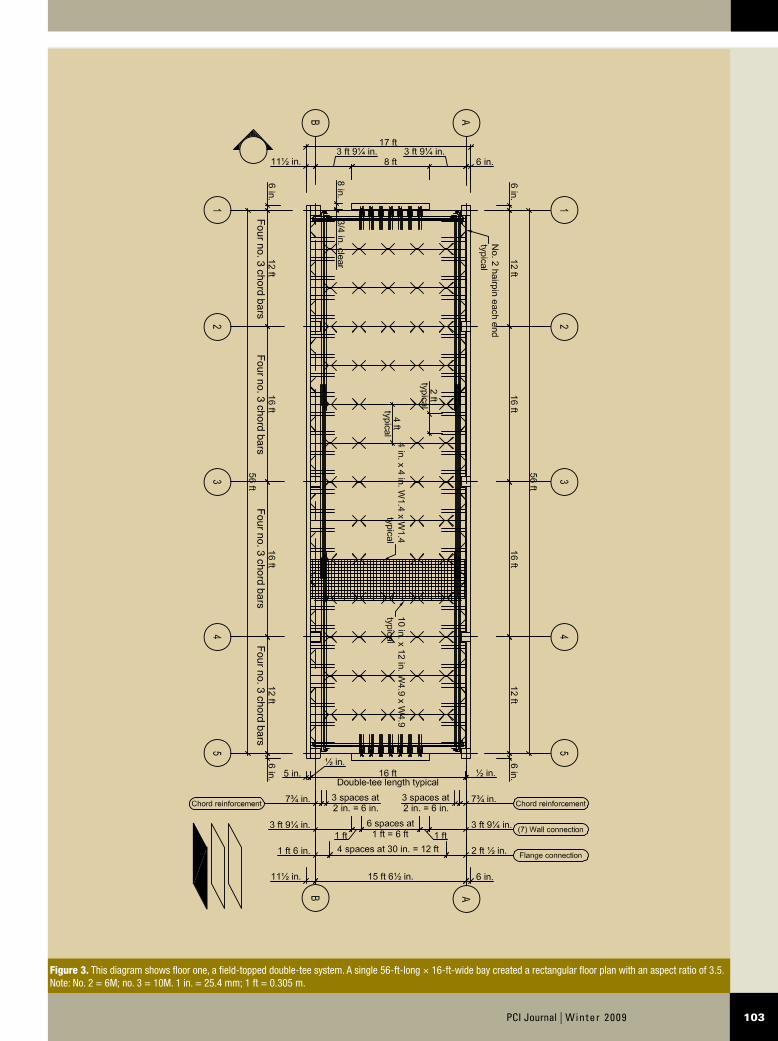
Figure 3. This diagram shows floor one, a field-topped double-tee system. A single 56-ft-long × 16-ft-wide bay created a rectangular floor plan with an aspect ratio of 3.5. Note: No. 2 = 6M; no. 3 = 10M. 1 in. = 25.4 mm; 1 ft = 0.305 m.
Four no. 3 chord bars
Four no. 3 chord bars
Four no. 3 chord bars
Four no. 3 chord bars
-
Winter 2009 | PCI Journal104
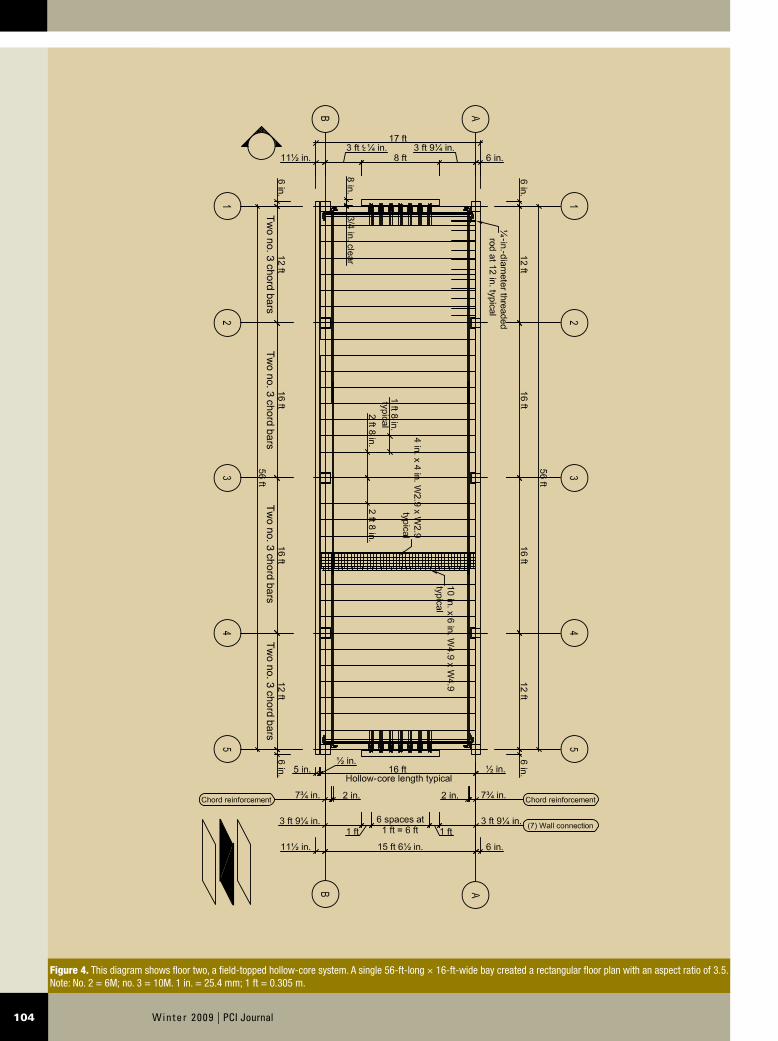
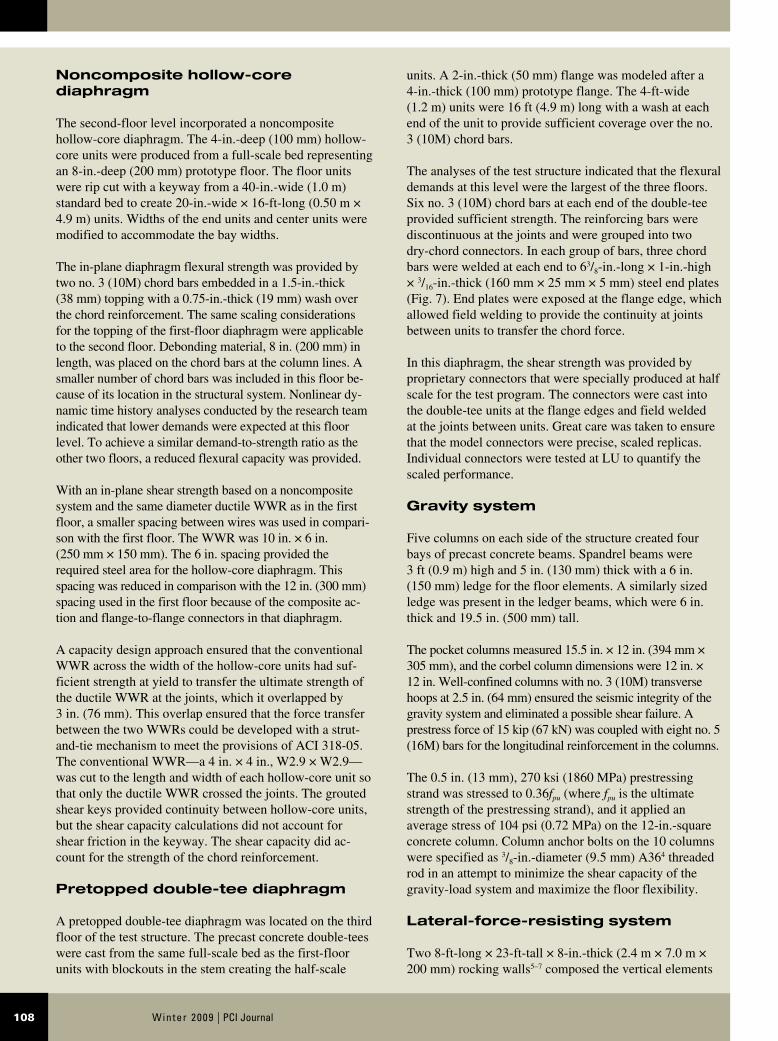
Figure 4. This diagram shows floor two, a field-topped hollow-core system. A single 56-ft-long × 16-ft-wide bay created a rectangular floor plan with an aspect ratio of 3.5. Note: No. 2 = 6M; no. 3 = 10M. 1 in. = 25.4 mm; 1 ft = 0.305 m.
Tw
o no. 3 chord barsT
wo no. 3 chord bars
Tw
o no. 3 chord barsT
wo no. 3 chord bars
-
--
105PCI Journal | Winter 2009
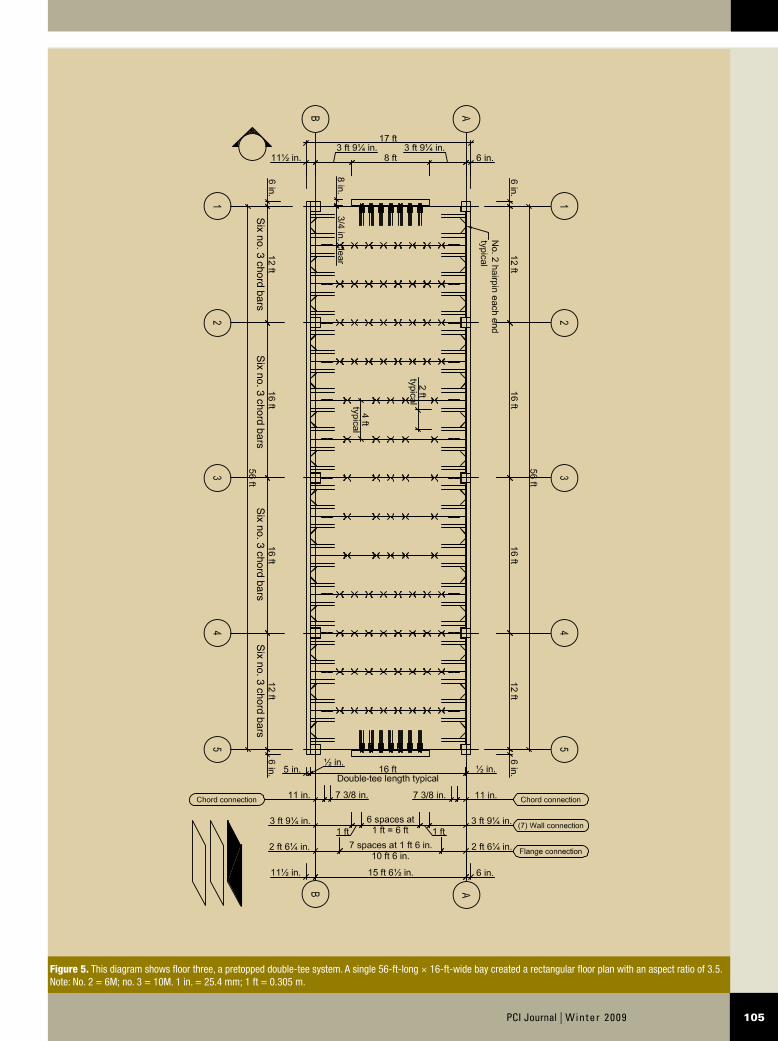
Figure 5. This diagram shows floor three, a pretopped double-tee system. A single 56-ft-long × 16-ft-wide bay created a rectangular floor plan with an aspect ratio of 3.5. Note: No. 2 = 6M; no. 3 = 10M. 1 in. = 25.4 mm; 1 ft = 0.305 m.
Six no. 3 chord bars
Six no. 3 chord bars
Six no. 3 chord bars
Six no. 3 chord bars
-
Winter 2009 | PCI Journal106
Composite double-tee diaphragm
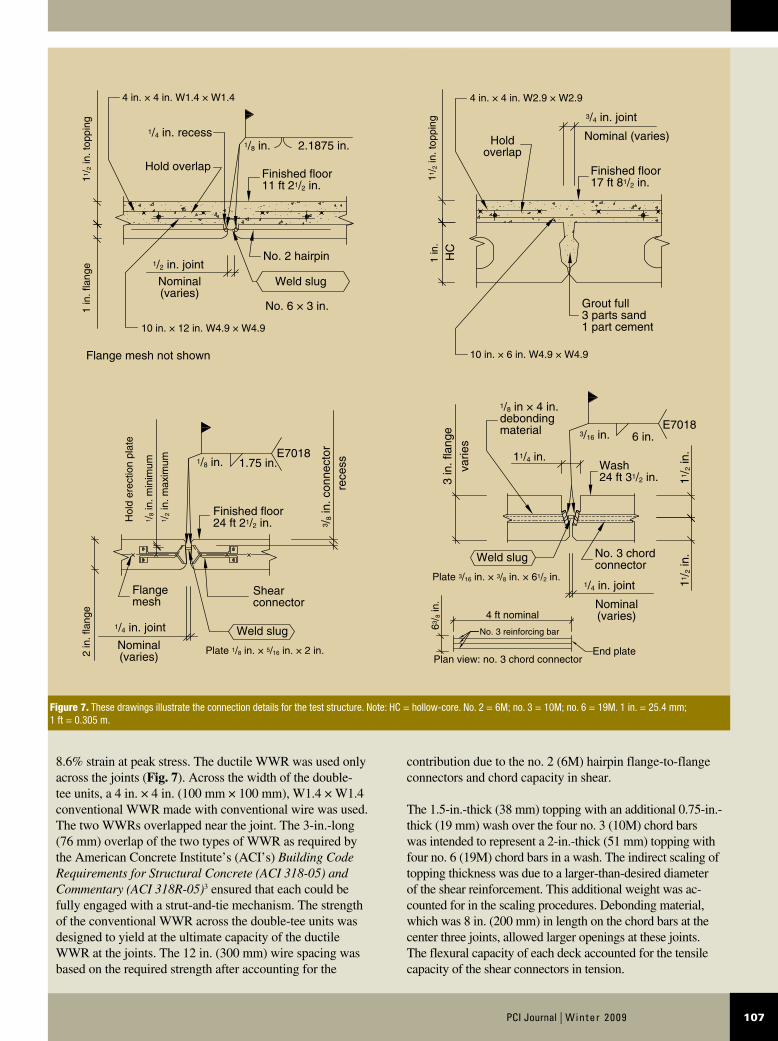
The first-floor level incorporated a composite double-tee diaphragm with 4-ft-wide × 16-ft-long (1.2 m × 4.9 m) double-tees. These double-tees were cast in a full-scale, 4-ft-wide bed. Blockouts added to the bed created a half-scale stem of 10 in. (254 mm). A 1-in.-thick (25 mm) flange replicated a full-scale, 2-in.-thick (51 mm) flange. Each double-tee was prestressed with one 0.5-in.-diameter (13 mm) strand in each stem. Shear reinforcement was provided at the stem ends.
This diaphragm was composite, meaning that the floor units and the cast-in-place concrete topping were relied on for the transfer of in-plane inertia forces. A rough broom finish was applied to maximize the composite action. This produced a finish with about 1/8-in.-thick (3 mm) ridges. Four or five no. 2 (6M) hairpin flange-to-flange connectors were cast into the flange, representing no. 4 (13M) hairpin connections for flange-to-flange composite shear action.
Shear reinforcement within the topping consisted of an in-novative ductile welded-wire reinforcement (WWR) ladder developed at LU.2 The 10 in. × 12 in. (250 mm × 300 mm), W4.9 × W4.9 WWR had a 0.25 in. (6.4 mm) diameter. This was the smallest-diameter wire available without cold working, which is an essential characteristic of the wire that provides the needed ductility.
A strict requirement on the strain capacity ensured that the WWR performed in a ductile manner that was met with an
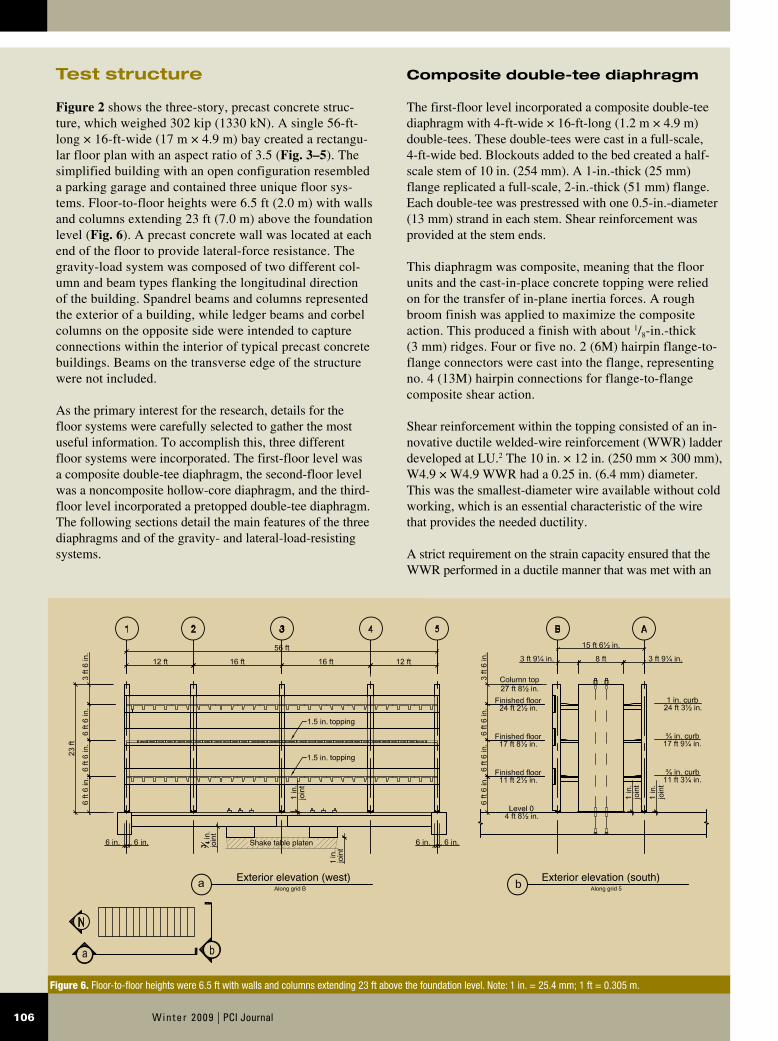
Test structure
Figure 2 shows the three-story, precast concrete struc-ture, which weighed 302 kip (1330 kN). A single 56-ft-long × 16-ft-wide (17 m × 4.9 m) bay created a rectangu-lar floor plan with an aspect ratio of 3.5 (Fig. 3–5). The simplified building with an open configuration resembled a parking garage and contained three unique floor sys-tems. Floor-to-floor heights were 6.5 ft (2.0 m) with walls and columns extending 23 ft (7.0 m) above the foundation level (Fig. 6). A precast concrete wall was located at each end of the floor to provide lateral-force resistance. The gravity-load system was composed of two different col-umn and beam types flanking the longitudinal direction of the building. Spandrel beams and columns represented the exterior of a building, while ledger beams and corbel columns on the opposite side were intended to capture connections within the interior of typical precast concrete buildings. Beams on the transverse edge of the structure were not included.
As the primary interest for the research, details for the floor systems were carefully selected to gather the most useful information. To accomplish this, three different floor systems were incorporated. The first-floor level was a composite double-tee diaphragm, the second-floor level was a noncomposite hollow-core diaphragm, and the third-floor level incorporated a pretopped double-tee diaphragm. The following sections detail the main features of the three diaphragms and of the gravity- and lateral-load-resisting systems.
Figure 6. Floor-to-floor heights were 6.5 ft with walls and columns extending 23 ft above the foundation level. Note: 1 in. = 25.4 mm; 1 ft = 0.305 m.
topping
Exterior elevation (south)Exterior elevation (west)
topping
Shake table platenjoin
t
join
t
join
t
join
t
join
t
107PCI Journal | Winter 2009
contribution due to the no. 2 (6M) hairpin flange-to-flange connectors and chord capacity in shear.
The 1.5-in.-thick (38 mm) topping with an additional 0.75-in.-thick (19 mm) wash over the four no. 3 (10M) chord bars was intended to represent a 2-in.-thick (51 mm) topping with four no. 6 (19M) chord bars in a wash. The indirect scaling of topping thickness was due to a larger-than-desired diameter of the shear reinforcement. This additional weight was ac-counted for in the scaling procedures. Debonding material, which was 8 in. (200 mm) in length on the chord bars at the center three joints, allowed larger openings at these joints. The flexural capacity of each deck accounted for the tensile capacity of the shear connectors in tension.
8.6% strain at peak stress. The ductile WWR was used only across the joints (Fig. 7). Across the width of the double-tee units, a 4 in. × 4 in. (100 mm × 100 mm), W1.4 × W1.4 conventional WWR made with conventional wire was used. The two WWRs overlapped near the joint. The 3-in.-long (76 mm) overlap of the two types of WWR as required by the American Concrete Institute’s (ACI’s) Building Code Requirements for Structural Concrete (ACI 318-05) and Commentary (ACI 318R-05)3 ensured that each could be fully engaged with a strut-and-tie mechanism. The strength of the conventional WWR across the double-tee units was designed to yield at the ultimate capacity of the ductile WWR at the joints. The 12 in. (300 mm) wire spacing was based on the required strength after accounting for the
Figure 7. These drawings illustrate the connection details for the test structure. Note: HC = hollow-core. No. 2 = 6M; no. 3 = 10M; no. 6 = 19M. 1 in. = 25.4 mm; 1 ft = 0.305 m.
3 in
. fla
nge
varie
s
rece
ss
HC
1/8 in × 4 in.debondingmaterial
No. 6 × 3 in.
Wash24 ft 31/2 in.
Finished floor24 ft 21/2 in.
Finished floor11 ft 21/2 in.
Finished floor17 ft 81/2 in.
Grout full3 parts sand1 part cement
11/ 2
in.
11/ 2
in.
3 /8
in. c
onne
ctor
63/ 8
in.
2 in
. fla
nge
Hol
d er
ectio
n pl
ate
1 /8
in. m
inim
um
11/ 2
in. t
oppi
ng
11/ 2
in. t
oppi
ng
1 in
. fla
nge 1
in.
1 /2
in. m
axim
um
4 ft nominal
No. 3 reinforcing bar
End plate
Plate 3/16 in. × 3/8 in. × 61/2 in.
4 in. × 4 in. W1.4 × W1.4 4 in. × 4 in. W2.9 × W2.9
10 in. × 12 in. W4.9 × W4.9
10 in. × 6 in. W4.9 × W4.9
Plate 1/8 in. × 5/16 in. × 2 in.
1/4 in. joint
1/2 in. joint
3/4 in. joint
1/4 in. joint
11/4 in.
3/16 in. 6 in.
1/8 in.
1/8 in.1/4 in. recess
1.75 in.
2.1875 in.
Weld slug
Weld slug
Flangemesh
Shearconnector
Weld slug
Plan view: no. 3 chord connector
E7018
Hold overlap
Flange mesh not shown
No. 2 hairpin
E7018
Nominal(varies)
Nominal(varies)
Nominal (varies)Holdoverlap
Nominal(varies)
No. 3 chordconnector
Winter 2009 | PCI Journal108
units. A 2-in.-thick (50 mm) flange was modeled after a 4-in.-thick (100 mm) prototype flange. The 4-ft-wide (1.2 m) units were 16 ft (4.9 m) long with a wash at each end of the unit to provide sufficient coverage over the no. 3 (10M) chord bars.
The analyses of the test structure indicated that the flexural demands at this level were the largest of the three floors. Six no. 3 (10M) chord bars at each end of the double-tee provided sufficient strength. The reinforcing bars were discontinuous at the joints and were grouped into two dry-chord connectors. In each group of bars, three chord bars were welded at each end to 63/8-in.-long × 1-in.-high × 3/16-in.-thick (160 mm × 25 mm × 5 mm) steel end plates (Fig. 7). End plates were exposed at the flange edge, which allowed field welding to provide the continuity at joints between units to transfer the chord force.
In this diaphragm, the shear strength was provided by proprietary connectors that were specially produced at half scale for the test program. The connectors were cast into the double-tee units at the flange edges and field welded at the joints between units. Great care was taken to ensure that the model connectors were precise, scaled replicas. Individual connectors were tested at LU to quantify the scaled performance.
Gravity system
Five columns on each side of the structure created four bays of precast concrete beams. Spandrel beams were 3 ft (0.9 m) high and 5 in. (130 mm) thick with a 6 in. (150 mm) ledge for the floor elements. A similarly sized ledge was present in the ledger beams, which were 6 in. thick and 19.5 in. (500 mm) tall.
The pocket columns measured 15.5 in. × 12 in. (394 mm × 305 mm), and the corbel column dimensions were 12 in. × 12 in. Well-confined columns with no. 3 (10M) transverse hoops at 2.5 in. (64 mm) ensured the seismic integrity of the gravity system and eliminated a possible shear failure. A prestress force of 15 kip (67 kN) was coupled with eight no. 5 (16M) bars for the longitudinal reinforcement in the columns.
The 0.5 in. (13 mm), 270 ksi (1860 MPa) prestressing strand was stressed to 0.36fpu (where fpu is the ultimate strength of the prestressing strand), and it applied an average stress of 104 psi (0.72 MPa) on the 12-in.-square concrete column. Column anchor bolts on the 10 columns were specified as 3/8-in.-diameter (9.5 mm) A364 threaded rod in an attempt to minimize the shear capacity of the gravity-load system and maximize the floor flexibility.
Lateral-force-resisting system
Two 8-ft-long × 23-ft-tall × 8-in.-thick (2.4 m × 7.0 m × 200 mm) rocking walls5–7 composed the vertical elements
Noncomposite hollow-core diaphragm
The second-floor level incorporated a noncomposite hollow-core diaphragm. The 4-in.-deep (100 mm) hollow-core units were produced from a full-scale bed representing an 8-in.-deep (200 mm) prototype floor. The floor units were rip cut with a keyway from a 40-in.-wide (1.0 m) standard bed to create 20-in.-wide × 16-ft-long (0.50 m × 4.9 m) units. Widths of the end units and center units were modified to accommodate the bay widths.
The in-plane diaphragm flexural strength was provided by two no. 3 (10M) chord bars embedded in a 1.5-in.-thick (38 mm) topping with a 0.75-in.-thick (19 mm) wash over the chord reinforcement. The same scaling considerations for the topping of the first-floor diaphragm were applicable to the second floor. Debonding material, 8 in. (200 mm) in length, was placed on the chord bars at the column lines. A smaller number of chord bars was included in this floor be-cause of its location in the structural system. Nonlinear dy-namic time history analyses conducted by the research team indicated that lower demands were expected at this floor level. To achieve a similar demand-to-strength ratio as the other two floors, a reduced flexural capacity was provided.
With an in-plane shear strength based on a noncomposite system and the same diameter ductile WWR as in the first floor, a smaller spacing between wires was used in compari-son with the first floor. The WWR was 10 in. × 6 in. (250 mm × 150 mm). The 6 in. spacing provided the required steel area for the hollow-core diaphragm. This spacing was reduced in comparison with the 12 in. (300 mm) spacing used in the first floor because of the composite ac-tion and flange-to-flange connectors in that diaphragm.
A capacity design approach ensured that the conventional WWR across the width of the hollow-core units had suf-ficient strength at yield to transfer the ultimate strength of the ductile WWR at the joints, which it overlapped by 3 in. (76 mm). This overlap ensured that the force transfer between the two WWRs could be developed with a strut-and-tie mechanism to meet the provisions of ACI 318-05. The conventional WWR—a 4 in. × 4 in., W2.9 × W2.9—was cut to the length and width of each hollow-core unit so that only the ductile WWR crossed the joints. The grouted shear keys provided continuity between hollow-core units, but the shear capacity calculations did not account for shear friction in the keyway. The shear capacity did ac-count for the strength of the chord reinforcement.
Pretopped double-tee diaphragm
A pretopped double-tee diaphragm was located on the third floor of the test structure. The precast concrete double-tees were cast from the same full-scale bed as the first-floor units with blockouts in the stem creating the half-scale
109PCI Journal | Winter 2009
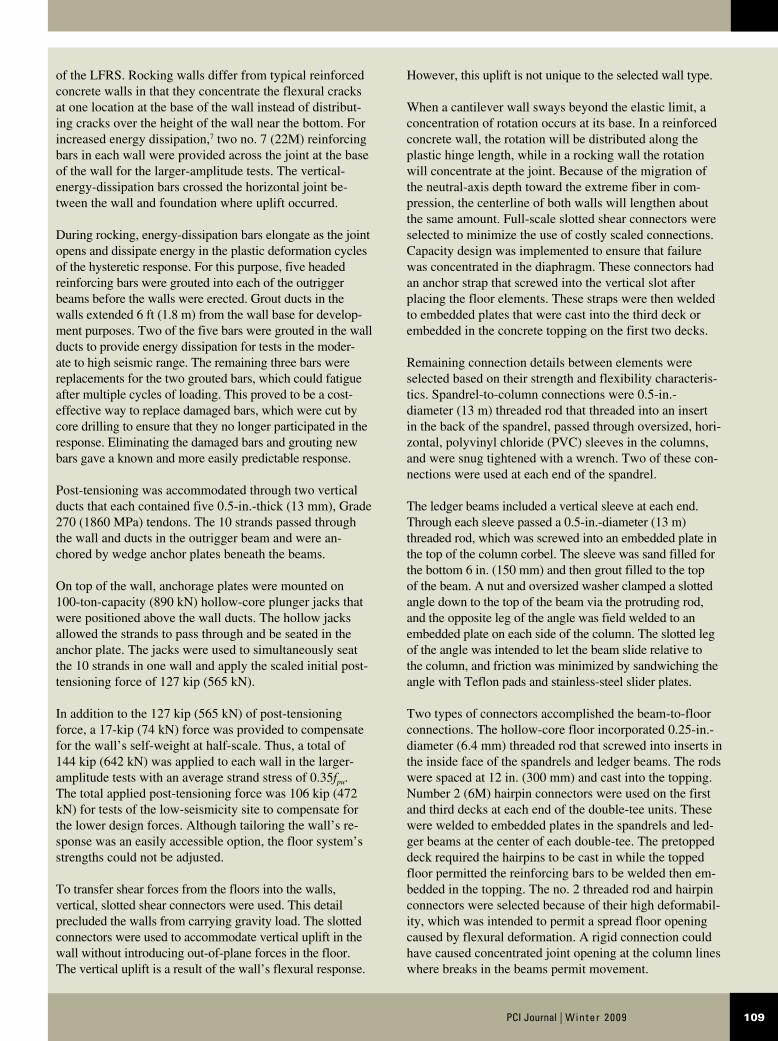
of the LFRS. Rocking walls differ from typical reinforced concrete walls in that they concentrate the flexural cracks at one location at the base of the wall instead of distribut-ing cracks over the height of the wall near the bottom. For increased energy dissipation,7 two no. 7 (22M) reinforcing bars in each wall were provided across the joint at the base of the wall for the larger-amplitude tests. The vertical- energy-dissipation bars crossed the horizontal joint be-tween the wall and foundation where uplift occurred.
During rocking, energy-dissipation bars elongate as the joint opens and dissipate energy in the plastic deformation cycles of the hysteretic response. For this purpose, five headed reinforcing bars were grouted into each of the outrigger beams before the walls were erected. Grout ducts in the walls extended 6 ft (1.8 m) from the wall base for develop-ment purposes. Two of the five bars were grouted in the wall ducts to provide energy dissipation for tests in the moder-ate to high seismic range. The remaining three bars were replacements for the two grouted bars, which could fatigue after multiple cycles of loading. This proved to be a cost-effective way to replace damaged bars, which were cut by core drilling to ensure that they no longer participated in the response. Eliminating the damaged bars and grouting new bars gave a known and more easily predictable response.
Post-tensioning was accommodated through two vertical ducts that each contained five 0.5-in.-thick (13 mm), Grade 270 (1860 MPa) tendons. The 10 strands passed through the wall and ducts in the outrigger beam and were an-chored by wedge anchor plates beneath the beams.
On top of the wall, anchorage plates were mounted on 100-ton-capacity (890 kN) hollow-core plunger jacks that were positioned above the wall ducts. The hollow jacks allowed the strands to pass through and be seated in the anchor plate. The jacks were used to simultaneously seat the 10 strands in one wall and apply the scaled initial post-tensioning force of 127 kip (565 kN).
In addition to the 127 kip (565 kN) of post-tensioning force, a 17-kip (74 kN) force was provided to compensate for the wall’s self-weight at half-scale. Thus, a total of 144 kip (642 kN) was applied to each wall in the larger-amplitude tests with an average strand stress of 0.35fpu. The total applied post-tensioning force was 106 kip (472 kN) for tests of the low-seismicity site to compensate for the lower design forces. Although tailoring the wall’s re-sponse was an easily accessible option, the floor system’s strengths could not be adjusted.
To transfer shear forces from the floors into the walls, vertical, slotted shear connectors were used. This detail precluded the walls from carrying gravity load. The slotted connectors were used to accommodate vertical uplift in the wall without introducing out-of-plane forces in the floor. The vertical uplift is a result of the wall’s flexural response.
However, this uplift is not unique to the selected wall type.
When a cantilever wall sways beyond the elastic limit, a concentration of rotation occurs at its base. In a reinforced concrete wall, the rotation will be distributed along the plastic hinge length, while in a rocking wall the rotation will concentrate at the joint. Because of the migration of the neutral-axis depth toward the extreme fiber in com-pression, the centerline of both walls will lengthen about the same amount. Full-scale slotted shear connectors were selected to minimize the use of costly scaled connections. Capacity design was implemented to ensure that failure was concentrated in the diaphragm. These connectors had an anchor strap that screwed into the vertical slot after placing the floor elements. These straps were then welded to embedded plates that were cast into the third deck or embedded in the concrete topping on the first two decks.
Remaining connection details between elements were selected based on their strength and flexibility characteris-tics. Spandrel-to-column connections were 0.5-in.- diameter (13 m) threaded rod that threaded into an insert in the back of the spandrel, passed through oversized, hori-zontal, polyvinyl chloride (PVC) sleeves in the columns, and were snug tightened with a wrench. Two of these con-nections were used at each end of the spandrel.
The ledger beams included a vertical sleeve at each end. Through each sleeve passed a 0.5-in.-diameter (13 m) threaded rod, which was screwed into an embedded plate in the top of the column corbel. The sleeve was sand filled for the bottom 6 in. (150 mm) and then grout filled to the top of the beam. A nut and oversized washer clamped a slotted angle down to the top of the beam via the protruding rod, and the opposite leg of the angle was field welded to an embedded plate on each side of the column. The slotted leg of the angle was intended to let the beam slide relative to the column, and friction was minimized by sandwiching the angle with Teflon pads and stainless-steel slider plates.
Two types of connectors accomplished the beam-to-floor connections. The hollow-core floor incorporated 0.25-in.-diameter (6.4 mm) threaded rod that screwed into inserts in the inside face of the spandrels and ledger beams. The rods were spaced at 12 in. (300 mm) and cast into the topping. Number 2 (6M) hairpin connectors were used on the first and third decks at each end of the double-tee units. These were welded to embedded plates in the spandrels and led-ger beams at the center of each double-tee. The pretopped deck required the hairpins to be cast in while the topped floor permitted the reinforcing bars to be welded then em-bedded in the topping. The no. 2 threaded rod and hairpin connectors were selected because of their high deformabil-ity, which was intended to permit a spread floor opening caused by flexural deformation. A rigid connection could have caused concentrated joint opening at the column lines where breaks in the beams permit movement.
Winter 2009 | PCI Journal110
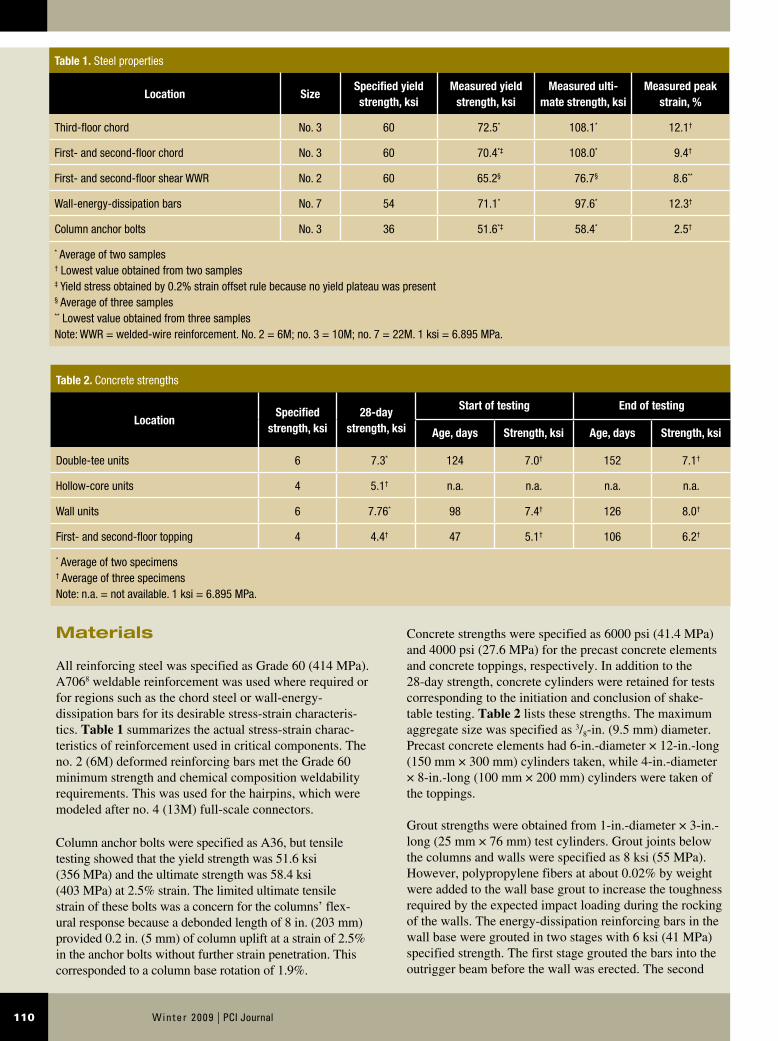
Concrete strengths were specified as 6000 psi (41.4 MPa) and 4000 psi (27.6 MPa) for the precast concrete elements and concrete toppings, respectively. In addition to the 28-day strength, concrete cylinders were retained for tests corresponding to the initiation and conclusion of shake-table testing. Table 2 lists these strengths. The maximum aggregate size was specified as 3/8-in. (9.5 mm) diameter. Precast concrete elements had 6-in.-diameter × 12-in.-long (150 mm × 300 mm) cylinders taken, while 4-in.-diameter × 8-in.-long (100 mm × 200 mm) cylinders were taken of the toppings.
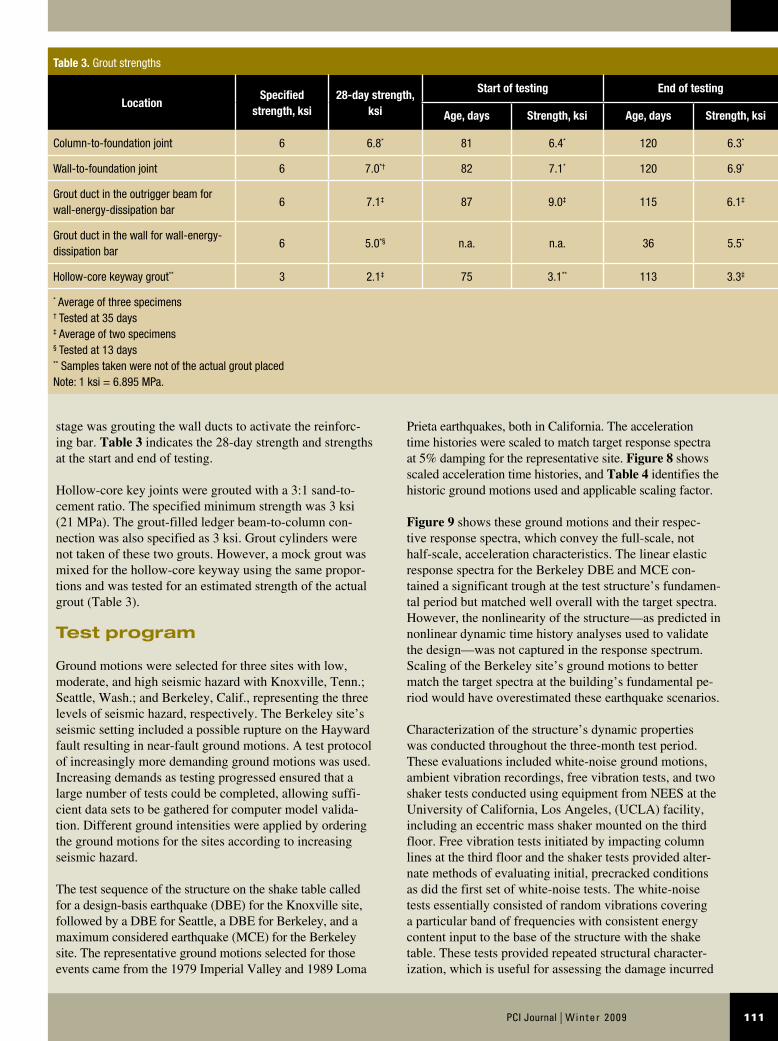
Grout strengths were obtained from 1-in.-diameter × 3-in.-long (25 mm × 76 mm) test cylinders. Grout joints below the columns and walls were specified as 8 ksi (55 MPa). However, polypropylene fibers at about 0.02% by weight were added to the wall base grout to increase the toughness required by the expected impact loading during the rocking of the walls. The energy-dissipation reinforcing bars in the wall base were grouted in two stages with 6 ksi (41 MPa) specified strength. The first stage grouted the bars into the outrigger beam before the wall was erected. The second
Materials
All reinforcing steel was specified as Grade 60 (414 MPa). A7068 weldable reinforcement was used where required or for regions such as the chord steel or wall-energy- dissipation bars for its desirable stress-strain characteris-tics. Table 1 summarizes the actual stress-strain charac-teristics of reinforcement used in critical components. The no. 2 (6M) deformed reinforcing bars met the Grade 60 minimum strength and chemical composition weldability requirements. This was used for the hairpins, which were modeled after no. 4 (13M) full-scale connectors.
Column anchor bolts were specified as A36, but tensile testing showed that the yield strength was 51.6 ksi (356 MPa) and the ultimate strength was 58.4 ksi (403 MPa) at 2.5% strain. The limited ultimate tensile strain of these bolts was a concern for the columns’ flex-ural response because a debonded length of 8 in. (203 mm) provided 0.2 in. (5 mm) of column uplift at a strain of 2.5% in the anchor bolts without further strain penetration. This corresponded to a column base rotation of 1.9%.
Table 2. Concrete strengths
LocationSpecified
strength, ksi28-day
strength, ksi
Start of testing End of testing
Age, days Strength, ksi Age, days Strength, ksi
Double-tee units 6 7.3* 124 7.0† 152 7.1†
Hollow-core units 4 5.1† n.a. n.a. n.a. n.a.
Wall units 6 7.76* 98 7.4† 126 8.0†
First- and second-floor topping 4 4.4† 47 5.1† 106 6.2†
* Average of two specimens† Average of three specimensNote: n.a. = not available. 1 ksi = 6.895 MPa.
Table 1. Steel properties
Location SizeSpecified yield strength, ksi
Measured yield strength, ksi
Measured ulti-mate strength, ksi
Measured peak strain, %
Third-floor chord No. 3 60 72.5* 108.1* 12.1†
First- and second-floor chord No. 3 60 70.4*‡ 108.0* 9.4†
First- and second-floor shear WWR No. 2 60 65.2§ 76.7§ 8.6**
Wall-energy-dissipation bars No. 7 54 71.1* 97.6* 12.3†
Column anchor bolts No. 3 36 51.6*‡ 58.4* 2.5†
* Average of two samples† Lowest value obtained from two samples‡ Yield stress obtained by 0.2% strain offset rule because no yield plateau was present§ Average of three samples** Lowest value obtained from three samplesNote: WWR = welded-wire reinforcement. No. 2 = 6M; no. 3 = 10M; no. 7 = 22M. 1 ksi = 6.895 MPa.
111PCI Journal | Winter 2009
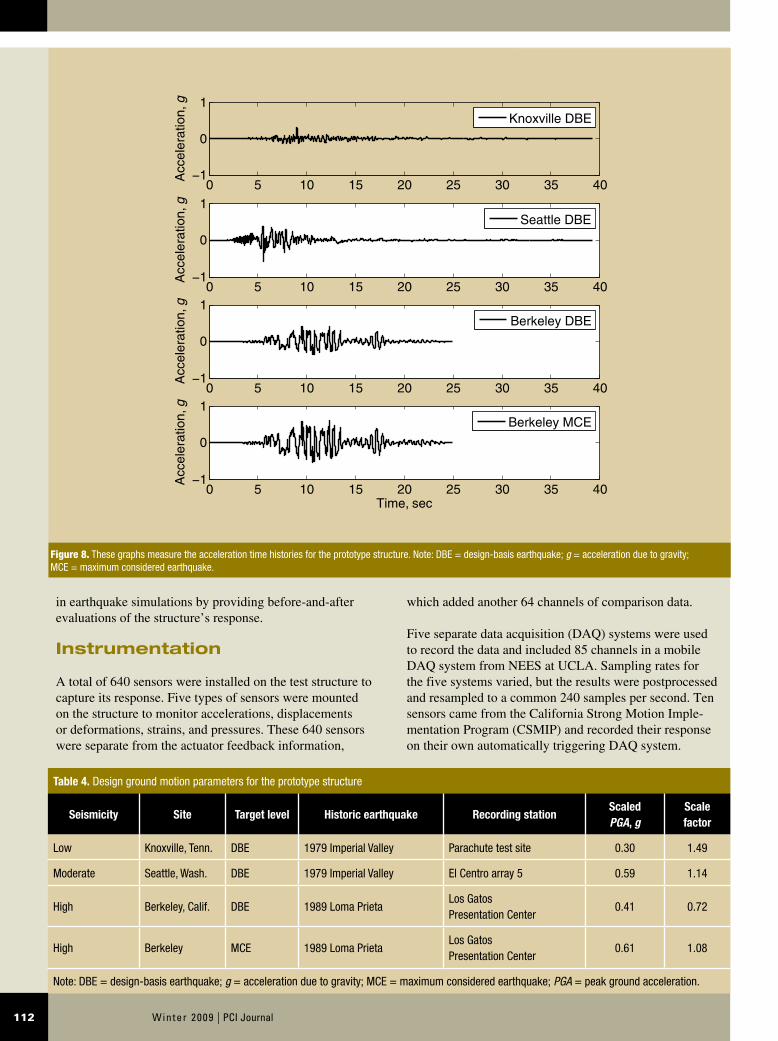
Prieta earthquakes, both in California. The acceleration time histories were scaled to match target response spectra at 5% damping for the representative site. Figure 8 shows scaled acceleration time histories, and Table 4 identifies the historic ground motions used and applicable scaling factor.
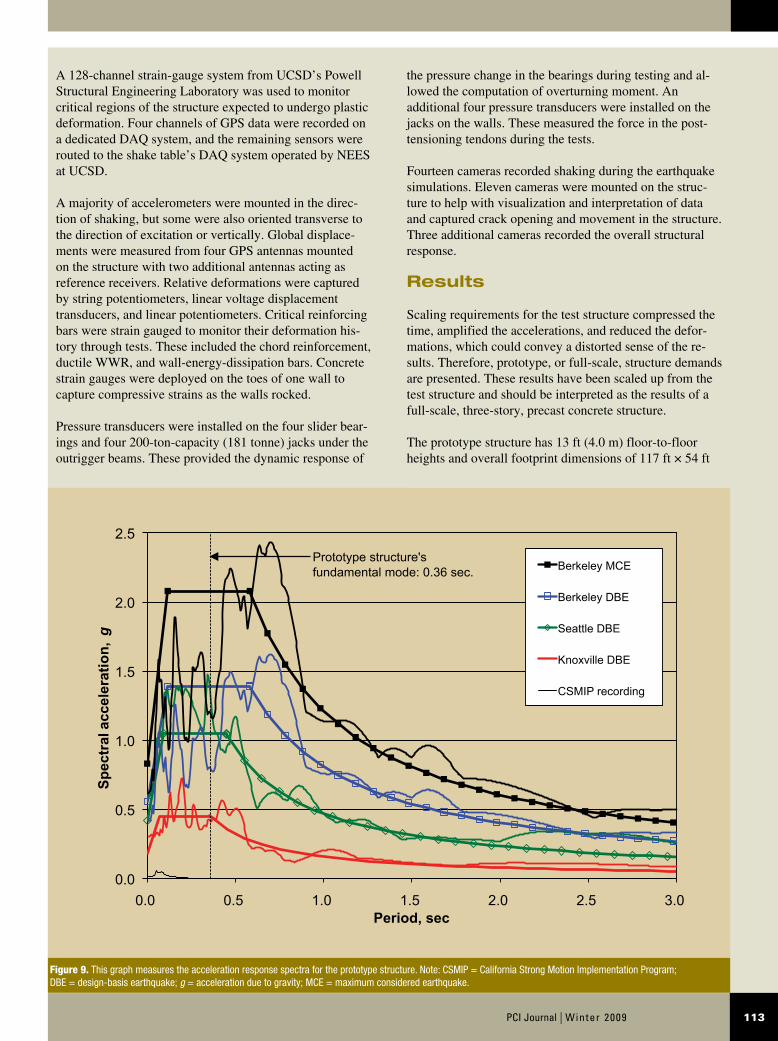
Figure 9 shows these ground motions and their respec-tive response spectra, which convey the full-scale, not half-scale, acceleration characteristics. The linear elastic response spectra for the Berkeley DBE and MCE con-tained a significant trough at the test structure’s fundamen-tal period but matched well overall with the target spectra. However, the nonlinearity of the structure—as predicted in nonlinear dynamic time history analyses used to validate the design—was not captured in the response spectrum. Scaling of the Berkeley site’s ground motions to better match the target spectra at the building’s fundamental pe-riod would have overestimated these earthquake scenarios.
Characterization of the structure’s dynamic properties was conducted throughout the three-month test period. These evaluations included white-noise ground motions, ambient vibration recordings, free vibration tests, and two shaker tests conducted using equipment from NEES at the University of California, Los Angeles, (UCLA) facility, including an eccentric mass shaker mounted on the third floor. Free vibration tests initiated by impacting column lines at the third floor and the shaker tests provided alter-nate methods of evaluating initial, precracked conditions as did the first set of white-noise tests. The white-noise tests essentially consisted of random vibrations covering a particular band of frequencies with consistent energy content input to the base of the structure with the shake table. These tests provided repeated structural character-ization, which is useful for assessing the damage incurred
stage was grouting the wall ducts to activate the reinforc-ing bar. Table 3 indicates the 28-day strength and strengths at the start and end of testing.
Hollow-core key joints were grouted with a 3:1 sand-to-cement ratio. The specified minimum strength was 3 ksi (21 MPa). The grout-filled ledger beam-to-column con-nection was also specified as 3 ksi. Grout cylinders were not taken of these two grouts. However, a mock grout was mixed for the hollow-core keyway using the same propor-tions and was tested for an estimated strength of the actual grout (Table 3).
Test program
Ground motions were selected for three sites with low, moderate, and high seismic hazard with Knoxville, Tenn.; Seattle, Wash.; and Berkeley, Calif., representing the three levels of seismic hazard, respectively. The Berkeley site’s seismic setting included a possible rupture on the Hayward fault resulting in near-fault ground motions. A test protocol of increasingly more demanding ground motions was used. Increasing demands as testing progressed ensured that a large number of tests could be completed, allowing suffi-cient data sets to be gathered for computer model valida-tion. Different ground intensities were applied by ordering the ground motions for the sites according to increasing seismic hazard.
The test sequence of the structure on the shake table called for a design-basis earthquake (DBE) for the Knoxville site, followed by a DBE for Seattle, a DBE for Berkeley, and a maximum considered earthquake (MCE) for the Berkeley site. The representative ground motions selected for those events came from the 1979 Imperial Valley and 1989 Loma
Table 3. Grout strengths
LocationSpecified
strength, ksi28-day strength,
ksi
Start of testing End of testing
Age, days Strength, ksi Age, days Strength, ksi
Column-to-foundation joint 6 6.8* 81 6.4* 120 6.3*
Wall-to-foundation joint 6 7.0*† 82 7.1* 120 6.9*
Grout duct in the outrigger beam for wall-energy-dissipation bar
6 7.1‡ 87 9.0‡ 115 6.1‡
Grout duct in the wall for wall-energy- dissipation bar
6 5.0*§ n.a. n.a. 36 5.5*
Hollow-core keyway grout** 3 2.1‡ 75 3.1** 113 3.3‡
* Average of three specimens† Tested at 35 days‡ Average of two specimens§ Tested at 13 days** Samples taken were not of the actual grout placedNote: 1 ksi = 6.895 MPa.
Winter 2009 | PCI Journal112
which added another 64 channels of comparison data.
Five separate data acquisition (DAQ) systems were used to record the data and included 85 channels in a mobile DAQ system from NEES at UCLA. Sampling rates for the five systems varied, but the results were postprocessed and resampled to a common 240 samples per second. Ten sensors came from the California Strong Motion Imple-mentation Program (CSMIP) and recorded their response on their own automatically triggering DAQ system.
in earthquake simulations by providing before-and-after evaluations of the structure’s response.
Instrumentation
A total of 640 sensors were installed on the test structure to capture its response. Five types of sensors were mounted on the structure to monitor accelerations, displacements or deformations, strains, and pressures. These 640 sensors were separate from the actuator feedback information,
Figure 8. These graphs measure the acceleration time histories for the prototype structure. Note: DBE = design-basis earthquake; g = acceleration due to gravity; MCE = maximum considered earthquake.
0 5 10 15 20 25 30 35 40−1
0
1
Acc
eler
atio
n,g
Knoxville DBE
0 5 10 15 20 25 30 35 40−1
0
1
Acc
eler
atio
n,g
Seattle DBE
0 5 10 15 20 25 30 35 40−1
0
1
Acc
eler
atio
n,g
Berkeley DBE
0 5 10 15 20 25 30 35 40−1
0
1
Acc
eler
atio
n,g
Time, sec
Berkeley MCE
Table 4. Design ground motion parameters for the prototype structure
Seismicity Site Target level Historic earthquake Recording stationScaled PGA, g
Scale factor
Low Knoxville, Tenn. DBE 1979 Imperial Valley Parachute test site 0.30 1.49
Moderate Seattle, Wash. DBE 1979 Imperial Valley El Centro array 5 0.59 1.14
High Berkeley, Calif. DBE 1989 Loma PrietaLos Gatos Presentation Center
0.41 0.72
High Berkeley MCE 1989 Loma PrietaLos Gatos Presentation Center
0.61 1.08
Note: DBE = design-basis earthquake; g = acceleration due to gravity; MCE = maximum considered earthquake; PGA = peak ground acceleration.
113PCI Journal | Winter 2009
the pressure change in the bearings during testing and al-lowed the computation of overturning moment. An additional four pressure transducers were installed on the jacks on the walls. These measured the force in the post-tensioning tendons during the tests.
Fourteen cameras recorded shaking during the earthquake simulations. Eleven cameras were mounted on the struc-ture to help with visualization and interpretation of data and captured crack opening and movement in the structure. Three additional cameras recorded the overall structural response.
Results
Scaling requirements for the test structure compressed the time, amplified the accelerations, and reduced the defor-mations, which could convey a distorted sense of the re-sults. Therefore, prototype, or full-scale, structure demands are presented. These results have been scaled up from the test structure and should be interpreted as the results of a full-scale, three-story, precast concrete structure.
The prototype structure has 13 ft (4.0 m) floor-to-floor heights and overall footprint dimensions of 117 ft × 54 ft
A 128-channel strain-gauge system from UCSD’s Powell Structural Engineering Laboratory was used to monitor critical regions of the structure expected to undergo plastic deformation. Four channels of GPS data were recorded on a dedicated DAQ system, and the remaining sensors were routed to the shake table’s DAQ system operated by NEES at UCSD.
A majority of accelerometers were mounted in the direc-tion of shaking, but some were also oriented transverse to the direction of excitation or vertically. Global displace-ments were measured from four GPS antennas mounted on the structure with two additional antennas acting as reference receivers. Relative deformations were captured by string potentiometers, linear voltage displacement transducers, and linear potentiometers. Critical reinforcing bars were strain gauged to monitor their deformation his-tory through tests. These included the chord reinforcement, ductile WWR, and wall-energy-dissipation bars. Concrete strain gauges were deployed on the toes of one wall to capture compressive strains as the walls rocked.
Pressure transducers were installed on the four slider bear-ings and four 200-ton-capacity (181 tonne) jacks under the outrigger beams. These provided the dynamic response of
Figure 9. This graph measures the acceleration response spectra for the prototype structure. Note: CSMIP = California Strong Motion Implementation Program; DBE = design-basis earthquake; g = acceleration due to gravity; MCE = maximum considered earthquake.
0.0
0.5
1.0
1.5
2.0
2.5
0.0 0.5 1.0 1.5 2.0 2.5 3.0
Spec
tral
acc
eler
atio
n, g
Period, sec
Berkeley MCE
Berkeley DBE
Seattle DBE
Knoxville DBE
CSMIP recording
Prototype structure's fundamental mode: 0.36 sec.
Winter 2009 | PCI Journal114
post-tensioning force allowed minor rocking of the wall during these tests. No energy dissipation was used (that is, the bars were not grouted) at this level of shaking.
Analyses of the third test showed that a maximum 0.33% rotation occurred at the wall base. A maximum 0.23% roof drift ratio was obtained by double integration through specialized algorithms of measured accelerations at the foundation and diaphragm center. The 0.23% roof drift ratio was obtained from an accelerometer located on the pretopped third floor at the center of the diaphragm and will be referred to as δr,dia. At the same instant that δr,dia was measured, the roof drift ratio obtained from an accel-erometer located next to either wall was 0.20%, indicating diaphragm amplification.
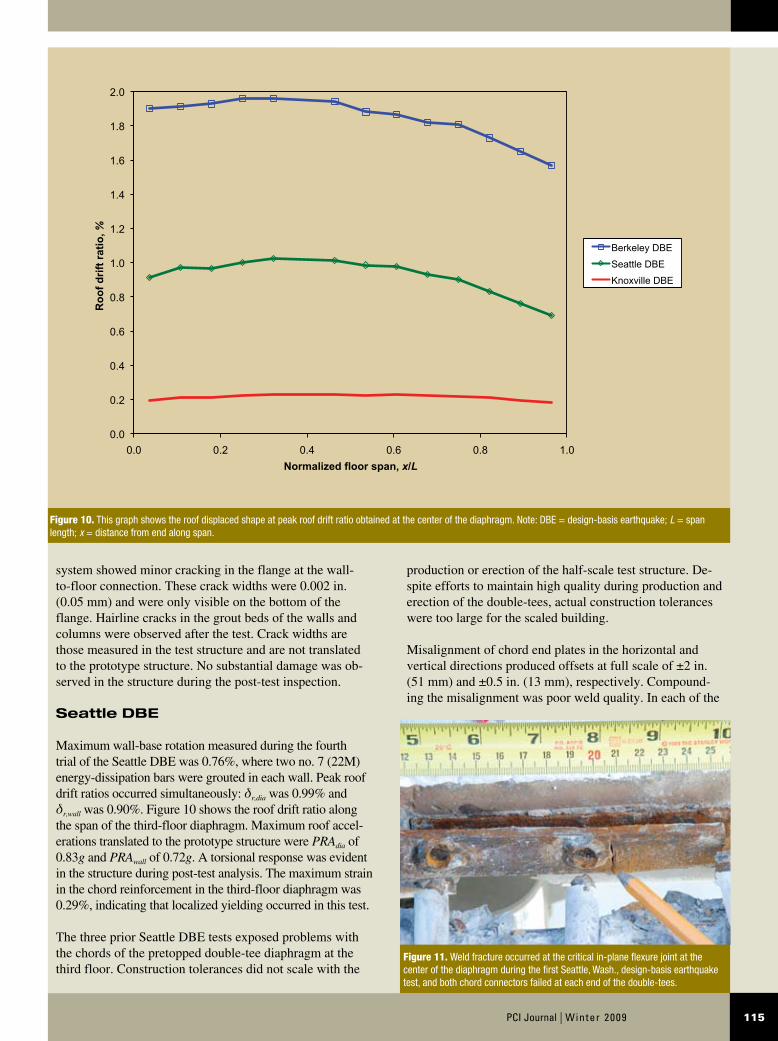
The maximum roof drift ratio obtained next to either wall δr,wall was 0.36%. A torsional response introduced by unsymmetrical wall response was evident in the results. Figure 10 shows the displaced shape of the roof in terms of the roof drift ratio at peak δr,dia.
Peak accelerations measured on the roof were 0.56g and 0.57g for the diaphragm center and diaphragm end, re-spectively. These accelerations will be denoted PRAdia and PRAwall for the center and end of the diaphragm, respec-tively. The maximum chord strain was 0.0016 in./in. or 70% of the yield strain.
After testing, close inspection of the diaphragms showed minor cracking in the first two floors. The existing hairline cracks did not widen in either of the two levels. However, six additional cracks were present in the topped double-tee floor. Nine of the thirteen joints on this level were cracked the full length of the double-tee, corresponding to the flange-to-flange joint. On the topped hollow-core floor, two hairline cracks at the center joint extended 3 ft to 4 ft (0.9 m to 1.2 m) from each end of the hollow-core units.
Temperature effects elongated the cracks on the two floors in the days following testing. The pretopped double-tee
(35.7 m × 16.5 m). Fundamental periods and mode shapes were identified based on the results of the UCLA shaker tests.9 Translated to the prototype structure, a 0.36 sec period was obtained for the fundamental mode in the build-ing’s transverse direction.
Before the test sequence commenced, a naturally occurring earthquake with an epicentral distance of 31 mi (49 km) away from the shake-table site was recorded by CSMIP sensors. The minor earthquake with a moment magnitude of 3.710 resulted in a 0.015g peak ground acceleration (PGA) at the structure’s base but was sufficient to trigger the CSMIP DAQ. The low-intensity shaking produced the response spectrum identified as “CSMIP recording” in Fig. 9.
Pretest shrinkage cracking was observed in the two field-topped floor systems. The first-floor level—the topped double-tee system—contained three hairline shrinkage cracks extending the length of the double-tee at flange-to-flange joints near the center of the diaphragm. The second-floor level—the topped hollow-core system—also contained hairline temperature or shrinkage cracks at the edges of the floor. Hairline crack width is defined here as about 0.004 in. (0.1 mm). No other cracks were evident in the test structure prior to testing.
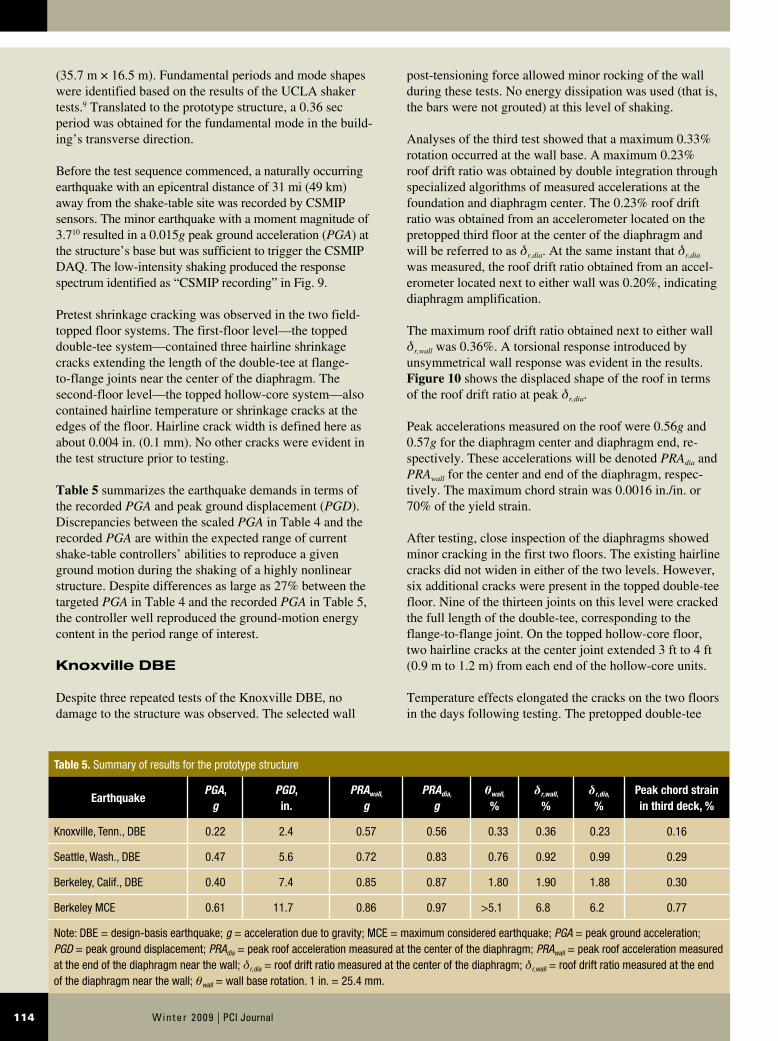
Table 5 summarizes the earthquake demands in terms of the recorded PGA and peak ground displacement (PGD). Discrepancies between the scaled PGA in Table 4 and the recorded PGA are within the expected range of current shake-table controllers’ abilities to reproduce a given ground motion during the shaking of a highly nonlinear structure. Despite differences as large as 27% between the targeted PGA in Table 4 and the recorded PGA in Table 5, the controller well reproduced the ground-motion energy content in the period range of interest.
Knoxville DBE
Despite three repeated tests of the Knoxville DBE, no damage to the structure was observed. The selected wall
Table 5. Summary of results for the prototype structure
EarthquakePGA,
gPGD, in.
PRAwall, g
PRAdia, g
θwall, %
δr,wall, %
δr,dia, %
Peak chord strain in third deck, %
Knoxville, Tenn., DBE 0.22 2.4 0.57 0.56 0.33 0.36 0.23 0.16
Seattle, Wash., DBE 0.47 5.6 0.72 0.83 0.76 0.92 0.99 0.29
Berkeley, Calif., DBE 0.40 7.4 0.85 0.87 1.80 1.90 1.88 0.30
Berkeley MCE 0.61 11.7 0.86 0.97 >5.1 6.8 6.2 0.77
Note: DBE = design-basis earthquake; g = acceleration due to gravity; MCE = maximum considered earthquake; PGA = peak ground acceleration; PGD = peak ground displacement; PRAdia = peak roof acceleration measured at the center of the diaphragm; PRAwall = peak roof acceleration measured at the end of the diaphragm near the wall; δr,dia = roof drift ratio measured at the center of the diaphragm; δr,wall = roof drift ratio measured at the end of the diaphragm near the wall; θwall = wall base rotation. 1 in. = 25.4 mm.
115PCI Journal | Winter 2009
production or erection of the half-scale test structure. De-spite efforts to maintain high quality during production and erection of the double-tees, actual construction tolerances were too large for the scaled building.
Misalignment of chord end plates in the horizontal and vertical directions produced offsets at full scale of ±2 in. (51 mm) and ±0.5 in. (13 mm), respectively. Compound-ing the misalignment was poor weld quality. In each of the
system showed minor cracking in the flange at the wall- to-floor connection. These crack widths were 0.002 in. (0.05 mm) and were only visible on the bottom of the flange. Hairline cracks in the grout beds of the walls and columns were observed after the test. Crack widths are those measured in the test structure and are not translated to the prototype structure. No substantial damage was ob-served in the structure during the post-test inspection.
Seattle DBE
Maximum wall-base rotation measured during the fourth trial of the Seattle DBE was 0.76%, where two no. 7 (22M) energy-dissipation bars were grouted in each wall. Peak roof drift ratios occurred simultaneously: δr,dia was 0.99% and δr,wall was 0.90%. Figure 10 shows the roof drift ratio along the span of the third-floor diaphragm. Maximum roof accel-erations translated to the prototype structure were PRAdia of 0.83g and PRAwall of 0.72g. A torsional response was evident in the structure during post-test analysis. The maximum strain in the chord reinforcement in the third-floor diaphragm was 0.29%, indicating that localized yielding occurred in this test.
The three prior Seattle DBE tests exposed problems with the chords of the pretopped double-tee diaphragm at the third floor. Construction tolerances did not scale with the
Figure 10. This graph shows the roof displaced shape at peak roof drift ratio obtained at the center of the diaphragm. Note: DBE = design-basis earthquake; L = span length; x = distance from end along span.
0.0
0.2
0.4
0.6
0.8
1.0
1.2
1.4
1.6
1.8
2.0
0.0 0.2 0.4 0.6 0.8 1.0
Roo
f drif
t rat
io, %
Normalized floor span, x/L
Berkeley DBE
Seattle DBE
Knoxville DBE
Figure 11. Weld fracture occurred at the critical in-plane flexure joint at the center of the diaphragm during the first Seattle, Wash., design-basis earthquake test, and both chord connectors failed at each end of the double-tees.
Winter 2009 | PCI Journal116
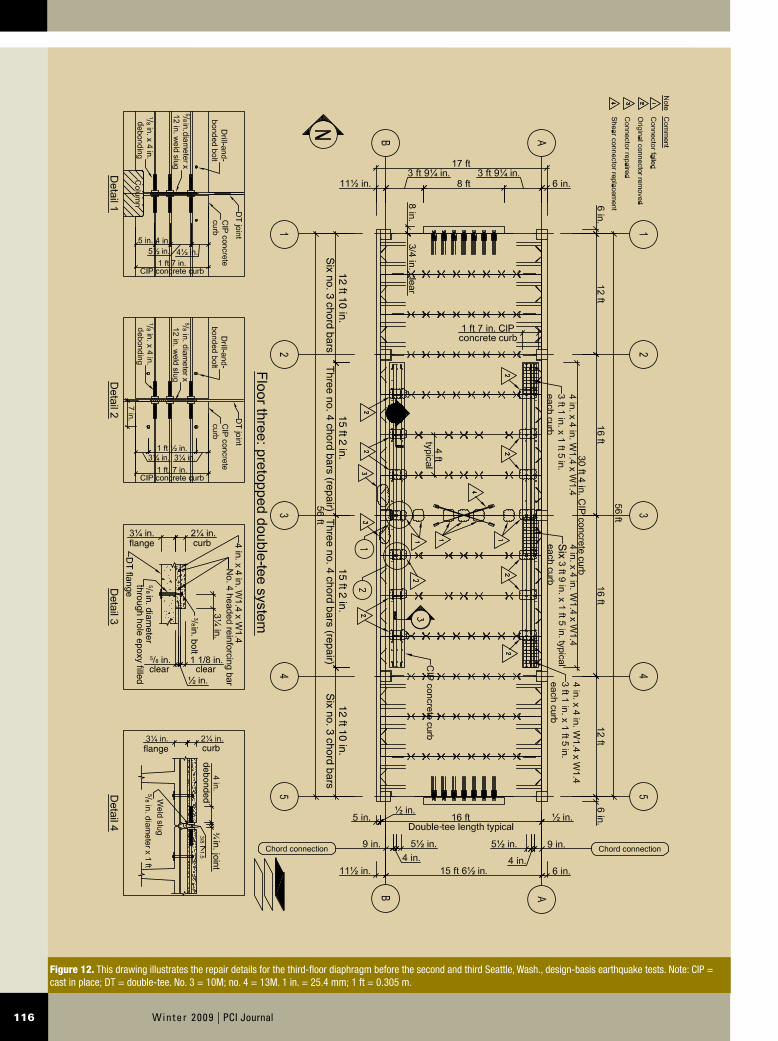
Figure 12. This drawing illustrates the repair details for the third-floor diaphragm before the second and third Seattle, Wash., design-basis earthquake tests. Note: CIP = cast in place; DT = double-tee. No. 3 = 10M; no. 4 = 13M. 1 in. = 25.4 mm; 1 ft = 0.305 m.
3/8
1/81/8
5/8
5/8
5/8
5/85/8
-
Six no. 3 chord bars
12 ft 10 in.12 ft 10 in.
15 ft 2 in.15 ft 2 in.
in. diameter
through hole epoxy filled
in. bolt
flange
flange
debondedin. joint
clearclear
curb
curb
-
Six no. 3 chord bars
Six
Three no. 4 chord bars (repair)
Three no. 4 chord bars (repair)
117PCI Journal | Winter 2009
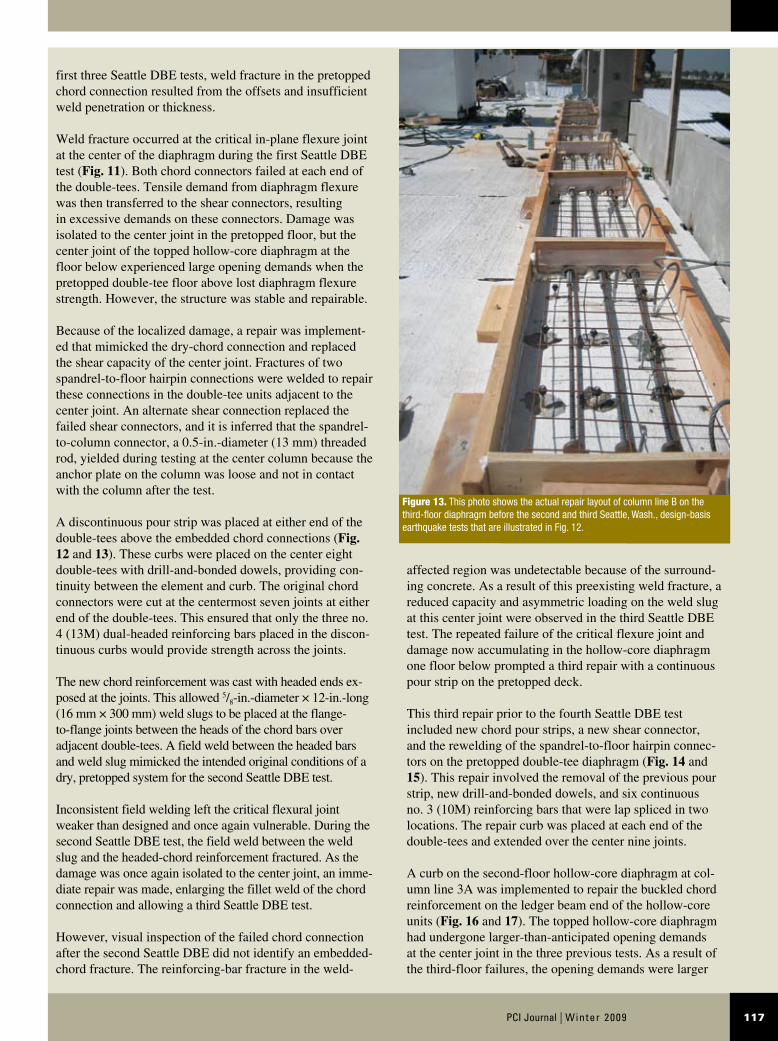
first three Seattle DBE tests, weld fracture in the pretopped chord connection resulted from the offsets and insufficient weld penetration or thickness.
Weld fracture occurred at the critical in-plane flexure joint at the center of the diaphragm during the first Seattle DBE test (Fig. 11). Both chord connectors failed at each end of the double-tees. Tensile demand from diaphragm flexure was then transferred to the shear connectors, resulting in excessive demands on these connectors. Damage was isolated to the center joint in the pretopped floor, but the center joint of the topped hollow-core diaphragm at the floor below experienced large opening demands when the pretopped double-tee floor above lost diaphragm flexure strength. However, the structure was stable and repairable.
Because of the localized damage, a repair was implement-ed that mimicked the dry-chord connection and replaced the shear capacity of the center joint. Fractures of two spandrel-to-floor hairpin connections were welded to repair these connections in the double-tee units adjacent to the center joint. An alternate shear connection replaced the failed shear connectors, and it is inferred that the spandrel-to-column connector, a 0.5-in.-diameter (13 mm) threaded rod, yielded during testing at the center column because the anchor plate on the column was loose and not in contact with the column after the test.
A discontinuous pour strip was placed at either end of the double-tees above the embedded chord connections (Fig. 12 and 13). These curbs were placed on the center eight double-tees with drill-and-bonded dowels, providing con-tinuity between the element and curb. The original chord connectors were cut at the centermost seven joints at either end of the double-tees. This ensured that only the three no. 4 (13M) dual-headed reinforcing bars placed in the discon-tinuous curbs would provide strength across the joints.
The new chord reinforcement was cast with headed ends ex-posed at the joints. This allowed 5/8-in.-diameter × 12-in.-long (16 mm × 300 mm) weld slugs to be placed at the flange-to-flange joints between the heads of the chord bars over adjacent double-tees. A field weld between the headed bars and weld slug mimicked the intended original conditions of a dry, pretopped system for the second Seattle DBE test.
Inconsistent field welding left the critical flexural joint weaker than designed and once again vulnerable. During the second Seattle DBE test, the field weld between the weld slug and the headed-chord reinforcement fractured. As the damage was once again isolated to the center joint, an imme-diate repair was made, enlarging the fillet weld of the chord connection and allowing a third Seattle DBE test.
However, visual inspection of the failed chord connection after the second Seattle DBE did not identify an embedded-chord fracture. The reinforcing-bar fracture in the weld-
affected region was undetectable because of the surround-ing concrete. As a result of this preexisting weld fracture, a reduced capacity and asymmetric loading on the weld slug at this center joint were observed in the third Seattle DBE test. The repeated failure of the critical flexure joint and damage now accumulating in the hollow-core diaphragm one floor below prompted a third repair with a continuous pour strip on the pretopped deck.
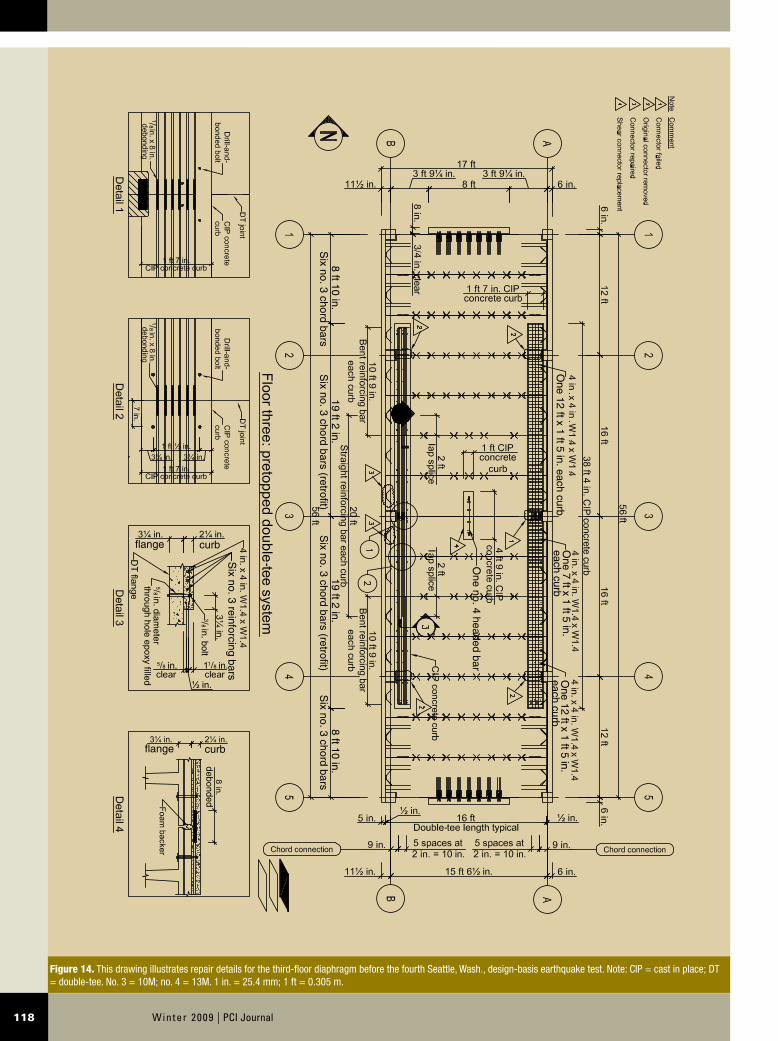
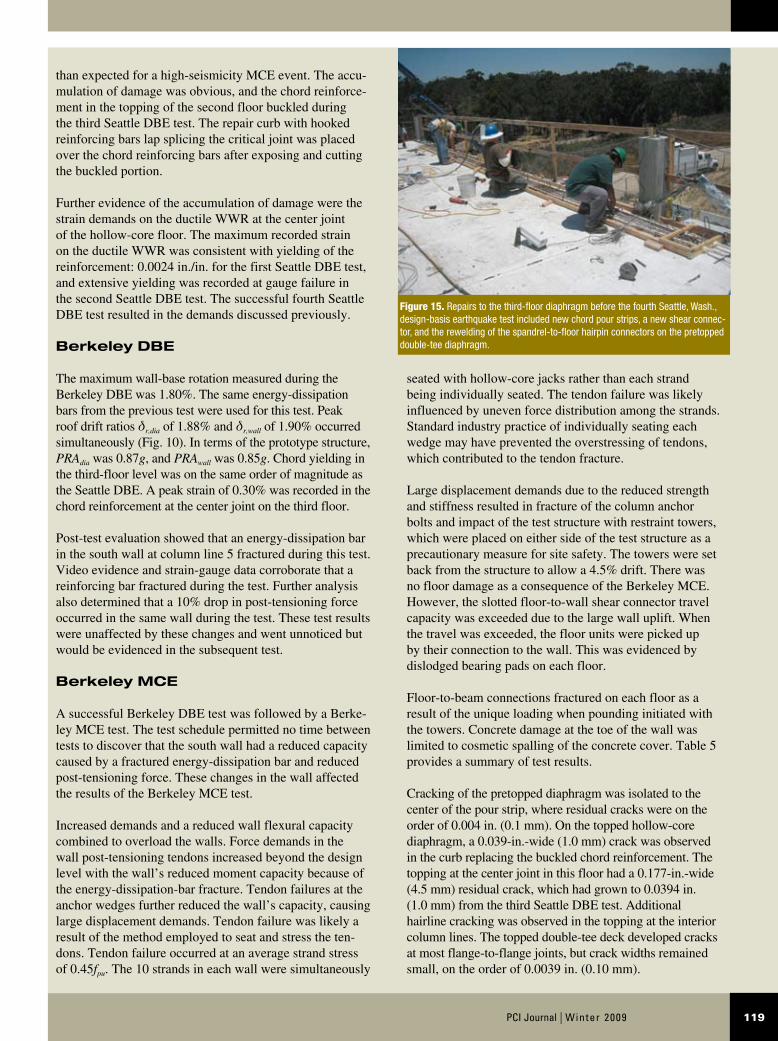
This third repair prior to the fourth Seattle DBE test included new chord pour strips, a new shear connector, and the rewelding of the spandrel-to-floor hairpin connec-tors on the pretopped double-tee diaphragm (Fig. 14 and 15). This repair involved the removal of the previous pour strip, new drill-and-bonded dowels, and six continuous no. 3 (10M) reinforcing bars that were lap spliced in two locations. The repair curb was placed at each end of the double-tees and extended over the center nine joints.
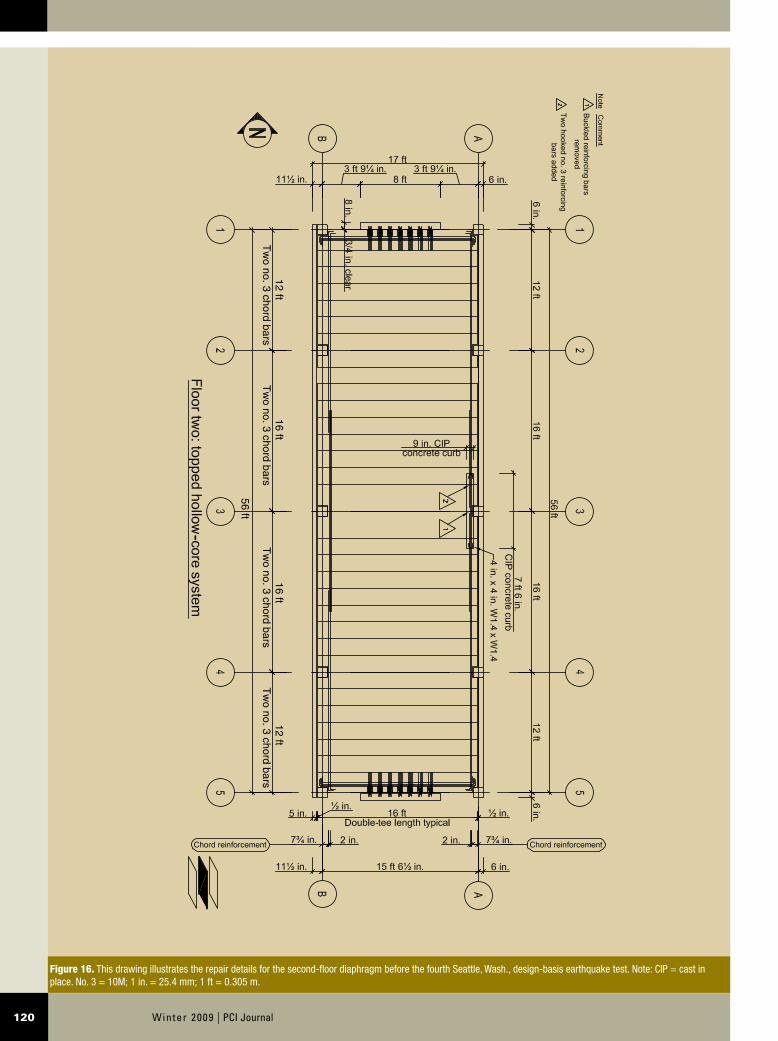
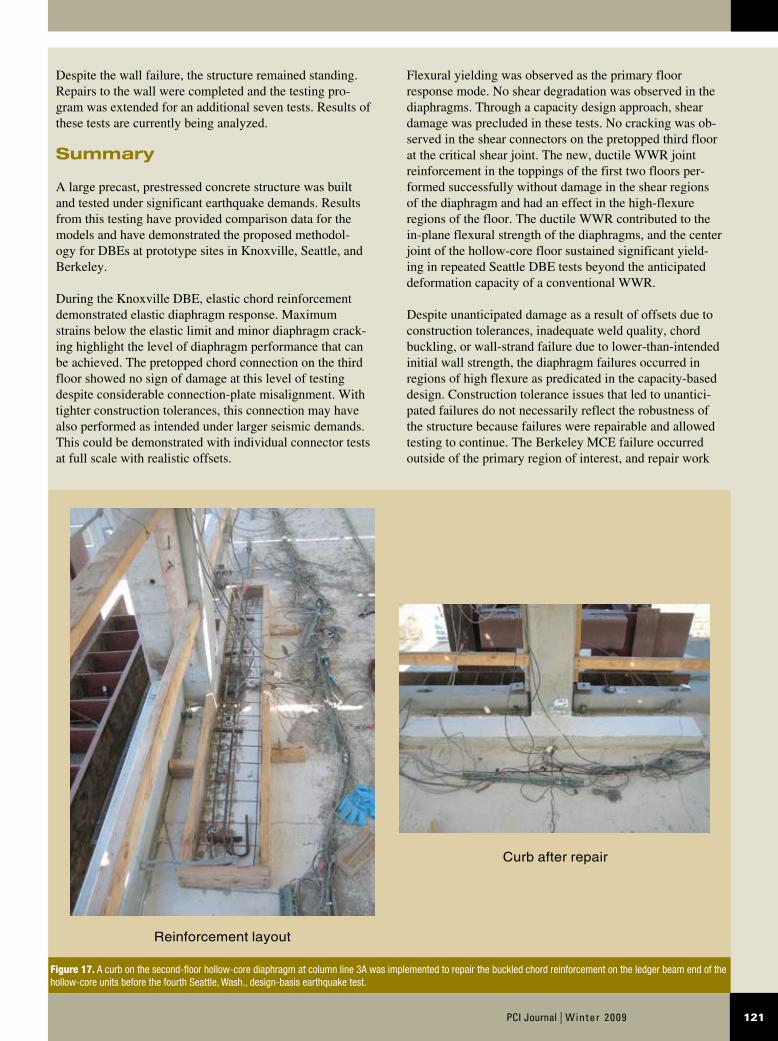
A curb on the second-floor hollow-core diaphragm at col-umn line 3A was implemented to repair the buckled chord reinforcement on the ledger beam end of the hollow-core units (Fig. 16 and 17). The topped hollow-core diaphragm had undergone larger-than-anticipated opening demands at the center joint in the three previous tests. As a result of the third-floor failures, the opening demands were larger
Figure 13. This photo shows the actual repair layout of column line B on the third-floor diaphragm before the second and third Seattle, Wash., design-basis earthquake tests that are illustrated in Fig. 12.
Winter 2009 | PCI Journal118
Figure 14. This drawing illustrates repair details for the third-floor diaphragm before the fourth Seattle, Wash., design-basis earthquake test. Note: CIP = cast in place; DT = double-tee. No. 3 = 10M; no. 4 = 13M. 1 in. = 25.4 mm; 1 ft = 0.305 m.
1/81/8
3/8
5/8
5/8 1/8
-
flange curb
flange curb
Six no. 3 reinforcing bars
Six no. 3 chord bars
8 ft 10 in.8 ft 10 in.
19 ft 2 in.
One no. 4 headed bar
One 12 ft x 1 ft 5 in. each curb
One 7 ft x 1 ft 5 in.
each curbO
ne 12 ft x 1 ft 5 in. each curb
19 ft 2 in.S
ix no. 3 chord barsS
ix no. 3 chord bars (retrofit)S
ix no. 3 chord bars (retrofit)
-
debondedin. bolt
in. diameter
through hole epoxy filled
119PCI Journal | Winter 2009
than expected for a high-seismicity MCE event. The accu-mulation of damage was obvious, and the chord reinforce-ment in the topping of the second floor buckled during the third Seattle DBE test. The repair curb with hooked reinforcing bars lap splicing the critical joint was placed over the chord reinforcing bars after exposing and cutting the buckled portion.
Further evidence of the accumulation of damage were the strain demands on the ductile WWR at the center joint of the hollow-core floor. The maximum recorded strain on the ductile WWR was consistent with yielding of the reinforcement: 0.0024 in./in. for the first Seattle DBE test, and extensive yielding was recorded at gauge failure in the second Seattle DBE test. The successful fourth Seattle DBE test resulted in the demands discussed previously.
Berkeley DBE
The maximum wall-base rotation measured during the Berkeley DBE was 1.80%. The same energy-dissipation bars from the previous test were used for this test. Peak roof drift ratios δr,dia of 1.88% and δr,wall of 1.90% occurred simultaneously (Fig. 10). In terms of the prototype structure, PRAdia was 0.87g, and PRAwall was 0.85g. Chord yielding in the third-floor level was on the same order of magnitude as the Seattle DBE. A peak strain of 0.30% was recorded in the chord reinforcement at the center joint on the third floor.
Post-test evaluation showed that an energy-dissipation bar in the south wall at column line 5 fractured during this test. Video evidence and strain-gauge data corroborate that a reinforcing bar fractured during the test. Further analysis also determined that a 10% drop in post-tensioning force occurred in the same wall during the test. These test results were unaffected by these changes and went unnoticed but would be evidenced in the subsequent test.
Berkeley MCE
A successful Berkeley DBE test was followed by a Berke-ley MCE test. The test schedule permitted no time between tests to discover that the south wall had a reduced capacity caused by a fractured energy-dissipation bar and reduced post-tensioning force. These changes in the wall affected the results of the Berkeley MCE test.
Increased demands and a reduced wall flexural capacity combined to overload the walls. Force demands in the wall post-tensioning tendons increased beyond the design level with the wall’s reduced moment capacity because of the energy-dissipation-bar fracture. Tendon failures at the anchor wedges further reduced the wall’s capacity, causing large displacement demands. Tendon failure was likely a result of the method employed to seat and stress the ten-dons. Tendon failure occurred at an average strand stress of 0.45fpu. The 10 strands in each wall were simultaneously
seated with hollow-core jacks rather than each strand being individually seated. The tendon failure was likely influenced by uneven force distribution among the strands. Standard industry practice of individually seating each wedge may have prevented the overstressing of tendons, which contributed to the tendon fracture.
Large displacement demands due to the reduced strength and stiffness resulted in fracture of the column anchor bolts and impact of the test structure with restraint towers, which were placed on either side of the test structure as a precautionary measure for site safety. The towers were set back from the structure to allow a 4.5% drift. There was no floor damage as a consequence of the Berkeley MCE. However, the slotted floor-to-wall shear connector travel capacity was exceeded due to the large wall uplift. When the travel was exceeded, the floor units were picked up by their connection to the wall. This was evidenced by dislodged bearing pads on each floor.
Floor-to-beam connections fractured on each floor as a result of the unique loading when pounding initiated with the towers. Concrete damage at the toe of the wall was limited to cosmetic spalling of the concrete cover. Table 5 provides a summary of test results.
Cracking of the pretopped diaphragm was isolated to the center of the pour strip, where residual cracks were on the order of 0.004 in. (0.1 mm). On the topped hollow-core diaphragm, a 0.039-in.-wide (1.0 mm) crack was observed in the curb replacing the buckled chord reinforcement. The topping at the center joint in this floor had a 0.177-in.-wide (4.5 mm) residual crack, which had grown to 0.0394 in. (1.0 mm) from the third Seattle DBE test. Additional hairline cracking was observed in the topping at the interior column lines. The topped double-tee deck developed cracks at most flange-to-flange joints, but crack widths remained small, on the order of 0.0039 in. (0.10 mm).
Figure 15. Repairs to the third-floor diaphragm before the fourth Seattle, Wash., design-basis earthquake test included new chord pour strips, a new shear connec-tor, and the rewelding of the spandrel-to-floor hairpin connectors on the pretopped double-tee diaphragm.
Winter 2009 | PCI Journal120
Figure 16. This drawing illustrates the repair details for the second-floor diaphragm before the fourth Seattle, Wash., design-basis earthquake test. Note: CIP = cast in place. No. 3 = 10M; 1 in. = 25.4 mm; 1 ft = 0.305 m.
-
Tw
o hooked no. 3 reinforcingbars added
Buckled reinforcing bars
removed
Tw
o no. 3 chord bars12 ft
12 ft16 ft
56 ft
16 ftT
wo no. 3 chord bars
Tw
o no. 3 chord barsT
wo no. 3 chord bars
-
121PCI Journal | Winter 2009
Flexural yielding was observed as the primary floor response mode. No shear degradation was observed in the diaphragms. Through a capacity design approach, shear damage was precluded in these tests. No cracking was ob-served in the shear connectors on the pretopped third floor at the critical shear joint. The new, ductile WWR joint reinforcement in the toppings of the first two floors per-formed successfully without damage in the shear regions of the diaphragm and had an effect in the high-flexure regions of the floor. The ductile WWR contributed to the in-plane flexural strength of the diaphragms, and the center joint of the hollow-core floor sustained significant yield-ing in repeated Seattle DBE tests beyond the anticipated deformation capacity of a conventional WWR.
Despite unanticipated damage as a result of offsets due to construction tolerances, inadequate weld quality, chord buckling, or wall-strand failure due to lower-than-intended initial wall strength, the diaphragm failures occurred in regions of high flexure as predicated in the capacity-based design. Construction tolerance issues that led to unantici-pated failures do not necessarily reflect the robustness of the structure because failures were repairable and allowed testing to continue. The Berkeley MCE failure occurred outside of the primary region of interest, and repair work
Despite the wall failure, the structure remained standing. Repairs to the wall were completed and the testing pro-gram was extended for an additional seven tests. Results of these tests are currently being analyzed.
Summary
A large precast, prestressed concrete structure was built and tested under significant earthquake demands. Results from this testing have provided comparison data for the models and have demonstrated the proposed methodol-ogy for DBEs at prototype sites in Knoxville, Seattle, and Berkeley.
During the Knoxville DBE, elastic chord reinforcement demonstrated elastic diaphragm response. Maximum strains below the elastic limit and minor diaphragm crack-ing highlight the level of diaphragm performance that can be achieved. The pretopped chord connection on the third floor showed no sign of damage at this level of testing despite considerable connection-plate misalignment. With tighter construction tolerances, this connection may have also performed as intended under larger seismic demands. This could be demonstrated with individual connector tests at full scale with realistic offsets.
Figure 17. A curb on the second-floor hollow-core diaphragm at column line 3A was implemented to repair the buckled chord reinforcement on the ledger beam end of the hollow-core units before the fourth Seattle, Wash., design-basis earthquake test.
Reinforcement layout
Curb after repair
Winter 2009 | PCI Journal122
Any opinions, findings, and conclusions expressed in this paper are those of the authors and do not necessarily reflect the views of the sponsors, including the National Science Foundation.
References
1. Fleischman, R. B., C. Naito, J. Restrepo, R. Sause, S. K. Ghosh, G. Wan, M. Schoettler, and L. Cao. 2005. Precast Diaphragm Seismic Design Methodol-ogy (DSDM) Project, Part 2: Research Program. PCI Journal, V. 50, No. 6 (November–December): pp. 14–31.
2. Naito, C., R. Ren, C. Jones, and T. Cullen. 2007. PCI/NSF Development of a Design Methodology for Pre-cast Concrete Diaphragms: Connector Performance Phase 1B. ATLSS report 07-04, Lehigh University, Bethlehem, PA.
3. ACI Committee 318. 2005. Building Code Require-ments for Structural Concrete (ACI318-05) and Commentary (ACI318R-05). Farmington Hills, MI: American Concrete Institute (ACI).
4. ASTM Subcommittee A01.02. 2008. Standard Specification for Carbon Structural Steel. ASTM A36. West Conshohocken, PA: American Society of Testing and Materials (ASTM).
5. Kurama, Y., S. Pessiki, R. Sause, and L. Lu. 1999. Seismic Behavior and Design of Unbonded Post-Tensioned Precast Concrete Walls. PCI Journal, V. 44, No. 3 (May–June): pp. 72–89.
6. Pérez, F. J., S. Pessiki, R. Sause, and L. Lu. 2003. Lateral Load Tests of Unbonded Post-Tensioned Precast Concrete Walls. In Large-Scale Structural Testing, SP-211-8, pp. 161-182. Farmington Hills, MI: ACI.
7. Restrepo, J. I., and A. Rahman. 2007. Seismic Per-formance of Self-Centering Structural Walls Incorpo-rating Energy Dissipators. Journal of Structural Engi-neering, V. 133, No. 11 (November): pp. 1560–1570.
8. ASTM Subcommittee A01.05. 2008. Standard Speci-fication for Low-Alloy Steel Deformed and Plain Bars for Concrete Reinforcement. ASTM A706. West Conshohocken, PA: ASTM.
9. Kang, S., S. Keowen, R. Nigbor, and A. Salamanca. 2008. PCI-DSDM Initial Ambient and Forced Vibra-tion Test Data. Internal report. Chicago, IL: PCI.
permitted seismic testing beyond the intended test sequence.
The jointed nature of precast concrete construction was made apparent as in-phase response between elements was not reliable throughout testing. Pounding between ele-ments resulted from out-of-phase movement. Concentrated damage was observed at the jointed connections, with little damage spreading into or occurring elsewhere in the precast concrete units.
The performance of a rocking wall and structural system were demonstrated under seismic loading. The wall’s self-centering capabilities and superior performance benefited the testing program by concentrating damage in the floors—the primary focus of the test program—rather than in the vertical components of the LFRS. Diaphragm amplification as a result of the large floor aspect ratio was captured. This feature will allow for assessment of how flexible diaphragm response differs from an assumed rigid diaphragm.
Acknowledgments
This research was primarily supported by the National Sci-ence Foundation, the Precast/Prestressed Concrete Institute, the Charles Pankow Foundation, and the George E. Brown Jr. Network for Earthquake Engineering Simulation.
Contributions by numerous industry practitioners were invaluable to the test program. The authors are grate-ful for the support from ANIPPAC-Mexico, Blakeslee Prestress Inc., Central Pre-Mix Prestress Co., Charles Pankow Builders, Concrete Technology Corp., Consult-ing Engineers Group Inc., Dywidag Systems International, Filtro Sismico-Mexico, Hanson Structural Precast, Headed Reinforcement Corp., High Concrete Group, HILTI Corp., Ivy Steel & Wire, JVI Inc., Knife River Corp., Metromont Corp., Mid-State Precast, NEES-IT, PCMAC, Shockey Precast Group, Sirko Associates Inc., Spancrete Industries Inc., and Tindall Corp.
The research was successful because of the overwhelming dedication of Dave Dieter, Carlos Blandon, and Humberto Cabrera. Their assistance was essential to the project and is greatly appreciated. The authors thank the DSDM Advisory Group for their insight and contributions related to the shake-table test program. The Research and Devel-opment Committee, chaired by C. Douglas Sutton, also deserves special appreciation for its support in approving and guiding the research program. We appreciate the close collaboration of Clay Naito and Richard Sause, who are co–principal investigators from LU. The constructive com-ments and thought-provoking insight of the PCI Journal reviewers benefited the quality of this paper.
123PCI Journal | Winter 2009
10. United States Geological Survey. Event 14366244. pasadena.wr.usgs.gov/shake/ca/STORE/X14366244/ciim_display.html.
Notation
fpu = ultimate strength of the prestressing strand
g = acceleration due to gravity
L = span length
PGA = peak ground acceleration
PGD = peak ground displacement
PRAdia = peak roof acceleration measured at the center of the diaphragm
PRAwall = peak roof acceleration measured at the end of the diaphragm near the wall
x = distance from end along span
δr,dia = roof drift ratio measured at the center of the dia-phragm
δr,wall = roof drift ratio measured at the end of the dia-phragm near the wall
θwall = wall base rotation
Winter 2009 | PCI Journal124
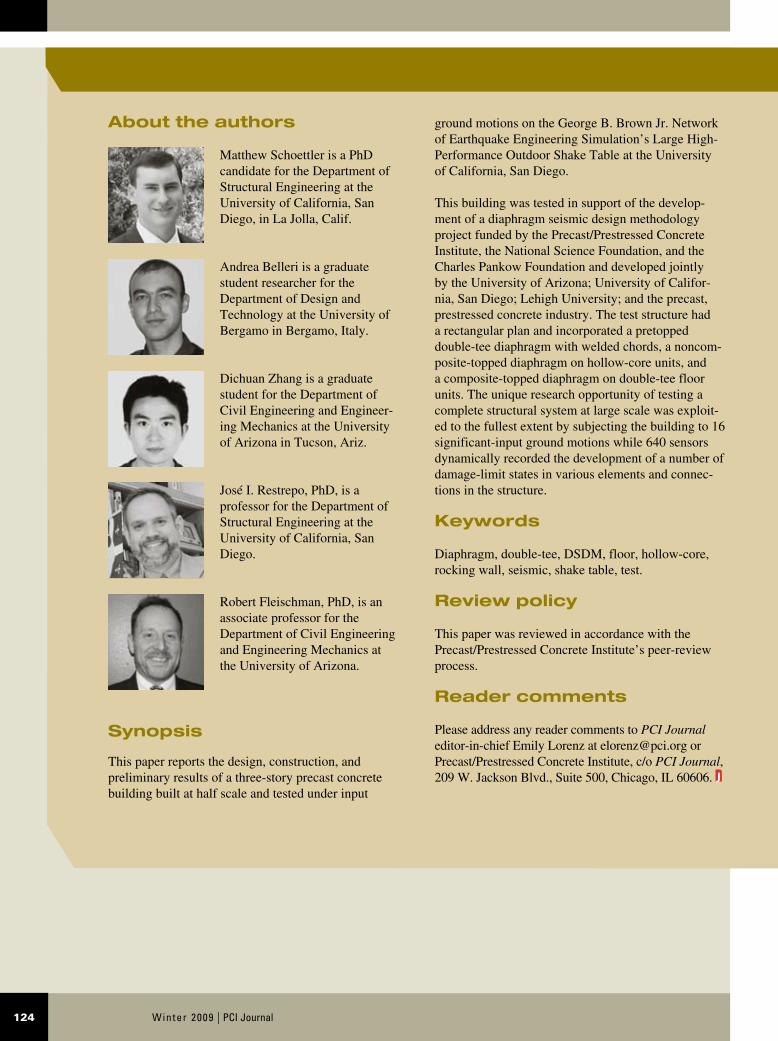
About the authors
Matthew Schoettler is a PhD candidate for the Department of Structural Engineering at the University of California, San Diego, in La Jolla, Calif.
Andrea Belleri is a graduate student researcher for the Department of Design and Technology at the University of Bergamo in Bergamo, Italy.
Dichuan Zhang is a graduate student for the Department of Civil Engineering and Engineer-ing Mechanics at the University of Arizona in Tucson, Ariz.
José I. Restrepo, PhD, is a professor for the Department of Structural Engineering at the University of California, San Diego.
Robert Fleischman, PhD, is an associate professor for the Department of Civil Engineering and Engineering Mechanics at the University of Arizona.
Synopsis
This paper reports the design, construction, and preliminary results of a three-story precast concrete building built at half scale and tested under input
ground motions on the George B. Brown Jr. Network of Earthquake Engineering Simulation’s Large High-Performance Outdoor Shake Table at the University of California, San Diego.
This building was tested in support of the develop-ment of a diaphragm seismic design methodology project funded by the Precast/Prestressed Concrete Institute, the National Science Foundation, and the Charles Pankow Foundation and developed jointly by the University of Arizona; University of Califor-nia, San Diego; Lehigh University; and the precast, prestressed concrete industry. The test structure had a rectangular plan and incorporated a pretopped double-tee diaphragm with welded chords, a noncom-posite-topped diaphragm on hollow-core units, and a composite-topped diaphragm on double-tee floor units. The unique research opportunity of testing a complete structural system at large scale was exploit-ed to the fullest extent by subjecting the building to 16 significant-input ground motions while 640 sensors dynamically recorded the development of a number of damage-limit states in various elements and connec-tions in the structure.
Keywords
Diaphragm, double-tee, DSDM, floor, hollow-core, rocking wall, seismic, shake table, test.
Review policy
This paper was reviewed in accordance with the Precast/Prestressed Concrete Institute’s peer-review process.
Reader comments
Please address any reader comments to PCI Journal editor-in-chief Emily Lorenz at [email protected] or Precast/Prestressed Concrete Institute, c/o PCI Journal, 209 W. Jackson Blvd., Suite 500, Chicago, IL 60606. J