100-ft air dives - decompression.org · eric maiken, 2003 limited distribution 2 notations and...
TRANSCRIPT

Eric Maiken, 2003 Limited Distribution
1
Ascents from 100 ft (30.5m) Dives on Air
Comparison of V-Planner VPM-B to Buhlmann Tables, and GAP RGBM + GF Tables
•This compilation demonstrates that at 100 ft, VPM-B decompressions are comparable to Bühlmann's sea level tables. RGBM and GF tables are increasingly more conservative compared to VPM-B, with increasing dive times.
Organization
•NOTES and CONCLUSIONS•pages 2 – 5
•SECTION 1 VPM-B at Nominal Conservatism•pages 6- 15
•SECTION 2 VPM-B at Level 2 Conservatism•pages 16- 25
•SECTION 3 VPM-B at Level 4 Conservatism•pages 26- 35

Eric Maiken, 2003 Limited Distribution
2
Notations and Conventions•ALL CONLUSIONS and GENERALIZATIONS PERTAIN ONLY to the SPECIFIC DEPTHS, GAS MIXTURES, and PROGRAM SETTINGS CONSIDERED in this DOCUMENT
Profiles•12 profiles of 100 ft on air back gas, with bottom time ranging from 10-120 min are modeled, with deco using air and O2.•Total of 72 VPM-B models = 12-profiles x 3-conservatisms x 2 deco gas combinations (air, air + O2).•Correlations of RGBM and GF to 72 VPM-B models = 12-profiles x 3 different conservatism settings x 2 deco gas combinations (pages ).•All ascents at 33 ft/min. No breaks included from O2 Exposure. All descents on back gas at 100 ft/min.
Plots•Gas mixtures denoted as percents in braces: {%O2, %He, %N2}
•air is then: {21,0,79}•Three types of plots are shown that correlate VPM-B to Bühlmann, RGBM and GF:
•Bühlmann, RGBM, and GF vs. VPM Total Ascent Times (pages: 7, 12, 13, 17, 22, 23, 27, 32, 33)•Overlaid stair-step profiles (pages: 8, 10, 18, 20, 28, 30)•RGBM, and GF Stop-times vs. VPM-B stop-times (pages: 9, 11, 19, 21, 29, 31)
•Diagonal lines in plots are NOT fitted correlations –they are just indications of 1:1 correlation to guide your eyes.
•Points that lie above the lines denote longer GF and RGBM times, while points below the lines indicate longer VPM-B times.
•I use Imperial American units and conventions. cf == cubic feet (volume).1 cf = 28.23 liters. In the USA, tank capacities are discussed in terms of the volume of gas that is contained at the maximum rated pressure. psi == pounds per square inch (pressure).
V-Planner and GAP Software Settings•Ascents calculated by GAP RGBM v2.1.3 (Aug, 2003 Edition) and V-Planner (VPM-B) v3.22.•VPM conservatisms are denoted: Nominal as VPM-B (N), Level 2 as VPM-B (2), and Level 4 as VPM-B (4).•RGBM and GF run at nominal GAP conservatisms. VPM-B run at nominal (N), (2), and (4) conservatisms.

Eric Maiken, 2003 Limited Distribution
3
Discussion of Correlation Plots for VPM-B to Buhlmann, RGBM and GF
Total Ascent Times (TATs)VPM-B TATs Correlate Linearly to Bühlmann and RGBM –though Not to GF
General Notes•All data include time to 1st stop at ascent rate of 33 ft/min.
•TATs are closely related to comparative surfacing gradients for Bühlmann, VPM-B, RGBM, and GF because all three ascent methods employ similar stage depths. Therefore, roughly speaking, a longer TAT implies a more conservative schedule.
Bühlmann vs. VPM-B (pages 7, 17, and 27)•Each of the 3 sections (with increasing VPM conservatism levels) begins with comparison of TATs for VPM-B and Bühlmann 100ft air decompression tables. These comparisonsbenchmark VPM-B as more conservative than Buhlmann sea level tables.
RGBM vs. VPM-B (pages 12, 22, and 32)•VPM-B(2) is nearly 1:1 correlated with RGBM. Considering that VPM-B(2) is even more conservative than Bühlmann's 108 ft tables (page 17), RGBM is clearly very conservative at 100 ft.
GF vs. VPM-B (pages 13, 23, and 33)•VPM-B is not linearly correlated to GF. With increasing conservatism levels, VPM-B tables can be generated that have longer TATs than GF.
•THIS PROPOSITION IS BEING IMPLICITLY TESTED BY V-PLANNER: Bühlmann doesn’t credit for deep stops –so inclusion of deep stops in GF-modifications of algorithms based on Bühlmann a/b s may lead to too much conservatism. VPM-B credits deep stops. Therefore, VPM-B TATs are shorter than GF TATs.

Eric Maiken, 2003 Limited Distribution
4
Discussion of Correlation Plots of VPM-B to RGBM and GF Stop Times
General Notes•The plots on pages 9, 11, 19, 21, 29, and 31 directly compare stop time vs. stop time for two different deco methods.They avoid the offsets that occur on the conventional stair-step depth vs. run-time plots of the same data, which are shown on pages 8, 10, 18, 20, 28, and 30.•Data points are plots of the (x,y) pair: (VPM-B stop time, RGBM/GF stop time) for each decompression stop. Individual stop depths are not indicated, but generally, the longest stops correspond to the shallowest stops for each gas mixture. For O2 deco, the 20 and 10 ft stops are shown as green-colored points. Stops on back gas are shown as black-colored points. For the deepest stops, more than one point will often plot on top of another point.
RGBM vs. VPM-B (pages 9, 19, 29)•VPM-B(N) stops on air are shallower and much shorter than RGBM. Stops on O2 are comparable to RGBM. VPM-B(N) is more aggressive than RGBM (page 9). •VPM-B(2) initial (deepest) stops on air are shallower and shorter than RGBM. Stops on O2are the similar to RGBM (page 19).•VPM-B(4) air stops are very similar to RGBM, but VPM-B stops on O2 are longer than RGBM (page 29). VPM-B(4) is increasingly more conservative than RGBM with increasingbottom times (page 29).
GF vs. VPM-B (pages 11, 21, 31)•VPM-B(N) and (2) are increasingly more aggressive than GF for increasing bottom times (pages 11, and 21).•VPM-B(4) is 1:1 correlated to GF for dives longer than 70 min. For 20-60 min VPM is more conservative than GF(page 31).

Eric Maiken, 2003 Limited Distribution
5
Discussion of Plots of VPM-B Stop Times vs. Bottom Times
See pages 14-15, 24-25, 34-35•TATs and groups of stop times (e.g. times at 10+20 ft) are linearly correlated to dive times. This translates to simple rules that relate stop times to bottom times. We can use these relationships to specify analytically-based procedures for VPM-B deco-on-the-fly.
•CAUTION: remember that the rules derived from these slides are special cases that only relate to 100 ft dives on air.

Eric Maiken, 2003 Limited Distribution
6
SECTION 1
Ascents from Dives at 100 ft for 10 -120 min12 on Air with Air Deco
12 on Air with Air+O2 Deco
VPM-B Conservatism Setting (N)
10 VPM-B air deco TATs are compared to Bühlmann page 724 VPM-B profiles compared to RGBM and GF (pps. 8-13)
24 VPM-B ascents with Air and Air+O2 deco are summarized (pps. 14-15)

Eric Maiken, 2003 Limited Distribution
7
Benchmark:Correlation of TATs for Air Decompression Dives
Bühlmann at 98 ft (30 m) and 108 ft (33m) vs. VPM-B(N) 100 ft
Conclusions:1) 100 ft VPM-B(N) correlates linearly to Bühlmann's 1984 Sea-level Tables.2) 100 ft VPM-B(N) tables have longer TATs than 98 ft Bühlmann.3) 100 ft VPM-B(N) tables are comparable to 108 ft Bühlmann for dives
60 min or less.
0 25 50 75 100 125 150 175VPM TAT min
25
50
75
100
125
150
175
nnamlhuB
TATHnim L
TATs for Buhlmann vs VPM-B HNLfor Dives to 100 ft Ranging from 30 to 120 mins
B’mann 98 ftB’mann 108 ft
Legend
30 min
Extra conservatism is typical of last schedules in Buhlmann tables, which often show large increase in TAT for incremental increase in bottom time. I exclude these data in discussing correlations
H L

Eric Maiken, 2003 Limited Distribution
8
Comparison of RGBM and VPM-B HNL Ascents for Array of100 ft Dives on Back Gas 8O2, He, N2< = 821, 0, 79<
Deco on 821, 0, 79<, and 8100, 0, 0<
100110120130140150160170RunTime HminL
-80
-60
-40
-20
0
potShtpe
DHtf L
100 min Bottom TimeVPM TAT = 60 minRGBM TAT = 76 min
120 140 160 180RunTime HminL
-80
-60
-40
-20
0
potShtpe
DHtf L
110 min Bottom TimeVPM TAT = 66 minRGBM TAT = 84 min
120 140 160 180 200RunTime HminL
-80
-60
-40
-20
0
potShtpe
DHtf L
120 min Bottom TimeVPM TAT = 72 minRGBM TAT = 92 min
70 80 90 100 110RunTime HminL
-80
-60
-40
-20
0
potShtpe
DHtf L
70 min Bottom TimeVPM TAT = 37 minRGBM TAT = 47 min
80 90 100110120130140RunTime HminL
-80
-60
-40
-20
0
potShtpe
DH tfL
80 min Bottom TimeVPM TAT = 46 minRGBM TAT = 60 min
90 100110120130140150160Run Time HminL
-80
-60
-40
-20
0
potShtpe
DHtf L
90 min Bottom TimeVPM TAT = 53 minRGBM TAT = 69 min
40 45 50 55 60 65Run Time HminL
-80
-60
-40
-20
0
potShtpe
DHtf L
40 min Bottom TimeVPM TAT = 18 minRGBM TAT = 26 min
50 55 60 65 70 75 80 85Run Time HminL
-80
-60
-40
-20
0
potShtpe
DHtf L
50 min Bottom TimeVPM TAT = 24 minRGBM TAT = 35 min
60 70 80 90 100Run Time HminL
-80
-60
-40
-20
0
potShtpe
DHtf L
60 min Bottom TimeVPM TAT = 30 minRGBM TAT = 41 min
10 10.511 11.5 12 12.513RunTime HminL
-80
-60
-40
-20
0
potShtpe
DHtf L
10 min Bottom TimeVPM TAT = 3.0303 minRGBM TAT = 3.0303 min
20 22 24 26 28RunTime HminL
-80
-60
-40
-20
0
potShtpe
DHtf L
20 min Bottom TimeVPM TAT = 5 minRGBM TAT = 9 min
3032.53537.54042.54547.5RunTime HminL
-80
-60
-40
-20
0
potShtpe
DHtf L
30 min Bottom TimeVPM TAT = 11 minRGBM TAT = 18 min
VPM-BRGBM
LEGENDDive Profiles

Eric Maiken, 2003 Limited Distribution
9
Correlation of RGBM to VPM-B HNL Stop Times for Array of100 ft Dives on Back Gas 8O2, He, N2< = 821, 0, 79<
Deco on 821, 0, 79<, and 8100, 0, 0<
5 10 15 20Stop Time VPM HminL
5
10
15
20
potSe
miTMB
GR
H nimL
100 min Bottom TimeVPM TAT = 60 minRGBM TAT = 76 min
5 10 15 20StopTime VPM HminL
5
10
15
20
potSe
miTMB
GR
HnimL
110 min Bottom TimeVPM TAT = 66 minRGBM TAT = 84 min
5 10 15 20Stop Time VPM HminL
5
101520
potSe
miTMB
GR
H nimL
120 min Bottom TimeVPM TAT = 72 minRGBM TAT = 92 min
2 4 6 8 10 12StopTime VPM HminL
2468
1012
potSe
miTMB
GR
H nimL
70 min Bottom TimeVPM TAT = 37 minRGBM TAT = 47 min
2 4 6 8 10121416StopTime VPM HminL
2468
10121416
potSe
miTMB
GR
HnimL
80 min Bottom TimeVPM TAT = 46 minRGBM TAT = 60 min
2.557.51012.51517.520StopTime VPM HminL
2.55
7.510
12.515
17.520
potSe
miTMB
GR
H nimL90 min Bottom TimeVPM TAT = 53 minRGBM TAT = 69 min
1 2 3 4 5 6 7StopTime VPM HminL
1234567
potSe
miTMB
GR
H nimL
40 min Bottom TimeVPM TAT = 18 minRGBM TAT = 26 min
2 4 6 8 10StopTime VPM HminL
2468
10
potSe
miTMB
GR
H nimL50 min Bottom TimeVPM TAT = 24 minRGBM TAT = 35 min
2 4 6 8 10StopTime VPM HminL
2468
10
potSe
miTMB
GR
HnimL
60 min Bottom TimeVPM TAT = 30 minRGBM TAT = 41 min
-0.75-0.5-0.2500.250.50.751StopTime VPM HminL
-0.75-0.5-0.25
00.250.5
0.751
potSe
miTMB
GR
H nimL10 min Bottom TimeVPM TAT = 3.0303 minRGBM TAT = 3.0303 min
0.5 1 1.5 2 2.5 3Stop Time VPM HminL
0.51
1.52
2.53
potSe
miTMB
GR
HnimL
20 min Bottom TimeVPM TAT = 5 minRGBM TAT = 9 min
1 2 3 4 5StopTime VPM HminL
12345
potSe
miTMB
GR
HnimL
30 min Bottom TimeVPM TAT = 11 minRGBM TAT = 18 min
100, 0, 0
21, 0, 79
LEGENDDeco GasesO2, He, N2

Eric Maiken, 2003 Limited Distribution
10
Comparison of GF and VPM-B HNL Ascents for Array of100 ft Dives on Back Gas 8O2, He, N2< = 821, 0, 79<
Deco on 821, 0, 79<, and 8100, 0, 0<
100 120 140 160 180RunTime HminL
-80
-60
-40
-20
0
potShtpe
DHtf L
100 min Bottom TimeVPM TAT = 60 minGF TAT = 92 min
120 140 160 180 200RunTime HminL
-80
-60
-40
-20
0
potShtpe
DHtf L
110 min Bottom TimeVPM TAT = 66 minGF TAT = 104 min
120140160180200220240RunTime HminL
-80
-60
-40
-20
0
potShtpe
DHtf L
120 min Bottom TimeVPM TAT = 72 minGF TAT = 120 min
70 80 90 100 110 120RunTime HminL
-80
-60
-40
-20
0
potShtpe
DHtf L
70 min Bottom TimeVPM TAT = 37 minGF TAT = 53 min
80 90 100110120130140Run Time HminL
-80
-60
-40
-20
0
potShtpe
DHtf L
80 min Bottom TimeVPM TAT = 46 minGF TAT = 64 min
100 120 140 160RunTime HminL
-80
-60
-40
-20
0
potShtpe
DHtf L
90 min Bottom TimeVPM TAT = 53 minGF TAT = 78 min
40 45 50 55 60RunTime HminL
-80
-60
-40
-20
0
potShtpe
DHtf L
40 min Bottom TimeVPM TAT = 18 minGF TAT = 21 min
50 55 60 65 70 75 80RunTime HminL
-80
-60
-40
-20
0
potShtpe
DHtf L
50 min Bottom TimeVPM TAT = 24 minGF TAT = 31 min
60 70 80 90 100Run Time HminL
-80
-60
-40
-20
0
potShtpe
DHtf L
60 min Bottom TimeVPM TAT = 30 minGF TAT = 41 min
10 11 12 13 14 15 16Run Time HminL
-80
-60
-40
-20
0
potShtpe
DH tfL
10 min Bottom TimeVPM TAT = 3.0303 minGF TAT = 6 min
20 21 22 23 24 25 26 27Run Time HminL
-80
-60
-40
-20
0
potShtpe
DH tfL
20 min Bottom TimeVPM TAT = 5 minGF TAT = 7 min
30 32 34 36 38 40 42Run Time HminL
-80
-60
-40
-20
0
potShtpe
DHtf L
30 min Bottom TimeVPM TAT = 11 minGF TAT = 12 min
VPM-BGF
LEGENDDive Profiles

Eric Maiken, 2003 Limited Distribution
11
Correlation of GF to VPM-B HNL Stop Times for Array of100 ft Dives on Back Gas 8O2, He, N2< = 821, 0, 79<
Deco on 821, 0, 79<, and 8100, 0, 0<
5 10 15 20 25Stop Time VPM HminL
510152025
potSe
miTF
GHnim L
100 min Bottom TimeVPM TAT = 60 minGF TAT = 92 min
5 10 15 20 25 30StopTime VPM HminL
51015202530
potSe
miTF
GH nimL
110 min Bottom TimeVPM TAT = 66 minGF TAT = 104 min
5 10 15 2025 30Stop Time VPM HminL
51015202530
potSe
miTF
GHnim L
120 min Bottom TimeVPM TAT = 72 minGF TAT = 120 min
2 4 6 8 10121416Stop Time VPM HminL
2468
10121416
potSe
miTF
GHnim L
70 min Bottom TimeVPM TAT = 37 minGF TAT = 53 min
2.5 57.51012.51517.5StopTime VPM HminL
2.55
7.510
12.515
17.5
potSe
miTF
GHnim L
80 min Bottom TimeVPM TAT = 46 minGF TAT = 64 min
5 10 15 20Stop Time VPM HminL
5
10
15
20
potSe
miTF
GH nimL
90 min Bottom TimeVPM TAT = 53 minGF TAT = 78 min
1 2 3 4 5 6 7StopTime VPM HminL
1234567
potSe
miTF
GH nimL
40 min Bottom TimeVPM TAT = 18 minGF TAT = 21 min
2 4 6 8 10StopTime VPM HminL
2468
10
potSe
miTF
GH nimL
50 min Bottom TimeVPM TAT = 24 minGF TAT = 31 min
2 4 6 8 10 12StopTime VPM HminL
2468
1012
potSe
miTF
GHnim L
60 min Bottom TimeVPM TAT = 30 minGF TAT = 41 min
0.2 0.4 0.6 0.8 1Stop Time VPM HminL
0.20.40.60.8
1
potSe
miTF
GHnim L
10 min Bottom TimeVPM TAT = 3.0303 minGF TAT = 6 min
0.250.50.7511.251.51.752StopTime VPM HminL
0.250.5
0.751
1.251.5
1.752
potSe
miTF
GHnim L
20 min Bottom TimeVPM TAT = 5 minGF TAT = 7 min
0.511.522.533.54StopTime VPM HminL
0.51
1.52
2.53
3.54
potSe
miTF
GHnim L
30 min Bottom TimeVPM TAT = 11 minGF TAT = 12 min
100, 0, 0
21, 0, 79
LEGENDDeco GasesO2, He, N2

Eric Maiken, 2003 Limited Distribution
12
Correlation of RGBM and VPM-B(N) TATs for 100 ft Dives
0 20 40 60 80 100VPM TAT min
20
40
60
80
100
MBG
RTATHnim L
TATs for RGBM vs VPM-B HNL for 12 Divesto 100 ft Ranging from 10 to 120 mins
Air+O2 Deco
0 25 50 75 100 125 150 175VPM TAT min
25
50
75
100
125
150
175
MBG
RTATH nimL
TATs for RGBM vs VPM-B HNL for 12 Divesto 100 ft Ranging from 10 to 120 mins
H LAir Deco
Legend
H L

Eric Maiken, 2003 Limited Distribution
13
Correlation of GF and VPM-B(N) TATs for 100ft Dives
0 20 40 60 80 100 120VPM TAT min
20
40
60
80
100
120
FG
TATHnim L
TATs for GF vs VPM-B HNL for 12 Divesto 100 ft Ranging from 10 to 120 mins
Air+O2 Deco
0 50 100 150 200 250VPM TAT min
50
100
150
200
250
FG
TATHnim L
TATs for GF vs VPM-B HNL for 12 Divesto 100 ft Ranging from 10 to 120 mins
H LAir Deco
Legend
H L

Eric Maiken, 2003 Limited Distribution
14
Stop Times vs. Bottom Times VPM-B Conservatism (N)
Air+O2 Deco
0 20 40 60 80 100 120Dive Time HminL0
10
203040
506070
TAT
H nimL
TAT vs. Bottom Time for12 VPM-B HNL Dives to 100 ft
Ranging from 10 to 120 mins
0 20 40 60 80 100 120Dive Time HminL0
5
10
15
20
potS
Hnim L
Time at 10 ft Stop vs. Bottom Time for12 VPM-B HNL Dives to 100 ft
Ranging from 10 to 120 mins
0 20 40 60 80 100 120Dive Time HminL0
10
20
30
40
50
potS
Hnim L
Total Time at 30-10 ft Stops vs. Bottom Time for12 VPM-B HNL Dives to 100 ft
Ranging from 10 to 120 mins
0 20 40 60 80 100 120Dive Time min
0
5
10
15
20
25
30
potS
H nimL
Total Time at 30-20 ft Stops vs. Bottom Time for12 VPM-B HNL Dives to 100 ft
Ranging from 10 to 120 mins
0 20 40 60 80 100 120Dive Time min
05
101520
253035
potS
H nimL
Total Time at 20-10 ft Stops vs. Bottom Time for12 VPM-B HNL Dives to 100 ft
Ranging from 10 to 120 mins
H L H L

Eric Maiken, 2003 Limited Distribution
15
Stop Times vs. Bottom Times VPM-B Conservatism (N)
Air Deco
0 20 40 60 80 100 120Dive Time min
0
20
40
60
80
100
120
TAT
Hnim L
TAT vs. Bottom Time for12 VPM-B HNL Dives to 100 ft
Ranging from 10 to 120 mins
0 20 40 60 80 100 120Dive Time min
0
20
40
60
80
100
potS
Hnim L
Total Time at 30-10 ft Stops vs. Bottom Time for12 VPM-B HNL Dives to 100 ft
Ranging from 10 to 120 mins
H L
0 20 40 60 80 100 120Dive Time HminL0
10
20
30
40
50
60
potS
Hnim L
Time at 10 ft Stop vs. Bottom Time for12 VPM-B HNL Dives to 100 ft
Ranging from 10 to 120 mins
H L
0 20 40 60 80 100 120Dive Time HminL0
20
40
60
80
potS
Hnim L
Total Time at 20-10 ft Stops vs. Bottom Time for12 VPM-B HNL Dives to 100 ft
Ranging from 10 to 120 mins
0 20 40 60 80 100 120Dive Time min
0
10
20
30
40
50
potS
Hnim L
Total Time at 30-20 ft Stops vs. Bottom Time for12 VPM-B HNL Dives to 100 ft
Ranging from 10 to 120 mins
H L

Eric Maiken, 2003 Limited Distribution
16
SECTION 2
Ascents from Dives at 100 ft for 10 -120 min12 on Air with Air Deco
12 on Air with Air+O2 Deco
VPM-B Conservatism Setting (2)
10 VPM-B air deco TATs are compared to Bühlmann page 1724 VPM-B profiles compared to RGBM and GF (pps. 18-23)
24 VPM-B ascents with Air and Air+O2 deco are summarized (pps. 24-25)

Eric Maiken, 2003 Limited Distribution
17
Benchmark:Correlation of TATs for Air Decompression Dives
Bühlmann at 98 ft (30 m) and 108 ft (33m) vs. VPM-B(2) 100 ft
Conclusions:1) 100 ft VPM-B(2) correlates linearly to Bühlmann's 1984 Sea-level Tables.2) 100 ft VPM-B(2) tables have longer TATs than both 108 and 98 ft Bühlmann.
0 25 50 75 100 125 150 175VPM TAT min
25
50
75
100
125
150
175
nnamlhuB
TATHnim L
TATs for Buhlmann vs VPM-B H2Lfor Dives to 100 ft Ranging from 30 to 120 mins
B’mann 98 ftB’mann 108 ft
Legend
30 min
Extra conservatism is typical of last schedules in Buhlmann tables, which often show large increase in TAT for incremental increase in bottom time. I exclude these data in discussing correlations
H L

Eric Maiken, 2003 Limited Distribution
18
Comparison of RGBM and VPM-B H2L Ascents for Array of100 ft Dives on Back Gas 8O2, He, N2< = 821, 0, 79<
Deco on 821, 0, 79<, and 8100, 0, 0<
100110120130140150160170RunTime HminL
-80
-60
-40
-20
0
potShtpe
DH tfL
100 min Bottom TimeVPM TAT = 69 minRGBM TAT = 76 min
120 140 160 180RunTime HminL
-80
-60
-40
-20
0
potShtpe
DH tfL
110 min Bottom TimeVPM TAT = 76 minRGBM TAT = 84 min
120 140 160 180 200RunTime HminL
-80
-60
-40
-20
0
potShtpe
DH tfL
120 min Bottom TimeVPM TAT = 85 minRGBM TAT = 92 min
70 80 90 100 110RunTime HminL
-80
-60
-40
-20
0
potShtpe
DH tfL
70 min Bottom TimeVPM TAT = 46 minRGBM TAT = 47 min
80 90 100110120130140RunTime HminL
-80
-60
-40
-20
0
potShtpe
DH tfL
80 min Bottom TimeVPM TAT = 54 minRGBM TAT = 60 min
90 100110120130140150160Run Time HminL
-80
-60
-40
-20
0
potShtpe
DH tfL
90 min Bottom TimeVPM TAT = 62 minRGBM TAT = 69 min
40 45 50 55 60 65Run Time HminL
-80
-60
-40
-20
0
potShtpe
DH tfL
40 min Bottom TimeVPM TAT = 24 minRGBM TAT = 26 min
50 55 60 65 70 75 80 85Run Time HminL
-80
-60
-40
-20
0
potShtpe
DH tfL
50 min Bottom TimeVPM TAT = 28 minRGBM TAT = 35 min
60 70 80 90 100Run Time HminL
-80
-60
-40
-20
0
potShtpe
DH tfL
60 min Bottom TimeVPM TAT = 38 minRGBM TAT = 41 min
10 10.511 11.5 12 12.513RunTime HminL
-80
-60
-40
-20
0
potShtpe
DH tfL
10 min Bottom TimeVPM TAT = 3.0303 minRGBM TAT = 3.0303 min
20 22 24 26 28RunTime HminL
-80
-60
-40
-20
0
potShtpe
DH tfL
20 min Bottom TimeVPM TAT = 6 minRGBM TAT = 9 min
3032.53537.54042.54547.5RunTime HminL
-80
-60
-40
-20
0
potShtpe
DH tfL
30 min Bottom TimeVPM TAT = 14 minRGBM TAT = 18 min
VPM-BRGBM
LEGENDDive Profiles

Eric Maiken, 2003 Limited Distribution
19
Correlation of RGBM to VPM-B H2L Stop Times for Array of100 ft Dives on Back Gas 8O2, He, N2< = 821, 0, 79<
Deco on 821, 0, 79<, and 8100, 0, 0<
5 10 15 20Stop Time VPM HminL
5
10
15
20
potSe
miTMB
GR
H nimL
100 min Bottom TimeVPM TAT = 69 minRGBM TAT = 76 min
5 10 15 20StopTime VPM HminL
5
10
15
20
potSe
miTMB
GR
H nimL
110 min Bottom TimeVPM TAT = 76 minRGBM TAT = 84 min
5 10 15 20 25Stop Time VPM HminL
510152025
potSe
miTMB
GR
H nimL
120 min Bottom TimeVPM TAT = 85 minRGBM TAT = 92 min
2 4 6 8 101214Stop Time VPM HminL
2468
101214
potSe
miTMB
GR
H nimL
70 min Bottom TimeVPM TAT = 46 minRGBM TAT = 47 min
2.5 5 7.51012.515StopTime VPM HminL
2.55
7.510
12.515
potSe
miTMB
GR
H nimL
80 min Bottom TimeVPM TAT = 54 minRGBM TAT = 60 min
2.557.51012.51517.520StopTime VPM HminL
2.55
7.510
12.515
17.520
potSe
miTMB
GR
H nimL90 min Bottom TimeVPM TAT = 62 minRGBM TAT = 69 min
1 2 3 4 5 6 7StopTime VPM HminL
1234567
potSe
miTMB
GR
H nimL
40 min Bottom TimeVPM TAT = 24 minRGBM TAT = 26 min
2 4 6 8 10StopTime VPM HminL
2468
10
potSe
miTMB
GR
H nimL50 min Bottom TimeVPM TAT = 28 minRGBM TAT = 35 min
2 4 6 8 10 12Stop Time VPM HminL
2468
1012
potSe
miTMB
GR
H nimL
60 min Bottom TimeVPM TAT = 38 minRGBMTAT = 41 min
-0.75-0.5-0.2500.250.50.751StopTime VPM HminL
-0.75-0.5-0.25
00.250.5
0.751
potSe
miTMB
GR
H nimL10 min Bottom TimeVPM TAT = 3.0303 minRGBM TAT = 3.0303 min
0.5 1 1.5 2 2.5 3Stop Time VPM HminL
0.51
1.52
2.53
potSe
miTMB
GR
H nimL
20 min Bottom TimeVPM TAT = 6 minRGBM TAT = 9 min
1 2 3 4 5StopTime VPM HminL
12345
potSe
miTMB
GR
H nimL
30 min Bottom TimeVPM TAT = 14 minRGBM TAT = 18 min
100, 0, 0
21, 0, 79
LEGENDDeco GasesO2, He, N2

Eric Maiken, 2003 Limited Distribution
20
Comparison of GF and VPM-B H2L Ascents for Array of100 ft Dives on Back Gas 8O2, He, N2< = 821, 0, 79<
Deco on 821, 0, 79<, and 8100, 0, 0<
100 120 140 160 180RunTime HminL
-80
-60
-40
-20
0
potShtpe
DH tfL
100 min Bottom TimeVPM TAT = 69 minGF TAT = 92 min
120 140 160 180 200RunTime HminL
-80
-60
-40
-20
0
potShtpe
DH tfL
110 min Bottom TimeVPM TAT = 76 minGF TAT = 104 min
120140160180200220240RunTime HminL
-80
-60
-40
-20
0
potShtpe
DH tfL
120 min Bottom TimeVPM TAT = 85 minGF TAT = 120 min
70 80 90 100 110 120RunTime HminL
-80
-60
-40
-20
0
potShtpe
DH tfL
70 min Bottom TimeVPM TAT = 46 minGF TAT = 53 min
80 90 100110120130140Run Time HminL
-80
-60
-40
-20
0
potShtpe
DH tfL
80 min Bottom TimeVPM TAT = 54 minGF TAT = 64 min
100 120 140 160RunTime HminL
-80
-60
-40
-20
0
potShtpe
DH tfL
90 min Bottom TimeVPM TAT = 62 minGF TAT = 78 min
40 45 50 55 60RunTime HminL
-80
-60
-40
-20
0
potShtpe
DH tfL
40 min Bottom TimeVPM TAT = 24 minGF TAT = 21 min
50 55 60 65 70 75 80RunTime HminL
-80
-60
-40
-20
0
potShtpe
DH tfL
50 min Bottom TimeVPM TAT = 28 minGF TAT = 31 min
60 70 80 90 100Run Time HminL
-80
-60
-40
-20
0
potShtpe
DH tfL
60 min Bottom TimeVPM TAT = 38 minGF TAT = 41 min
10 11 12 13 14 15 16Run Time HminL
-80
-60
-40
-20
0
potShtpe
DH tfL
10 min Bottom TimeVPM TAT = 3.0303 minGF TAT = 6 min
20 21 22 23 24 25 26 27Run Time HminL
-80
-60
-40
-20
0
potShtpe
DH tfL
20 min Bottom TimeVPM TAT = 6 minGF TAT = 7 min
30 32 34 36 38 40 42 44Run Time HminL
-80
-60
-40
-20
0
potShtpe
DH tfL
30 min Bottom TimeVPM TAT = 14 minGF TAT = 12 min
VPM-BGF
LEGENDDive Profiles

Eric Maiken, 2003 Limited Distribution
21
Correlation of GF to VPM-B H2L Stop Times for Array of100 ft Dives on Back Gas 8O2, He, N2< = 821, 0, 79<
Deco on 821, 0, 79<, and 8100, 0, 0<
5 10 15 20 25Stop Time VPM HminL
510152025
potSe
miTF
GH nimL
100 min Bottom TimeVPM TAT = 69 minGF TAT = 92 min
5 10 15 20 25 30StopTime VPM HminL
51015202530
potSe
miTF
GH nimL
110 min Bottom TimeVPM TAT = 76 minGF TAT = 104 min
5 10 15 2025 30Stop Time VPM HminL
51015202530
potSe
miTF
GH nimL
120 min Bottom TimeVPM TAT = 85 minGF TAT = 120 min
2 4 6 8 10121416Stop Time VPM HminL
2468
10121416
potSe
miTF
GH nimL
70 min Bottom TimeVPM TAT = 46 minGF TAT = 53 min
2.5 57.51012.51517.5StopTime VPM HminL
2.55
7.510
12.515
17.5
potSe
miTF
GH nimL
80 min Bottom TimeVPM TAT = 54 minGF TAT = 64 min
5 10 15 20Stop Time VPM HminL
5
10
15
20
potSe
miTF
GH nimL
90 min Bottom TimeVPM TAT = 62 minGF TAT = 78 min
1 2 3 4 5 6 7StopTime VPM HminL
1234567
potSe
miTF
GH nimL
40 min Bottom TimeVPM TAT = 24 minGF TAT = 21 min
2 4 6 8 10StopTime VPM HminL
2468
10
potSe
miTF
GH nimL
50 min Bottom TimeVPM TAT = 28 minGF TAT = 31 min
2 4 6 8 10 12Stop Time VPM HminL
2468
1012
potSe
miTF
GH nimL
60 min Bottom TimeVPM TAT = 38 minGF TAT = 41 min
0.2 0.4 0.6 0.8 1Stop Time VPM HminL
0.20.40.60.8
1
potSe
miTF
GH nimL
10 min Bottom TimeVPM TAT = 3.0303 minGF TAT = 6 min
0.5 1 1.5 2 2.5 3Stop Time VPM HminL
0.51
1.52
2.53
potSe
miTF
GH nimL
20 min Bottom TimeVPM TAT = 6 minGF TAT = 7 min
1 2 3 4 5StopTime VPM HminL
12345
potSe
miTF
GH nimL
30 min Bottom TimeVPM TAT = 14 minGF TAT = 12 min
100, 0, 0
21, 0, 79
LEGENDDeco GasesO2, He, N2

Eric Maiken, 2003 Limited Distribution
22
Correlation of RGBM and VPM-B(2) TATs for 100 ft Dives
0 20 40 60 80 100VPM TAT min
20
40
60
80
100
MBG
RTATH nimL
TATs for RGBM vs VPM-B H2L for 12 Divesto 100 ft Ranging from 10 to 120 mins
Air+O2 Deco
H L
0 25 50 75 100 125 150 175VPM TAT min
25
50
75
100
125
150
175
MBG
RTATH nimL
TATs for RGBM vs VPM-B H2L for 12 Divesto 100 ft Ranging from 10 to 120 minsAir Deco
Legend
H L

Eric Maiken, 2003 Limited Distribution
23
Correlation of GF and VPM-B(2) TATs for 100ft Dives
0 20 40 60 80 100 120VPM TAT min
20
40
60
80
100
120
FG
TATH nimL
TATs for GF vs VPM-B H2L for 12 Divesto 100 ft Ranging from 10 to 120 mins
Air+O2 Deco
0 50 100 150 200 250VPM TAT min
50
100
150
200
250
FG
TATH nimL
TATs for GF vs VPM-B H2L for 12 Divesto 100 ft Ranging from 10 to 120 mins
H L
Air Deco
Legend
H L

Eric Maiken, 2003 Limited Distribution
24
Stop Times vs. Bottom Times VPM-B Conservatism (2)
Air+O2 Deco
0 20 40 60 80 100 120Dive Time HminL0
20
40
60
80
TAT
H nimL
TAT vs. Bottom Time for12 VPM-B H2L Dives to 100 ft
Ranging from 10 to 120 mins
0 20 40 60 80 100 120Dive Time HminL0
5
10
15
20
25
potS
Hnim L
Time at 10 ft Stop vs. Bottom Time for12 VPM-B H2L Dives to 100 ft
Ranging from 10 to 120 mins
0 20 40 60 80 100 120Dive Time HminL0
10
20
30
40
50
60
potS
H nimL
Total Time at 30-10 ft Stops vs. Bottom Time for12 VPM-B H2L Dives to 100 ft
Ranging from 10 to 120 mins
0 20 40 60 80 100 120Dive Time min
05
101520253035
potS
H nimL
Total Time at 30-20 ft Stops vs. Bottom Time for12 VPM-B H2L Dives to 100 ft
Ranging from 10 to 120 mins
0 20 40 60 80 100 120Dive Time min
0
10
20
30
40
potS
H nimL
Total Time at 20-10 ft Stops vs. Bottom Time for12 VPM-B H2L Dives to 100 ft
Ranging from 10 to 120 mins
H L H L

Eric Maiken, 2003 Limited Distribution
25
Stop Times vs. Bottom Times VPM-B Conservatism (2)
Air Deco
0 20 40 60 80 100 120Dive Time HminL0
25
50
75
100
125
150
TAT
Hnim L
TAT vs. Bottom Time for12 VPM-B H2L Dives to 100 ft
Ranging from 10 to 120 mins
0 20 40 60 80 100 120Dive Time min
010203040506070
potS
H nimL
Time at 10 ft Stop vs. Bottom Time for12 VPM-B H2L Dives to 100 ft
Ranging from 10 to 120 mins
0 20 40 60 80 100 120Dive Time HminL0
20
40
60
80
100
120
140
potS
Hnim L
Total Time at 30-10 ft Stops vs. Bottom Time for12 VPM-B H2L Dives to 100 ft
Ranging from 10 to 120 mins
H L
0 20 40 60 80 100 120Dive Time min
0
10
20
30
40
50
60
potS
Hnim L
Total Time at 30-20 ft Stops vs. Bottom Time for12 VPM-B H2L Dives to 100 ft
Ranging from 10 to 120 mins
0 20 40 60 80 100 120Dive Time HminL0
20
40
60
80
100
potS
Hnim L
Total Time at 20-10 ft Stops vs. Bottom Time for12 VPM-B H2L Dives to 100 ft
Ranging from 10 to 120 mins
H L

Eric Maiken, 2003 Limited Distribution
26
SECTION 3
Ascents from Dives at 100 ft for 10 -120 min12 on Air with Air Deco
12 on Air with Air+O2 Deco
VPM-B Conservatism Setting (4)
10 VPM-B air deco TATs are compared to Bühlmann page 2724 VPM-B profiles compared to RGBM and GF (pps. 28-33)
24 VPM-B ascents with Air and Air+O2 deco are summarized (pps. 34-35)

Eric Maiken, 2003 Limited Distribution
27
Benchmark:Correlation of TATs for Air Decompression Dives
Bühlmann at 98 ft (30 m) and 108 ft (33m) vs. VPM-B(4) 100 ft
Conclusions:1) 100 ft VPM-B(4) correlates linearly to Bühlmann's 1984 Sea-level Tables.2) 100 ft VPM-B(4) tables have much longer TATs than 108 and 98 ft Bühlmann.
0 50 100 150 200VPM TAT min
50
100
150
200
nnamlhuB
TATHnim L
TATs for Buhlmann vs VPM-B H4Lfor Dives to 100 ft Ranging from 30 to 120 mins
B’mann 98 ftB’mann 108 ft
Legend
30 min
H LExtra conservatism is typical of last schedules in Buhlmann tables, which often show large increase in TAT for incremental increase in bottom time. I exclude these data in discussing correlations

Eric Maiken, 2003 Limited Distribution
28
Comparison of RGBM and VPM-B H4L Ascents for Array of100 ft Dives on Back Gas 8O2, He, N2< = 821, 0, 79<
Deco on 821, 0, 79<, and 8100, 0, 0<
100 120 140 160 180RunTime HminL
-80
-60
-40
-20
0
potShtpe
DH tfL
100 min Bottom TimeVPM TAT = 90 minRGBM TAT = 76 min
120 140 160 180 200RunTime HminL
-80
-60
-40
-20
0
potShtpe
DH tfL
110 min Bottom TimeVPM TAT = 102 minRGBM TAT = 84 min
120 140 160 180 200 220RunTime HminL
-80
-60
-40
-20
0
potShtpe
DH tfL
120 min Bottom TimeVPM TAT = 111 minRGBM TAT = 92 min
70 80 90 100 110 120RunTime HminL
-80
-60
-40
-20
0
potShtpe
DH tfL
70 min Bottom TimeVPM TAT = 57 minRGBM TAT = 47 min
80 90100110120130140RunTime HminL
-80
-60
-40
-20
0
potShtpe
DH tfL
80 min Bottom TimeVPM TAT = 67 minRGBM TAT = 60 min
90100110120130140150160RunTime HminL
-80
-60
-40
-20
0
potShtpe
DH tfL
90 min Bottom TimeVPM TAT = 76 minRGBM TAT = 69 min
40 45 50 55 60 65RunTime HminL
-80
-60
-40
-20
0
potShtpe
DH tfL
40 min Bottom TimeVPM TAT = 29 minRGBM TAT = 26 min
50 55 60 65 70 75 80 85RunTime HminL
-80
-60
-40
-20
0
potShtpe
DH tfL
50 min Bottom TimeVPM TAT = 38 minRGBM TAT = 35 min
60 70 80 90 100RunTime HminL
-80
-60
-40
-20
0
potShtpe
DH tfL
60 min Bottom TimeVPM TAT = 48 minRGBM TAT = 41 min
10 10.511 11.5 12 12.513RunTime HminL
-80
-60
-40
-20
0
potShtpe
DH tfL
10 min Bottom TimeVPM TAT = 3.0303 minRGBM TAT = 3.0303 min
20 22 24 26 28RunTime HminL
-80
-60
-40
-20
0
potShtpe
DH tfL
20 min Bottom TimeVPM TAT = 8 minRGBM TAT = 9 min
30 35 40 45 50RunTime HminL
-80
-60
-40
-20
0
potShtpe
DH tfL
30 min Bottom TimeVPM TAT = 22 minRGBM TAT = 18 min
VPM-BRGBM
LEGENDDive Profiles

Eric Maiken, 2003 Limited Distribution
29
Correlation of RGBM to VPM-B H4L Stop Times for Array of100 ft Dives on Back Gas 8O2, He, N2< = 821, 0, 79<
Deco on 821, 0, 79<, and 8100, 0, 0<
5 10 15 20 25Stop Time VPM HminL
510152025
potSe
miTMB
GR
Hnim L
100 min Bottom TimeVPM TAT = 90 minRGBM TAT = 76 min
5 10 15 20 25 30StopTime VPM HminL
51015202530
potSe
miTMB
GR
Hnim L
110 min Bottom TimeVPM TAT = 102 minRGBM TAT = 84 min
5 10 15 20 25 30Stop Time VPM HminL
51015202530
potSe
miTMB
GR
Hnim L
120 min Bottom TimeVPM TAT = 111 minRGBM TAT = 92 min
2.5 5 7.51012.515Stop Time VPM HminL
2.55
7.510
12.515
potSe
miTMB
GR
Hnim L
70 min Bottom TimeVPM TAT = 57 minRGBM TAT = 47 min
2.557.51012.51517.520Stop Time VPM HminL
2.55
7.510
12.515
17.520
potSe
miTMB
GR
H nimL
80 min Bottom TimeVPM TAT = 67 minRGBMTAT = 60 min
5 10 15 20Stop Time VPM HminL
5
10
15
20
potSe
miTMB
GR
Hnim L90 min Bottom TimeVPM TAT = 76 minRGBMTAT = 69 min
2 4 6 8StopTime VPM HminL
2
4
6
8
potSe
miTMB
GR
H nimL
40 min Bottom TimeVPM TAT = 29 minRGBM TAT = 26 min
2 4 6 8 10 12StopTime VPM HminL
2468
1012
potSe
miTMB
GR
Hnim L50 min Bottom TimeVPM TAT = 38 minRGBM TAT = 35 min
2 4 6 8 10 1214StopTime VPM HminL
2468
101214
potSe
miTMB
GR
Hnim L
60 min Bottom TimeVPM TAT = 48 minRGBM TAT = 41 min
-0.75-0.5-0.2500.250.50.751StopTime VPM HminL
-0.75-0.5-0.25
00.250.5
0.751
potSe
miTMB
GR
Hnim L10 min Bottom TimeVPM TAT = 3.0303 minRGBM TAT = 3.0303 min
0.5 1 1.5 2 2.5 3Stop Time VPM HminL
0.51
1.52
2.53
potSe
miTMB
GR
Hnim L
20 min Bottom TimeVPM TAT = 8 minRGBM TAT = 9 min
1 2 3 4 5 6 7StopTime VPM HminL
1234567
potSe
miTMB
GR
H nimL
30 min Bottom TimeVPM TAT = 22 minRGBM TAT = 18 min
100, 0, 0
21, 0, 79
LEGENDDeco GasesO2, He, N2

Eric Maiken, 2003 Limited Distribution
30
Comparison of GF and VPM-B H4L Ascents for Array of100 ft Dives on Back Gas 8O2, He, N2< = 821, 0, 79<
Deco on 821, 0, 79<, and 8100, 0, 0<
100 120 140 160 180RunTime HminL
-80
-60
-40
-20
0
potShtpe
DH tfL
100 min Bottom TimeVPM TAT = 90 minGF TAT = 92 min
120 140 160 180 200RunTime HminL
-80
-60
-40
-20
0
potShtpe
DH tfL
110 min Bottom TimeVPM TAT = 102 minGF TAT = 104 min
120140160180200220240RunTime HminL
-80
-60
-40
-20
0
potShtpe
DH tfL
120 min Bottom TimeVPM TAT = 111 minGF TAT = 120 min
70 80 90 100 110 120RunTime HminL
-80
-60
-40
-20
0
potShtpe
DH tfL
70 min Bottom TimeVPM TAT = 57 minGF TAT = 53 min
80 90100110120130140RunTime HminL
-80
-60
-40
-20
0
potShtpe
DH tfL
80 min Bottom TimeVPM TAT = 67 minGF TAT = 64 min
100 120 140 160RunTime HminL
-80
-60
-40
-20
0
potShtpe
DH tfL
90 min Bottom TimeVPM TAT = 76 minGF TAT = 78 min
40 45 50 55 60 65RunTime HminL
-80
-60
-40
-20
0
potShtpe
DH tfL
40 min Bottom TimeVPM TAT = 29 minGF TAT = 21 min
50 55 60 65 70 75 80 85RunTime HminL
-80
-60
-40
-20
0
potShtpe
DH tfL
50 min Bottom TimeVPM TAT = 38 minGF TAT = 31 min
60 70 80 90 100RunTime HminL
-80
-60
-40
-20
0
potShtpe
DH tfL
60 min Bottom TimeVPM TAT = 48 minGF TAT = 41 min
10 11 12 13 14 15 16Run Time HminL
-80
-60
-40
-20
0
potShtpe
DH tfL
10 min Bottom TimeVPM TAT = 3.0303 minGF TAT = 6 min
20 22 24 26 28Run Time HminL
-80
-60
-40
-20
0
potShtpe
DH tfL
20 min Bottom TimeVPM TAT = 8 minGF TAT = 7 min
30 35 40 45 50RunTime HminL
-80
-60
-40
-20
0
potShtpe
DH tfL
30 min Bottom TimeVPM TAT = 22 minGF TAT = 12 min
VPM-BGF
LEGENDDive Profiles

Eric Maiken, 2003 Limited Distribution
31
Correlation of GF to VPM-B H4L Stop Times for Array of100 ft Dives on Back Gas 8O2, He, N2< = 821, 0, 79<
Deco on 821, 0, 79<, and 8100, 0, 0<
5 10 15 20 25Stop Time VPM HminL
510152025
potSe
miTF
GH nimL
100 min Bottom TimeVPM TAT = 90 minGF TAT = 92 min
5 10 15 20 25 30StopTime VPM HminL
51015202530
potSe
miTF
GH nimL
110 min Bottom TimeVPM TAT = 102 minGF TAT = 104 min
5 10 15 2025 30Stop Time VPM HminL
51015202530
potSe
miTF
GH nimL
120 min Bottom TimeVPM TAT = 111 minGF TAT = 120 min
2.5 5 7.51012.515Stop Time VPM HminL
2.55
7.510
12.515
potSe
miTF
GH nimL
70 min Bottom TimeVPM TAT = 57 minGF TAT = 53 min
2.557.51012.51517.520Stop Time VPM HminL
2.55
7.510
12.515
17.520
potSe
miTF
GH nimL
80 min Bottom TimeVPM TAT = 67 minGF TAT = 64 min
5 10 15 20Stop Time VPM HminL
5
10
15
20
potSe
miTF
GH nimL
90 min Bottom TimeVPM TAT = 76 minGF TAT = 78 min
2 4 6 8StopTime VPM HminL
2
4
6
8
potSe
miTF
GH nimL
40 min Bottom TimeVPM TAT = 29 minGF TAT = 21 min
2 4 6 8 10 12StopTime VPM HminL
2468
1012
potSe
miTF
GH nimL
50 min Bottom TimeVPM TAT = 38 minGF TAT = 31 min
2 4 6 8 10 1214StopTime VPM HminL
2468
101214
potSe
miTF
GH nimL
60 min Bottom TimeVPM TAT = 48 minGF TAT = 41 min
0.2 0.4 0.6 0.8 1Stop Time VPM HminL
0.20.40.60.8
1
potSe
miTF
GH nimL
10 min Bottom TimeVPM TAT = 3.0303 minGF TAT = 6 min
0.5 1 1.5 2 2.5 3Stop Time VPM HminL
0.51
1.52
2.53
potSe
miTF
GH nimL
20 min Bottom TimeVPM TAT = 8 minGF TAT = 7 min
1 2 3 4 5 6 7StopTime VPM HminL
1234567
potSe
miTF
GH nimL
30 min Bottom TimeVPM TAT = 22 minGF TAT = 12 min
100, 0, 0
21, 0, 79
LEGENDDeco GasesO2, He, N2
Eric Maiken, 2003 Limited Distribution
32
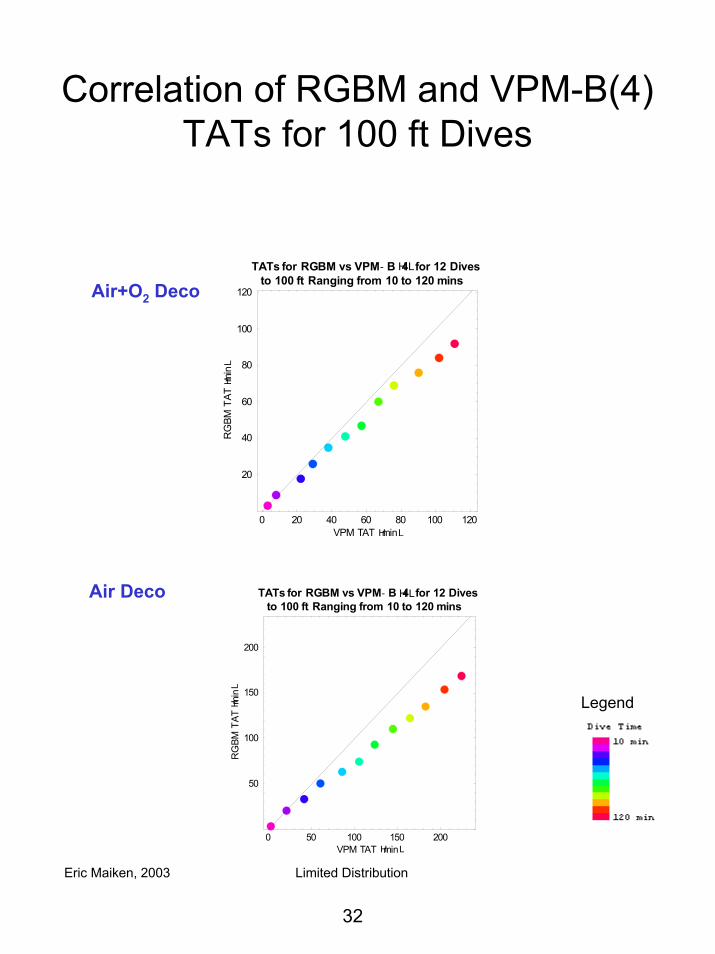
Correlation of RGBM and VPM-B(4) TATs for 100 ft Dives
0 20 40 60 80 100 120VPM TAT min
20
40
60
80
100
120
MBG
RTATH nimL
TATs for RGBM vs VPM-B H4L for 12 Divesto 100 ft Ranging from 10 to 120 minsAir+O2 Deco
0 50 100 150 200VPM TAT min
50
100
150
200
MBG
RTATH nimL
TATs for RGBM vs VPM-B H4L for 12 Divesto 100 ft Ranging from 10 to 120 mins
H LAir Deco
Legend
H L

Eric Maiken, 2003 Limited Distribution
33
Correlation of GF and VPM-B(4) TATs for 100ft Dives
0 20 40 60 80 100 120VPM TAT min
20
40
60
80
100
120
FG
TATHnim L
TATs for GF vs VPM-B H4L for 12 Divesto 100 ft Ranging from 10 to 120 mins
Air+O2 Deco
0 50 100 150 200 250VPM TAT min
50
100
150
200
250
FG
TATH nimL
TATs for GF vs VPM-B H4L for 12 Divesto 100 ft Ranging from 10 to 120 mins
H LAir Deco
Legend
H L

Eric Maiken, 2003 Limited Distribution
34
Stop Times vs. Bottom Times VPM-B Conservatism (4)
Air+O2 Deco
0 20 40 60 80 100 120Dive Time HminL0
20
40
60
80
100
TAT
Hnim L
TAT vs. Bottom Time for12 VPM-B H4L Dives to 100 ft
Ranging from 10 to 120 mins
0 20 40 60 80 100 120Dive Time min
0
5
10
15
20
25
30
potS
H nimL
Time at 10 ft Stop vs. Bottom Time for12 VPM-B H4L Dives to 100 ft
Ranging from 10 to 120 mins
0 20 40 60 80 100 120Dive Time HminL0
20
40
60
80
potS
Hnim L
Total Time at 30-10 ft Stops vs. Bottom Time for12 VPM-B H4L Dives to 100 ft
Ranging from 10 to 120 mins
H L
0 20 40 60 80 100 120Dive Time min
0
10
20
30
40
potS
Hnim L
Total Time at 30-20 ft Stops vs. Bottom Time for12 VPM-B H4L Dives to 100 ft
Ranging from 10 to 120 mins
0 20 40 60 80 100 120Dive Time HminL0
10
20
30
40
50
potS
Hnim L
Total Time at 20-10 ft Stops vs. Bottom Time for12 VPM-B H4L Dives to 100 ft
Ranging from 10 to 120 mins
H L

Eric Maiken, 2003 Limited Distribution
35
Stop Times vs. Bottom Times VPM-B Conservatism (4)
Air Deco
0 20 40 60 80 100 120Dive Time min
0
50
100
150
200
TAT
Hnim L
TAT vs. Bottom Time for12 VPM-B H4L Dives to 100 ft
Ranging from 10 to 120 mins
0 20 40 60 80 100 120Dive Time min
0255075
100125150175
potS
Hnim L
Total Time at 30-10 ft Stops vs. Bottom Time for12 VPM-B H4L Dives to 100 ft
Ranging from 10 to 120 mins
H LH L
0 20 40 60 80 100 120Dive Time min
0
20
40
60
80
100
potS
H nimL
Time at 10 ft Stop vs. Bottom Time for12 VPM-B H4L Dives to 100 ft
Ranging from 10 to 120 mins
H L
0 20 40 60 80 100 120Dive Time min
0
20
40
60
80
potS
Hnim L
Total Time at 30-20 ft Stops vs. Bottom Time for12 VPM-B H4L Dives to 100 ft
Ranging from 10 to 120 mins
0 20 40 60 80 100 120Dive Time HminL0
25
50
75
100
125
150
potS
Hnim L
Total Time at 20-10 ft Stops vs. Bottom Time for12 VPM-B H4L Dives to 100 ft
Ranging from 10 to 120 mins
H L