1 title: evaluation of 6 - jcm.asm.orgjcm.asm.org/content/early/2010/09/22/jcm.01565-10.full.pdf ·...
TRANSCRIPT

1
TITLE: Evaluation of Escherichia coli cell response to antibiotic treatment using laser 1
tweezers Raman spectroscopy 2
3
AUTHORS: Tobias J. Moritz1,2
, Christopher R. Polage2,3
, Douglas S. Taylor2,4
, Denise M. 4
Krol1,2,5
, Stephen M. Lane2, James W. Chan
2,6,* 5
6
1) Biophysics Graduate Group, University of California, Davis, CA 95616, USA 2) NSF 7
Center for Biophotonics Science & Technology, UC Davis, Sacramento, CA 95817, USA 8
3) Department of Pathology and Laboratory Medicine, UC Davis Medical Center, 9
Sacramento, CA 95817, USA 4) Department of Pediatrics, UC Davis Medical Center, 10
Sacramento, CA 95817, USA 5) Department of Applied Science, University of California, 11
Davis, CA 95616, USA 6) Physics Division, Lawrence Livermore National Laboratory, 12
Livermore, CA 94550 13
14
*Corresponding author. Mailing address: NSF Center for Biophotonics Science & 15
Technology, 2700 Stockton Blvd, Suite 1400, Sacramento, CA 95817, USA. Phone: (916) 16
734-0774, Fax: (916) 703-5012, E-mail: [email protected] 17
18
RUNNING TITLE: Raman Spectroscopy of Antibiotic Response of E. Coli Cells 19
20
WORD COUNT: Abstract: 47, Text: 1313 21
22
Copyright © 2010, American Society for Microbiology and/or the Listed Authors/Institutions. All Rights Reserved.J. Clin. Microbiol. doi:10.1128/JCM.01565-10 JCM Accepts, published online ahead of print on 22 September 2010
on Novem
ber 7, 2018 by guesthttp://jcm
.asm.org/
Dow
nloaded from

2
KEYWORDS: Raman spectroscopy, laser tweezers, optical trapping, vibrational 23
spectroscopy, E. coli bacteria, antibiotic susceptibility 24
25
ABSTRACT 26
Laser tweezers Raman spectroscopy was used to detect the cellular response of E. coli cells 27
to penicillin G/streptomycin and cefazolin. Time-dependent intensity changes of several 28
Raman peaks at 729, 1245, and 1660 cm-1
enabled untreated cells and cells treated with the 29
different antibiotic drugs to be distinguished. 30
31
TEXT 32
Laser tweezers Raman spectroscopy (LTRS) is unique among emerging technologies in its 33
ability to assess the composition of single, live cells in real time without exogenous 34
labeling or genetic modification.(2, 3, 15). Using a tightly focused laser beam to optically 35
trap single cells within the laser focus and generate inelastically scattered photons as the 36
laser interacts with the cell’s intrinsic molecular bonds, LTRS can be used to acquire a 37
Raman spectrum of the cell non-invasively and non-destructively. As such, Raman spectra 38
offer a fingerprint of vibrating chemical bonds that vary with physiologic growth state (4, 39
11, 12) and have been used to distinguish bacterial species and strains (1, 8, 9, 14). LTRS is 40
attractive in its ability to characterize single cells and detect cellular changes in response to 41
antibiotics that may allow for early detection of bacterial resistance or identification of 42
small subpopulations with unique metabolic, phenotypic or antimicrobial responses 43
(resistance). Such capabilities make this technology of great potential interest for clinical 44
and diagnostic purposes. 45
on Novem
ber 7, 2018 by guesthttp://jcm
.asm.org/
Dow
nloaded from

3
Prior studies in which Raman or ultraviolet resonance Raman spectroscopy were used to 46
distinguish bacterial strains and species, monitor bacterial growth phases, or evaluate the 47
influence of antibiotics on bacteria (14), analyzed bulk cell populations. Here, we make a 48
valuable extension to this work by using LTRS to detect bacterial responses to antibiotics at 49
a cellular level. In this proof of principle study, LTRS is used to characterize the effect of 50
two different antibiotic treatments and concentrations on the growth and vibrational spectra 51
of drug susceptible Escherichia coli (E. coli). Raman peaks associated with drug exposure 52
are identified that may distinguish bacterial response between antibiotic preparations or 53
drug classes. 54
A single colony of ampicillin-sensitive E. coli (ATCC 25922) from overnight sub-culture 55
was inoculated into 20ml of Luria-Bertani Broth (Gibco) and incubated at T=37ºC in a 56
shaker incubator (f=225rpm, Excella E25). Broth cultures were sampled and optical density 57
(OD, λ=600 nm) values and Raman spectra were obtained at 1-2 hour intervals for 24 hours 58
and then every 10 hours for 5 days. This procedure was repeated 10 times; 5 without 59
antibiotics; 3 with penicillin G/streptomycin added; 2 with cefazolin added. For the 60
antibiotic exposure studies, laboratory grade penicillin G/streptomycin (Gibco 1552) was 61
used at final concentrations of 1 Vol% (100 units penicillin/mL (1-4 x MIC), 100 µg 62
streptomycin/mL (12-50 x MIC)) and 5 Vol% (500 units penicillin/mL (5-20 x MIC), 500 63
µg streptomycin/mL (60-250 x MIC)); cefazolin (Cura Pharmaceutical) was used at a final 64
concentration of 100 µg/ml (50 x MIC). In all cases, the drug was added 3.5h after culture 65
inoculation (end of log phase). Published minimum inhibitory concentrations (MIC) for E. 66
coli ATCC 25922 and penicillin, cefazolin and streptomycin were used.(5) 67
on Novem
ber 7, 2018 by guesthttp://jcm
.asm.org/
Dow
nloaded from
4
A modified inverted microscope (10) with a continuous wave laser at λ=785nm 68
(CrystaLaser) focused with a water immersion microscope objective (Olympus 60x/1.2) 69
was used to acquire Raman spectra of individual, optically trapped bacteria cells. 100µl of 70
bacteria in LB was added to 1ml phosphate buffered saline solution (PBS) in a cell chamber 71
(Molecular probes, Attofluor) with a fused silica microscope cover slip bottom. On 72
average, five suspended bacterial cells were optically trapped at a time. The cells were 73
interrogated for 60s with 28 mW of laser power to obtain a Raman spectrum. 74
Approximately 75 cells were interrogated for each growth curve time point. 75
Figure 1A shows the E. coli growth curve with and without antibiotic treatment. The optical 76
density (OD) of the culture decreased with antibiotic treatment and the magnitude of this 77
effect increased at higher drug concentrations. Using these growth curves as a reference, 78
the Raman spectra of treated and non-treated bacterial cells were compared at several time 79
points. As an illustration, the mean Raman spectra at early stationary phase (t2 - 10 hours 80
after inoculation, equivalent to 6.5h after drug was added) for normal growth and growth 81
during penicillin G/streptomycin exposure are presented in Figure 1B. The largest 82
differences in these Raman spectra are visible in the peaks at 729 cm-1
, 1245 cm-1
, and 83
1660cm-1
. To further investigate this, the Raman difference spectra between 4 hours (t1) 84
and 10 hours (t2) were plotted for normal growth and growth under treatment with 1Vol% 85
and 5Vol% penicillin G/streptomycin (Figures 2A through 2C). The spectral differences in 86
the 729 cm-1
, 1245 cm-1
, and 1660 cm-1
peaks are also visible in these plots. The time 87
dependences of the relative changes in the intensities of these peaks were plotted for normal 88
growth and antibiotic treatment in Figures 2D, 2E, and 2F. The maximum intensity and the 89
on Novem
ber 7, 2018 by guesthttp://jcm
.asm.org/
Dow
nloaded from

5
intensity values of the two neighboring channels were added for each Raman peak to obtain 90
the intensity values used in these peak time traces. These values were normalized to the 91
peak intensities at the 4h time point after inoculation. Unlike the normal growth spectra, no 92
increase in the 729 cm-1
or 1245 cm-1
Raman peak intensity was observed when antibiotics 93
were present. However, an increase in the 1660 cm-1
peak was detected, which was not 94
observed during normal growth. The p-values for the 729 cm-1
, 1245 cm-1
, and 1660 cm-1
95
peak intensities at the 4.5h time point for 1Vol% penicillin G/streptomycin exposure were 96
calculated to be 5.6·10-9
, 4·10-13
, and 7.2·10-5
, respectively. The p-values for 5Vol% drug 97
treatment were of the same order of magnitude. The time point at which cellular drug 98
response can be spectroscopically distinguished from normal cell growth was 99
approximately after 4.5 hours of drug exposure. A similar Raman spectral response was 100
observed for treatment of E. coli with cefazolin as shown in the time traces of relative 101
changes in peak intensities for the Raman frequencies 729 cm-1
and 1245 cm-1
(Figure 2D 102
and 2E), suggesting that this may represent a shared response to β-lactam antibiotics. These 103
differences may reflect physiologic changes in the cellular adenine environment during 104
growth that occurred only in the absence of antibiotics.(11) However, unlike the penicillin 105
G/streptomycin treatment, no increase in the 1660 cm-1
Raman peak was observed during 106
treatment with cefazolin (Figure 2F), consistent with a specificity of this Raman 107
spectroscopic response to aminoglycoside exposure. Previous studies showed that 108
ribosomes display a strong Raman peak at 1660 cm-1
(6) and streptomycin treatment has 109
been associated with intracellular accumulation of 70s ribosome monomers (7). 110
Principal component analysis (PCA) (13) was performed on the Raman spectra to generate 111
two-dimensional scattergrams that simplify data presentation for visualizing the extent of 112
on Novem
ber 7, 2018 by guesthttp://jcm
.asm.org/
Dow
nloaded from
6
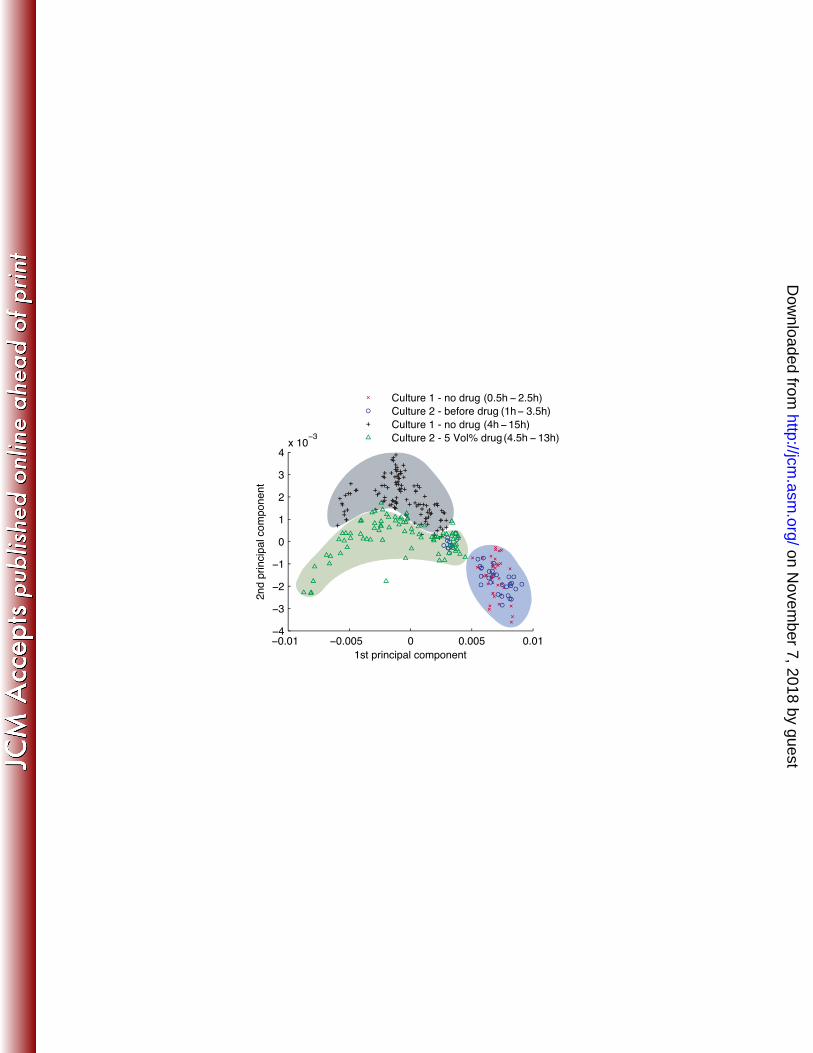
the separation of the cell population groups under normal and antibiotic growth conditions. 113
The spectral region from 710 cm-1
to 1280 cm-1
containing the most significant changes 114
was used. Figure 3 shows the principal component 2 (PC2) versus principal component 1 115
(PC1) scatter plots for normal growth (culture 1) and growth under drug exposure (culture 116
2). Before the addition of antibiotics (culture 2), the Raman spectra are identical for both 117
growth curves and co-localize in the PCA plot (blue region in Figure 3). The time from the 118
initial drug exposure and the observable separation by Raman spectra was between 30 min 119
(4 h after inoculation) and 11.5 h (15h after inoculation) as indicated in Figure 3 by the gray 120
and green shaded regions for normal growth and antibiotic treatment, respectively. 121
In conclusion, we demonstrate that Raman spectroscopy combined with PCA is sufficiently 122
sensitive and discriminatory to separate antibiotic treated bacteria from untreated cells 123
using an antibiotic susceptible strain of E. coli. Specific Raman spectroscopic markers of 124
E. coli response to β-lactam and or aminoglycoside treatment are also identified. Future 125
studies will evaluate this technology using additional antibiotics and bacteria including 126
strains with well defined mechanisms of antibiotic resistance. 127
128
We are grateful to Distinguished Professor John Roth (Department of Microbiology, UC 129
Davis) for a very insightful discussion. This work has been supported in part by funding 130
from the Children’s Miracle Network, the Keaton-Raphael Memorial Fund, and the 131
National Science Foundation. The Center for Biophotonics, an NSF Science and 132
Technology Center, is managed by the University of California, Davis, under Cooperative 133
Agreement No. PHY 0120999. 134
135
on Novem
ber 7, 2018 by guesthttp://jcm
.asm.org/
Dow
nloaded from

7
References 136
1. Buijtels, P., H. F. M. Willemse-Erix, P. L. C. Petit, H. P. Endtz, G. J. Puppels, 137
H. A. Verbrugh, A. van Belkum, D. van Soolingen, and K. Maquelin. 2008. 138
Rapid identification of mycobacteria by Raman spectroscopy. Journal of Clinical 139
Microbiology 46:961-965. 140
2. Chan, J. W., D. S. Taylor, S. M. Lane, T. Zwerdling, J. Tuscano, and T. Huser. 141
2008. Nondestructive identification of individual leukemia cells by laser trapping 142
Raman spectroscopy. Analytical Chemistry 80:2180-2187. 143
3. Chan, J. W., D. S. Taylor, T. Zwerdling, S. M. Lane, K. Ihara, and T. Huser. 144
2006. Micro-Raman spectroscopy detects individual neoplastic and normal 145
hematopoietic cells. Biophysical Journal 90:648-656. 146
4. Escoriza, M. F., J. M. Vanbriesen, S. Stewart, and J. Maier. 2006. Studying 147
bacterial metabolic states using Raman spectroscopy. Applied Spectroscopy 148
60:971-976. 149
5. Fass, R. J., and J. Barnishan. 1979. MINIMAL INHIBITORY 150
CONCENTRATIONS OF 34 ANTI-MICROBIAL AGENTS FOR CONTROL 151
STRAINS ESCHERICHIA-COLI ATCC 25922 AND PSEUDOMONAS-152
AERUGINOSA ATCC 27853. Antimicrobial Agents and Chemotherapy 16:622-153
624. 154
6. Hobro, A. J., M. Rouhi, G. L. Conn, and E. W. Blanch. 2008. Raman and Raman 155
optical activity (ROA) analysis of RNA structural motifs. Vibrational Spectroscopy 156
48:37-43. 157
7. Luzzatto, L., D. Apirion, and Schlessi.D. 1968. MECHANISM OF ACTION OF 158
STREPTOMYCIN IN E COLI - INTERRUPTION OF RIBOSOME CYCLE AT 159
INITIATION OF PROTEIN SYNTHESIS. Proceedings of the National Academy 160
of Sciences of the United States of America 60:873-&. 161
8. Maquelin, K., L. P. Choo-Smith, H. P. Endtz, H. A. Bruining, and G. J. 162
Puppels. 2002. Rapid identification of Candida species by confocal Raman micro 163
spectroscopy. Journal of Clinical Microbiology 40:594-600. 164
9. Maquelin, K., C. Kirschner, L. P. Choo-Smith, N. A. Ngo-Thi, T. van 165
Vreeswijk, M. Stammler, H. P. Endtz, H. A. Bruining, D. Naumann, and G. J. 166 Puppels. 2003. Prospective study of the performance of vibrational spectroscopies 167
for rapid identification of bacterial and fungal pathogens recovered from blood 168
cultures. Journal of Clinical Microbiology 41:324-329. 169
10. Moritz, T. J., J. A. Brunberg, D. M. Krol, S. Wachsmann-Hogiu, S. M. Lane, 170
and J. W. Chan. 2009. Characterization of FXTAS related isolated intranuclear 171
protein inclusions using laser tweeezers Raman spectroscopy. Journal of Raman 172
Spectroscopy 40. 173
11. Moritz, T. J., D. S. Taylor, C. R. Polage, D. M. Krol, S. M. Lane, and J. W. 174
Chan. 2010. Effect of Cefazolin Treatment on the Non-Resonant Raman Signatures 175
of the Metabolic States of Individual Escherichia Coli Cells. Analytical Chemistry 176
DOI: 10.1021/ac902351a. 177
on Novem
ber 7, 2018 by guesthttp://jcm
.asm.org/
Dow
nloaded from

8
12. Neugebauer, U., U. Schmid, K. Baumann, U. Holzgrabe, W. Ziebuhr, S. 178
Kozitskaya, W. Kiefer, M. Schmitt, and J. Popp. 2006. Characterization of 179
bacterial growth and the influence of antibiotics by means of UV resonance Raman 180
spectroscopy. Biopolymers 82:306-311. 181
13. Ringner, M. 2008. What is principal component analysis? Nature Biotechnology 182
26:303-304. 183
14. Xie, C., J. Mace, M. A. Dinno, Y. Q. Li, W. Tang, R. J. Newton, and P. J. 184
Gemperline. 2005. Identification of single bacterial cells in aqueous solution using 185
conflocal laser tweezers Raman spectroscopy. Analytical Chemistry 77:4390-4397. 186
15. Xie, C. G., M. A. Dinno, and Y. Q. Li. 2002. Near-infrared Raman spectroscopy 187
of single optically trapped biological cells. Optics Letters 27:249-251. 188
189
190
191
Figure Legends 192
FIG. 1. Correlation between Raman spectral changes and growth curve response of E. Coli. 193
(A) Changes to the E. Coli growth curve after exposure to penicillin G/streptomycin at drug 194
concentrations of 1Vol% (100 units per ml / 100 µg per ml) and 5Vol% (500 units per ml / 195
500 µg per ml). A decrease in optical density (OD) is visible, showing lower values for 196
higher drug concentration. (B) Comparison of Raman spectra measured at 10h after 197
inoculation (t2) for normal growth and growth during exposure to 5Vol% penicillin 198
G/streptomycin. Relevant differences in Raman peaks at 729 cm-1
, 1245 cm-1
, and 1660cm-
199
1 were identified, which are marked with black arrows. 200
201
FIG. 2. Raman spectroscopic differences after antibiotic treatment. (A-C) Difference 202
Raman spectrum between 10h and 4h after inoculation of the bacterial culture for normal 203
growth and during antibiotic treatment with 1Vol% and 5Vol% penicillin G/streptomycin, 204
respectively. Standard deviations are given as gray curves. Relevant differences are visible 205
in the 729cm-1
, 1245cm-1
, and 1660cm-1
Raman peaks (marked with gray boxes). (D-F) 206
on Novem
ber 7, 2018 by guesthttp://jcm
.asm.org/
Dow
nloaded from

9
Time dependence of relative changes in Raman peak intensities for 729cm-1
, 1245cm-1
, and 207
1660cm-1
, respectively, comparing normal growth (dotted curve) to drug exposure (solid 208
curves - black). Raman peak trends for the exposure to 100 µg/ml cefazolin are also shown 209
(solid curves - red). Standard deviations are given for each data point on the curves. 210
Statistically relevant differences between peak trends for normal growth and during drug 211
exposure are observable as early as 4.5 hours after drug exposure. While differences in all 3 212
peaks, mentioned above, are observed for the treatment with penicillin G/streptomycin, 213
exposure to cefazolin resulted only in different trends for the 729cm-1
and 1245cm-1
peaks 214
but not for the 1660cm-1
Raman peak. 215
216
FIG. 3. Principal component analysis (PCA) scatter plot of E. Coli Raman spectra for 217
normal growth and growth during exposure to 5Vol% (500 units per ml / 500 µg per ml) 218
penicillin G/streptomycin. Raman spectra representative of normal growth (black crosses - 219
gray shaded area) clearly separate from spectra measured during drug exposure (green 220
triangles - green shaded area) within the time frame 4h to 15h after culture inoculation 221
(drug added about 3.5h after inoculation). Normal growth specific spectra (red crosses) co 222
localize with spectra of the culture exposed to drug (blue circles) before addition of the 223
antibiotics (0.5h to 2.5h after inoculation of culture). This is marked in the plot with a blue 224
shaded area. 225
on Novem
ber 7, 2018 by guesthttp://jcm
.asm.org/
Dow
nloaded from

600 800 1000 1200 1400 16000
0.5
1
1.5
2
2.5
3
3.5
4
Wavenumbers/cm-1
Ram
an Inte
nsity
0.01
0.1
1
10
0 5 10 15 20 25 30 35
A
B
Drugadded
t2
t1
no drug
1 Vol% Pen/Strep5 Vol% Pen/Strep
Time [h]
OD
(lo
g s
cale
)
no drug
5 Vol% Pen/Strep
Spectra at 10h (time point t2)
on Novem
ber 7, 2018 by guesthttp://jcm
.asm.org/
Dow
nloaded from

0.5 1.5 2.5 3.5 4.5 5.5 6.50.6
0.8
1
1.2
1.4
1.6
Time after drug addition/h
Inte
nsity
0.5 1.5 2.5 3.5 4.5 5.5 6.50.6
0.8
1
1.2
1.4
1.6
Time after drug addition/h
Inte
nsity
0.5 1.5 2.5 3.5 4.5 5.5 6.50.6
0.8
1
1.2
1.4
1.6
Time after drug addition/h
Inte
nsity
600 800 1000 1200 1400 1600
−10
−5
0
5
Raman shift [cm-1]
Rela
tive Inte
sity [a.u
.]
600 800 1000 1200 1400 1600
−10
−5
0
5
Raman shift [cm-1]
Rela
tive Inte
nsity [a.u
.]
No drug
1 Vol% Pen/Strep
600 800 1000 1200 1400 1600
−10
−5
0
5
Raman shift [cm-1]
Rela
tive Inte
nsity [a.u
.]
5 Vol% Pen/Strep
729 cm-1 peak
1245 cm-1 peak
800
1200
Raman shift [cm
1200
Raman shift [cm
1 Vol% Pen/Strep1 Vol% Pen/Strep
5 Vol% Pen/Strep5 Vol% Pen/Strep
1600
1600
A
B
C
D
E
F
1 Vol%
5 Vol%
1660 cm-1 peak
1 Vol%
5 Vol%
Nodrug
1 Vol%5 Vol%
Nodrug
Nodrug
72
9 c
m-1 p
eak
12
45
cm
-1 p
eak
16
60
cm
-1 p
eak
Cefaz.
Cefaz.
Cefaz.
on Novem
ber 7, 2018 by guesthttp://jcm
.asm.org/
Dow
nloaded from
−0.01 −0.005 0 0.005 0.01−4
−3
−2
−1
0
1
2
3
4x 10
−3
1st principal component
2nd p
rin
cip
al com
po
nent
Culture 1 - no drug − 2.5h)
Culture 2 - before drug − 3.5h)
Culture 1 - no drug − 15h)
Culture 2 - 5 Vol% drug − 13h)
(0.5h
(4.5h
(1h
(4h
on Novem
ber 7, 2018 by guesthttp://jcm
.asm.org/
Dow
nloaded from