1 title and content page -...
TRANSCRIPT
4 Results and Discussion
The data obtained for the periplasmic production of disulfide bonded proteins, human pepsinogen
and human proinsulin, are summarized in the following sections. Details of the data are published
and presented in the chapter 7.
4.1 Development of a fluorogenic assay for pepsin
Pepsinogen (40.1 kDa) is a zymogen of pepsin (34.6 kDa) containing three consecutive disulfide
bonds required for proper folding and activity. Acidification of pepsinogen leads to its
autoactivation, resulting in the formation of pepsin. Enzymatic activity was performed for the
quantification of properly folded pepsinogen in the periplasmic extract due to close structure-
function relationship.
Usually, the expression level of properly folded proteins in the periplasm is in the order of ng/ml.
Therefore, a very sensitive assay was desired for the precise quantification of pepsinogen in the
periplasmic extracts. Several existing pepsin assays were evaluated using commercial porcine
pepsinogen as a reference.
4.1.1 Evaluation of various pepsin assays
Pepsin is a well known aspartic protease. It was partially purified, characterized and crystallized
in 1920’s (Northrop, 1930). With time, different assays were developed according to need. The
substrates for pepsin are based on use of hydrophobic amino acids in the peptides (Inouye and
Fruton, 1967), labeled with chromo- or fluorophore, or whole proteins e.g. hemoglobin, casein
etc. (Anson, 1938) or fluorophore-quenched proteins (Jones, et al., 1997). The most sensitive
assay for pepsin is the use of radiolabelled hemoglobin (Lin, et al., 1989) but this assay is not
convenient for routine purpose due to safety reasons and requirement of special instruments. In
the present study, four different pepsin assays were tested. The results are described and
discussed below.
________________________________________
Use of a chromogenic peptide substrate: Pepsin is a broad range protease but preferentially
hydrolyzes peptide bonds between large hydrophobic aromatic residues (Inouye and Fruton,
1967). Therefore, all the peptides used in pepsin assay are hydrophobic although hydrophilic
groups are introduced to increase the solubility of the peptides. These peptides still have
significant hydrophobicity and cause solubility problems. In this study, Phe-Ala-Ala-4-nitro-Phe-
Phe-Val-Leu-pyridin-4-ylmethylester (cat. no: M-1690 from BACHEM) was used as substrate.
Pepsin cleaves in between two phenylalanine residues and liberates nitro phenyl group at the end.
A yellow colored solution develops. Using 100 µM substrate and 40 nM pepsin in 40 mM
formate buffer, pH 3.5 at room temperature, the total increase in absorbance at 310 nm was only
0.05. Due to the low sensitivity and solubility, other assays were examined. These were based on
whole protein as substrate.
QuantiCleaveTM
protease assay kit from Pierce: In this assay, the primary amines on the surface of
casein are blocked with succinic anhydride. In the presence of proteases, succinylated casein is
cleaved thereby liberating primary amines at the end of peptides. TNBSA at alkaline pH reacts
with exposed primary amines to produce an orange-yellow color with absorption at 450 nm.
Since succinylated casein was precipitating below pH 4.0, digestion of succinylated casein with
pepsin was performed at pH 4.5. The quantification range of porcine pepsin was 100-500 ng.
However, it lead to only a little increase in absorption (∆A450 = 0.05). Moreover, this assay was
not suitable for quantification of pepsinogen in the periplasmic extracts due to interference of
primary amines from the buffer (e.g. Tris) and due to the high protein content.
EnzChek®
Protease assay kit from Molecular Probes: In this assay, casein is heavily labeled with
the pH-insensitive fluorescent BODIPY®
FL dye, resulting in an almost quantitative quenching
of the conjugate’s fluorescence. After digestion with pepsin at pH 2.0, liberated peptides with
conjugated BODIPY®
FL exhibited fluorescence with an excitation/emission maxima at 505/513
nm. This assay was sensitive for the quantification of pepsin up to 10 ng in the microtiter plate
format. However, it was found that the initial increase in fluorescence was independent from the
pepsin concentration. Furthermore, the presence of E. coli proteases in the periplasmic extracts of
negative control showed significant background.
________________________________________
Use of hemoglobin: Hemoglobin is a commonly used substrate for pepsin quantification (Anson,
1938). A 2% hemoglobin solution in 60 mM HCl was incubated with pepsin at 37 °C. Uncleaved
hemoglobin was precipitated by addition of 5% TCA. The absorbance of soluble peptides was
measured at 280 nm. The sensitivity of this hemoglobin based pepsin assay was low (1-10
µg/ml). It was observed that the presence of nucleic acids in the protein sample masked the
absorption of TCA soluble peptides at 280 nm. Refolded probes from inclusion bodies or
periplasmic extracts often contain nucleic acids. Therefore, the hemoglobin based pepsin assay
was not suitable.
The milk clotting assay for pepsin quantification is a sensitive assay in the ng range. However,
the turbidity of milk can be changed by a different protease and other agents (McPhie, 1976).
Therefore, this assay is not precise and selective for pepsin. Intramolecular fluorophore quenched
hydrophobic peptides in the pepsin assay are also sensitive in the ng range (da Silva Gomes, et
al., 2003), but due to low the solubility and high costs of these fluorogenic peptides they were
not evaluated for routine estimation of pepsinogen from periplasmic extracts.
4.1.2 Use of EGFP as a substrate
In the next step, a well known and characterized fluorogenic protein (GFP) was tested as a
potential substrate for pepsin quantification. EGFP is a variant of GFP with 35-fold more
fluorescence intensity in comparison to the wild-type protein (Cormack, et al., 1996). EGFP is
itself very soluble and stable. Nearly the entire protein is required for fluorophore formation (Li,
et al., 1997). Therefore, digested EGFP does not exhibit fluorescence. GFP has a strong tendency
to renaturate (80-90%) in the absence of denaturants (Ward and Bokman, 1982). Based on these
informations, a new assay for pepsin was developed.
4.1.3 Reversible unfolding of EGFP
The optimum pH of pepsin activity is 1.0 for substrates like casein and hemoglobin (Cornis-
Bowden. A. J. and Knowles, 1969). Therefore, EGFP must be acidified in order to be cleaved by
pepsin. EGFP exhibits stable fluorescence at alkaline pH and loses its fluorescence at acidic pH
________________________________________
due to denaturation. Since EGFP retains only 50% fluorescence at pH 5.9 (Patterson, et al.,
2001). Therefore, remaining intact EGFP molecules must be neutralized after pepsin cleavage.
GFP exhibits a pH-independent fluorescence in the range of pH 7-10 (Bokman and Ward, 1981).
The dependence of EGFP fluorescence on its concentration was determined. The fluorescence of
native EGFP was linearly dependent on the protein concentration up to 55 µg/ml (Fig. 1A,
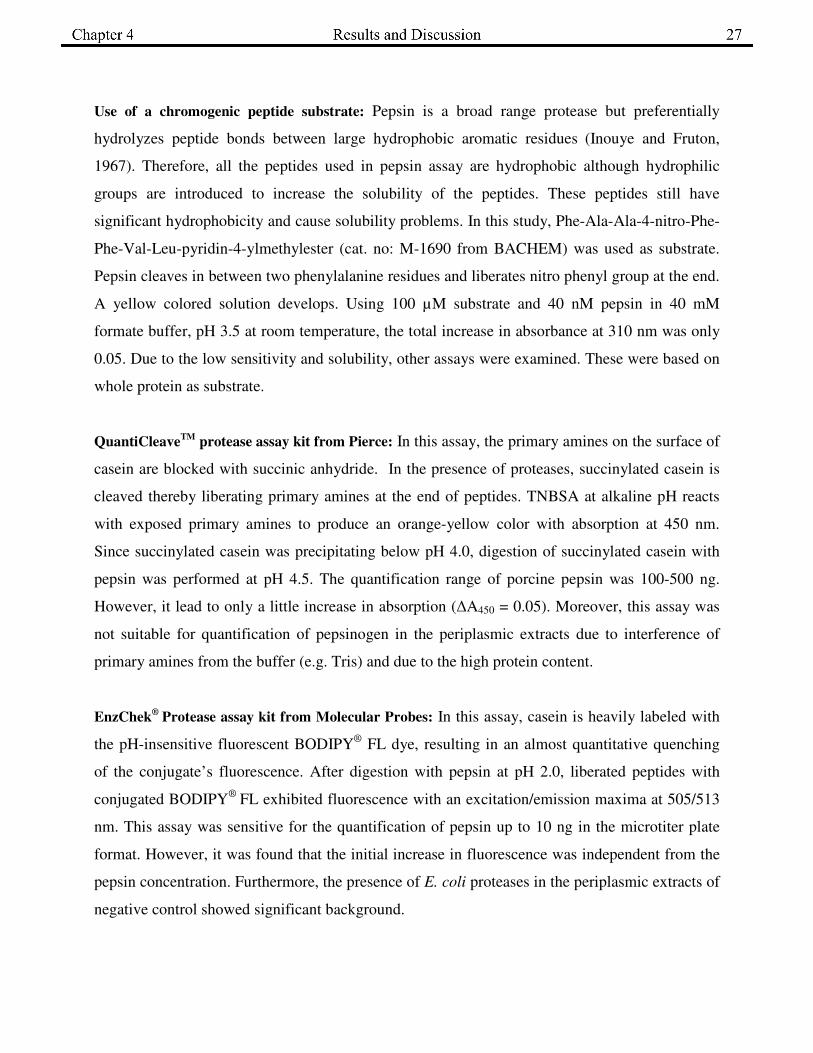
chapter 7.1). To analyze the appropriate pH for acid denaturation, incubation time and
temperature, 11 µg of EGFP was acidified to pH 2.0, 3.0, 3.5 and 4.0 by adding 0.1 volumes of
the 1 M respective citrate buffer at five different temperatures (20, 30, 37, 45 and 55 °C). After
10, 30 and 60 min of denaturation, EGFP was renatured by adding 0.4 M Tris-HCl, pH 8.5. As
shown in Fig. 7, EGFP underwent complete renaturation when it was denatured to pH 2.0 at 20-
37 °C up to 60 min. When EGFP was denatured above pH 3.0, regaining of fluorescence was
reduced at all the temperatures and incubation times.
To analyze the concentration dependent EGFP renaturation, varying concentrations of EGFP up
to 55 µg/ml were acidified to pH 2.0 for 10 min at room temperature and then neutralized again
to pH 8.0. The fluorescence of EGFP obtained after renaturation was the same as that of the
native EGFP, indicating the complete refolding under these conditions (Fig. 1A, chapter 7.1).
After neutralization of acidified EGFP at room temperature, fluorescence was completely
recovered within 5 min indicating fast refolding, and the fluorescence of refolded EGFP was
stable for at least 1 hour (Fig. 1B, chapter 7.1)
________________________________________
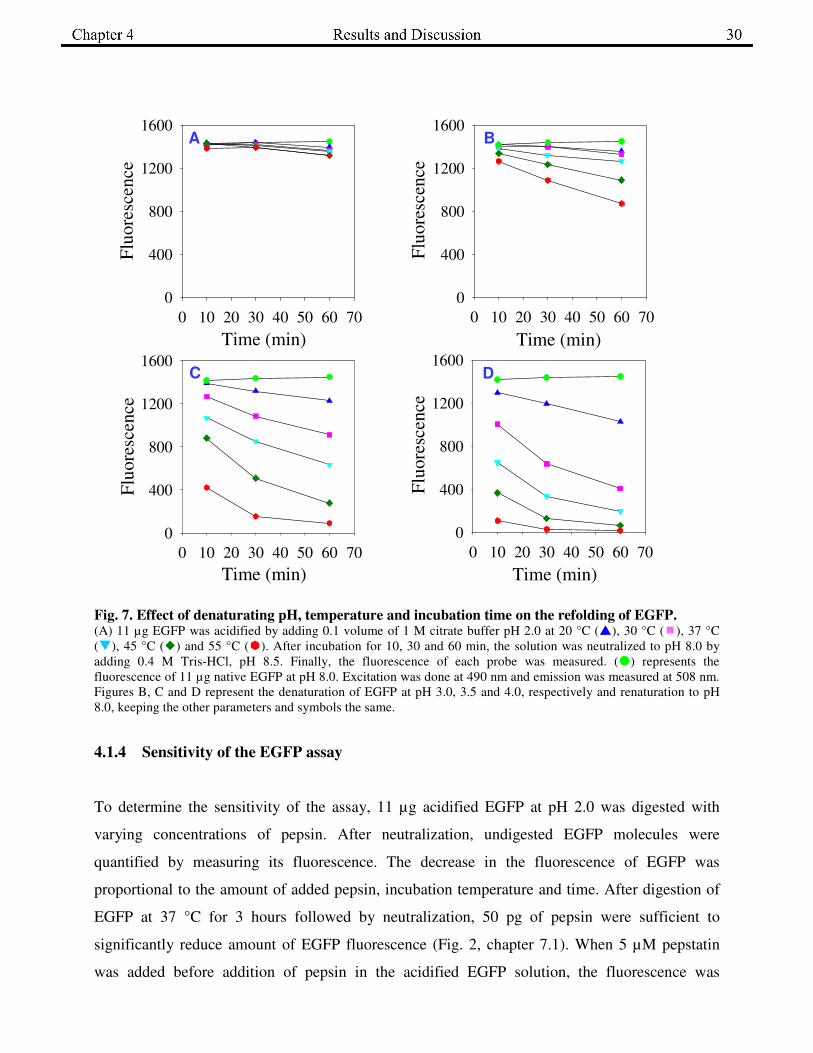
Fig. 7. Effect of denaturating pH, temperature and incubation time on the refolding of EGFP. (A) 11 µg EGFP was acidified by adding 0.1 volume of 1 M citrate buffer pH 2.0 at 20 °C (�), 30 °C (�), 37 °C
(�), 45 °C (�) and 55 °C (�). After incubation for 10, 30 and 60 min, the solution was neutralized to pH 8.0 by
adding 0.4 M Tris-HCl, pH 8.5. Finally, the fluorescence of each probe was measured. (�) represents the
fluorescence of 11 µg native EGFP at pH 8.0. Excitation was done at 490 nm and emission was measured at 508 nm.
Figures B, C and D represent the denaturation of EGFP at pH 3.0, 3.5 and 4.0, respectively and renaturation to pH
8.0, keeping the other parameters and symbols the same.
4.1.4 Sensitivity of the EGFP assay
To determine the sensitivity of the assay, 11 µg acidified EGFP at pH 2.0 was digested with
varying concentrations of pepsin. After neutralization, undigested EGFP molecules were
quantified by measuring its fluorescence. The decrease in the fluorescence of EGFP was
proportional to the amount of added pepsin, incubation temperature and time. After digestion of
EGFP at 37 °C for 3 hours followed by neutralization, 50 pg of pepsin were sufficient to
significantly reduce amount of EGFP fluorescence (Fig. 2, chapter 7.1). When 5 µM pepstatin
was added before addition of pepsin in the acidified EGFP solution, the fluorescence was
Time (min)
0 10 20 30 40 50 60 70
Flu
ore
scen
ce
0
400
800
1200
1600A
Time (min)
0 10 20 30 40 50 60 70
Flu
ore
scen
ce
0
400
800
1200
1600A
Time (min)
0 10 20 30 40 50 60 70
Flu
ore
scen
ce
0
400
800
1200
1600B
Time (min)
0 10 20 30 40 50 60 70
Flu
ore
scen
ce
0
400
800
1200
1600B
Time (min)
0 10 20 30 40 50 60 70
Flu
ore
scen
ce
0
400
800
1200
1600C
Time (min)
0 10 20 30 40 50 60 70
Flu
ore
scen
ce
0
400
800
1200
1600C
Time (min)
0 10 20 30 40 50 60 70
Flu
ore
scen
ce
0
400
800
1200
1600D
Time (min)
0 10 20 30 40 50 60 70
Flu
ore
scen
ce
0
400
800
1200
1600D
________________________________________
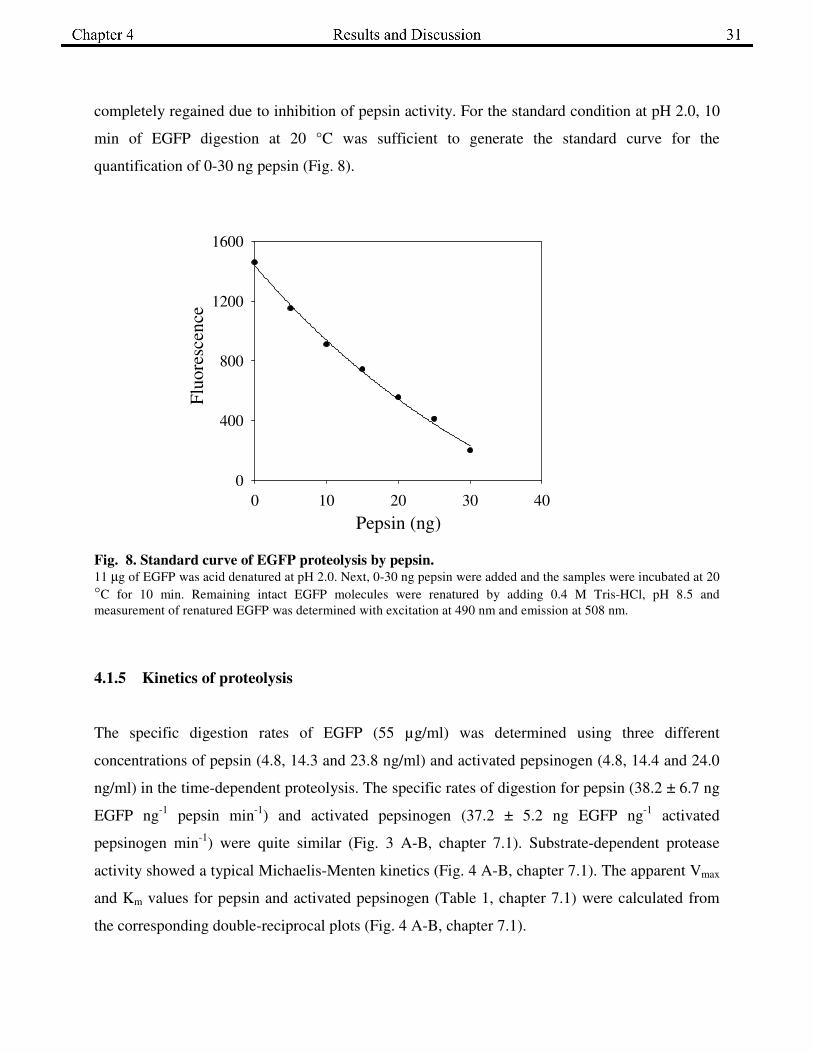
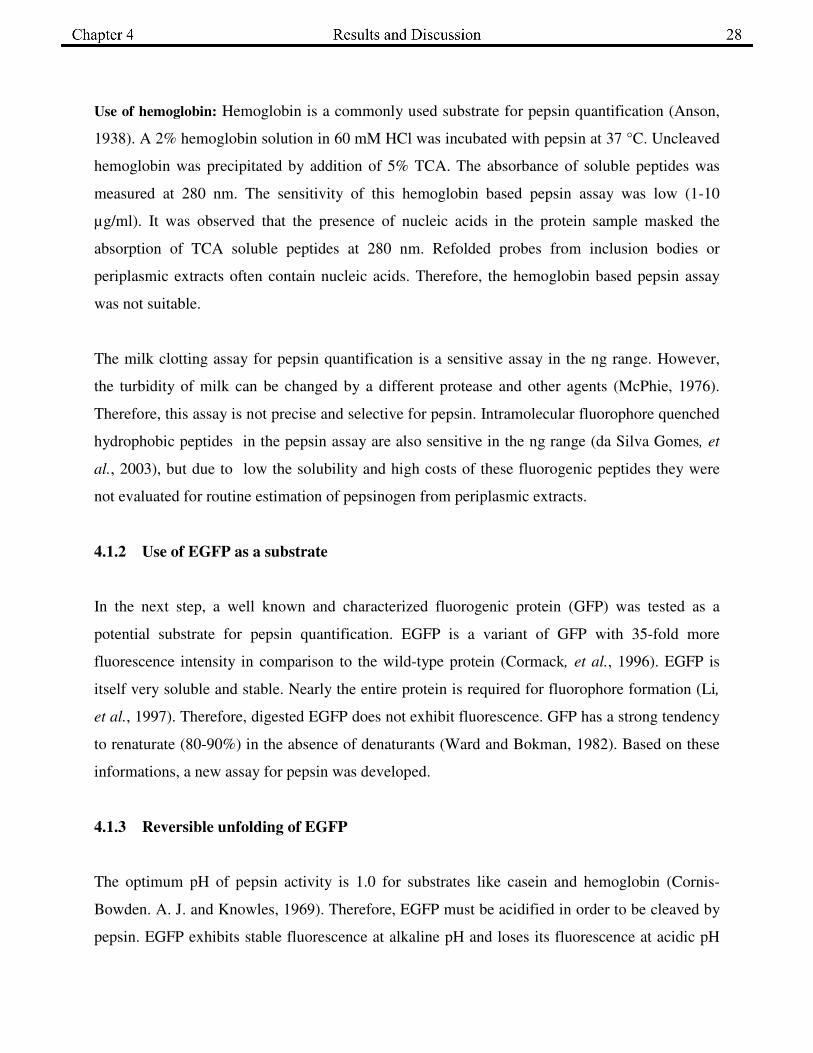
completely regained due to inhibition of pepsin activity. For the standard condition at pH 2.0, 10
min of EGFP digestion at 20 °C was sufficient to generate the standard curve for the
quantification of 0-30 ng pepsin (Fig. 8).
Fig. 8. Standard curve of EGFP proteolysis by pepsin. 11 µg of EGFP was acid denatured at pH 2.0. Next, 0-30 ng pepsin were added and the samples were incubated at 20
°C for 10 min. Remaining intact EGFP molecules were renatured by adding 0.4 M Tris-HCl, pH 8.5 and
measurement of renatured EGFP was determined with excitation at 490 nm and emission at 508 nm.
4.1.5 Kinetics of proteolysis
The specific digestion rates of EGFP (55 µg/ml) was determined using three different
concentrations of pepsin (4.8, 14.3 and 23.8 ng/ml) and activated pepsinogen (4.8, 14.4 and 24.0
ng/ml) in the time-dependent proteolysis. The specific rates of digestion for pepsin (38.2 ± 6.7 ng
EGFP ng-1
pepsin min-1
) and activated pepsinogen (37.2 ± 5.2 ng EGFP ng-1
activated
pepsinogen min-1
) were quite similar (Fig. 3 A-B, chapter 7.1). Substrate-dependent protease
activity showed a typical Michaelis-Menten kinetics (Fig. 4 A-B, chapter 7.1). The apparent Vmax
and Km values for pepsin and activated pepsinogen (Table 1, chapter 7.1) were calculated from
the corresponding double-reciprocal plots (Fig. 4 A-B, chapter 7.1).
Pepsin (ng)
0 10 20 30 40
Flu
ore
scen
ce
0
400
800
1200
1600
________________________________________
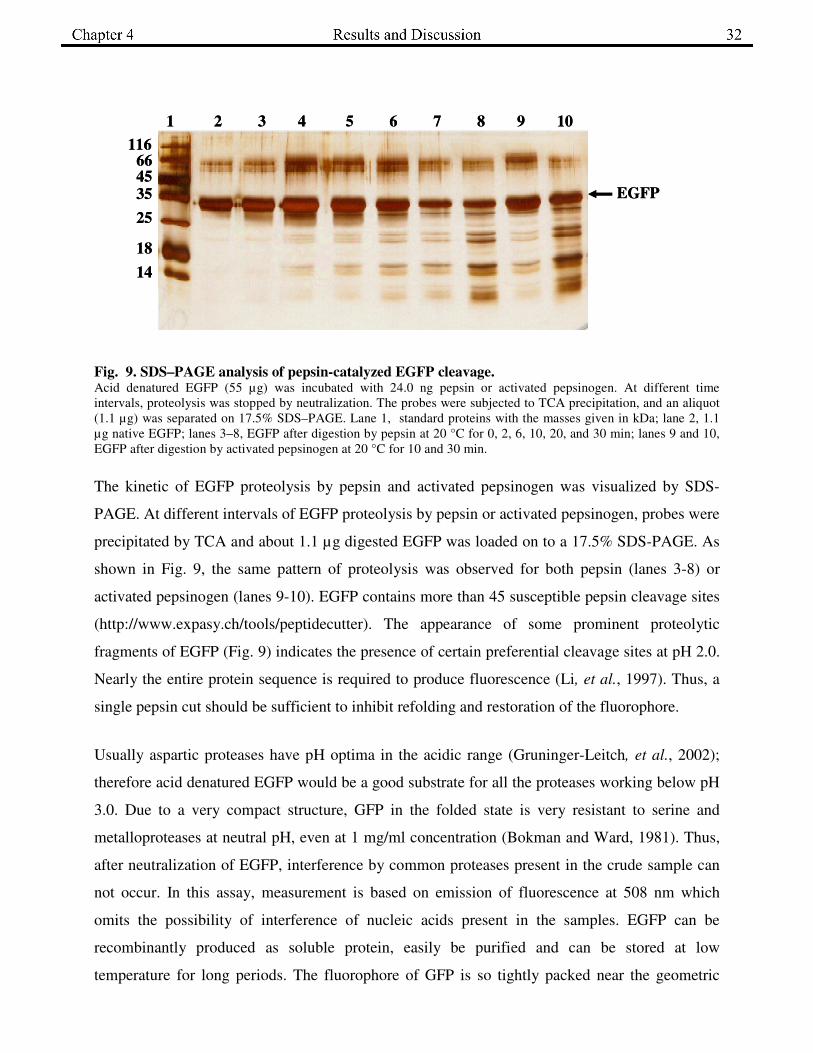
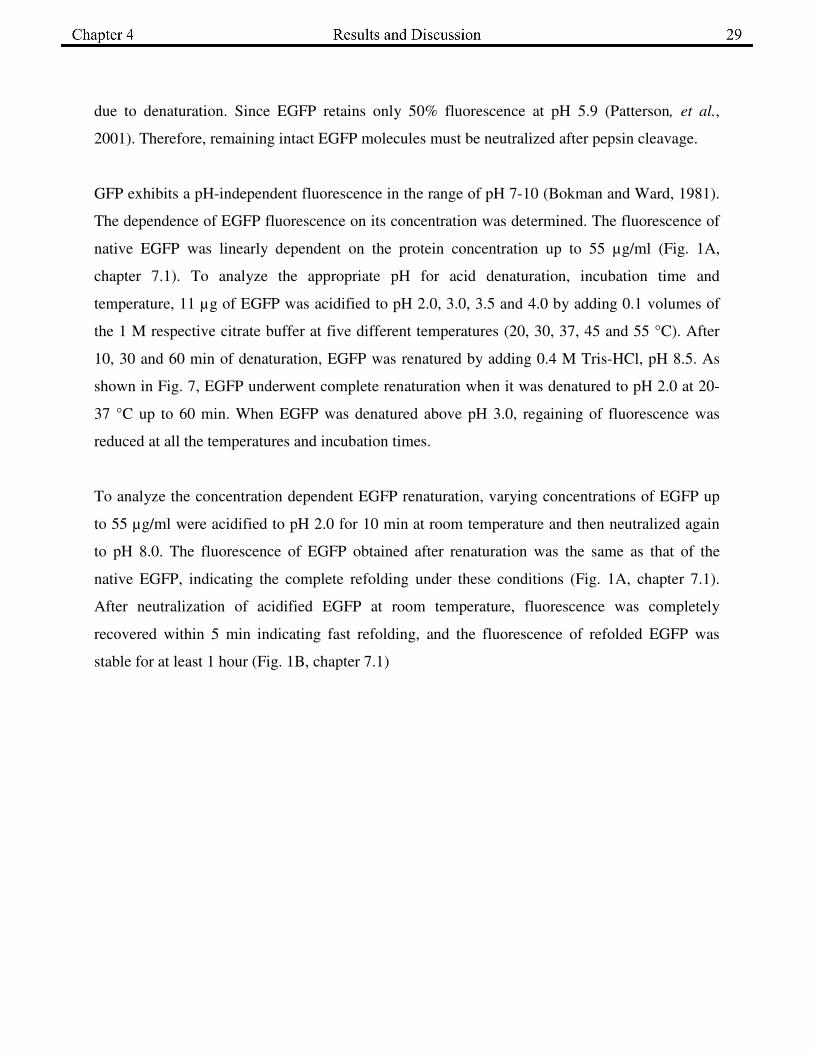
Fig. 9. SDS–PAGE analysis of pepsin-catalyzed EGFP cleavage. Acid denatured EGFP (55 µg) was incubated with 24.0 ng pepsin or activated pepsinogen. At different time
intervals, proteolysis was stopped by neutralization. The probes were subjected to TCA precipitation, and an aliquot
(1.1 µg) was separated on 17.5% SDS–PAGE. Lane 1, standard proteins with the masses given in kDa; lane 2, 1.1
µg native EGFP; lanes 3–8, EGFP after digestion by pepsin at 20 °C for 0, 2, 6, 10, 20, and 30 min; lanes 9 and 10,
EGFP after digestion by activated pepsinogen at 20 °C for 10 and 30 min.
The kinetic of EGFP proteolysis by pepsin and activated pepsinogen was visualized by SDS-
PAGE. At different intervals of EGFP proteolysis by pepsin or activated pepsinogen, probes were
precipitated by TCA and about 1.1 µg digested EGFP was loaded on to a 17.5% SDS-PAGE. As
shown in Fig. 9, the same pattern of proteolysis was observed for both pepsin (lanes 3-8) or
activated pepsinogen (lanes 9-10). EGFP contains more than 45 susceptible pepsin cleavage sites
(http://www.expasy.ch/tools/peptidecutter). The appearance of some prominent proteolytic
fragments of EGFP (Fig. 9) indicates the presence of certain preferential cleavage sites at pH 2.0.
Nearly the entire protein sequence is required to produce fluorescence (Li, et al., 1997). Thus, a
single pepsin cut should be sufficient to inhibit refolding and restoration of the fluorophore.
Usually aspartic proteases have pH optima in the acidic range (Gruninger-Leitch, et al., 2002);
therefore acid denatured EGFP would be a good substrate for all the proteases working below pH
3.0. Due to a very compact structure, GFP in the folded state is very resistant to serine and
metalloproteases at neutral pH, even at 1 mg/ml concentration (Bokman and Ward, 1981). Thus,
after neutralization of EGFP, interference by common proteases present in the crude sample can
not occur. In this assay, measurement is based on emission of fluorescence at 508 nm which
omits the possibility of interference of nucleic acids present in the samples. EGFP can be
recombinantly produced as soluble protein, easily be purified and can be stored at low
temperature for long periods. The fluorophore of GFP is so tightly packed near the geometric
116664535
25
18
14
1 2 3 4 5 6 7 8 9 10
EGFP
116664535
25
18
14
1 2 3 4 5 6 7 8 9 10
EGFP
________________________________________
center of beta-can that classical fluorescence quenching agents such as acrylamide, halides and
molecular oxygen have almost no effect on GFP fluorescence (Rao, et al., 1980). GFP is stable
with a relatively high Tm of 76 °C (Bokman and Ward, 1981, Ward and Bokman, 1982).
All the proteases of E. coli belong to the serine and metalloprotease family (Gottesman, 1996).
Therefore, the EGFP based pepsin assay developed here is selective for the quantification of
recombinant pepsinogen in the periplasmic extracts. This assay was routinely used for the precise
estimation of pepsinogen in the periplasmic fractions of E. coli.
________________________________________
4.2 Periplasmic expression of human pepsinogen
4.2.1 Cloning strategy for periplasmic expression of pepsinogen
To produce pepsinogen in the periplasm of E. coli, various signal sequences from prokaryotic
origin were chosen. pET12a and pET20b vectors (Novagen) contain the ompT and pelB signal
sequence, respectively, upstream of the multiple cloning sites for periplasmic accumulation of
cloned proteins. Human pepsinogen A was amplified from pHQPEX-30-5 (kindly provided by
Dr. R. Bolli, ZLB Bioplasma AG, Switzerland) and unique restriction sites NcoI and SalI were
introduced at 5’ and 3’ ends for cloning in pET20b while SalI site at both ends for cloning in
pET12a vector. The blunt end PCR fragments were cloned into pCR-Blunt II-TOPO (Invitrogen).
The clones were sequenced and digested with respective restriction enzymes and purified by
agarose gel electrophoresis. The fragments were ligated into digested and dephosphorylated
pET12a and pET20b vectors. The clones in pET12a and pET20b were sequenced and abbreviated
as pET-ompT-peps and pET-pelB-peps, respectively. The signal sequence of DsbA was the third
leader peptide for the translocation of pepsinogen to the periplasm. In contrast to other signal
sequences, dsbA facilitates a co-translational export of passenger proteins to the periplasm via
SRP pathway (Schierle, et al., 2003). Therefore, it is suitable for translocation of fast folding
passenger proteins to the periplasm. A synthetic nucleotide sequence encoding the signal
sequence of dsbA was inserted into pET20b, thereby, replacing the signal sequence of pelB by
dsbA. The digested pepsinogen fragment was ligated into pET20b-dsbA and the construct was
named pET-dsbA-peps.
For the expression of pepsinogen under control of trc and araBAD promoters in pTrc99a and
pBAD22 vectors, pepsinogen along with the pelB signal sequence was amplified from pET-pelB-
peps. A hexa-histidine sequence at 3’ end of pepsinogen was introduced by the PCR primer. The
amplified fragment was cloned into pCR-Blunt II-TOPO and digested by EcoRI and SalI.
Subsequently, the pepsinogen fragment was purified by agarose gel electrophoresis and ligated
into EcoRI-SalI digested and dephosphorylated pTrc99a and pBAD22 vectors to give pTrc-pelB-
peps and pBAD-pelB-peps, respectively.
________________________________________
In a new fusion approach for the translocation of pepsinogen to the periplasm of E. coli, the
sequence of ecotin (GenBank M60876) was amplified from E. coli JM83. Three repeats of Gly-
Ser sequence at 3’ end of ecotin were introduced with a unique restriction site for BspE1 by the
3’ primer. The fragment was cloned into pCR-Blunt II-TOPO. Pepsinogen was amplified from
pHQPEX-30-5 and three repeats of Gly-Ser were introduced at 5’ end while the hexa-histidine
sequence was introduced at 3’ end of pepsinogen. The fragment was cloned into pCR-Blunt II-
TOPO. The ecotin fragment was cut with EcoRI-BspEI and pepsinogen fragment was cut with
BspE1-SalI. Both fragments were purified by agarose gel electrophoresis and ligated into EcoRI-
SalI digested and dephosphorylated pTrc99a and pBAD22 to give pTrc-eco-peps (abbreviated as
pEGP1) and pBAD-eco-peps (abbreviated as pB-EGP1), respectively (Fig. 1B, chapter 7.2).
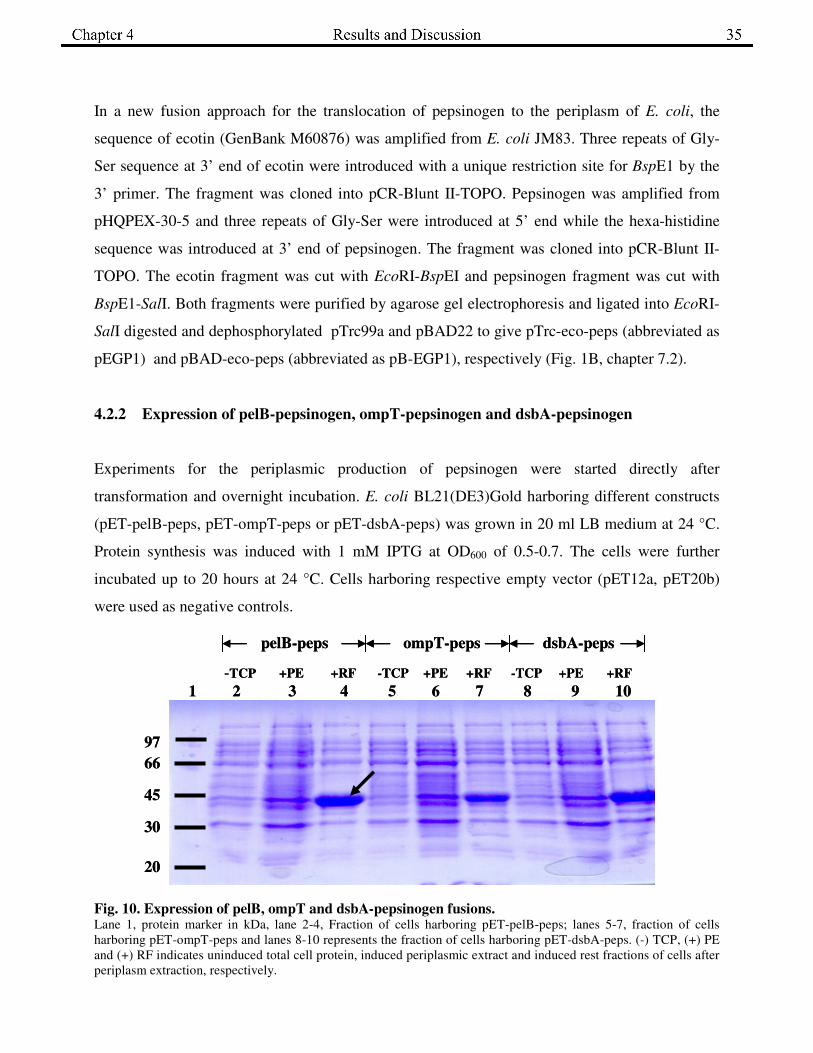
4.2.2 Expression of pelB-pepsinogen, ompT-pepsinogen and dsbA-pepsinogen
Experiments for the periplasmic production of pepsinogen were started directly after
transformation and overnight incubation. E. coli BL21(DE3)Gold harboring different constructs
(pET-pelB-peps, pET-ompT-peps or pET-dsbA-peps) was grown in 20 ml LB medium at 24 °C.
Protein synthesis was induced with 1 mM IPTG at OD600 of 0.5-0.7. The cells were further
incubated up to 20 hours at 24 °C. Cells harboring respective empty vector (pET12a, pET20b)
were used as negative controls.
Fig. 10. Expression of pelB, ompT and dsbA-pepsinogen fusions. Lane 1, protein marker in kDa, lane 2-4, Fraction of cells harboring pET-pelB-peps; lanes 5-7, fraction of cells
harboring pET-ompT-peps and lanes 8-10 represents the fraction of cells harboring pET-dsbA-peps. (-) TCP, (+) PE
and (+) RF indicates uninduced total cell protein, induced periplasmic extract and induced rest fractions of cells after
periplasm extraction, respectively.
1 2 3 4 5 6 7 8 9 10
66
97
45
30
20
dsbA-pepsompT-pepspelB-peps
-TCP +PE +PE +PE +RF+RF+RF -TCP -TCP
1 2 3 4 5 6 7 8 9 10
66
97
45
30
20
dsbA-pepsompT-pepspelB-peps
-TCP +PE +PE +PE +RF+RF+RF -TCP -TCP
________________________________________
† [1-3 Dimethyl Imidazolium Methyl Sulphate and 1-(Hydroxy Ethyl) 3 Methyl Imidazolium Chloride]
Expression of pepsinogen in the periplasm was analyzed 1, 3, 5 and 20 hours after addition of
IPTG. The periplasmic extracts were prepared according to Winter et al (Winter, et al., 2000).
The periplasmic extract and the rest fraction of cells from these cultures were used for
determination of pepsin activity and were analyzed by SDS-PAGE. As shown in Fig. 10, fusion
of pepsinogen with pelB, ompT and dsbA were produced in high amounts but remained in the
rest fraction. After separation of the probe by SDS-PAGE, they were blotted on to a PVDF
membrane and the prominent band (marked with �, Fig. 10) was subjected to N-terminal
sequencing. The band corresponded to the uncleaved pelB signal sequence. In the enzymatic
assay, no pepsin activity was found in all the periplasmic extracts.
To avoid any misfolding or aggregation of translocated pepsinogen in the periplasm, several
classes of folding enhancers were added in the culture medium and the inducer concentration
(0.02-1 mM IPTG) was varied. After induction with 1 mM IPTG at mid-log phase, the following
additives were added in the medium. Redox shuffling compounds (1-5 mM GSH, 1-5 mM GSSG
and 0.01 - 0.1 mM vectrase P), solubilizing agents (0.4 M L-arginine, 5% ionic liquid salts†, 50
mM urea), stabilizing agents (0.1 M proline, 0.1 M sulfobetaine), or detergents (0.1% brij 58P,
0.1% triton X-100) were added individually to the cultures. In another set of experiments, after
induction with 1 mM IPTG, the above mentioned additives were added keeping 1 mM GSH in all
the cultures. Even after such manipulation, no pepsin activity could be determined.
The majority of periplasmic proteins are translocated via the SecB dependent pathway. In this
pathway, proteins are post-translationally translocated and should remain in translocation-
competent state. Hence, SecB dependent pathway is not efficient for fast folding proteins. DsbA
signal sequence facilitates co-translational translocation so that fast folding proteins can be
translocated via this pathway. However, pepsin activity could not be obtained in the periplasmic
fraction even after using the dsbA signal sequence.
These data indicated two possible explanations. First, due to the strong T7 promoter, the
translocation machinery was not able to support the high frequency of transcription and
translation therefore pepsinogen along with signal sequences accumulated in the cytosol.
Secondly, pepsinogen was translocated to the inner membrane but either due to improper activity
________________________________________
of signal peptidase I or due to some peculiar property of pepsinogen, prevented it from crossing
the negatively charged inner membrane barrier.
To exclude the problem associated with the strong T7 promoter, E. coli BL21(DE3)Gold
harboring pTrc-pelB-peps and pBAD-pelB-peps plasmids were analyzed. Next, they were grown
at 37 °C in 20 ml LB medium until mid-log phase. For the induction of protein synthesis, 1 mM
IPTG was used for the trc promoter and 0.02% L-arabinose was used for the araBAD promoter.
Cells harboring pTrc99a and pBAD22 vectors were used as a negative control. After induction
with 1 mM IPTG and at 24 °C for 4 hours, nearly 16 µg pepsin per liter OD1 culture was
obtained for cells harboring pTrc-pelB-peps. After addition of 5 µM pepstatin A, which is
specific potent inhibitor of pepsin, the protease activity in the periplasmic fraction was abolished.
No proteolytic activity was observed in the negative control. Different strains, BL21, JM109,
C600 were used; varied inducer concentrations, 0.01-1 mM IPTG; media, LB and M9; pre-
induction OD600 (0.2-1); and post-induction incubation times (3-5 hours) were employed but
production of pepsinogen using the pelB signal sequence under control of the trc promoter was
not reproducible. When pelB-pepsinogen was produced under control of the araBAD promoter,
no significant pepsin activity was obtained in the periplasmic fraction probably due to a poor
expression level.
4.2.3 Expression of pepsinogen upon fusion to E. coli ecotin
To analyze whether for the failure to obtain native pepsinogen in the periplasm, was associated
with the processing of signal peptides or interference of the mature part of pepsinogen in the
translocation. A periplasmic production of pepsinogen with the full-length ecotin was performed.
For the expression of ecotin-pepsinogen, pEGP1 and pB-EGP1 plasmids were transformed in E.
coli BL21(DE3)Gold. In the control experiment, E. coli BL21(DE3)Gold harboring pTrc99a and
pBAD22 plasmids were grown and induced under identical conditions. To produce ecotin-
pepsinogen under control of the trc promoter, 1 mM IPTG was used while the production under
control of araBAD promoter was done in the presence of 0.02% L-arabinose at OD600 0.5-0.8.
The cells were incubated at 24 °C for 3.5 hours. Pepsin activity was analyzed in the periplasmic
fractions using EGFP as a substrate (Chapter 7.2). The pepsin activity in the periplasmic fractions
________________________________________
of cells containing pEGP1 and pB-EGP1 plasmids corresponded to 100 and 8 µg ecotin-
pepsinogen per liter OD1, respectively.
As stated earlier, even the protein itself is recognized by translocation machinery (Flower, et al.,
1994). The presence of basic residues in the first 18 residues of a mature protein severely affects
the translocation across the cytoplasmic membrane in E. coli (Kajava, et al., 2000). After fusion
to ecotin this bottleneck of translocation could be overcome. After fusion to ecotin, pepsinogen
was reproducibly produced in all the experiments. Due to the higher yield obtained with pEGP1,
this plasmid was used for large scale expression, purification and characterization of the ecotin-
pepsinogen fusion protein.
4.2.4 Large scale expression and purification of ecotin-pepsinogen
E. coli BL21(DE3)Gold harboring pEGP1 was grown in a fermentor in fed batch mode using a
yeast extract enriched medium (Chapter 7.2). After induction with 1 mM IPTG at OD600 18.7, the
cells were grown for 5 h at 24 °C and were harvested at a final OD600 of 45 (605 g wet biomass
from 9.5 L culture). The biomass was stored in aliquots at -80 °C.
As mentioned earlier, at the shake flask level, the expression of ecotin-pepsinogen was about 100
µg per liter OD1. Therefore, to purify ecotin-pepsinogen in mg quantity, large volumes of
periplasmic extracts were required as a first step of purification. The periplasmic extract from 30
g biomass was prepared according to a protocol designed for frozen biomass (Rathore, et al.,
2003) but was additionally supplemented with 1 mM GSH and GSSG as redox shuffling agents
(Malik, et al., 2006). To reduce the viscosity of the extract, 6 µl benzonase and 6 mM MgCl2
were added. To enrich His-tagged ecotin-pepsinogen from the periplasmic extract, a procedure
was established using 40 ml Ni-NTA resin for 360 ml of periplasmic extract. Washing and
elution was done in batch mode (Fig. 2, chapter 7.2). After Ni-NTA enrichment, 54.8% fusion
protein (4.8 mg from 8.9 mg) was recovered. In the next step, anion exchange chromatography
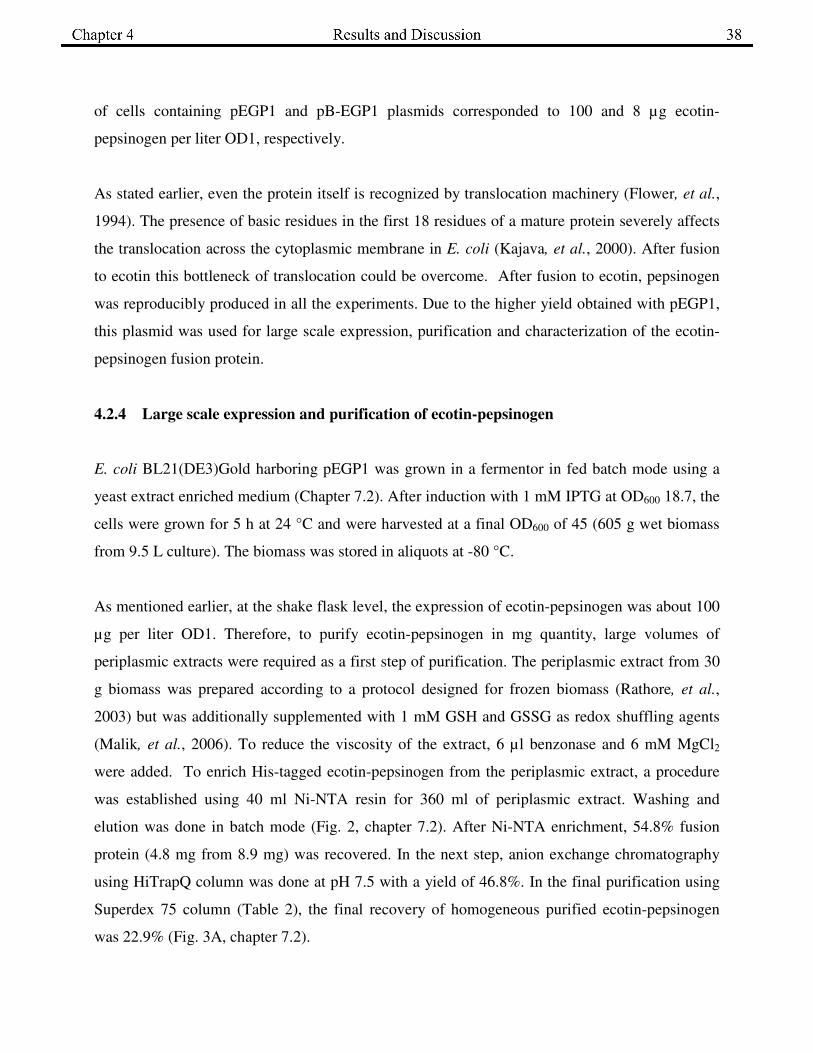
using HiTrapQ column was done at pH 7.5 with a yield of 46.8%. In the final purification using
Superdex 75 column (Table 2), the final recovery of homogeneous purified ecotin-pepsinogen
was 22.9% (Fig. 3A, chapter 7.2).
________________________________________
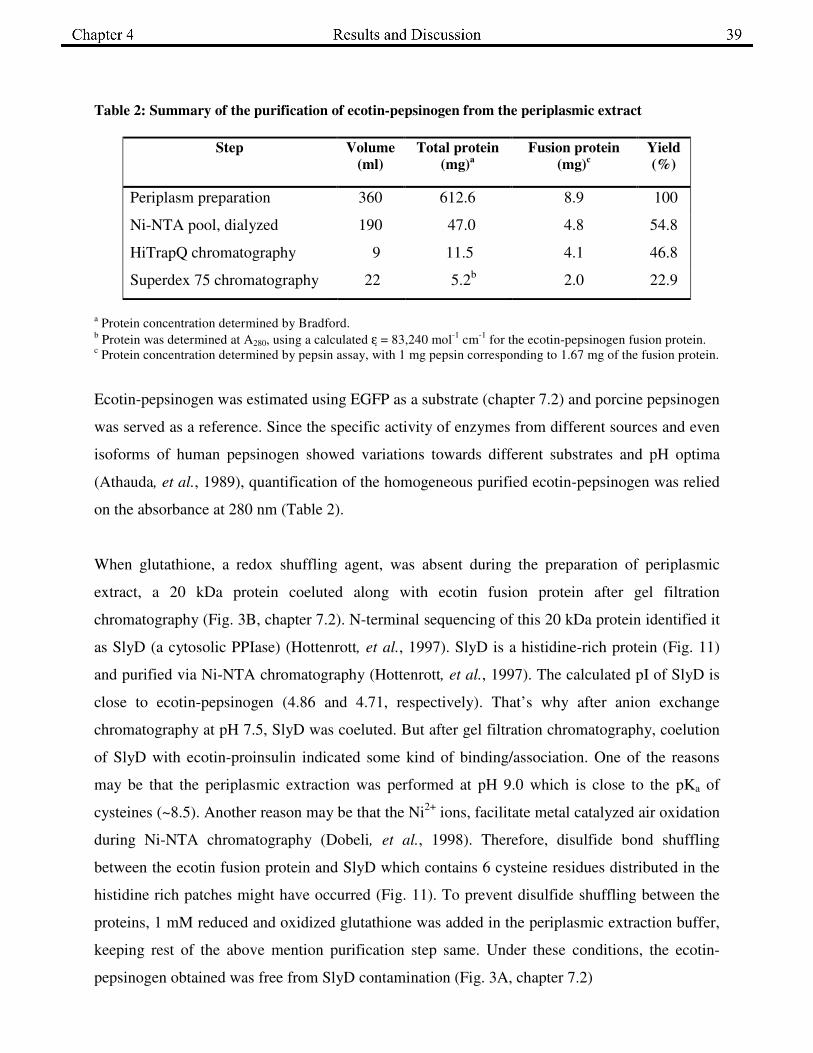
Table 2: Summary of the purification of ecotin-pepsinogen from the periplasmic extract
Step
Volume
(ml)
Total protein
(mg)a
Fusion protein
(mg)c
Yield
(%)
Periplasm preparation 360 612.6 8.9 100
Ni-NTA pool, dialyzed 190 47.0 4.8 54.8
HiTrapQ chromatography 9 11.5 4.1 46.8
Superdex 75 chromatography 22 5.2b 2.0 22.9
a Protein concentration determined by Bradford.
b Protein was determined at A280, using a calculated ε = 83,240 mol
-1 cm
-1 for the ecotin-pepsinogen fusion protein.
c Protein concentration determined by pepsin assay, with 1 mg pepsin corresponding to 1.67 mg of the fusion protein.
Ecotin-pepsinogen was estimated using EGFP as a substrate (chapter 7.2) and porcine pepsinogen
was served as a reference. Since the specific activity of enzymes from different sources and even
isoforms of human pepsinogen showed variations towards different substrates and pH optima
(Athauda, et al., 1989), quantification of the homogeneous purified ecotin-pepsinogen was relied
on the absorbance at 280 nm (Table 2).
When glutathione, a redox shuffling agent, was absent during the preparation of periplasmic
extract, a 20 kDa protein coeluted along with ecotin fusion protein after gel filtration
chromatography (Fig. 3B, chapter 7.2). N-terminal sequencing of this 20 kDa protein identified it
as SlyD (a cytosolic PPIase) (Hottenrott, et al., 1997). SlyD is a histidine-rich protein (Fig. 11)
and purified via Ni-NTA chromatography (Hottenrott, et al., 1997). The calculated pI of SlyD is
close to ecotin-pepsinogen (4.86 and 4.71, respectively). That’s why after anion exchange
chromatography at pH 7.5, SlyD was coeluted. But after gel filtration chromatography, coelution
of SlyD with ecotin-proinsulin indicated some kind of binding/association. One of the reasons
may be that the periplasmic extraction was performed at pH 9.0 which is close to the pKa of
cysteines (~8.5). Another reason may be that the Ni2+
ions, facilitate metal catalyzed air oxidation
during Ni-NTA chromatography (Dobeli, et al., 1998). Therefore, disulfide bond shuffling
between the ecotin fusion protein and SlyD which contains 6 cysteine residues distributed in the
histidine rich patches might have occurred (Fig. 11). To prevent disulfide shuffling between the
proteins, 1 mM reduced and oxidized glutathione was added in the periplasmic extraction buffer,
keeping rest of the above mention purification step same. Under these conditions, the ecotin-
pepsinogen obtained was free from SlyD contamination (Fig. 3A, chapter 7.2)
________________________________________
MK VAKDLVVS LAYQVRTEDG VLVDE S PVSA PLDYLHGHGS LI SG LE TALE
GH EVGD KFDV AVGA NDAYGQ YDENLV QRVP KDVFMGVDEL QVGMRFLAET
DQ GP V P VE IT AVEDDHVVVD GNHMLAGQNL KFNVEV VAIR EATEEELAHG
HVHGAHDHHH DHDHDGCCGG HGHDHGHEHG GEGCCGGKGN GGCGCH
Fig. 11. Primary sequence of SlyD (GenPept AAC41458) The C-terminal part of SlyD is rich in histidine and cysteine residues and therefore binds tightly to divalent cations.
4.2.5 Characterization of ecotin-pepsinogen
The purified ecotin-pepsinogen was subjected to N-terminal sequencing which confirmed a
proper cleavage of the ecotin signal sequence. Next, the purity and homogeneity of purified
ecotin-pepsinogen was analyzed by RP-HPLC in the presence of 5 µM pepstatin, to prevent its
autoactivation on a C4 column at low pH. When pepstatin was added, a single peak of ecotin-
pepsinogen was obtained with a mass of 57,896 Da as determined by MALDI-TOF. The
calculated reduced mass of ecotin-pepsinogen is 57,902 Da. After gel filtration chromatography
using Superdex 200 column (Fig. 4, chapter 7.2), the apparent mass of ecotin-pepsinogen fusion
protein was 136,000 Da, which corresponds to the calculated mass of the ecotin fusion protein in
the dimeric state (115,804 Da).
The native folding of pepsinogen in the ecotin fusion state was evaluated by determination of the
enzymatic activity of pepsin. Ecotin-pepsinogen was acidified at pH 2.0 for autoactivation of
pepsinogen. Acidification of ecotin-pepsinogen leads to a fast activation (Fig. 5, chapter 7.2).
Within 30 seconds of acidification, the full length ecotin-pepsinogen was converted into
intermediate forms and a compact single band of pepsin appeared within 8 min of incubation.
Human pepsinogen undergoes a sequential pathway upon acidification where the prosegment is
removed in two steps (Athauda, et al., 1989, Foltmann, 1988), via both uni- and bi-molecular
mechanisms (Bustin and Conwayja.A, 1971, Marciniszyn, et al., 1976). Ecotin is a very stable
protein but also a good substrate for pepsin at low pH (Chung, et al., 1983). Ecotin has 22 pepsin
cleavage sites at pH >2.0. (http://www.expasy.ch/tools/peptidecutter/). As soon as pepsin appears
in the acidified solution of ecotin-pepsinogen, it digests ecotin completely (Fig. 5, chapter 7.2)
into very small fragments.
________________________________________
4.2.6 Future prospects of the ecotin fusion system
In future work, the production of ecotin-pepsinogen in the periplasmic space might be increased
significantly if fermentation conditions, use of additives in the medium, periplasmic extraction
conditions and purification are optimized. The properties of ecotin make it a promising
periplasmic fusion tag. It is a relatively small size protein (16 kDa subunit), highly stable
(withstands 100 °C and pH 1.0 for 30 min) and contains 1 disulfide bond in each subunit (Chung,
et al., 1983). Therefore, it undergoes a pathway of oxidative folding. Ecotin is made for the
defence of E. coli against trypsin like serine proteases in the digestive tract and neutrphil elastase
like serine proteases in the blood. No metabolic role or interaction of ecotin with other E. coli
proteins was observed (Eggers, et al., 2004). Ecotin is a dimeric protein and both C-termini
protrude in opposite directions (Fig. 1A, chapter 7.2) which allow folding of passenger proteins at
each end. Being a broad range serine protease inhibitor, affinity property of ecotin derivatives
might be used for the purification. Protease binding sites of ecotin were already randomized
(Stoop and Craik, 2003) to reduce the affinity to zymogens of serine proteases, which would help
to elute proteins under mild conditions. Ecotin fusion protein can be quantified in a very sensitive
trypsin inhibition assays (Kang, et al., 2005). Ecotin is even stable and active in the cytosol; it
can be used as cytoplasmic fusion tag (Kang, et al., 2005 197). Ecotin can also be produced in
monomeric native state after removal of the last 10 residues (Pal, et al., 1996).
Pepsinogen contains 13 basic residues (Sogawa, et al., 1983) and in general aspartic proteases
contain 5-16 basic residues in the prosegment (Richter, et al., 1998). Therefore, ecotin fusion to
different aspartic proteases or other proteins rich in basic residues in the first 18 residues would
improve translocation across cell membrane.
________________________________________
4.3 Periplasmic expression of human proinsulin with ecotin fusion
Is ecotin a suitable fusion tag for other classes of proteins? To address this important question,
another protein, proinsulin, having three nonlinear disulfide bonds was chosen. It is different in
size, folds and properties from pepsinogen. Since a self-cleavage of the fusion protein as with
ecotin-pepsinogen does not occur for ecotin-proinsulin, an internal specific cleavage site and a
histidine tag were inserted in the linker region of ecotin-proinsulin.
4.3.1 Cloning of ecotin-proinsulin
An ecotin-proinsulin fusion protein was designed to be expressed under control of the trc
promoter in pTrc99a as shown in Fig. 1, chapter 7.3. Plasmid pTrc-EGP1 (Malik, et al., 2006)
was the source of ecotin gene and was transformed into E. coli GM2163 (dam─ and dcm
─) strain.
It was isolated and digested by BspEI, a methyl sensitive restriction enzyme, and SalI. The
digested vector contained the full-length ecotin plus three repeats of Gly-Ser (GS)3 at the 3’ end.
The digested vector was dephosphorylated and purified by agarose gel electrophoresis. Proinsulin
was amplified from pET20b-proinsulin (Schaffner, et al., 2001). A long forward primer was
designed to introduce three Gly-Ser repeats (GS)3, a thrombin cleavage site (LVPRGS), a hexa-
histidine tag (H)6 and an arginine (R) residue just before the start of proinsulin with a unique
cleavage site for BspEI. The reverse primer contained unique site for SalI. The amplified
proinsulin fragment was cloned into pCR-Blunt II-TOPO. After sequencing, this plasmid was
transformed into E. coli GM2163 cells and was digested with BspEI and SalI. The purified
proinsulin insert was ligated into above mentioned vector. The resulting plasmid encoded ecotin
followed by (GS)6-LVPRGS-(H)6-R and proinsulin (abbreviated as pEG-PI).
4.3.2 Expression, purification and characterization of ecotin-proinsulin
To purify and characterize the ecotin-proinsulin fusion protein, biomass of E. coli
BL21(DE3)Gold expressing ecotin-proinsulin was prepared according to (Malik, et al., 2006).
Fermentation was done in fed batch mode. When glucose was depleted, feeding (30% yeast
extract and 25% glycerol) was started and the temperature was lowered from 37 to 24 °C. After 1
hour of feeding, protein production was started at an OD600 of 31 by adding 1 mM IPTG. Cells
________________________________________
were harvested after 4 hours of incubation at OD600 of 59. A biomass of 909 g was obtained from
9.5 L culture and was stored in aliquots at -80 °C.
Periplasmic extract was prepared from the frozen biomass by osmotic shock according to (Malik,
et al., 2006). Activity of proinsulin was measured in a sandwich ELISA using monoclonal
antibodies recognizing native folds of insulin and proinsulin (Winter, et al., 2000). The yield of
native ecotin-proinsulin in the periplasmic extract was about 2.0 µg per liter OD1. It is known
that ecotin is acid stable (Chung, et al., 1983) and insulin can be stabilized by acidification
(Bryant, et al., 1993). Therefore, the periplasmic extract was acidified and neutralized in order to
precipitate acid labile proteins as a first purification step. To precipitate acid-labile proteins, 100
mM citric acid was added into the periplasmic extract for 10 min at room temperature. The
precipitate was removed by centrifugation, followed by neutralization by adding 225 mM NaOH
and 75 mM Tris-HCl, pH 8.5. The acidified and neutralized periplasmic extract was dialyzed
against 50 mM Tris, 300 mM NaCl at pH 8.0 for Ni-NTA chromatography. The debris was
removed by centrifugation at 90,000g for 30 min and the supernatant was filtered through a 0.2
µm filter. After the acid-treatment and neutralization of periplasmic extract, proinsulin
corresponding to 0.23 µg of ecotin-proinsulin/ml extract was found. If an aliquot of the same
extract without acid treatment was stored at 4 °C for 24 hours, no proinsulin was left, indicating
proteolytic decay (data not shown).
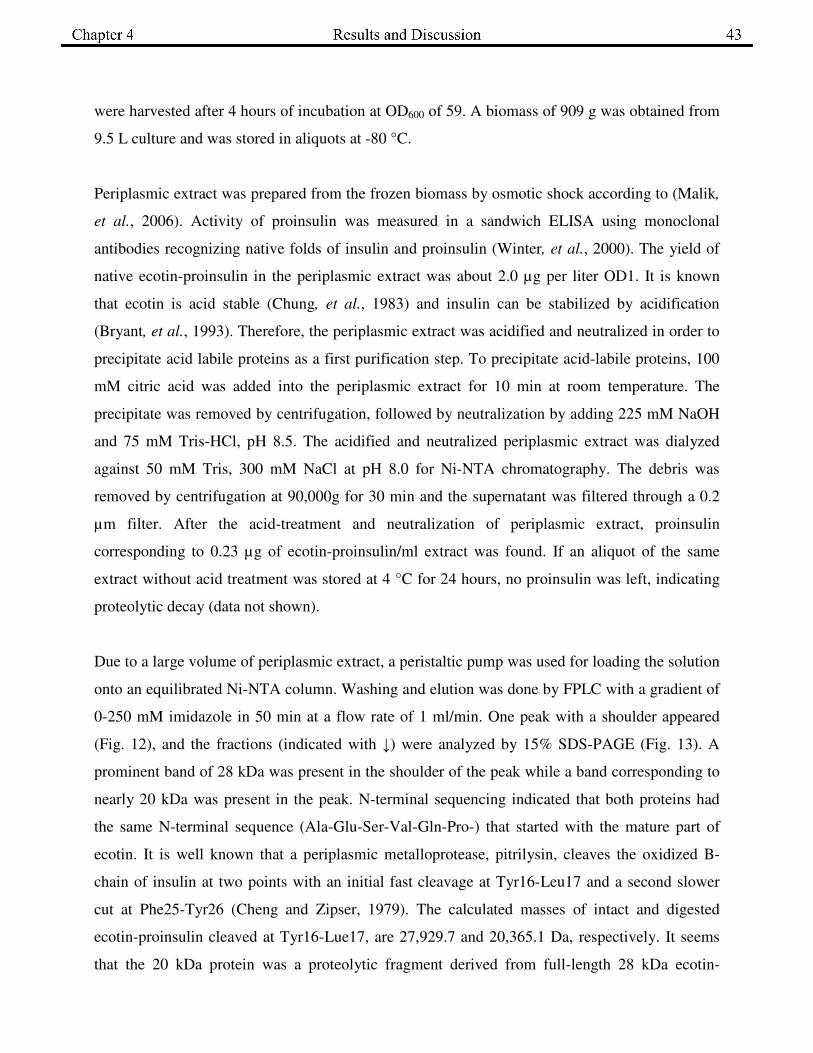
Due to a large volume of periplasmic extract, a peristaltic pump was used for loading the solution
onto an equilibrated Ni-NTA column. Washing and elution was done by FPLC with a gradient of
0-250 mM imidazole in 50 min at a flow rate of 1 ml/min. One peak with a shoulder appeared
(Fig. 12), and the fractions (indicated with ↓) were analyzed by 15% SDS-PAGE (Fig. 13). A
prominent band of 28 kDa was present in the shoulder of the peak while a band corresponding to
nearly 20 kDa was present in the peak. N-terminal sequencing indicated that both proteins had
the same N-terminal sequence (Ala-Glu-Ser-Val-Gln-Pro-) that started with the mature part of
ecotin. It is well known that a periplasmic metalloprotease, pitrilysin, cleaves the oxidized B-
chain of insulin at two points with an initial fast cleavage at Tyr16-Leu17 and a second slower
cut at Phe25-Tyr26 (Cheng and Zipser, 1979). The calculated masses of intact and digested
ecotin-proinsulin cleaved at Tyr16-Lue17, are 27,929.7 and 20,365.1 Da, respectively. It seems
that the 20 kDa protein was a proteolytic fragment derived from full-length 28 kDa ecotin-
________________________________________
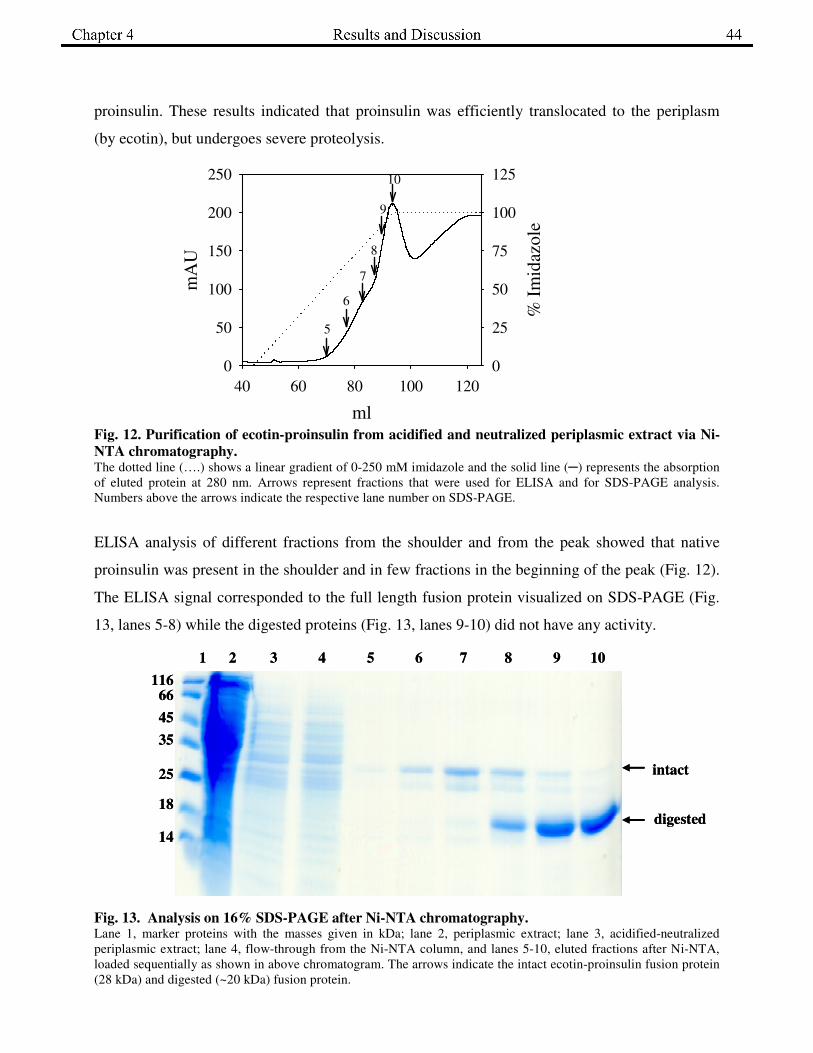
proinsulin. These results indicated that proinsulin was efficiently translocated to the periplasm
(by ecotin), but undergoes severe proteolysis.
Fig. 12. Purification of ecotin-proinsulin from acidified and neutralized periplasmic extract via Ni-
NTA chromatography. The dotted line (….) shows a linear gradient of 0-250 mM imidazole and the solid line (─) represents the absorption
of eluted protein at 280 nm. Arrows represent fractions that were used for ELISA and for SDS-PAGE analysis.
Numbers above the arrows indicate the respective lane number on SDS-PAGE.
ELISA analysis of different fractions from the shoulder and from the peak showed that native
proinsulin was present in the shoulder and in few fractions in the beginning of the peak (Fig. 12).
The ELISA signal corresponded to the full length fusion protein visualized on SDS-PAGE (Fig.
13, lanes 5-8) while the digested proteins (Fig. 13, lanes 9-10) did not have any activity.
Fig. 13. Analysis on 16% SDS-PAGE after Ni-NTA chromatography. Lane 1, marker proteins with the masses given in kDa; lane 2, periplasmic extract; lane 3, acidified-neutralized
periplasmic extract; lane 4, flow-through from the Ni-NTA column, and lanes 5-10, eluted fractions after Ni-NTA,
loaded sequentially as shown in above chromatogram. The arrows indicate the intact ecotin-proinsulin fusion protein
(28 kDa) and digested (~20 kDa) fusion protein.
ml
40 60 80 100 120
mA
U
0
50
100
150
200
250
% I
mid
azole
0
25
50
75
100
125
5
6
7
8
9
10
18
25
35
45
66116
14
1 2 3 4 5 6 7 8 9 10
digested
intact
18
25
35
45
66116
14
1 2 3 4 5 6 7 8 9 10
digested
intact
________________________________________
To further characterize the proinsulin, fractions from the Ni-NTA column showing proinsulin
activity (Fig. 12) were pooled and digested with 0.75 mg thrombin at room temperature to
separate proinsulin from the ecotin fusion. Ecotin is a broad range serine protease inhibitor but it
inhibits thrombin activity by only 2% (Seymour, et al., 1994). Ecotin is a homodimer (Chung, et
al., 1983) and the ecotin fusion protein is also dimeric (Malik, et al., 2006). After thrombin
digestion of ecotin-proinsulin, the signal obtained in the sandwich ELISA was doubled due to a
monomerization of proinsulin from the dimeric ecotin-proinsulin fusion (data not shown).
Thrombin digested ecotin-proinsulin probes were subjected to RP-HPLC using a Nucleosil C18
column (Macherey-Nagel, Germany) (Winter, et al., 2002). Two peaks were obtained after RP-
HPLC (data not shown). Masses of 10,520.1 and 10,517.8 Da were determined for the major and
minor peak, respectively by MALDI-TOF (REFLEX II; Bruker Daltonik GmbH, Bremen,
Germany). The calculated value of the reduced His-tagged proinsulin is 10,517.8 Da
(http://www.expasy.ch/cgi-bin/protparam). The difference might be explained by deamidation
reaction which leads to increase in weight, 1 Da per deamidation. It is well known that under
prolonged exposure to acidic pH, insulin undergoes deamidation (Brange, et al., 1992) at
positions Asn A21, Asn B3 and Gln B4 (Nilsson and Dobson, 2003). It seems that purified
proinsulin was in the reduced and deamidated state, because the periplasm was extracted using a
the protocol for frozen biomass at pH 9.0 (Rathore, et al., 2003) in the presence of 1 mM redox
shuffling agents (Malik, et al., 2006). Therefore, to improve the yield and quality, and to avoid
proteolysis of proinsulin, parameters were optimized for expression in high cell density
fermentation, and the periplasm was extracted directly from fresh biomass at pH 8.0 (Winter, et
al., 2000) in the absence of redox-shuffling agents.
4.3.3 Optimization of ecotin-proinsulin expression
To increase the yield of ecotin-proinsulin, primary cultivation parameters such as inducer
concentrations, antibiotic concentrations, post-induction incubation temperature and time were
optimized. E. coli BL21(DE3)Gold harboring pEG-PI was grown in parallel fermentation vessels
(Infors, Switzerland) in M9 medium (Jenzsch, et al., 2006) at 37 °C containing 100 mg/L
ampicillin. To optimize post-induction temperature and incubation time, after induction with 1
mM IPTG, the temperature was lowered to 35, 30, 25, and 20 °C, respectively and samples at
________________________________________
every hour were taken to extract the periplasmic content (Winter, et al., 2000). As shown in Fig.
2A in chapter 7.3, 25-30 °C and 2-4 hours of incubation were the best post-induction temperature
and time. To analyze the influence of the inducer on the yield of ecotin-proinsulin, 4 different
concentrations of IPTG (0.05, 0.1, 0.5, and 1 mM) were added in parallel vessels and the
temperature was lowered from 37 °C to 25 °C. The yield of ecotin-proinsulin was not much
influenced by the inducer (Fig. 2B, chapter 7.3). To analyze the plasmid stability, 4 different
concentration of ampicillin in combination with its acid stable analogue carbenicillin were tested.
The effect of the antibiotic concentration on the yield of ecotin-proinsulin was negligible (Fig.
2C, chapter 7.3).
Next, high cell density fed batch fermentations were performed in a BBI Sartorius System’s
BIOSTAT®
C 15-L- bioreactor with 8 L working volume. The batch process was started using
the synthetic M9 or a semisynthetic (M9 + 1.5% peptone) medium. After depletion of glucose
below 2 g/L, feeding (40% glucose solution) was started with a fixed exponential profile to
obtain a specific biomass growth rate of 0.5/h. The protein production was induced with 1 mM
IPTG once the cell density reached to a certain value, and the cultivation temperature was
lowered to 25 °C. The exponential profile of the feeding rate was reduced to follow a specific
biomass growth rate of 0.1/h.
Cultivation parameter and the yield obtained from the high cell density fermentations are
summarized in table 1, chapter 7.3. The first fermentation was done using M9 medium and the
protein synthesis was induced with 1 mM IPTG at a moderate optical density of 66. The culture
was further grown for 3 hours at 25 °C. The volumetric yield of ecotin-proinsulin was 55 mg/L
that corresponds to 18.5 mg of proinsulin per liter fermentation broth. In the next experiment, all
the parameters were kept similar except that induction was done at a higher optical density of
158. Both, the specific and the volumetric yield of ecotin-proinsulin were reduced from 677 to
157 µg per liter OD1 and 55 to 27 mg/L, respectively.
The host strain used for expression contains the relA gene which produces ppGpp synthetase I
during amino acid starvation (Jishage, et al., 2002, Joseleau-Petit, et al., 1999). RNA polymerase
is a target for ppGpp, which plays a key role in the initiation of replication of several replicons.
This stringent response is extremely important in plasmid replication (Barker, et al., 2001). Most
of the ColE1-like plasmids are unable to replicate efficiently in a relA+ host during starvation for
________________________________________
different amino acids (Wrobel and Wegrzyn, 1998). Therefore, in the next fermentation
experiment 1.5% peptone was added in M9 medium. After induction at high optical density of
161, the yield of fusion protein was strongly increased. The specific yield of ecotin-proinsulin
increased nearly 6 fold from 157 to 908 µg per liter OD1 with a volumetric yield of 153 mg/L
fermentation broth as compared to induction at similar optical density using only M9 medium.
This experiment was repeated keeping all parameters constant. Now, the specific and volumetric
yield of ecotin-proinsulin was 614 µg per liter OD1 and 111 mg/L, respectively.
4.3.4 Extraction of ecotin-proinsulin at large scale
To avoid cell lysis and reduce the release of cytosolic proteins including proteases in the
periplasmic extract, fresh biomass immediately after completion of fed batch fermentation in
semisynthetic M9 medium was used for the extraction of the periplasmic fraction. The osmotic
shock procedure of Winter et al (Winter, et al., 2000) was modified to scale up from milliliter to
liter scale. The recovery of ecotin-proinsulin at liter scale was about 63% as compared to
milliliter scale using the same biomass (70 mg and 111 mg per liter broth, respectively). The
debris was removed by centrifugation and the supernatant was filtered through 0.2 µm filter. The
periplasmic fraction was stored at -80 °C.
4.3.5 Affinity purification of ecotin-proinsulin
Due to a strong affinity of ecotin for trypsin as well as trypsinogen (Lengyel, et al., 1998), 45 mg
trypsinogen was coupled onto 5 ml NHS-activated Sepharose in a HiTrap HP column to capture
ecotin-proinsulin from periplasmic extract. Periplasmic fraction, 250 ml, was loaded onto the
column using a peristaltic pump at 4 °C. Bound protein was eluted by applying 50 mM HCl using
a FPLC system and the fractions obtained were immediately neutralized by directly eluting in
tubes containing 0.1 volume of 1 M Tris-HCl, pH 8.5. A sharp, symmetrical peak was obtained
(Fig. 3A, chapter 7.3). The purity of eluted protein was analyzed on SDS-PAGE. A full-length
ecotin-proinsulin (28 kDa) along with two smaller proteins (16 and 18 kDa) was eluted (Fig. 4A,
lane 4, chapter 7.3). In the ELISA, eluted protein showed the presence of native proinsulin. After
addition of thrombin in the pooled fractions of the peak, the proinsulin part was separated from
the fusion protein, and the 28 kDa protein band was converted into the 10 kDa GS-(H)6-R-
proinsulin and the 18 kDa ecotin derivative (Fig. 4A, lane 5, chapter 7.3).
________________________________________
In the next step, the thrombin digested mixture was loaded onto a HisTrap FF column to separate
GS-(H)6-R-proinsulin from the remaining proteins (Fig. 3B, chapter 7.3). Wild-type endogenous
ecotin and recombinant ecotin derivative were present in the flow through (Fig. 4A, lane 6,
chapter 7.3). Two peaks eluted from the HisTrap column with a linear gradient of 0-300 mM
imidazole (Fig. 3B, chapter 7.3). For the presence of proinsulin, both peaks were tested by
ELISA. The proinsulin activity was nearly 10 fold less in the first peak as compared to the second
peak (Table 2, chapter 7.3). For SDS-PAGE analysis, the protein from both peaks was 10 fold
concentrated by TCA precipitation. In the first peak, no protein band was visible, while a single
protein band was present in the second peak (Fig. 4B, lane 2-3, chapter 7.3). The molar extinction
coefficient of ecotin-proinsulin dimer is quite high (ε = 58,760 mol-1
cm-1
) as compared to
proinsulin (ε = 6,335 mol-1
cm-1
) (Pace, et al., 1995). This might explain the relatively high
absorption of thrombin undigested ecotin-proinsulin in the first peak after Ni-NTA and sharp
elution due to presence of internal histidine-tag which might cause steric hindrance, while the
absorption of second peak was low that contains GS-(H)6-R-proinsulin and eluted broadly due to
presence of terminal histidine-tag (Fig. 3B, chapter 7.3).
Affinity purification of ecotin-proinsulin is summarized in table 2, chapter 7.3. In the first step of
purification, 250 ml of periplasmic extract from 4.5 g wet biomass containing 388 µg proinsulin
was loaded on 45 mg immobilized trypsinogen column. Nearly 48% ecotin-proinsulin was
captured. When the flow through of the trypsinogen column was passed second time to capture
the rest of ecotin-proinsulin, no ecotin-proinsulin was eluted, indicating loss of ~52% proinsulin
during the first passage through the trypsinogen column. In the next step, GS-(H)6-R-proinsulin
was purified from the thrombin digested mixture of ecotin-proinsulin on Ni-NTA
chromatography with a yield of 43%. By these two steps, proinsulin was purified to homogeneity.
Actually, a commercial preparation of trypsinogen (Sigma) was immobilized directly without
further purification. It might contain trypsin in small amounts. When thrombin-cleaved ecotin-
proinsulin was passed through trypsinogen column to separate GS-(H)6-R-proinsulin from the
ecotin part, protein with a mass corresponding to insulin having insulin like folds (analyzed via
ELISA) were present in the flow through, instead of GS-(H)6-R-proinsulin. In vitro, trypsin
removed major part of C-peptide from proinsulin and it became insulin like molecule (Kemmler,
et al., 1971). In future, better preparation of trypsinogen or inactive variants of trypsin could be
________________________________________
used for immobilization. The immobilized trypsinogen based purification strategy is an efficient
and fast procedure, requiring no dialysis step. The ecotin-proinsulin purification strategy
comprised of only two steps of affinity purification including one cleavage step and was
completed within 5 hours, with 43% recovery of proinsulin in homogeneous form.
4.3.6 Characterization of ecotin-proinsulin
The protein probes obtained after trypsinogen column, thrombin digestion and Ni-NTA
chromatography were characterized by ESI-MS (ESQUIRE-LC, Bruker Daltonik GmbH,
Bremen, Germany). All probes were desalted by passing them through a ZipTipC18 (Millipore).
The probes were eluted with 4 µl 0.1% TFA in 50% acetonitrile. The mass spectroscopic data are
shown in table 3, chapter 7.3. The full-length ecotin-proinsulin eluted from trypsinogen column
had a mass of 27,921.0 Da which is 8.7 Da less than the calculated reduced mass of full length
protein ecotin-proinsulin. Intact ecotin-proinsulin contains 4 disulfide bonds, the formation of
each disulfide bond decreases 2 Da. Thus, the ecotin-proinsulin was obtained in its oxidized state.
After thrombin digestion of ecotin-proinsulin, masses of 17,428 Da and 10,511 Da were obtained,
corresponding to the oxidized ecotin part [ecotin-(GS)6-LVPR, 17,428 Da] and oxidized
proinsulin [GS-(H)6R- proinsulin, 10,511 Da]. Wild-type ecotin which is naturally localized in
the periplasm was also purified in the oxidized state (16,097 Da) along with ecotin-proinsulin via
the trypsinogen column.
4.3.7 Production of ecotin-proinsulin in the protease deficient strain
As mentioned above, high level production of ecotin-proinsulin and its purification is a problem
due to severe proteolysis. It seems that the 20 kDa proteolytic fragment (Fig. 13) was generated
from ecotin-proinsulin due to proteolytic activity of pitrilysin at Tyr16-Lys17 or Phe25-Tyr26.
Therefore, a comparative study of periplasmic expression was done in E. coli BL21(DE3)Gold
(lon-,ompT
-) and E. coli SF120 (ptr
-, ompT
-,degP
-) constructed by Meerman et al. (Meerman and
Georgiou, 1994). The expression plasmid pEG-PI was transformed into E. coli BL21(DE3)Gold
and E. coli SF120 with ampicillin as selection marker for E. coli BL21(DE3) and ampicillin,
kanamycin and chloramphenicol for E. coli SF120. Both strains were inoculated into LB or M9
medium, with the respective antibiotics, and were grown overnight at 30 °C. Since the growth of
SF120 strain was poor, higher volumes of overnight-grown cells were inoculated to attain similar
________________________________________
starting optical densities in fresh 20 ml medium containing the appropriate antibiotics. The
cultures were grown at 30 °C to attain the mid-log phase. The protein synthesis was induced with
1 mM IPTG followed by lowering the temperature to 24 °C for 3 hours. Periplasmic extracts
were prepared according to the method of Winter et al. (Winter, et al., 2000), and native
proinsulin was quantified by ELISA.
Growth of E. coli SF120 was apparently poor in both, LB and M9 medium, with a final optical
density of 1.3 and 0.25, respectively. Under the same conditions, the optical density of E. coli
BL21(DE3)Gold was 4, and 0.8, respectively. In E. coli SF120, 85 and 79 µg of fusion protein
was produced per ml OD1 in LB and M9 medium, respectively. Thus, the specific yield was
about 3-4 fold higher than that determined in E. coli BL21(DE3)Gold (21 and 23 µg,
respectively; Fig. 5A, Chapter 7.3). However, due to the poor growth of SF120, the volumetric
yield of ecotin-proinsulin was only marginally increased (Fig. 5B, chapter 7.3). Moreover, under
high density fermentation conditions using SF120 strain, no ecotin-proinsulin fusion protein was
detectable.
________________________________________