1 source and destination: transfer success at a multi-campus university system air 2004 forum the...
TRANSCRIPT

1
Source and Destination:Transfer Success at a
Multi-campus University SystemAIR 2004 Forum
The Information Revolution: Bridging the Past to the FutureMay 31, 2004 – 4:10 PM
Salon K, Boston Marriott Copley PlaceBoston, Massachusetts
Mardy Eimers, Director of Institutional Research & Planning
Kathy Schmidtke, Graduate Student, Institutional Research & Planning

2
Importance of Transfers
• Approximately 42% of all new students are transfer students.
• At the urban institutions, transfer students represent 64% and 78% of all new students.
• Transfers are a significant part of enrollment management efforts.
• Admission requirements for transfer students differ from those of first-time entering students.

3
University of Missouri System
• Large residential campus• Engineering residential campus• Two urban campuses• Total 46,000 undergraduates
4
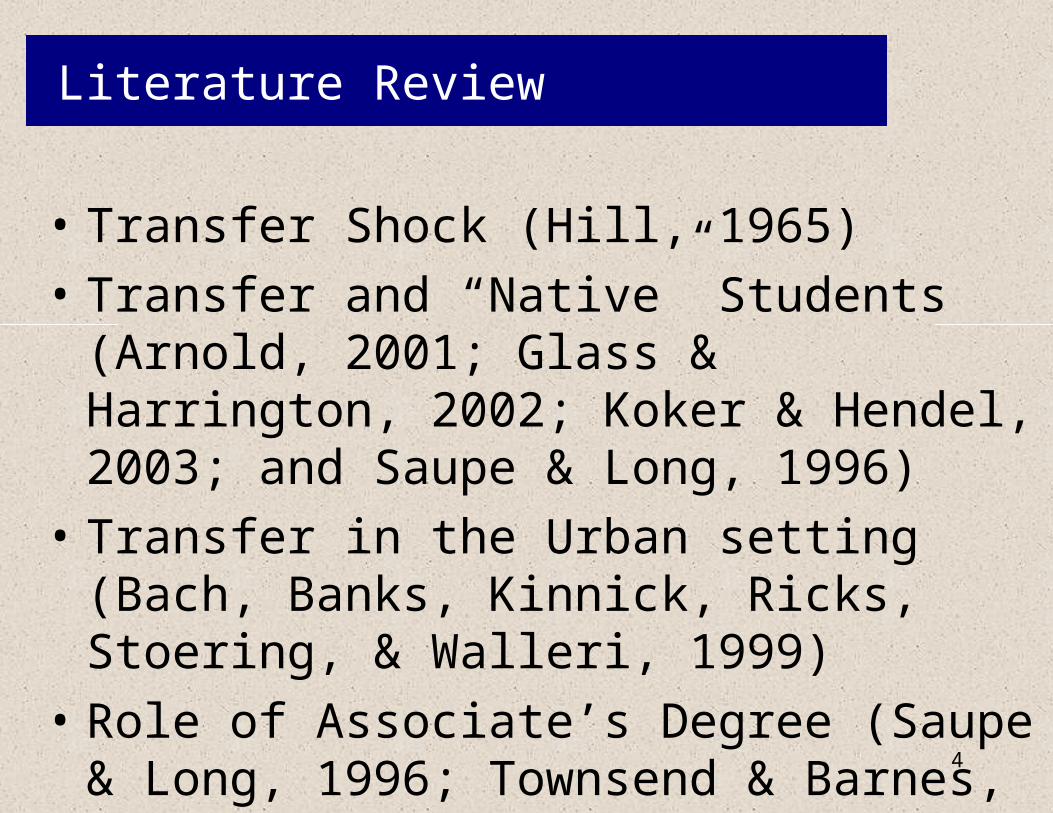
Literature Review
• Transfer Shock (Hill, 1965)• Transfer and “Native” Students
(Arnold, 2001; Glass & Harrington, 2002; Koker & Hendel, 2003; and Saupe & Long, 1996)
• Transfer in the Urban setting (Bach, Banks, Kinnick, Ricks, Stoering, & Walleri, 1999)
• Role of Associate’s Degree (Saupe & Long, 1996; Townsend & Barnes, 2001)

5
Source of Transfer
0%5%
10%15%20%25%30%35%40%45%
2-year 4-year UM
2-year 43% 4-year 37% UM 7%
Per
cent
of U
M T
rans
fer
Stu
dent
s

6
0%
10%
20%
30%
40%
50%
60%
70%
Residential Urban
Residential (UMC & UMR) 36% Urban (UMKC & UMSL) 64%
Destination of TransferP
erce
nt o
f UM
Tra
nsfe
r S
tude
nts

7
Transfer Student Population
• 10% Underrepresented minorities• 12% Had an A.A. Or A.S. Degree• Mean Transfer GPA – 2.9• Mean Transfer Hours – 58• Graduation Data:
– Six-year Graduation Rate – 53%– Mean Years to Graduation – 2.9– Of those graduating, 64% graduated
within 3 yrs.
8
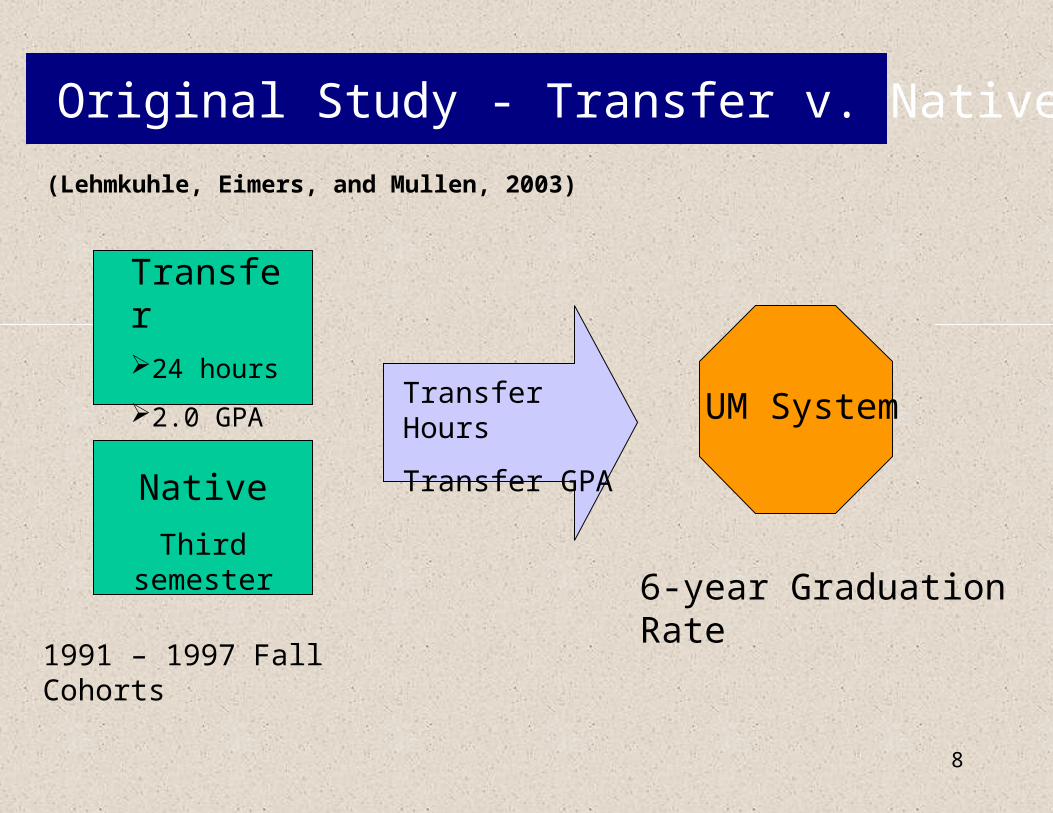
Original Study - Transfer v. Native
(Lehmkuhle, Eimers, and Mullen, 2003)
Transfer24 hours
2.0 GPA
Native
Third semester
Transfer Hours
Transfer GPAUM System
6-year Graduation Rate
1991 – 1997 Fall Cohorts

9
0%
10%
20%
30%
40%
50%
60%
70%
80%
Native After 3rd Term Transfer
Native After 3rd Term 79% Transfer 53%
Gra
du
ati
on
Rate
Graduation Rates – Native v. Transfer
Fall 1996 FT/FT DS Freshmen 6-year Grad. Rate
59%

10
Original Study - Research Questions
1. Are transfer students more likely to graduate than native students, when controlling for ability and credit hours?
2. What characteristics help explain a transfer student’s likelihood of graduating?
11
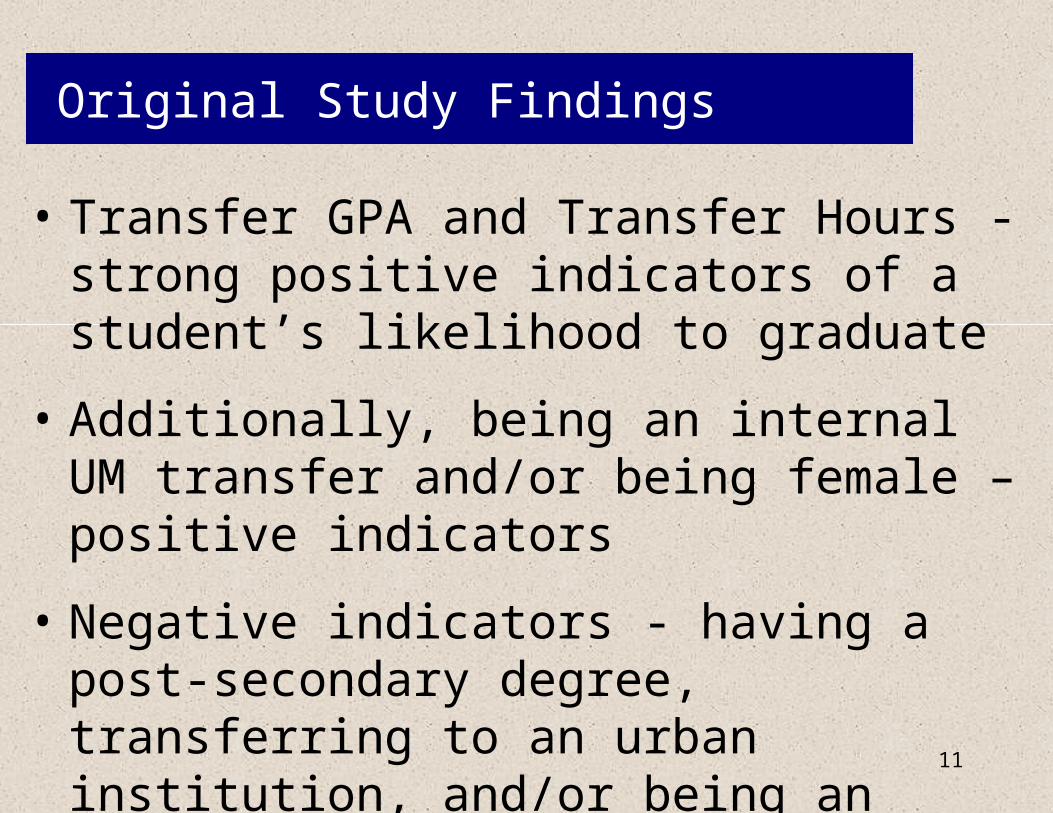
Original Study Findings
• Transfer GPA and Transfer Hours - strong positive indicators of a student’s likelihood to graduate
• Additionally, being an internal UM transfer and/or being female – positive indicators
• Negative indicators - having a post-secondary degree, transferring to an urban institution, and/or being an underrepresented minority.

12
New Study – Phase I
SOURCE - MO
2-year
4-year
UM System
Transfer Hours
Transfer GPAUM System
DESTINATION
6-year Graduation Rate

13
Research Questions – Phase I
3. Are transfer students more likely to graduate if they enter from a 2-year, 4-year, or UM System institution, when controlling for ability and credit hours?
4. What characteristics help explain a transfer student’s likelihood of graduating, based on whether they transfer from a 2-year, 4-year, or UM System institution?
14
46%
48%
50%
52%
54%
56%
58%
60%
2-year 4-year UM Total
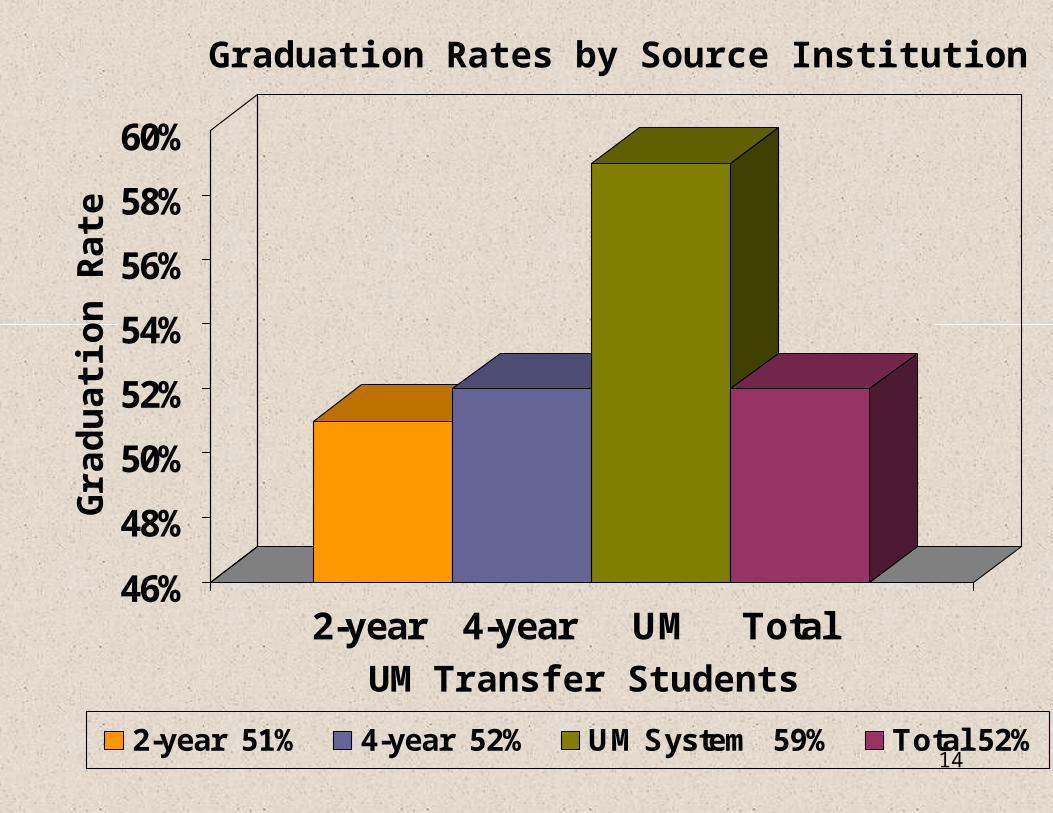
2-year 51% 4-year 52% UM System 59% Total 52%
UM Transfer Students
Gra
du
ati
on
Rate
Graduation Rates by Source Institution

15
20%
40%
60%
80%
100%
24-35 36-47 48-59 Over 60
2-year 4-year UM
Student GPA Less Than 2.50%
Gra
du
ati
ng
Credit Hours
20%
40%
60%
80%
100%
24-35 36-47 48-59 Over 60
2-year 4-year UM
Student GPA 3.5 or more
% G
rad
uati
ng
Credit Hours

16
20%
40%
60%
80%
100%
<2.5 2.5-2.99 3.00-3.49 3.50 ormore
2-year 4-year UM
Credit Hours: 24-35%
Gra
du
ati
ng
GPA
20%
40%
60%
80%
100%
<2.5 2.5-2.99 3.00-3.49 3.50 ormore
2-year 4-year UM
Credit Hours: Over 60
% G
rad
uati
ng
GPA

17
Control
Independent Variables
Male
Other Ethnicity
Female
Asian or Minority (African American, Hispanic, Native American)
2 year or UM
Associate’s of Arts, Associate’s of Science or Other Associates(2-year only)
Residential
GPA Category2.5-2.9 3.0-3.49 3.5-4.0
Transfer Hour Category36-47 48-59 60+
Age
4 year
No Assoc. Deg
Urban
POINT ESTIMATE = 1
As Likely to Graduate as “Control”
Dependent Variable
Graduate
Don’t Graduate
Logistic Regression
24-35
2.0-2.49

18
Logistic Regression Findings – 4-year
Independent Variable Point Estimate
Effect
Transfer GPA 1.484 Positive
Transfer Hours 1.165 Positive
Transfer to Residential 1.683 Positive
Age 0.955 Negative
Minority 0.761 Negative

19
Logistic Regression Findings – 2-year
Independent Variable Point Estimate
Effect
Transfer GPA 1.529 Positive
Transfer Hours 1.204 Positive
Female 1.158 Positive
Associate’s of Arts Deg 1.270 Positive
Transfer to Residential 1.103 Positive
Age 0.964 Negative
Other Associate’s Deg 0.707 Negative
Minority 0.711 Negative

20
Logistic Regression Findings – UM
Independent Variable Point Estimate
Effect
Transfer GPA 1.221 Positive
Transfer Hours 1.125 Positive
Transfer to Residential 1.528 Positive
Age 0.929 Negative

21
New Study – Phase II
SOURCE - MO
Transfer Hours
Transfer GPA
Urban
Residential
UM
System
DESTINATION
6-year Graduation Rate
Missouri
Institutions

22
Research Questions – Phase II
5. Are transfer students more likely to graduate if they transfer to an urban or residential campus, when controlling for ability and credit hours?
6. What characteristics help explain a transfer student’s likelihood of graduating, based on whether the student transferred to an urban or residential campus?

23
0%
10%
20%
30%
40%
50%
60%
Urban Residential
Gra
du
ati
on
Rate
Graduation Rates of MO Transfer Studentsby Destination Institution
48% 59%
All UM Transfers 52%

24
20%
40%
60%
80%
100%
24-35 36-47 48-59 Over 60
Urban Residential
Student GPA Less Than 2.50%
Gra
du
ati
ng
Credit Hours
20%
40%
60%
80%
100%
24-35 36-47 48-59 Over 60
Urban Residential
Student GPA 3.5 or more
% G
rad
uati
ng
Credit Hours

25
20%
40%
60%
80%
100%
<2.5 2.5-2.99 3.00-3.49 3.50 ormore
Urban Residential
Credit Hours: 24-35%
Gra
du
ati
ng
GPA
20%
40%
60%
80%
100%
<2.5 2.5-2.99 3.00-3.49 3.50 ormore
Urban Residential
Credit Hours: Over 60
% G
rad
uati
ng
GPA

26
Logistic Regression Findings – Urban
Independent Variable Point Estimate
Effect
Transfer GPA 1.438 Positive
Transfer Hours 1.134 Positive
Source UM 1.619 Positive
Female 1.398 Positive
Source Two-year 1.138 Positive
Age 0.965 Negative
Minority 0.712 Negative
27
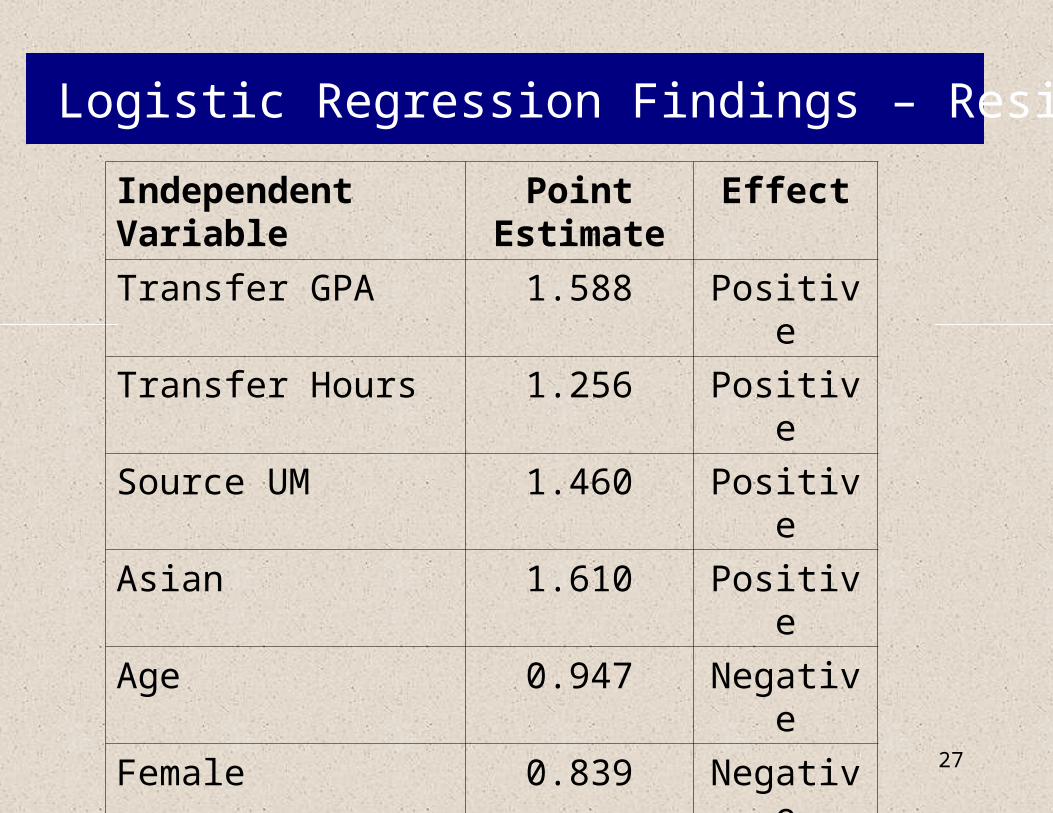
Logistic Regression Findings – Residential
Independent Variable Point Estimate
Effect
Transfer GPA 1.588 Positive
Transfer Hours 1.256 Positive
Source UM 1.460 Positive
Asian 1.610 Positive
Age 0.947 Negative
Female 0.839 Negative
Minority 0.710 Negative
Source Two-year 0.679 Negative

28
0%
10%
20%
30%
40%
50%
60%
A.A. A.S. Other None
A.A. 59% A.S. 52%Other Assoc. 40% No Assoc. Deg. 50%
2-year Transfer Students
Gra
du
ati
on
Rate
Graduation Rates by Type of Associate’s
Graduation Rate for all 2-yr 52%
N = 2,361 N = 6,180N = 527N = 176

29
Exploratory Phase
SOURCE - MO
2-year
4-year
UM System
Transfer Hours
Transfer GPA
Urban
Residential
UM
System
DESTINATION
6-year Graduation Rate

30
0%
10%
20%
30%
40%
50%
60%
70%
Urban Residential
From 2-year From 4-year From UM System Total
Gra
du
ati
on
Rate
Graduation Rates by Destination Institution
61% 31% 43% 48%

31
Logistic Regression Findings – 4-year to urban
Independent Variable Point Estimate
Effect
Transfer GPA 1.420 Positive
Transfer Hours 1.102 Positive
Female 1.323 Positive
Age 0.960 Negative
Minority 0.768 Negative

32
Logistic Regression Findings –2-year to Urban
Independent Variable Point Estimate
Effect
Transfer GPA 1.453 Positive
Transfer Hours 1.122 Positive
Associate’s of Arts Deg. 1.436 Positive
Female 1.405 Positive
Age 0.967 Negative
Other Associate’s Deg. 0.760 Negative
Minority 0.672 Negative

33
0%
10%
20%
30%
40%
50%
60%
A.A. A.S. Other None
A.A. 58% A.S. 50%Other Assoc. 40% No Assoc. Deg. 47%
2-year Transfer Students to an Urban
Gra
du
ati
on
Rate
Graduation Rates by Type of Associate’s
Graduation Rate for all 2-yr Urban 50%
N = 1,865 N = 3,688N = 468N = 135

34
Logistic Regression - 4-year to Residential
Independent Variable Point Estimate
Effect
Transfer GPA 1.541 Positive
Transfer Hours 1.213 Positive
Age 0.950 Negative
Minority 0.726 Negative

35
Logistic Regression – 2-year to Residential
Independent Variable Point Estimate
Effect
Asian 2.063 Positive
Transfer GPA 1.686 Positive
Transfer Hours 1.348 Positive
Age 0.947 Negative
Female 0.784 Negative

36
0%
10%
20%
30%
40%
50%
60%
70%
A.A. A.S. Other None
A.A. 61% A.S. 59%Other Assoc. 47% No Assoc. Deg. 55%
2-year Transfer Students to a Residential
Gra
du
ati
on
Rate
Graduation Rates by Type of Associate’s
Graduation Rate of all 2-yr Residential 56%
N = 496 N = 2,492N = 59N = 41

37
Limitations
•University of Missouri data
•Native student attrition•Strength of logistic
model•Cell Size after
aggregations

38
Findings
• Regardless of whether a student enters from a 2-year or 4-year institution, Transfer GPA and Transfer Hours continue to be strong positive indicators of graduation.
• When controlling for GPA and hours, 4-year transfers graduate at a higher rate than 2-year transfers.
• When controlling for GPA and hours, students who transfer to a residential institution graduate at a higher rate than students who transfer to an urban institution.
• In an urban institution, 2-year transfers are more successful than 4-year transfers, while in a residential institution, 4-year transfers are more successful.
• For 2-year transfers, obtaining the Associate’s of Arts degree is a positive indicator of graduation at an urban institution.
39
Discussion & Future Research Focus
• Transfer assimilation and articulation (AA, 42-hr)
• Transfer admission standards• Difference in success of 2-year and 4-year
students transferring to urban and residential campuses.
• Shared responsibility of all institutions and disciplines
• Ideas or modifications for future studies

40
Additional Information
Mardy Eimers: [email protected]
Office of Institutional Research & Planning
721 Lewis HallUniversity of Missouri SystemUniversity of Missouri-ColumbiaColumbia, Missouri 65211(573) 882-2778
Kathy Schmidtke: [email protected]
Office of Institutional Research & Planning712 Lewis HallUniversity of Missouri SystemUniversity of Missouri-ColumbiaColumbia, Missouri 65211(573) 884-2241