1 sharescope how investors evaluate company performance tim clarke general manager, sharescope
TRANSCRIPT

1
ShareScope
How investors How investors evaluate company evaluate company
performanceperformanceTim ClarkeTim Clarke
General Manager, ShareScopeGeneral Manager, ShareScope

2
Stock markets
Initial Public Offering
Ltd v Plc• Share ownership• Control• Accounts / reporting• Money-raising• Cost

3
Investing
• Superior returns• Fund management• Growth, Value, Income, Momentum

• Your share of profits• Yield / interest rate• Dividend reinvestment• Compounding
4
Dividends
• Einstein described compound returns as the “eighth wonder of the world”.
5
Dividends

6
Compounding
Bob’s Grocery Stores Plc
Share price 100p Holding period 30 years
Dividend 4p Share price remains unchanged
Value of shares £1000 1000 x 100p
Income received £1200 4p x 1000 x 30yrs
Investment value £2200 £1000 + £1200
Annual income £40 1000 x 4p
Yield on cost 4% 4p / 100p

7
Compounding
Initial value of shares £1000 1000 x 100p
Income received £0 Dividends reinvested
Final value of shares £3243 3243 x 100p
Annual income in year 30 £130 3243 x 4p
Yield on cost 13% 13p / 100p
Bob’s Grocery Stores Plc
Share price 100p Holding period 30 years
Dividend 4p Share price remains unchanged

8
Compounding
Initial value of shares £3325 1000 x 332.5p
Income received £0 Dividends reinvested
Final value of shares £69,335
Annual income in year 30 £2754
Yield on cost 83% £2754/ £3325
British American Tobacco Plc (BATS)
2nd Jan 2000 Share price = 332.5p Dividend = 22.2p
2nd Jan 2015 Share price = 3522p Dividend = 144.9p

9
Dividend Yield
10
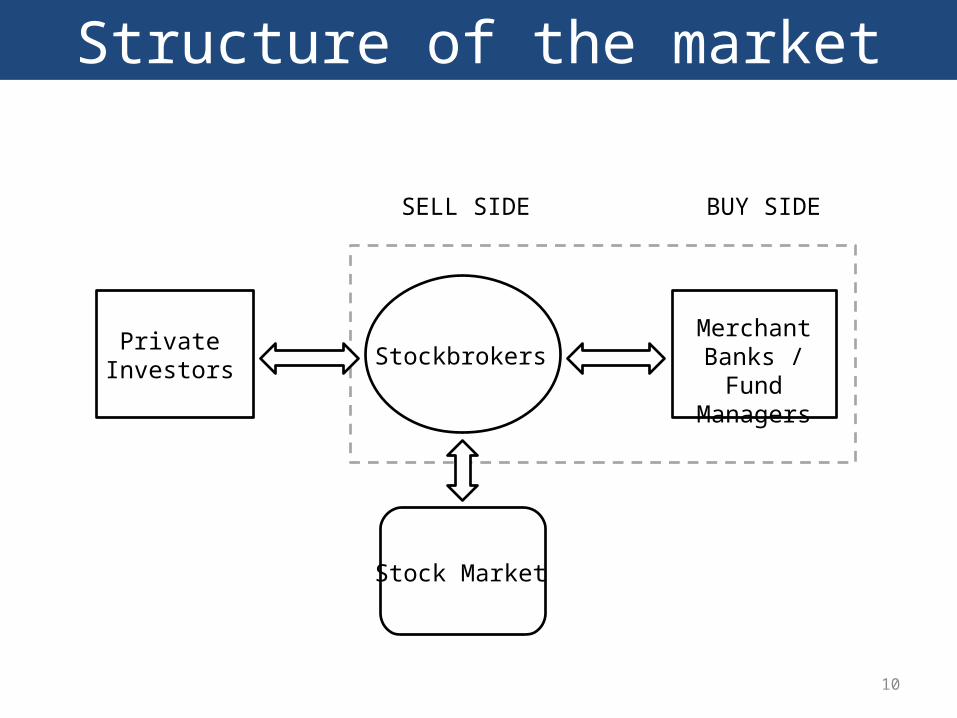
PrivateInvestors
Merchant Banks / Fund
ManagersStockbrokers
SELL SIDE BUY SIDE
Stock Market
Structure of the market

Market capitalisation
Share price x No. Shares
e.g. Tesco Plc
Share price = 219.25pNo. Shares = 8,123,000,000Market cap. = £17,809,677,500

12
Profits/earnings

13
Profits/earnings
EPS = Earnings per Share
14
Profitability

15
Profitability

16
Profitability

17
• Minefield• Continuous operations• GAAP• Exceptional items
Practical considerations

18
Profitability

19
P/E =
Market cap / Value
PriceEPS

20
Price/Earnings Ratio

21
Price/Earnings Ratio

22
Price/Earnings Ratio

23
PEG = PE / Earnings Growth
PEG

24
Cash Flow & Liquidity

25
Dividend cover

26
Dividend cover

OM = Operating Profit / Turnover (Sales)
27
Operating Margin

28
Balance Sheet

29
Debt
Gearing = Debt / Shareholder funds

30
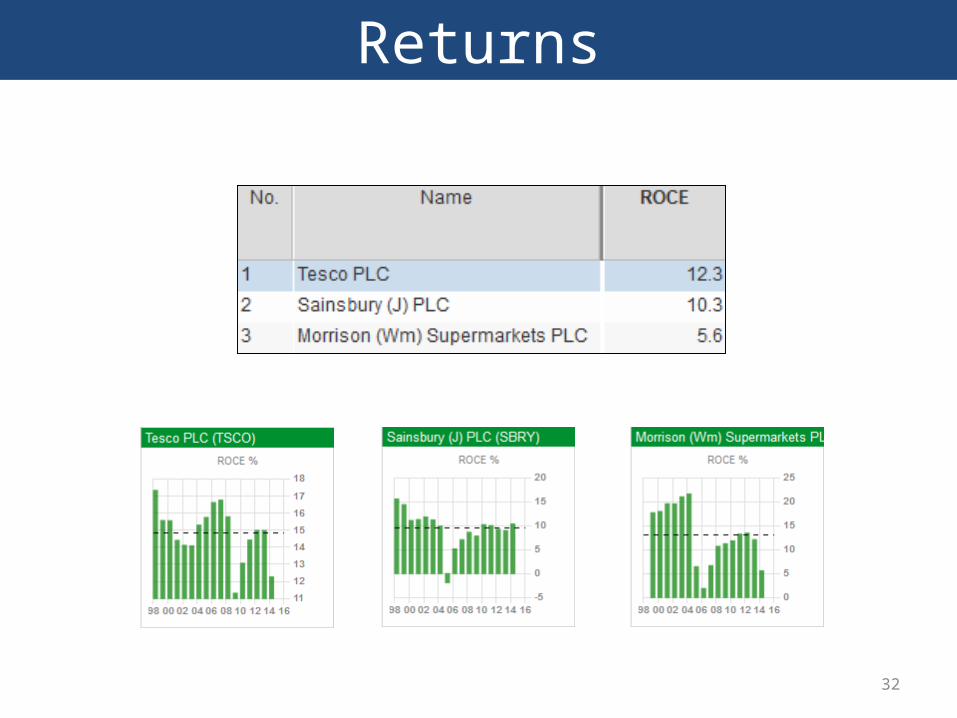
Returns
Return on capital employed (ROCE)
Profit / Shareholder equity & Total borrowing

31
Returns
32
Returns

33
Problems with EPS
• Share buybacks• Debt instead of equity

34
Discount/Premium to NAV

35
Discount/Premium to NAV

36
Discount/Premium to NTAV

37
City Expectations

R R R
14/3/11 14/9/12'12Jul Jul
Sainsbury (J) PLC
Oct Apr
Pence Ord
360
350
340
330
320
310
300
290
280
270
260
ScopeShareChart (c) www.sharescope.co.uk
38
City Expectations

39
City Expectations

40
City Expectations
-16%

41
Was Tesco a good investment?

42
Stock Screening
• Search the stock market• Use understanding of financial metrics to
find attractive investment opportunities• Criteria to use depend on the type of
investor you are

43
Growth - Warren Buffett• Capitalisation above £250m
• Exclude property stocks
• Below average PE in subsector
• EPS has increased in four out of the last five years
• Operating margin is trending upwards
• Net gearing below 100%
• Interest cover of 1.5 or more
• Cash flow higher than EPS
• ROCE of at least 12% for last three years
• ROCE trending upwards over last three years
• Ideally above average in sub-sector for most of PE, ROCE,
Op margin, Net Gearing, Price to cash flow
Stock Screening