1 research, regeneration and education - analysing survey data with spss tony alderton researcher...
TRANSCRIPT
1
Research, regeneration and education - analysing survey data with SPSS
Research, regeneration and education - analysing survey data with SPSS
Tony AldertonResearcher for Early Years and ChildcareKent County Council9th October 2009
Tony AldertonResearcher for Early Years and ChildcareKent County Council9th October 2009

2
BiographyBiography
1st Degree – Social PolicyPhD – SociologyStarted using SPSS – 1994
(previously used Minitab)Employment: Civil
Service/Universities/Local AuthorityHave taught use of SPSS to MBA
studentsTrained as researcher – Not
statistician!
1st Degree – Social PolicyPhD – SociologyStarted using SPSS – 1994
(previously used Minitab)Employment: Civil
Service/Universities/Local AuthorityHave taught use of SPSS to MBA
studentsTrained as researcher – Not
statistician!

3
OutlineOutline
Context Problems Solutions Methods Results Analysis Future plans
Context Problems Solutions Methods Results Analysis Future plans

4
ContextContext
KCC CFE Strategic Planning and Review Early Years and Childcare Operations Unit
High level targets child poverty unemployment
Local Targets childcare early education
Childcare Act 2006 Childcare Sufficiency Assessments
(published document)
KCC CFE Strategic Planning and Review Early Years and Childcare Operations Unit
High level targets child poverty unemployment
Local Targets childcare early education
Childcare Act 2006 Childcare Sufficiency Assessments
(published document)
5
ProblemsProblems
Size/diversity of Kent Free market v command economy Access Quality Price (sustainability) Parental choice
Size/diversity of Kent Free market v command economy Access Quality Price (sustainability) Parental choice

6
SolutionSolution
Parents’ consultation Project (PCP) (later - CSA demand survey)
Parents’ consultation Project (PCP) (later - CSA demand survey)
7
MethodsMethods
Door-to-door interviews Two phases (Oct 2005 to March 2006
and November 2008 to March 2009) Selected wards/LSOAs (mixed reasons
for inclusion) Structured survey form (hard copy/PDA) Mix of 23 closed and 1 open ended
question Questions multi-layered (i.e. sample
question – potentially 60 data entries)

8
PCP wards/LSOAsPCP wards/LSOAs

9
ResultsResults
60,000 households visited (in two phases)
c 6,500 questionnaires completed (c 30% response rate)
c 11,000 children covered
60,000 households visited (in two phases)
c 6,500 questionnaires completed (c 30% response rate)
c 11,000 children covered

10
Survey questionnaire – sample question
Survey questionnaire – sample question

11
AnalysisAnalysis
Survey data linked to MOSAIC data. Data mapped using GIS tools
Survey data linked to MOSAIC data. Data mapped using GIS tools

12
ExampleExample
Pelham ward (Gravesham district)4 lower super output areasE01024289 top 30% most deprived670 householdsMOSAIC range 1 - 59 (ward and
lsoa)MOSAIC average 27 (ward)MOSAIC average 30 (lsoa)
Pelham ward (Gravesham district)4 lower super output areasE01024289 top 30% most deprived670 householdsMOSAIC range 1 - 59 (ward and
lsoa)MOSAIC average 27 (ward)MOSAIC average 30 (lsoa)

13

14
MOSAIC type 27MOSAIC type 27
15
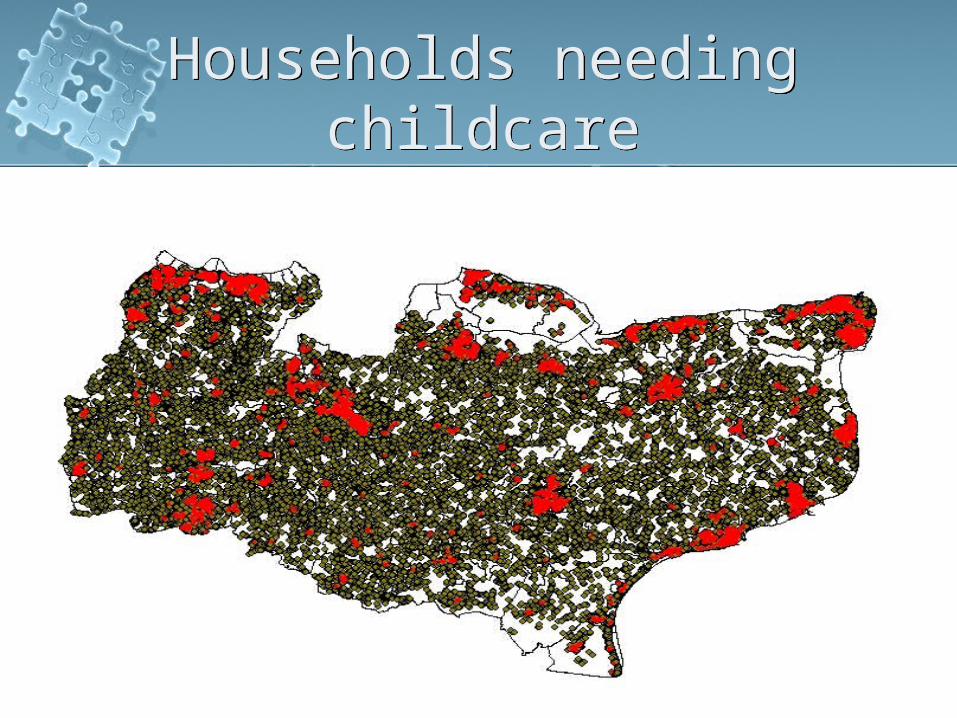
Households needing childcare
Households needing childcare
16
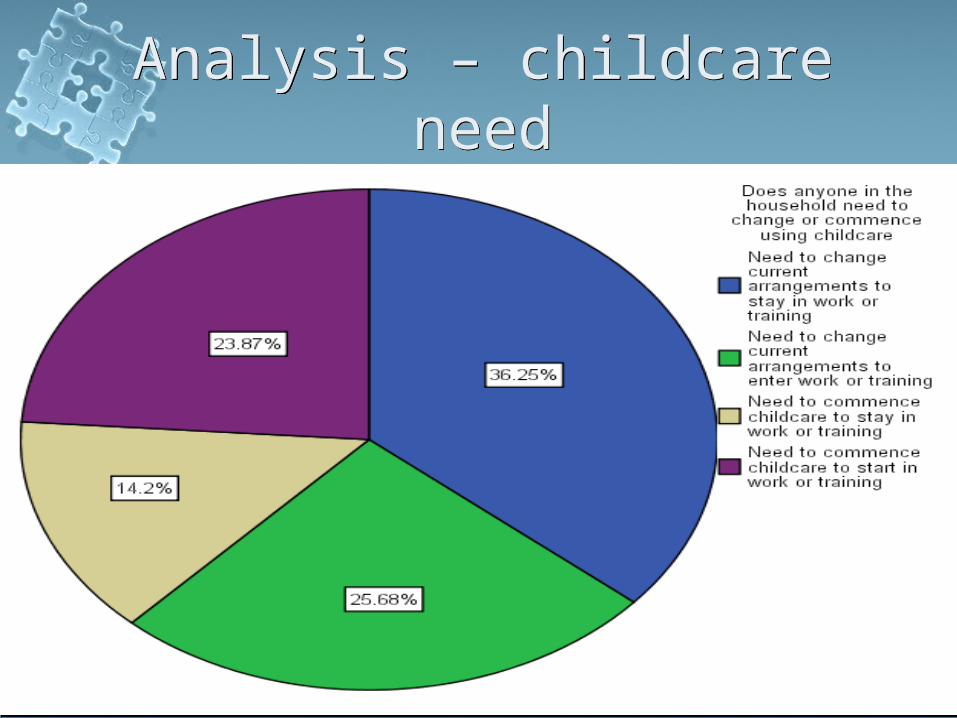
Analysis – childcare needAnalysis – childcare need

17
Analysis – age of childrenAnalysis – age of children

18
Analysis – type of childcare wanted
Analysis – type of childcare wanted

Analysis – issues with using childcare
Analysis – issues with using childcare
Issue N % of responses % of cases
Cost 397 10.65 11.70
No job 99 2.66 2.92
None available 40 1.07 1.18
Need multiple places 17 0.46 0.50
Accessibility 15 0.40 0.44
Quality 27 0.72 0.80
Hours of care 48 1.29 1.41
Child's needs 38 1.02 1.12
Want to keep children at home 189 5.07 5.57
Children old enough to look after themselves 220 5.90 6.48
Do not trust care 99 2.66 2.92
Other 218 5.85 6.42
No issues 2321 62.26 68.41
Totals 3728 100.00 109.87

20
Analysis – BME groups use of childcare
Analysis – BME groups use of childcare
First child is in childcare
Total
No Yes
Ethnicity of respondent White British 80.9% 19.1% 100.0%
BME group 81.4% 18.6% 100.0%
Total 80.9% 19.1% 100.0%
Chi-Square Tests
Value dfAsymp. Sig.
(2-sided)Exact Sig. (2-
sided)Exact Sig. (1-sided)
Pearson Chi-Square .037(b) 1 0.847
Continuity Correction(a) 0.012 1 0.914
Likelihood Ratio 0.037 1 0.847
Fisher's Exact Test 0.932 0.463
Linear-by-Linear Association 0.037 1 0.847
N of Valid Cases 3,399

Analysis – regression model
Analysis – regression modelModel summary
Model R R square Adj R Std err of the est
1 .591(b) 0.349 0.348 0.42241
Coefficients (a,b)
Model Unstandardised Standardised
t Sig
B Std err Beta
1 How well informed
0.128 0.021 0.202 6.07 .000
Emp status
0.343 0.016 0.902 21.2 .000
Tot no children
-0.094 0.016 -0.23 -5.91 .000

22
Analysis - flowchartAnalysis - flowchartRespondentuses childcare
Meets all needs Yes No action requiredYes
No
Whynot
Wantchildrenat home
Otherreason
Needs additional services
No
Services already exist
Yes No More services required
Respondent can affordservices
Cheaperservices/subsidiesrequired
Yes No
Existing services can caterfor child’s needs
Yes No Improvement inservices/training required
Existing services can caterfor parent’s needs
Yes NoImprovements inservices/extension ofhours required

23
Future plansFuture plans
Further surveys Plan services Monitor
Further surveys Plan services Monitor