(1) production possibility frontier (ppf) : supply side (2...
TRANSCRIPT
<Abstract> (1) Production Possibility Frontier (PPF) : supply side 1) 3 assumptions :
- finite inputs - given level of technology - efficient use of inputs
2) Implication of PPF - scarcity : points outside of the curve – infeasible (shows a tech limit of a country) - choice : points along the line are feasible and efficient (inside points – inefficient) - opportunity cost : increasing opportunity cost (concave function = bowed out)
since workers lose efficiency from switching production - size : expansion (technology innovation, inputs increase) / contraction (capital destroyed etc..)
(2) General Equilibrium Model 1) 7 assumptions :
① rational behavior : econ participants are rational – firms (consumers) max profits (utility)
② 2 countries and 2 commodities (ex: US & UK with Soybeans $ Textiles – identical)
③ real price = nominal price – inflation rate
* relative price = Ps / Pt (slope of budget constraint)
[supply side]
④ inputs are fixed (K & L are given – tech constant) – recall PPF !
⑤ perfect competition mkt (in production of 2 commodities in both countries)
> free factor(input) mobility : able to S T , T S freely > no entrance mkt barrier > many firms and consumers (no monopoly and consumers are price takers) > homogeneous goods (identical, no quality difference) > no long-run profits > efficient allocation of inputs > MSB = MSC (marginal social benefits equal to marginal social cost)
※ │slope PPF│= Ps / Pt (slope of budget constraint)
⑥ free input mobility
[demand side]
⑦ consistent set of community indifference curves (CIC)
CIC : sum of individual indifference curve
※ To find the equilibrium point,
│slope PPF│= Ps / Pt = MRSs,t (slope of the indifference curve – marginal rate of substitution)
2) Solution of the model - assume autarky (self-sufficient, no trade) - 2 cases
1) constant opportunity cost (slope of PPF is linear) : proportional change in prod. S&T / inputs are perfectly transferable (5 units inc. in S 5 units dec. in T)
2) increasing opportunity cost (bowed out shaped PPF) production of one good inc. (transfer inputs inc) larger dec. in the prod of the other good.
inputs, not perfectly transferable (lose productivity as mentioned above)
- (case 1) constant opp. Cost & optimal level of output - Draw the graph.
(│slope PPF│ = Ps / Pt = MRSs,t) : CIC is tangent to the PPF at the equil-point.
(ex- if slope PPF > MRSs,t := MUs / MUt – MUs is small currently consuming large amount of S. Thus in order to meet the equation, consumers should consume less S, and more T.)
- (case 2) Increasing opp. & optimal level of output - Draw the graph. - if slope of CIC > slope of PPF : consumers’ willingness to pay is higher on Good S than Good T.(in other words, consumers are currently consuming less Good S than Good T) consumptions of Good S will increase demand of Good T will decrease equilibrium point can be driven by the tangent of CIC & PPF. i.e., │slope PPF│ = Ps / Pt = MRSs,t : CIC is tangent to the PPF at the equil-point on the relative price line.
※ the equilibrium point will not change unless PPF and/or CIC changes.
- change in technology of production of S or T will change the slope of PPF - change in consumers’ preference will change the shape of CIC
※ How to get the nominal GDP & Real GDP (shows national budget constraint and relative price line)
- nominal GDP = PsㆍS + PtㆍT
- real GDP = nominal GDP / Pt = (Ps/Pt) ㆍS + T
※ How to derive National Demand/Supply Curve and equilibrium point
* National Supply Curve - step 1 : draw PPF - step 2 : draw relative price line tangent to PPF - step 3 : draw the coordinates corresponding to the quantity of S and Ps/Pt and connect the points - You will get increasing curve which has positive slope. (increasing opp. Cost convex curve / constant
opp. Cost linear line)
* National Demand Curve - step 1 : draw PPF - step 2 : draw relative price line tangent to PPF - step 3 : draw CIC tangent to the relative price line - step 4 : draw the coordinates corresponding to the quantity of S and Ps/Pt - You will get decreasing curve which has negative slope.
* Equilibrium point - step 1 : draw National Supply Curve - step 2 : draw National Demand Curve - the point of intersection of these two curve is the equilibrium point that shows the quantity and relative
price. - if the equilibrium (relative) price of country A is lower than that of B, (it can be caused by different
resource endowment, population, preferences and skill etc..) we say country A has comparative advantage in production of Good S because the price of Good S in country A is cheaper than country B.
(3) Classical Model of International Trade (smith) Goal : what should a country produce / distribution of goods 1) Assumptions
① rational behaviors
② 2 countries and 2 commodities
③ relative price = Ps/Pt
④ constant input and technology in both countries
⑤ perfect competition
⑥ free factor mobility within a country
⑦ CIC represents consumers’ preference (PPF – supply , production / CIC – demand)
⑧ inputs are not allowed to move btw countries (inputs are able to move within a country)
⑨ no trade barriers such as tax or quotas
⑩ exports will pay for imports (exports = imports ; no surplus or deficit)
⑪ labor is the only input in the production of the Goods.
- value of a good is based on labor input - capital and labor are both used in production , the value of capital is based on labor used to produce that
capital - capital/labor ratio is constant (within a country production of S&T have same ratio)
⑫ constant returns to scale btw labor and output
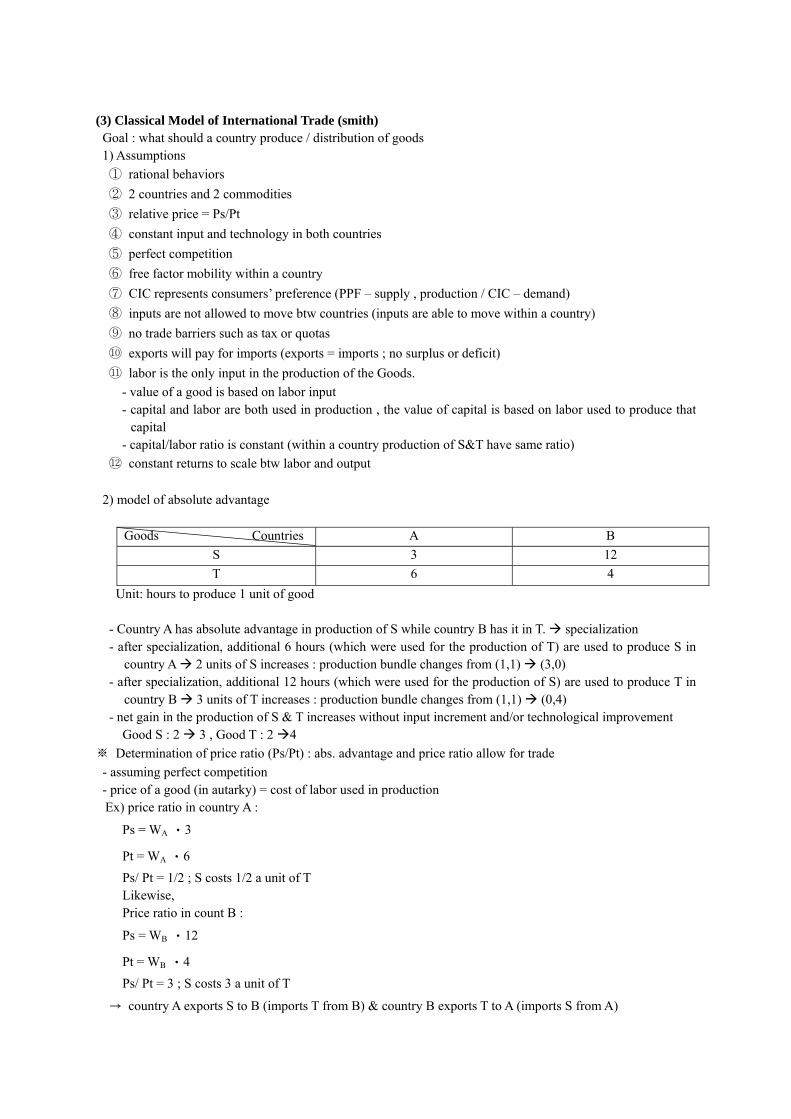
2) model of absolute advantage
Goods Countries A B
S 3 12
T 6 4
Unit: hours to produce 1 unit of good - Country A has absolute advantage in production of S while country B has it in T. specialization - after specialization, additional 6 hours (which were used for the production of T) are used to produce S in
country A 2 units of S increases : production bundle changes from (1,1) (3,0) - after specialization, additional 12 hours (which were used for the production of S) are used to produce T in
country B 3 units of T increases : production bundle changes from (1,1) (0,4) - net gain in the production of S & T increases without input increment and/or technological improvement Good S : 2 3 , Good T : 2 4
※ Determination of price ratio (Ps/Pt) : abs. advantage and price ratio allow for trade
- assuming perfect competition - price of a good (in autarky) = cost of labor used in production
Ex) price ratio in country A :
Ps = WA ㆍ3
Pt = WA ㆍ6
Ps/ Pt = 1/2 ; S costs 1/2 a unit of T Likewise, Price ratio in count B :
Ps = WB ㆍ12
Pt = WB ㆍ4
Ps/ Pt = 3 ; S costs 3 a unit of T
→ country A exports S to B (imports T from B) & country B exports T to A (imports S from A)
(4) Ricardian model (Ricardo)
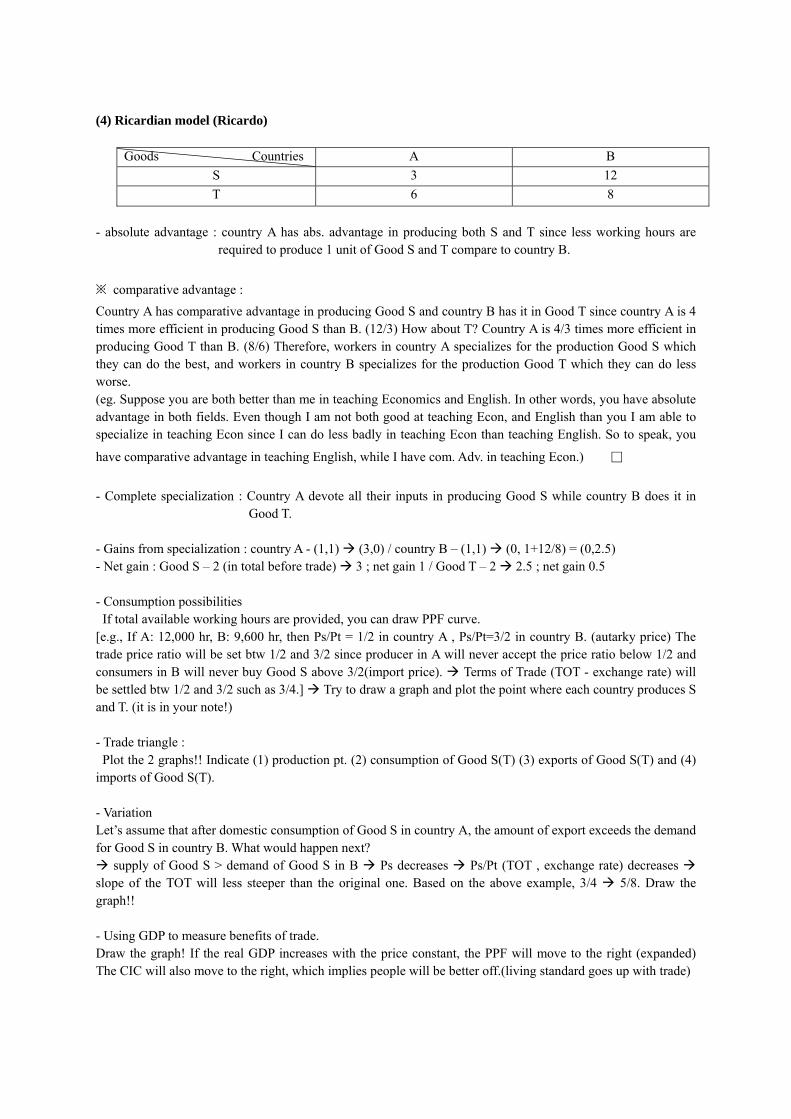
Goods Countries A B
S 3 12
T 6 8
- absolute advantage : country A has abs. advantage in producing both S and T since less working hours are
required to produce 1 unit of Good S and T compare to country B.
※ comparative advantage :
Country A has comparative advantage in producing Good S and country B has it in Good T since country A is 4 times more efficient in producing Good S than B. (12/3) How about T? Country A is 4/3 times more efficient in producing Good T than B. (8/6) Therefore, workers in country A specializes for the production Good S which they can do the best, and workers in country B specializes for the production Good T which they can do less worse. (eg. Suppose you are both better than me in teaching Economics and English. In other words, you have absolute advantage in both fields. Even though I am not both good at teaching Econ, and English than you I am able to specialize in teaching Econ since I can do less badly in teaching Econ than teaching English. So to speak, you
have comparative advantage in teaching English, while I have com. Adv. in teaching Econ.) □
- Complete specialization : Country A devote all their inputs in producing Good S while country B does it in
Good T. - Gains from specialization : country A - (1,1) (3,0) / country B – (1,1) (0, 1+12/8) = (0,2.5) - Net gain : Good S – 2 (in total before trade) 3 ; net gain 1 / Good T – 2 2.5 ; net gain 0.5 - Consumption possibilities If total available working hours are provided, you can draw PPF curve. [e.g., If A: 12,000 hr, B: 9,600 hr, then Ps/Pt = 1/2 in country A , Ps/Pt=3/2 in country B. (autarky price) The trade price ratio will be set btw 1/2 and 3/2 since producer in A will never accept the price ratio below 1/2 and consumers in B will never buy Good S above 3/2(import price). Terms of Trade (TOT - exchange rate) will be settled btw 1/2 and 3/2 such as 3/4.] Try to draw a graph and plot the point where each country produces S and T. (it is in your note!) - Trade triangle : Plot the 2 graphs!! Indicate (1) production pt. (2) consumption of Good S(T) (3) exports of Good S(T) and (4)
imports of Good S(T). - Variation Let’s assume that after domestic consumption of Good S in country A, the amount of export exceeds the demand for Good S in country B. What would happen next? supply of Good S > demand of Good S in B Ps decreases Ps/Pt (TOT , exchange rate) decreases slope of the TOT will less steeper than the original one. Based on the above example, 3/4 5/8. Draw the graph!! - Using GDP to measure benefits of trade. Draw the graph! If the real GDP increases with the price constant, the PPF will move to the right (expanded) The CIC will also move to the right, which implies people will be better off.(living standard goes up with trade)
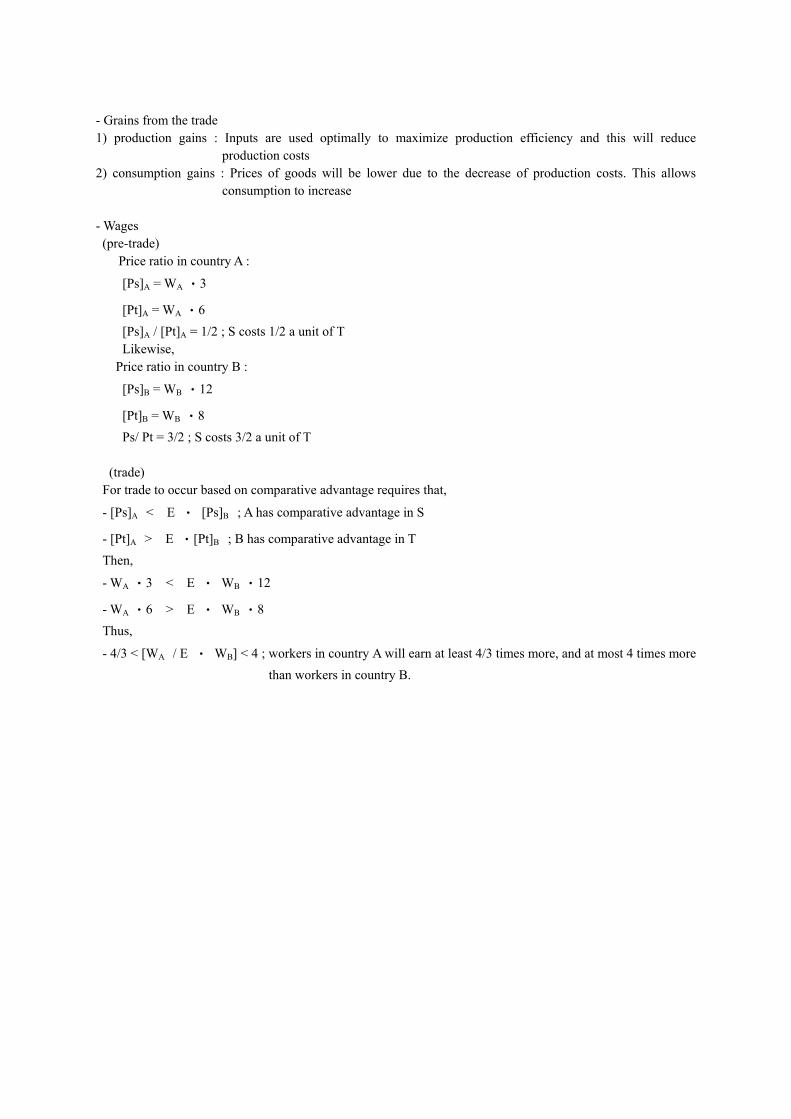
- Grains from the trade 1) production gains : Inputs are used optimally to maximize production efficiency and this will reduce
production costs 2) consumption gains : Prices of goods will be lower due to the decrease of production costs. This allows
consumption to increase - Wages (pre-trade) Price ratio in country A :
[Ps]A = WA ㆍ3
[Pt]A = WA ㆍ6
[Ps]A / [Pt]A = 1/2 ; S costs 1/2 a unit of T Likewise,
Price ratio in country B :
[Ps]B = WB ㆍ12
[Pt]B = WB ㆍ8
Ps/ Pt = 3/2 ; S costs 3/2 a unit of T
(trade) For trade to occur based on comparative advantage requires that,
- [Ps]A < E ㆍ [Ps]B ; A has comparative advantage in S
- [Pt]A > E ㆍ[Pt]B ; B has comparative advantage in T
Then,
- WA ㆍ3 < E ㆍ WB ㆍ12
- WA ㆍ6 > E ㆍ WB ㆍ8
Thus,
- 4/3 < [WA / E ㆍ WB] < 4 ; workers in country A will earn at least 4/3 times more, and at most 4 times more
than workers in country B.
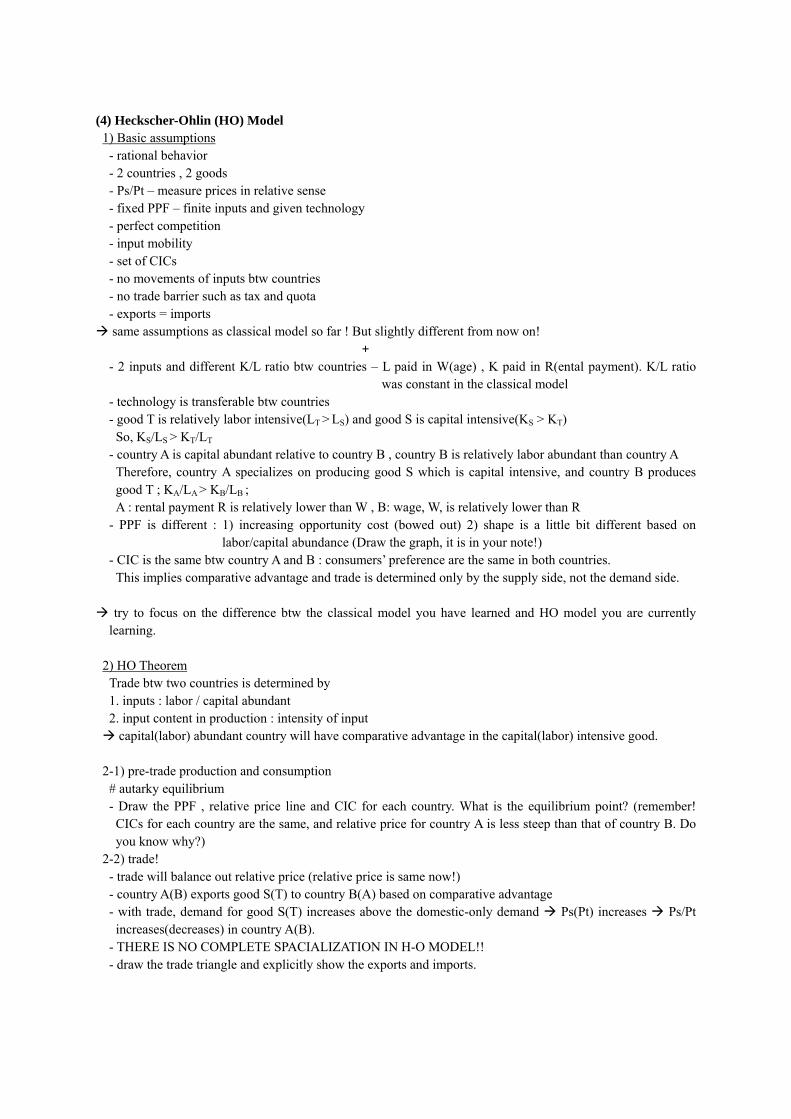
(4) Heckscher-Ohlin (HO) Model 1) Basic assumptions - rational behavior - 2 countries , 2 goods - Ps/Pt – measure prices in relative sense - fixed PPF – finite inputs and given technology - perfect competition - input mobility - set of CICs - no movements of inputs btw countries - no trade barrier such as tax and quota - exports = imports same assumptions as classical model so far ! But slightly different from now on!
+ - 2 inputs and different K/L ratio btw countries – L paid in W(age) , K paid in R(ental payment). K/L ratio
was constant in the classical model - technology is transferable btw countries - good T is relatively labor intensive(LT > LS) and good S is capital intensive(KS > KT) So, KS/LS > KT/LT - country A is capital abundant relative to country B , country B is relatively labor abundant than country A Therefore, country A specializes on producing good S which is capital intensive, and country B produces
good T ; KA/LA > KB/LB ; A : rental payment R is relatively lower than W , B: wage, W, is relatively lower than R
- PPF is different : 1) increasing opportunity cost (bowed out) 2) shape is a little bit different based on labor/capital abundance (Draw the graph, it is in your note!)
- CIC is the same btw country A and B : consumers’ preference are the same in both countries. This implies comparative advantage and trade is determined only by the supply side, not the demand side. try to focus on the difference btw the classical model you have learned and HO model you are currently
learning. 2) HO Theorem Trade btw two countries is determined by 1. inputs : labor / capital abundant 2. input content in production : intensity of input capital(labor) abundant country will have comparative advantage in the capital(labor) intensive good. 2-1) pre-trade production and consumption # autarky equilibrium - Draw the PPF , relative price line and CIC for each country. What is the equilibrium point? (remember!
CICs for each country are the same, and relative price for country A is less steep than that of country B. Do you know why?)
2-2) trade! - trade will balance out relative price (relative price is same now!) - country A(B) exports good S(T) to country B(A) based on comparative advantage - with trade, demand for good S(T) increases above the domestic-only demand Ps(Pt) increases Ps/Pt
increases(decreases) in country A(B). - THERE IS NO COMPLETE SPACIALIZATION IN H-O MODEL!! - draw the trade triangle and explicitly show the exports and imports.
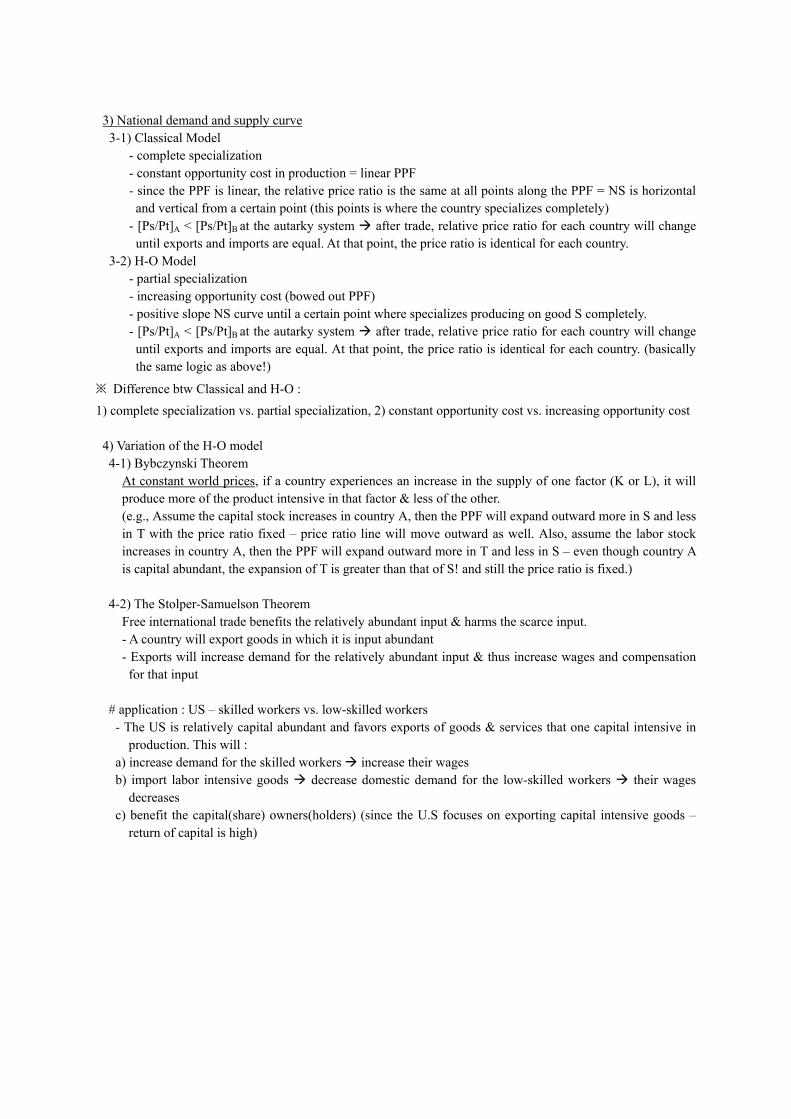
3) National demand and supply curve 3-1) Classical Model - complete specialization - constant opportunity cost in production = linear PPF - since the PPF is linear, the relative price ratio is the same at all points along the PPF = NS is horizontal
and vertical from a certain point (this points is where the country specializes completely) - [Ps/Pt]A < [Ps/Pt]B at the autarky system after trade, relative price ratio for each country will change
until exports and imports are equal. At that point, the price ratio is identical for each country. 3-2) H-O Model - partial specialization - increasing opportunity cost (bowed out PPF) - positive slope NS curve until a certain point where specializes producing on good S completely. - [Ps/Pt]A < [Ps/Pt]B at the autarky system after trade, relative price ratio for each country will change
until exports and imports are equal. At that point, the price ratio is identical for each country. (basically the same logic as above!)
※ Difference btw Classical and H-O :
1) complete specialization vs. partial specialization, 2) constant opportunity cost vs. increasing opportunity cost 4) Variation of the H-O model
4-1) Bybczynski Theorem At constant world prices, if a country experiences an increase in the supply of one factor (K or L), it will
produce more of the product intensive in that factor & less of the other. (e.g., Assume the capital stock increases in country A, then the PPF will expand outward more in S and less
in T with the price ratio fixed – price ratio line will move outward as well. Also, assume the labor stock increases in country A, then the PPF will expand outward more in T and less in S – even though country A is capital abundant, the expansion of T is greater than that of S! and still the price ratio is fixed.)
4-2) The Stolper-Samuelson Theorem Free international trade benefits the relatively abundant input & harms the scarce input. - A country will export goods in which it is input abundant - Exports will increase demand for the relatively abundant input & thus increase wages and compensation
for that input # application : US – skilled workers vs. low-skilled workers - The US is relatively capital abundant and favors exports of goods & services that one capital intensive in
production. This will : a) increase demand for the skilled workers increase their wages b) import labor intensive goods decrease domestic demand for the low-skilled workers their wages
decreases c) benefit the capital(share) owners(holders) (since the U.S focuses on exporting capital intensive goods –
return of capital is high)
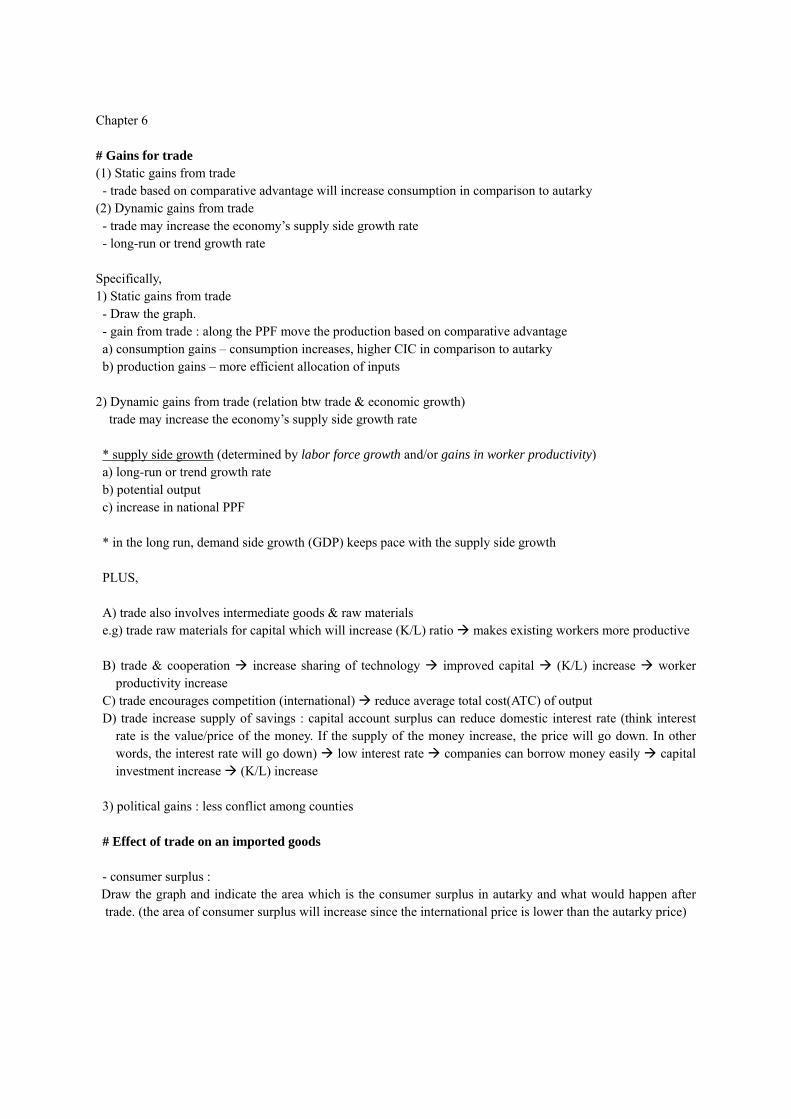
Chapter 6 # Gains for trade (1) Static gains from trade - trade based on comparative advantage will increase consumption in comparison to autarky (2) Dynamic gains from trade - trade may increase the economy’s supply side growth rate - long-run or trend growth rate Specifically, 1) Static gains from trade - Draw the graph. - gain from trade : along the PPF move the production based on comparative advantage a) consumption gains – consumption increases, higher CIC in comparison to autarky b) production gains – more efficient allocation of inputs
2) Dynamic gains from trade (relation btw trade & economic growth) trade may increase the economy’s supply side growth rate * supply side growth (determined by labor force growth and/or gains in worker productivity) a) long-run or trend growth rate b) potential output c) increase in national PPF * in the long run, demand side growth (GDP) keeps pace with the supply side growth PLUS, A) trade also involves intermediate goods & raw materials e.g) trade raw materials for capital which will increase (K/L) ratio makes existing workers more productive B) trade & cooperation increase sharing of technology improved capital (K/L) increase worker
productivity increase C) trade encourages competition (international) reduce average total cost(ATC) of output D) trade increase supply of savings : capital account surplus can reduce domestic interest rate (think interest
rate is the value/price of the money. If the supply of the money increase, the price will go down. In other words, the interest rate will go down) low interest rate companies can borrow money easily capital investment increase (K/L) increase
3) political gains : less conflict among counties # Effect of trade on an imported goods - consumer surplus : Draw the graph and indicate the area which is the consumer surplus in autarky and what would happen after trade. (the area of consumer surplus will increase since the international price is lower than the autarky price)

-For 2nd midterm-
*** KEEP IN MIND THAT DRAWING GRAGH IS THE BEST WAY TO EXPRESS YOUR IDEA
AND FIND OUT THE ANSWER ***
# Effect of trade
ㆍ[Imports]
Assume the small (open) economy,
domestic changes have no effect on the world price (country is the price taker)
- Draw the graph! (Indicate what is autarky price , world price, domestic demand and supply)
- trade benefits domestic consumers since they are able to buy goods in a cheaper price
+ trade also lower the domestic output
- Use “CONSUMER/PRODUCER SURPLUS” to measure benefits from trade
<before trade>
- Consumer surplus before trade would be the area blow the domestic demand curve and above the autarky price
- Producer surplus before trade is the area below the autarky price and above the domestic supply curve
<after trade>
- World price is cheaper than the autarky price
- Therefore consumer surplus would increase and producer surplus would decrease compare to that of autarky system. (find out the area which indicate the increment of CS and the decrement of PS)
- Based on the above result, what would be the net benefit from trade?
ㆍ[Exports]
- Draw the graph
(indicate the autarky price, world price, domestic production and consumption + find out the area of CS and PS)
- Since the world price is higher than the autarky price, producer surplus will increase after trade and consumer surplus will decrease. How much?
- What would be the net benefit from trade?
※ From trade some parties gain benefits and others in the domestic economy are damaged although on a net
basis there are gains. Thus losing parties try to reduce their losses by trade restriction such as TARIFFS and sometimes the government tries to protect their domestic industry by imposing QUOTAS.
c.f) tariff – tax on imports / but also can be imposed on exports, china for example, tariffed on rare earth exports.
the action of Chinese government increased the importing price of rare earth for manufacturing companies
# Tariff and its effect on welfare
ㆍ 3 types
- percentage based tax
- specific tariff – tariff in a specific amount
- compound tariff – combination of the two above
ㆍ Effect
- revenue effect : provide a source of tax revenue for the domestic economy (consumers pay a higher price and
the revenue can be redistributed)
ㆍ The welfare cost of tariffs
- Draw the graph (autarky price, world price before tariff, world price after the tariff, domestic supply and
demand before tariff and that of after tariff)
- How much the CS decrease and PS increase? What is the government surplus? And how much is the
deadweight loss?
ㆍ What if large country imposes tariffs on imported goods?
- with tariff, demand in large country goes down demand in small country where exports goods to big
country decreases lower prices in a small country global demand decreases world price goes down
(Pw + tariff) in a big country also decreases producers in a small country will share part of the cost of the
tariff. (due to the tax imposition of a large country, producers in the small country should inevitably take
responsible for that action)
# Quota and its effect on welfare
ㆍ3 types
- imposed on imports based on quantity
- based on value
- embargo : no imports(exports)
* tariff rate quotas : zero (or low) tariff on imports until quota is reached and then high-level tariff
ㆍ Quota effect on welfare
- Draw the graph (indicate the world price and its corresponding domestic production/consumption)
- What would happen if quotas are imposed on imports? What would happen to the price? (Increase? Decrease?)
- Try to find out the area of CS, PS and GS
(after quota, the price will go up CS decrease, PS increase and GS will increase if the government sells
import license)
- What area indicates the deadweight loss (DWL)?
(We can find out that if the government intervene the market, there will be DWL – lose market efficiency)
- If the government does not sell import license, there will be no government surplus, but instead it(area C in
class) will be the producer surplus since the price increases due to quotas.
# Export subsidy
- Payment from the government to the producing firms
e.g., The U.S government subsidizes agricultural industry such as cotton industry the world price is below the autarky price, but due to the subsidy Pwsub goes below the Pw (supply curve shifts to the right imposing subsidy causes low production cost) this happens because the U.S is the significant cotton producing nation export subsidy accelerates corporate farming, capital-intensive farming
Same logic! How would the subsidy of the U.S government on cotton industry influence on African countries that produces cotton? Ans: subsidy US cotton supply increase the world price will go down to the level of Pwsub (Pwsub < Pw) Pwsub < PAfrica African cotton producers cannot afford the new price since it is below their production cost (more specifically MC – marginal cost) African countries changes from exporter to importer African farmers may ask their government for help (subsidies) / may shut down (unemployed and migrate) / or foreign aid may happen (US Africa)
(in class, we have also have talked about McDonalds – corn subsidy as an actual example)
# International Trade Agreement (Ch.8)
ㆍ[GATT] (post WW2)
a) Limit trade barriers – tariff + quotas
b) System for dispute resolution
ㆍ[WTO] (replaced GATT)
157 countries as members
98% global trade
a) Limit trade restriction
b) Resolution of disputes
c) Does not conflict with domestic laws regarding environment protection, consumer & labor protection
# Dumping
: Selling in a foreign market below the production cost
- Draw a graph!
- Indicate the world price below the autarky price equilibrium. If the price is below (let’s say P1) the world price
what would be the increment/decrement of CS and PS respectively? Can you find out the area?
- What if the foreign companies set their goods price below the domestic supply curve? What would be their
intention?
Ans : Those foreign companies (exporting goods) intend to get monopolistic position in the domestic market (in
the importing country). Domestic companies may not be able to afford such low market price because of their
relatively high production price, so they may exit the market. After monopolize the market, foreign companies
would highly increase the price in order to maximize their profits and also offset their previous losses.
# Resource Paradox
The World Bank redefined Capital. There are 3 categories.
a) Produced capital : a nation’s existing capital stock & infrastructure – monetary value
b) Natural capital : known as natural resources (production and reserves at market price)
c) Intangible capital – essential/primary source of national wealth & growth!
c1) Social capital : value of nation’s financial system, communications
c2) Human capital : skills + education of a nation’s citizen
Using above 3 types of capital, measure nation’s wealth
: wealth per capita = total wealth of a nation (a+b+c in monetary basis) / population
In class, we talked about the Top 10 wealthiest countries and several Bottom countries. From the example, we
were able to find out that the abundance of natural resources cannot be the main driving force of the economic
growth.
# Reasons for resource paradox
a) Price fluctuation : Change in resource prices can result in variable revenues e.g) Mexico : 1970 - $3 / barrel 1973~1980 – OPEC controlled the global oil supply, price went up $35/b, because of this revenue windfall, the Mexican government expanded government expenditure to build new schools, hospitals, brides etc. Iraq-Iran War broke out. The two big oil producing countries sold more quantities of oil than the agreed amount in order to afford the cost of war. International oil price plummeted Mexico suddenly lost the revenue All infrastructures that are under construction stopped. Economic recession! b) Rent-seeking & Control of the resource : Pubic sector tries to keep/gain power. The main goal of the public sector is not maximizing profits, but to max power by the expansion of services, payroll and control of resources. e.g) (a) Venezuela – Chavez nationalize private sectors – control natural resource/distribution to gain and/or
maintain his power (b) Angola – abundant in oil and diamonds but used most of the revenues to finance the civil war.
c) Currency appreciation
: Net demand for the nation’s currency in the foreign exchange market currency appreciation [IMPORTS] - Lower the price of imports for domestic consumers. - This means domestic consumers would be able to pay less in terms of home currency for the imported
goods. [EXPROTS] - The price of domestic exports goes up in terms of foreign currency. - This means domestic producers who export their products lose “price competitiveness” in the foreign market because it will be expensive compare to other goods with similar quality.
[RESULT] 1) As the price of imports goes down, domestic consumer shift consumption away from domestic produced goods in favor of imports. hurt domestic firms except resource industry.
a) hold the price of domestic produced goods constant + b) lower import prices = import substitution!
2) The increase of price of exports (to foreign consumers) demand decreases for domestically produced goods.
∴ currency appreciation over time damage diversified industry only resource industry survives.
(extremely to say;;) Why this happens? Because there are constant demands for natural resources even the price goes up.
* Why is it resource paradox? Countries abundant in natural resources are more likely to rely on natural resources as time goes by even
though their domestic diversified industries (really important for the economic growth) are seriously damaged.
# Preferential Trade Arrangement (ch.9) e.g) NAFTA, EU, ASEAN Let’s think about the model that there are 3 countries A, B and C. - A: home (importing) country - Imports of the good from country B cost $2 and C for $1.50 each. - Draw graph! (A’s supply curve, demand curve. Indicate the autarky price, B and C’s exporting price) (case1) No tariff or quota for each country
Can you find out how much the import is from the graph you drew? (case2) Country A imposes a 100% tariff on imports from B and C. The price will double up for each country. What is the import? Does it increase or decrease? (case3) What if country B joins country A’s free trade arrangement so do not need to pay tariff? Compare to case1 and case2, does this change the situation? What is the import? You can do this by drawing a graph and indicate clearly.
-For 2nd midterm-
*** KEEP IN MIND THAT DRAWING GRAGH IS THE BEST WAY TO EXPRESS YOUR IDEA
AND FIND OUT THE ANSWER ***
# Effect of trade
ㆍ[Imports]
Assume the small (open) economy,
domestic changes have no effect on the world price (country is the price taker)
- Draw the graph! (Indicate what is autarky price , world price, domestic demand and supply)
- trade benefits domestic consumers since they are able to buy goods in a cheaper price
+ trade also lower the domestic output
- Use “CONSUMER/PRODUCER SURPLUS” to measure benefits from trade
<before trade>
- Consumer surplus before trade would be the area blow the domestic demand curve and above the autarky price
- Producer surplus before trade is the area below the autarky price and above the domestic supply curve
<after trade>
- World price is cheaper than the autarky price
- Therefore consumer surplus would increase and producer surplus would decrease compare to that of autarky system. (find out the area which indicate the increment of CS and the decrement of PS)
- Based on the above result, what would be the net benefit from trade?
ㆍ[Exports]
- Draw the graph
(indicate the autarky price, world price, domestic production and consumption + find out the area of CS and PS)
- Since the world price is higher than the autarky price, producer surplus will increase after trade and consumer surplus will decrease. How much?
- What would be the net benefit from trade?
※ From trade some parties gain benefits and others in the domestic economy are damaged although on a net
basis there are gains. Thus losing parties try to reduce their losses by trade restriction such as TARIFFS and sometimes the government tries to protect their domestic industry by imposing QUOTAS.
c.f) tariff – tax on imports / but also can be imposed on exports, china for example, tariffed on rare earth exports.
the action of Chinese government increased the importing price of rare earth for manufacturing companies

# Tariff and its effect on welfare
ㆍ 3 types
- percentage based tax
- specific tariff – tariff in a specific amount
- compound tariff – combination of the two above
ㆍ Effect
- revenue effect : provide a source of tax revenue for the domestic economy (consumers pay a higher price and
the revenue can be redistributed)
ㆍ The welfare cost of tariffs
- Draw the graph (autarky price, world price before tariff, world price after the tariff, domestic supply and
demand before tariff and that of after tariff)
- How much the CS decrease and PS increase? What is the government surplus? And how much is the
deadweight loss?
ㆍ What if large country imposes tariffs on imported goods?
- with tariff, demand in large country goes down demand in small country where exports goods to big
country decreases lower prices in a small country global demand decreases world price goes down
(Pw + tariff) in a big country also decreases producers in a small country will share part of the cost of the
tariff. (due to the tax imposition of a large country, producers in the small country should inevitably take
responsible for that action)
# Quota and its effect on welfare
ㆍ3 types
- imposed on imports based on quantity
- based on value
- embargo : no imports(exports)
* tariff rate quotas : zero (or low) tariff on imports until quota is reached and then high-level tariff
ㆍ Quota effect on welfare
- Draw the graph (indicate the world price and its corresponding domestic production/consumption)
- What would happen if quotas are imposed on imports? What would happen to the price? (Increase? Decrease?)
- Try to find out the area of CS, PS and GS
(after quota, the price will go up CS decrease, PS increase and GS will increase if the government sells
import license)
- What area indicates the deadweight loss (DWL)?
(We can find out that if the government intervene the market, there will be DWL – lose market efficiency)
- If the government does not sell import license, there will be no government surplus, but instead it(area C in
class) will be the producer surplus since the price increases due to quotas.
# Export subsidy
- Payment from the government to the producing firms
e.g., The U.S government subsidizes agricultural industry such as cotton industry the world price is below the autarky price, but due to the subsidy Pwsub goes below the Pw (supply curve shifts to the right imposing subsidy causes low production cost) this happens because the U.S is the significant cotton producing nation export subsidy accelerates corporate farming, capital-intensive farming
Same logic! How would the subsidy of the U.S government on cotton industry influence on African countries that produces cotton? Ans: subsidy US cotton supply increase the world price will go down to the level of Pwsub (Pwsub < Pw) Pwsub < PAfrica African cotton producers cannot afford the new price since it is below their production cost (more specifically MC – marginal cost) African countries changes from exporter to importer African farmers may ask their government for help (subsidies) / may shut down (unemployed and migrate) / or foreign aid may happen (US Africa)
(in class, we have also have talked about McDonalds – corn subsidy as an actual example)
# International Trade Agreement (Ch.8)
ㆍ[GATT] (post WW2)
a) Limit trade barriers – tariff + quotas
b) System for dispute resolution
ㆍ[WTO] (replaced GATT)
157 countries as members
98% global trade
a) Limit trade restriction
b) Resolution of disputes
c) Does not conflict with domestic laws regarding environment protection, consumer & labor protection
# Dumping
: Selling in a foreign market below the production cost
- Draw a graph!
- Indicate the world price below the autarky price equilibrium. If the price is below (let’s say P1) the world price
what would be the increment/decrement of CS and PS respectively? Can you find out the area?
- What if the foreign companies set their goods price below the domestic supply curve? What would be their
intention?
Ans : Those foreign companies (exporting goods) intend to get monopolistic position in the domestic market (in
the importing country). Domestic companies may not be able to afford such low market price because of their
relatively high production price, so they may exit the market. After monopolize the market, foreign companies
would highly increase the price in order to maximize their profits and also offset their previous losses.

# Resource Paradox
The World Bank redefined Capital. There are 3 categories.
a) Produced capital : a nation’s existing capital stock & infrastructure – monetary value
b) Natural capital : known as natural resources (production and reserves at market price)
c) Intangible capital – essential/primary source of national wealth & growth!
c1) Social capital : value of nation’s financial system, communications
c2) Human capital : skills + education of a nation’s citizen
Using above 3 types of capital, measure nation’s wealth
: wealth per capita = total wealth of a nation (a+b+c in monetary basis) / population
In class, we talked about the Top 10 wealthiest countries and several Bottom countries. From the example, we
were able to find out that the abundance of natural resources cannot be the main driving force of the economic
growth.
# Reasons for resource paradox
a) Price fluctuation : Change in resource prices can result in variable revenues e.g) Mexico : 1970 - $3 / barrel 1973~1980 – OPEC controlled the global oil supply, price went up $35/b, because of this revenue windfall, the Mexican government expanded government expenditure to build new schools, hospitals, brides etc. Iraq-Iran War broke out. The two big oil producing countries sold more quantities of oil than the agreed amount in order to afford the cost of war. International oil price plummeted Mexico suddenly lost the revenue All infrastructures that are under construction stopped. Economic recession! b) Rent-seeking & Control of the resource : Pubic sector tries to keep/gain power. The main goal of the public sector is not maximizing profits, but to max power by the expansion of services, payroll and control of resources. e.g) (a) Venezuela – Chavez nationalize private sectors – control natural resource/distribution to gain and/or
maintain his power (b) Angola – abundant in oil and diamonds but used most of the revenues to finance the civil war.
c) Currency appreciation
: Net demand for the nation’s currency in the foreign exchange market currency appreciation [IMPORTS] - Lower the price of imports for domestic consumers. - This means domestic consumers would be able to pay less in terms of home currency for the imported
goods. [EXPROTS] - The price of domestic exports goes up in terms of foreign currency. - This means domestic producers who export their products lose “price competitiveness” in the foreign market because it will be expensive compare to other goods with similar quality.
[RESULT] 1) As the price of imports goes down, domestic consumer shift consumption away from domestic produced goods in favor of imports. hurt domestic firms except resource industry.
a) hold the price of domestic produced goods constant + b) lower import prices = import substitution!
2) The increase of price of exports (to foreign consumers) demand decreases for domestically produced goods.
∴ currency appreciation over time damage diversified industry only resource industry survives.
(extremely to say;;) Why this happens? Because there are constant demands for natural resources even the price goes up.
* Why is it resource paradox? Countries abundant in natural resources are more likely to rely on natural resources as time goes by even
though their domestic diversified industries (really important for the economic growth) are seriously damaged.
# Preferential Trade Arrangement (ch.9) e.g) NAFTA, EU, ASEAN
Let’s think about the model that there are 3 countries A, B and C.
- A: home (importing) country - Imports of the good from country B cost $2 and C for $1.50 each. - Draw graph! (A’s supply curve, demand curve. Indicate the autarky price, B and C’s exporting price) (case1) No tariff or quota for each country
Can you find out how much the import is from the graph you drew? (case2) Country A imposes a 100% tariff on imports from B and C. The price will double up for each country. What is the import? Does it increase or decrease? (case3) What if country B joins country A’s free trade arrangement so do not need to pay tariff? Compare to case1 and case2, does this change the situation? What is the import? You can do this by drawing a graph and indicate clearly. # Trade & Growth (ch.10) (Kind of Review) [Trade model] <Basic settings> - Two goods : S-capital intensive , T-labor intensive - Two inputs : K, L - Country : relatively labor abundant Step1) You can draw PPF which favors labor intensive good T. Step2) Also draw indifference curve which is tangent to the relative price line and the PPF curve. Step3) You can figure out the amount of export and import. (export T and import S / we are assuming a small open economy which takes the price of S as given) [Growth] 1) Rybczynski Theorem As one input (K or L) increases, the PPF expansion will favor the good whose production is relatively intensive in the input that is increasing. 2) If both K and L increase at a proportional rate to the existing K/L ratio, the PPF expands retaining the same shape. Based on the graph you drew above, by following step1~3, you can also draw the production expansion line and also the consumption expansion line which is linear, if PPF curve expands retaining the same shape.
3) Long term Econ growth ; Rapid growth in developing countries reduces gap with developed countries – convergence c.f) Convergence – slowing of growth in developing countries as living standards (GDP per capita) are getting
close to that of developed countries.
c.f) Growth Accounting - ∆ ∆ ∆ ∆
∆
outputgrowth ∆
∆
∆
- Growth accounting shows how much each labor and capital are able to explain the total output growth. - Technology is embedded in capital stock.
- Y = F(K,L) ; output is the function of K and L e.g) Cobb-Douglas production function Y=(A - Aggregate production function shows how productivity & output depend on: a) K/L ratio ~ quantity of capital used by a typical worker b) Human capital (avg. skills and education per labor force) per worker c) Technological rate given level - Worker productivity = a) + b) + c) - As K/L increases worker productivity and output per worker increases - Diminishing returns to physical capital (we are assuming that MPK (marginal product of capital) decreases as
capital increases by 1 unit) # Saving & Growth s : saving rate / y : income S=sy (saving rate) x (income or output per person) S=I (closed economy) ; firms borrow money from the bank that you deposit your money I : investment in physical capital S can be used for (in terms of I) : a) Replace depreciated capital b) Equip new workers c) Upgrade existing capital stock to utilize better technology a), b) and c) maintain existing K/L ratio d) After satisfying from a) through c), surplus saving may increase K/L ratio # Economic development (3 cases) 1) Steady state country (developed country) 2) High saving LDC (less developed country) 3) Low saving LDC Before to proceed, - Supply side growth – a) labor force growth + b) gains from worker productivity (see above about worker
productivity) - Demand side growth – a nation’s actual output as measured by GDP - In the long run, demand side growth keeps pace with supply side growth Demand side > supply side : inflation problem Supply side > demand side : expansion policy needed for decrease the rate of unemployment - Total saving = private + public + net-foreign saving (Case1) Steady state country (S=I) a) Replace depreciated capital b) Equip new worker with their share of capital c) upgrade existing capital stock for new tech.
d) K/L constant * supply side growth = labor force growth + worker productivity growth (physical + human capital) (Case2) High saving LDCs Total saving will finance a)~c) and K/L will increase! * supply side growth = labor force growth + worker productivity growth (includes K/L growth) (Case3) Low saving LDCs Saving is too low to satisfy a)~c) and eventually, K/L will decrease * supply side growth = labor force growth (+) + gains in worker productivity (-) < 0 divergence happens! We have talked that saving is the crucial driving force of economic growth. Then how would low saving LDCs increase savings? As mentioned above, savings are comprised of private saving, public saving and foreign saving. The first two would be low since the people are so poor. Thus the government should encourage foreign companies to make investment by imposing tax cut or subsidies. For the FDI (Foreign Direct Investment) Security, Honest government, infrastructure, education, human rights, labor standards, lack of discrimination, financial system etc., should be met since all of these are closely related to profits of the firms. # Empirics - Federal Reserve : supply side growth of the U.S from 3% to 2% ~ slow down in the labor force growth (What was supply side growth? ~ supply side growth = pop growth + worker productivity) - Reasons: 1) Decrease in domestic birth rate 2) Ageing of the population 3) Lower labor force participation rate - Why is it a problem? Slow down supply side growth slow down demand side growth wealth (capital) accumulation decreases national growth slows down - Can anything be done to increase the supply side growth given demographic labor force trends? a) educate the young to be more productive b) immigrate more people to substitute the domestic workers # Outsourcing & Insourcing [Outsourcing] Example : Textiles England New England Southern America From 1990s, job moves to overseas ~ outsourcing started. Why? Firms try to reduce production costs, so they are likely to employ workers with lower wages in the foreign country. 1) Mexico joined NAFTA in1994 : tariffs decreased on Mexico imports into the U.S firms produced goods from Mexico and imported back to the U.S
2) Financial crisis in Asia in the late 1990s : the depreciation of Asian currencies reduced production costs in many Asian countries by 30~40% for the U.S firms.
3) China joined WTO in 2001 : Eliminate U.S quotas on imports from China & decrease or eliminate tariffs on imports from China.
American-made clothing in 1991 ~ 56% in 2012 ~ 2.5%
From 1990 to 2012 ~ loss of 5.8m jobs in the U.S manufacturing / 76.5% jobs lost in textiles & apparels [Insourcing] The advantage of moving manufacturing back to the U.S. 1) Reduce transportation costs 2) Better infrastructure more productive 3) Automation ~ capital displacing labor force. 3-1) labor skills are increasingly important : U.S is better to get high-skilled workers 3-2) power : electricity now has a greater share of production costs 4) Lower energy cost 5) Short lifespan of many products reduce turnaround time with domestic production 6) Inventories : able to flexibly control of production amount and reduce the cost caused by inventories Ex) Parkdale Mills (South Carolina) Produces 2.5m/lbs of yarn a week with 140 workers to produce the same output in 1980 when over 2000 workers were required. # Marginal Product of Labor (MPL)
MPL ∆ ∆
: MPL indicates how much product would increase if there is an increment of one unit of labor with capital stock constant.
Mostly, we assume MPL diminishes. (MPL decreases as Labor increases)
- VMPL = P ⅹ MPL ~ market value of the marginal product of labor
- VMPL = MR (marginal revenue) to the firm from hiring an additional worker - W = wage of worker ~ MC (marginal cost) from hiring an additional worker - Profit maximization (VMPL =) MR = MC If, VMPL > MC MR > MC ; increase output , hire more workers until (VMPL=)MR=MC - Try to draw the graph ; since MPL decreases, VMPL would have negative slope ; put labor on the x-axis and wage on the y-axis ; try to find the area of 1) share of the values of output earned by worker 2) capital share 3) labor share ; if there are immigrants who have similar skills to domestic labor, labor amount will increase. ; what would be the area that shows wages paid to immigrant workers? / what area shows additional payment
to capital? ; Due to the increment of labor supply, wages for workers would decrease. To avoid losses, VMPL should
increase. This can be realized by 1) inflation (increase of P) 2) increase MPL by adding capital and/or worker training
Empirics
1) TR = PⅹQ
; with an increase in the inflation rate ~ P goes up TR increases With an increase in worker productivity ~ Q goes up TR increases 2) Wages & productivity Wages increase due to a) inflation b) gains in worker productivity if a) is true, maintain constant real income (W/P) W~ nominal wage a) & b) is true, real income increases
if workers are only compensated for a) inflation, b) gains from worker productivity goes to the owner of capital and that increases the profit for the firm. Empirically, the real hourly wage for the median worker grew by 10% while the worker productivity was almost 80% during 1978 ~ 2009 almost all the gain of worker productivity goes to employers. Since 1978, almost all the gains in worker productivity have gone to a) firms ~ increased profits , most dividends went to b) the top executives and managers Reasons: 1) tax policy : favoring the top 10% 2) outsourcing of lower-skilled jobs (the table in class shows productivity growth is decreasing from 1950s ~70s) 3) lobby 4) union power got weak 5) technology & automation 6) immigration c.f about 2) [Outsourcing] 1979 : peak of US manufacturing / employment ~ 19.6m jobs in the sector 1980 : steadily decline 2000~ : pace of job loss in manufacturing 7 times faster [Manufacturing life cycle] by Raymond Vernon 1) US advantage in developing new, high value products : wealth ~ finance R&D
Local production ~ can rapidly revise products 2) As the market enlarges & production gets standardized ~ expand production to other wealthy countries to
gain access to markets 3) Other firms produce similar products, cost of the product gets important as the competition gets harsh To increase profits firms need to decrease costs [Insourcing] GE (General Electronics) There were 6 manufacturing building 1955 ~ 16,000 workers 1973 ~ 23,000 2011 ~ 1,863 workers , only 1 of 6 plants in operation 2012 insourcing started 2012 ~ +1 plant 2013 ~ +1 plant By the end of 2014, about 75% of GE appliances will be produced in the US [Reasons for insourcing] 1) Transportation cost 2) Automation (power cost critical US produce electricity in cheap price) 3) Foreign wages increased 4) Labor productivity increased in the US 5) Life cycle of the product shortened 6) Technology (necessity to protect the tech, outsourcing is hard to do it)
# Account (ch.11) 1) Current account (about goods & services) NX = Exports – Imports ,
2) Capital account (monetary flows – finance & saving)
Foreign Direct Investment (installment of capital abroad)
3) BOP (Balance of Payments) Current account + Capital account
1) Current account (relates to Trade!) 1-a) Important factors that relates to the current accounts a) Comparative advantage : influenced by exchange rate, skills of labor force, natural resources etc. b) Tariff & Quotas c) Economic growth income increase imports goes up
Long-run supply side growth d) Inflation rate : inflation production cost increase more import , less export
(prices of domestically-made goods increase holding import prices constant relative prices of imports↓)
1-b) Current account deficit - NX = exports – imports < 0 (deficit) + NX = exports – imports > 0 (surplus) 2) Capital account – related words : savings, banks, bonds, stocks, financial products etc. 2-a) Return on saving (interest rate) – direct foreign investment 2-b) Flight to safety to minimize risks
e.g. Greece – purchasing power decreased, so people move their money out of their country # Foreign Exchange Rate (ch.12) Definition : the value of on currency in terms of another - Commercial banks Foreign exchange market ~ $4 trillion moves daily Competitive market Homogenous goods (money) No government intervention - Major currencies transactions 1. US $ (84.9%) 2. Euro (39.1%) 3. Yen (19%) 4. Pound (12.9%) - Spot exchange rate e.g. Jan 2001 : $1 = ₡ 1.06 ; ₡ 1 = $ 0.94 Jan 2002 : $1 = ₡ 1.13 ; ₡ 1 = $0.88 (purchasing power of dollar increased – appreciation) Jan 2013 : $1 = ₡ 0.75 ; ₡ 1 = $ 1.34 (dollar depreciated , euro appreciated)
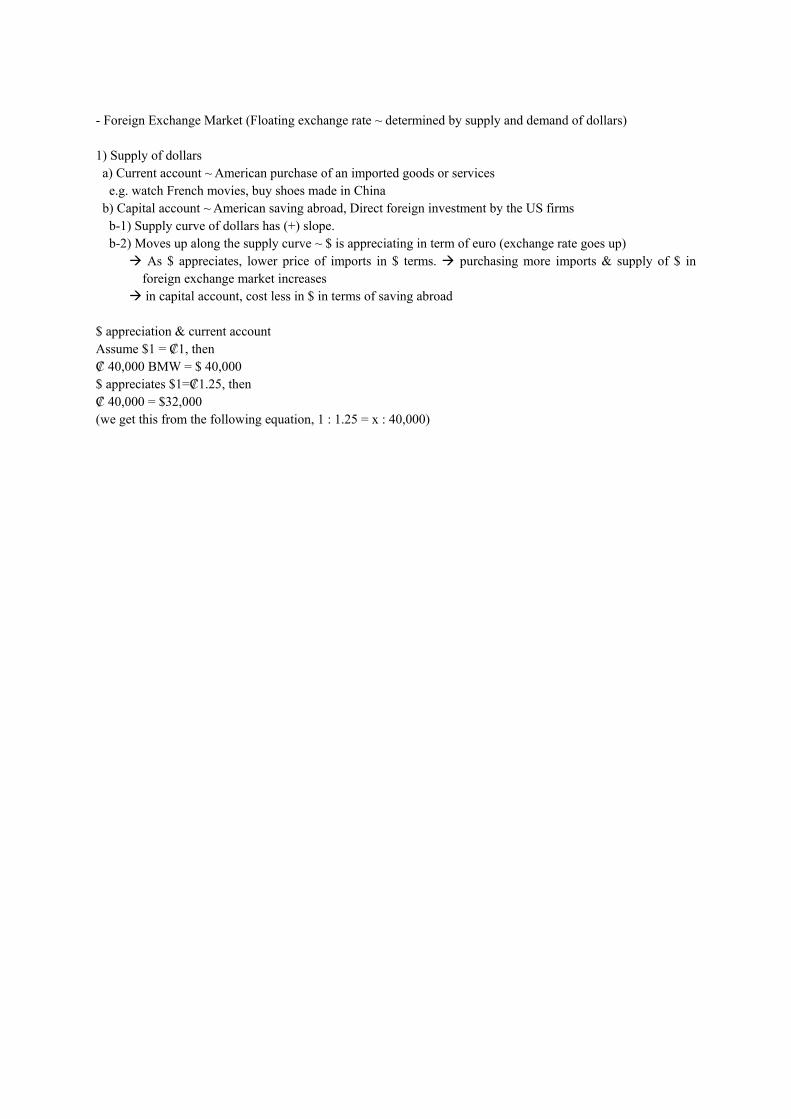
- Foreign Exchange Market (Floating exchange rate ~ determined by supply and demand of dollars) 1) Supply of dollars a) Current account ~ American purchase of an imported goods or services e.g. watch French movies, buy shoes made in China b) Capital account ~ American saving abroad, Direct foreign investment by the US firms
b-1) Supply curve of dollars has (+) slope. b-2) Moves up along the supply curve ~ $ is appreciating in term of euro (exchange rate goes up) As $ appreciates, lower price of imports in $ terms. purchasing more imports & supply of $ in
foreign exchange market increases in capital account, cost less in $ in terms of saving abroad $ appreciation & current account Assume $1 = ₡1, then ₡ 40,000 BMW = $ 40,000 $ appreciates $1=₡1.25, then ₡ 40,000 = $32,000 (we get this from the following equation, 1 : 1.25 = x : 40,000)