chapter 8 · 2014-09-15 · this means shifting the production possibility frontier (ppf) outwards...
TRANSCRIPT

chapter 8
313chapter 8 Development economics
Development economics
There is great inequality in income and material living standards between those in rich and poor countries.
8.1 Defining economic development and the role of development economics
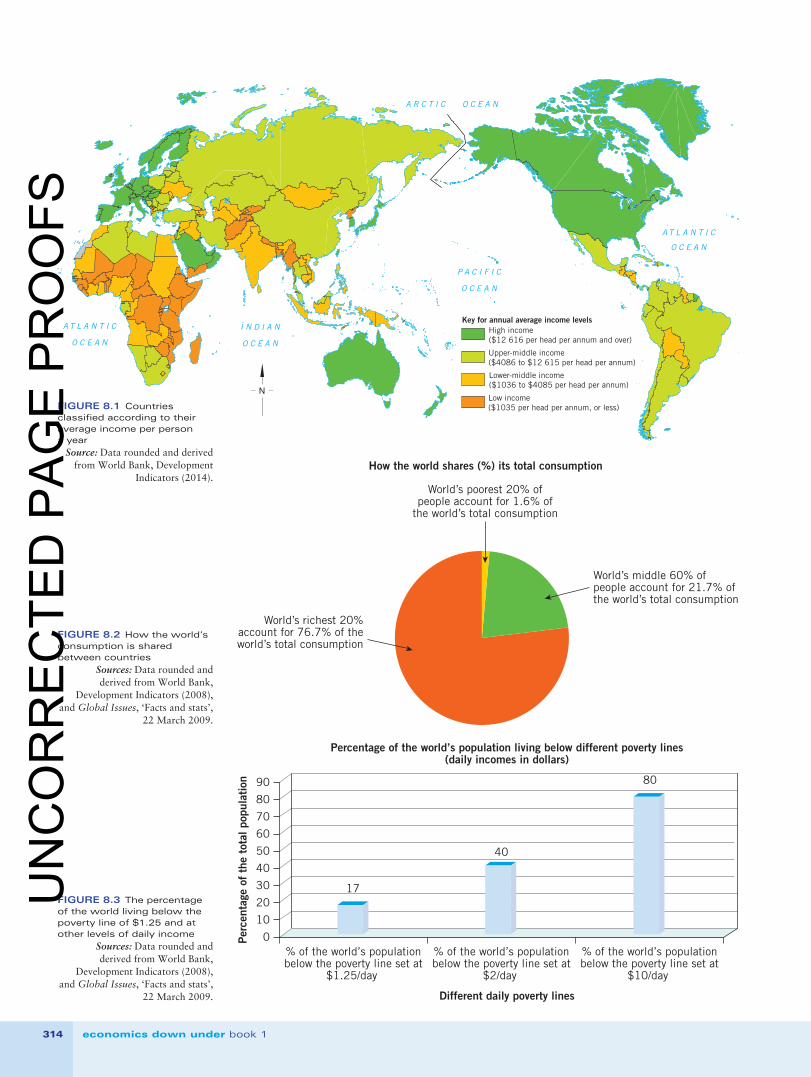
It is a sad fact that, for around 60 per cent of the world’s 7.4 billion people, life is a real struggle and living standards are low. Indeed, it is surely a great obscenity that many people in high-income nations grow obese from endless consumption, while those in low-income countries suffer great physical deprivation, poverty, hunger, inequality, insecurity, poor health, illiteracy, persecution, and the absence of hope and opportunity. Here, we think of the low-income countries in Africa, parts of Asia and South America. The world map in fi gure 8.1 (p. 314) shows all countries classifi ed by whether they are low income (shaded in brown), lower middle (in light brown), upper middle (in light green) or high income (in dark green). By way of defi nition, in 2014, the World Bank defi ned low-income countries as those where people subsist on a mere $2.80 or less per day (i.e. an average of $1035 per person a year or less), as opposed to high-income countries where average incomes are over $12 616 per person a year. In addition, fi gure 8.2 (p. 314) reveals the staggering differences in world consumption levels by high-, middle- and lower-income countries, while fi gure 8.3 (p. 314) displays the percentage of the world’s population living below different poverty lines (income measured at $1.25, $2 and $10 per day). Notice that using $1.25 per person per day ($456.25 per person per year) as the poverty line, around 15 per cent of the world’s population is now classifi ed as living in extreme poverty.
High-income nations are currently defi ned as those where average incomes are over $11 456 per person a year
Low-income countries are those where people subsist on a mere $2.80 or less per day and where, typically, there is great physical deprivation, poverty, hunger, inequality, insecurity, poor health, illiteracy, persecution, and the absence of hope and opportunity.
c08DevelopmentEconomics.indd 313 12/09/14 7:13 AM
UN
CO
RR
EC
TED
PA
GE
PR
OO
FS
314 economics down under book 1
A R C T I C O C E A N
A T L A N T I C
O C E A N
I N D I A N
O C E A N
P A C I F I C
O C E A N
A T L A N T I C
O C E A N
N
High income($12 616 per head per annum and over)
Key for annual average income levels
Upper-middle income($4086 to $12 615 per head per annum)
Lower-middle income($1036 to $4085 per head per annum)
Low income($1035 per head per annum, or less)
World’s richest 20%account for 76.7% of theworld’s total consumption
World’s middle 60% ofpeople account for 21.7% ofthe world’s total consumption
World’s poorest 20% ofpeople account for 1.6% of
the world’s total consumption
How the world shares (%) its total consumption
Per
cent
age
of t
he t
otal
pop
ulat
ion
Different daily poverty lines
Percentage of the world’s population living below different poverty lines(daily incomes in dollars)
% of the world’s populationbelow the poverty line set at
$1.25/day
% of the world’s populationbelow the poverty line set at
$2/day
% of the world’s populationbelow the poverty line set at
$10/day
0
10
20
30
40
50
60
70
80
90
17
40
80
FIGURE 8.1 Countries classified according to their average income per person a year
Source: Data rounded and derived from World Bank, Development
Indicators (2014).
FIGURE 8.2 How the world’s consumption is shared between countries
Sources: Data rounded and derived from World Bank,
Development Indicators (2008), and Global Issues, ‘Facts and stats’,
22 March 2009.
FIGURE 8.3 The percentage of the world living below the poverty line of $1.25 and at other levels of daily income
Sources: Data rounded and derived from World Bank,
Development Indicators (2008), and Global Issues, ‘Facts and stats’,
22 March 2009.
c08DevelopmentEconomics.indd 314 12/09/14 7:13 AM
UN
CO
RR
EC
TED
PA
GE
PR
OO
FS

315chapter 8 Development economics
This chapter is about development economics. Development economists try to under-stand the obstacles that slow improvements in general living standards in low-income countries. Armed with this knowledge, they then use theories to suggest practical strat-egies and policies that aim to accelerate economic development.
The term development, however, is quite hard to define, and its meaning has changed significantly over the past 30 to 40 years. Until the 1970s, it was taken purely in the economic sense. In other words, economic development in low-income countries simply involved growing the size of their economies or GDPs between one year and the next (preferably at a faster rate than the rise in their population). With each person having access to more goods and services, or higher average incomes, it was felt that society would generally be better off economically. You may recall from chapter 2 that econ-omic growth (and improved material living standards) ultimately involves expanding the nation’s productive capacity. This means shifting the production possibility frontier (PPF) outwards and to the right, as shown in figure 8.4 below, through improvements in the volume or efficiency of resources.
productionof services
Annual
Annualproductionof goods
Economic development may occur when thereis economic growth and a bigger PPF.
A country’s originalproductive capacitybefore economicgrowth occurs
0
A country’s new PPFafter there has beenstrong economic growthand the expansion ofproductive capacity
A person’s slice of the ‘production/income pie’before economic growth occurs
A person’s slice of the ‘production/income pie’after strong economic growth lifts national
output and income
In other words, by promoting economic growth, it was believed that this would lead to more development and generally better living standards. It was assumed that the benefits of this process would eventually trickle down and help ordinary people have better lives, by creating employment and higher incomes, reducing poverty and illit-eracy, lifting health and extending life expectancy.
By the early 1980s, this rather narrow view about development had changed. Devel-opment economists still thought that promoting economic growth and increased pro-ductive capacity were very important for development, but it was only one of several things needed to radically improve the daily lives of billions of people. This change in definition occurred because, despite good economic growth in some low-income countries, general living standards for most remained pathetically low with much poverty, malnutrition, unemployment, illiteracy, low life expectancy, poor health, inequality, repression of freedom and limited opportunities. It was finally realised that economic development involved not just economic progress, but also broader changes to social, political and institutional frameworks. Interestingly, at this time, economists and others in the United Nations and elsewhere were developing new
Development economics uses economic theory to come up with practical strategies and policies designed to increase development and improve the overall living standards of people in low-income nations.
Development is nowadays seen as the economic, social, political and institutional changes needed in low-income countries to improve material and non-material elements affecting the quality of daily life.
FIGURE 8.4 How growing the size of the economy’s productive capacity can lift incomes and improve living standards
The trickle down theory believes that the benefits of economic growth and development will not just benefit the rich but, given time, will eventually improve the daily existence of the poor.
c08DevelopmentEconomics.indd 315 12/09/14 7:13 AM
UN
CO
RR
EC
TED
PA
GE
PR
OO
FS
316 economics down under book 1
measures of a nation’s success. One of these is called the human development index (HDI). Another more recent measure of progress is through the achievement of the UN’s millennium development goals. As we shall see soon in section 8.2, these and other indicators of progress have helped create a broad definition of development. It is now defined as the economic, social, political and institutional changes needed in low-income countries to improve material and non-material aspects affecting the quality of daily life.
• Try applied economic exercise 1, p. 339
• Try class debate 1, pp. 342–3
• Try analysis of visual evidence — using written and statistical evidence about global social and economic conditions, pp. 344–5
8.2 Measurement of developmentWe now know that development refers to the economic, social, political and insti-tutional changes needed in low-income countries to improve material and non-material aspects affecting the quality of daily life. Measuring development is not as easy as it might seem, especially if it is condensed into a composite or single statistical indicator (as opposed to using a broad range of measures).
GDP as a measure of developmentTraditionally, development was measured by the growth in the average level of gross domestic product per capita (i.e. the annual value of GDP or national production divided by the total population size). It was thought that increases in this indicator would eventually lead to generally higher incomes, increased consumption, reduced poverty rates and better material living standards. However, although this measure does tell us something about changes in a country’s average living standards, it is very limited for the following reasons:• The problem of unrecorded subsistence production. GDP only measures the value of
goods and services produced and exchanged in the economy. Because a large per-centage of the population in low-income countries is involved in subsistence pro-duction that is never marketed or sold, GDP per capita is likely to be an underestimation of actual levels of economic welfare.
1 What are the main differences between low-income and high-income countries?
2 Define clearly what is meant by economic development, noting how this definition has changed over the decades.
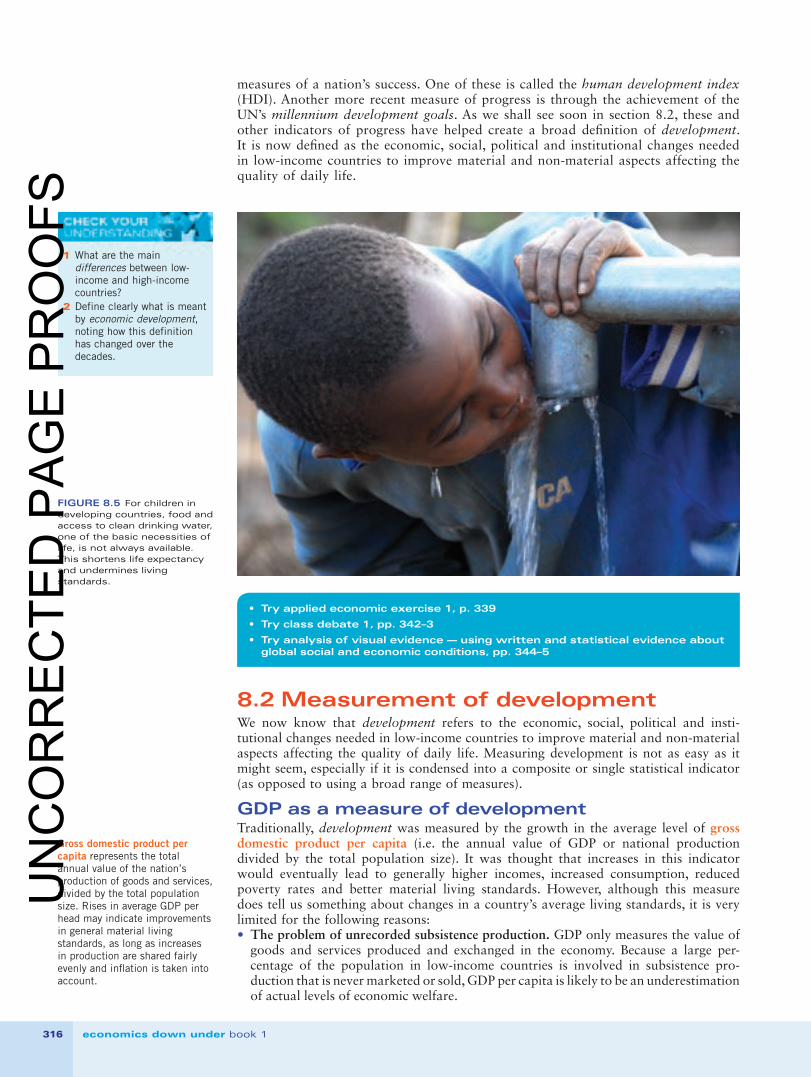
FIGURE 8.5 For children in developing countries, food and access to clean drinking water, one of the basic necessities of life, is not always available. This shortens life expectancy and undermines living standards.
Gross domestic product per capita represents the total annual value of the nation’s production of goods and services, divided by the total population size. Rises in average GDP per head may indicate improvements in general material living standards, as long as increases in production are shared fairly evenly and inflation is taken into account.
c08DevelopmentEconomics.indd 316 12/09/14 7:13 AM
UN
CO
RR
EC
TED
PA
GE
PR
OO
FS

317chapter 8 Development economics
• The problem of distribution. Average GDP per capita fails to take account of how evenly or unevenly goods, services and incomes are distributed or shared among all members of the population. Most low income countries have extreme inequality, where the poorest 20 per cent of the population receives perhaps less than 4 per cent of the nation’s income cake. Average GDP per capita is, therefore, a very inadequate guide of people’s access to basic goods and services.
• Negative externalities. On its own, GDP does not consider the costs to society and the environment (i.e. called negative externalities) of production or economic progress, yet such costs are often very high in low-income countries due to overpopulation.
• No consideration of the quality of daily lives. Importantly, GDP fails to accurately tell us whether the daily lives of ordinary people are getting better in terms of life expec-tancy, health, access to clean water, standards of food and nutrition, poverty rates, justice, freedom and democracy, security, human rights, opportunities for women, edu-cation and literacy.
Hence, while the level of GDP per capita is very important for our wellbeing, econ-omists need to use much broader measures of development. One of these is called the human development index.
The human development index as a measure of developmentThese days, the human development index (HDI) is the most widely used measure of the level of development. Each year, the United Nations Development Program calculates an HDI for most countries and then ranks these from highest to lowest (using a scale where 1.00 equals the highest and 0.00 the lowest level of development). Data is pub-lished annually in the Human Development Report. As outlined below, the HDI is constructed to reflect both economic and social indicators:• The economic indicator used in the HDI. As expected, GDP per capita (similar in
meaning to average income per person) is included in the HDI. However, this figure is adjusted or standardised to remove variations in the actual purchasing power of money in different countries (called purchasing power parity or PPP, expressed in US$).
• Social indicators used in the HDI. Two key social measures of economic development are also used in the HDI including life expectancy (calculated at birth and expressed in years) and education standards (shown by adult literacy rates expressed as a per-centage of those aged 15 years and over and by the combined secondary and tertiary school enrolments).
International comparisons of economic developmentFigure 8.6 (p. 318) shows the HDI for selected countries. However, while acknowl-edging that the HDI is much better than using only average GDP per capita as an indi-cator of development, the measure has its critics. Perhaps the main weakness of this indicator is that it is impossible to accurately condense the many dimensions of devel-opment for a country into a single figure that is internationally comparable. They note that the HDI is too simplistic because only three aspects of development are taken into account and GDP per capita, with all its flaws, is still one of these elements.
Millennium development goals and their measurementIn September 2000, 189 countries agreed to eight key Millennium Development Goals (MDGs) proposed by the United Nations for achievement by the year 2015. In turn, these eight goals are broken down into 21 targets that can be measured using 60 indicators of people’s wellbeing and daily existence (this broader approach to measurement differs from the single index approach used in GDP or the HDI). The eight basic goals (and how they are measured) are outlined in figure 8.7 (p. 319).
Recently, a UN report was prepared covering the first 10 years of the plan. It showed significant progress in achieving some of the UN’s development goals. For instance, the aim of halving global poverty rates (i.e. those living on less than US$1.25 per day in PPP terms) has now been achieved as shown in figure 8.8 (p. 319), but this has been especially due to progress in Asia rather than in Africa.
The human development index (HDI) is a measure used to indicate changes in the level of nations’ living standards based on progress across a range of economic and social indicators. Countries are ranked from highest to lowest using a scale where 1.00 equals the highest HDI and 0.00 the lowest level of development.
Millennium Development Goals (MDGs) involve setting national targets in eight key areas (ending hunger and poverty, universal education, gender equity, reduced child mortality, improved maternal health, environmental sustainability and development of global partnerships) affecting people’s wellbeing and the quality of their daily existence.
c08DevelopmentEconomics.indd 317 12/09/14 7:13 AM
UN
CO
RR
EC
TED
PA
GE
PR
OO
FS

318 economics down under book 1
A R C T I C O C E A N
A T L A N T I C
O C E A N
I N D I A N
O C E A N
P A C I F I C
O C E A N
A T L A N T I C
O C E A N
N
Key for Human Development Indexes
0.900 and over
0.850–0.899
0.800–0.849
0.750–0.799
0.700–0.749
0.650–0.699
0.600–0.649
0.550–0.599
0.500–0.549
0.450–0.499
0.400–0.449
0.350–0.399
0.349 and under
Data unavailable
Ranked comparisons of human development indexes in selected countries or regions for 2012(where an index of 0.00 is the lowest and 1.00 is the highest)
0 0.1 0.2 0.3 0.4 0.5 0.6 0.7 0.8 0.9
0.955
0.938
0.905
0.937
0.782
0.699
0.682
0.554
0.466
0.449
0.434
0.456
0.397
0.396
0.304
1
Norway (world rank, no. 1)
Australia (world rank, no. 2)
USA (world rank, no. 3)
High income countries
Saudi Arabia (world rank, no. 57)
China (world rank, no. 101)
The world
India (world rank, no. 136)
Least developed countries
Low income countries
Uganda (world rank, no. 161)
Rwanda (world rank, no. 167)
Zimbabwe (world rank, no. 172)
Ethiopia (world rank, no. 173)
Mozambique (world rank, no. 185)
Niger (world rank, no. 186)
HDI score (between 0.00 and 1.00)
0.304
0.327
Congo Democratic Republic (world rank, no. 187)
FIGURE 8.6 International comparisons of the human development index for selected countries.
Sources: Map copied directly from en.wikipedia.org/wiki/File:UN_Human_Development_Report_2013.svg. Taken from the article en.wikipedia.org/wiki/List_of_countries_by_Human_Development_Index. Data for the graph was derived from Human Development Report, 2012, Statistical Index, published for the United Nations
Development Program (UNDP), table 1, pp. 15–19, 2012 (HDI data quoted from several sources, see http://hdr.undp.org/en/media/HDR2013_EN_Summary.pdf).
c08DevelopmentEconomics.indd 318 12/09/14 7:13 AM
UN
CO
RR
EC
TED
PA
GE
PR
OO
FS

319chapter 8 Development economics
The Millennium Development Goals (MDGs) are a set of global development objectives to be achieved by 2015 that were unanimously adopted at the United Nations Millennium Summit in September 2000. They represent an unprecedented global unifying force for reducing poverty and improving human development. Progress towards the goals is measured against a number of targets, shown here, which were developed during and after the Summit.
1 End Poverty and Hunger
• Halve, between 1990 and 2015, the proportion of people whose income is less than one dollar a day.
• Achieve full and productive employment and decent work for all, including women and young people.
• Halve, between 1990 and 2015, the proportion of people who suffer from hunger.
2 Universal Education
• Ensure that, by 2015, children everywhere, boys and girls alike, will be able to complete a full course of primary schooling.
3 Gender Equality
• Eliminate gender disparity in primary and secondary education, preferably by 2005, and in all levels of education no later than 2015.
4 Child Health • Reduce by two thirds, between 1990 and 2015, the under-five mortality rate.
5 Maternal Health
• Reduce by three quarters the maternal mortality ratio.• Achieve universal access to reproductive health.
6 Combat HIV/AIDS
• Have halted by 2015 and begun to reverse the spread of HIV/AIDS.• Achieve, by 2010, universal access to treatment for HIV/AIDS for all
those who need it.• Have halted by 2015 and begun to reverse the incidence of malaria and
other major diseases.
7 Environmental Sustainability
• Integrate the principles of sustainable development into country policies and programmes and reverse the loss of environmental resources.
• Reduce biodiversity loss, achieving, by 2010, a significant reduction in the rate of loss.
• Halve, by 2015, the proportion of the population without sustainable access to safe drinking water and basic sanitation.
• By 2020, to have achieved a significant improvement in the lives of at least 100 million slum dwellers.
8 Global Partnership
• Targets cover: trading and financial systems, the special development needs of disadvantaged states, debt sustainability, affordable access to essential drugs and access to information and communications technologies.
Pov
erty
rat
es c
onti
nue
to f
all
People living on less than $1.25 a day (% of population)
Year
60
40
20
01990 1995 2000 2005 2010 2015
Sub-Saharan Africa
South Asia
East Asia & Paci�c
Middle East &North AfricaLatin America & Caribbean
Europe & Central Asia
FIGURE 8.7 Summary of the UN’s Millennium Development Goals for 2015
Source: Table copied from ‘Budget — Australia’s International
Development Assistance Program, 2011–12’, Statement by Kevin
Rudd, Minister for Foreign Affairs (10 May 2011), p. viii; see http://budget.australia.gov.au/2011–12/content/download/ms_ausaid.pdf
1 What is gross domestic product (GDP) per head? What are three main weaknesses of this as a measure of development?
2 What is the human development index (HDI)? How is it measured? What is the main weakness of this as a measure of development?
3 Identify and outline the eight key Millennium Development Goals (MDGs) adopted by the UN. To what extent have these goals been achieved?
FIGURE 8.8 Trends in the reduction of extreme poverty by global region
Source: Graph copied directly from World Development Indicators
2014, p. 2, published for the World Bank.
c08DevelopmentEconomics.indd 319 12/09/14 7:13 AM
UN
CO
RR
EC
TED
PA
GE
PR
OO
FS
320 economics down under book 1
There was also good growth in universal education, a reduced incidence of HIV and AIDS, and lower child (under five years of age) mortality rates (now below 10 million per year). However, there were significant differences between countries, and given the trends to 2014 and the GFC and ensuing recession, some goals look unachievable, especially improved maternal health, gender equity, environmental sustainability and international financial aid or support.
Try applied economic exercise 2, pp. 339–40
8.3 Causes of poverty in low-income countries
There are many theories used to explain why some countries experience extreme poverty and some countries don’t. One theory was provided by an American economist, Walt Whitman Rostow, who published a book entitled the Stages of Economic Growth.
Stages of economic growthRostow suggested that economic growth and development move through five main stages as seen in figure 8.9 below.
Stage 3. ‘Take off stage’. Period ofindustrialisation and the growthof manufacturing. Agriculture
is no longer the main areaof employment.
Stage 2. Preconditions stage. Thefoundations for future economicgrowth are established throughcreating adequate social and
economic infrastructure (e.g. roads,schools), and the expansion ofpersonal and business services.
Stage 1. Subsistence stage.National production is very low.
Stage 5. High mass consumptionstage and strong living standards.
Stage 4. Drive to maturity stage orstage of sustained economicgrowth where there are rising
levels of investment.
Rostow’s theory suggests that countries must move through these stages to avoid poverty and achieve stage 5 where strong living standards are enjoyed. While some countries have followed this path of development and achieved high incomes, Rostow’s critics say that his explanation is too simplistic. It leaves out important influences. Alternative theories have also been proposed to help explain the process of economic development. Some of these emphasise the need for structural change in low-income economies including the shift of labour from agriculture to manufacturing. Others have emphasised the importance of a market-based approach involving profit incentives and reduced government restrictions to bring about change, while some economists see international cooperation and trade as the key driver of development.
Unfortunately, there is no simple explanation for the causes of poverty that suits all cases, since each country is unique in certain ways. For instance, some nations have big populations, others are small. Some have many natural resources, others have few. Some have socialist economies, others use market capitalism. Some are on different sides of the equator. And some are former European colonies, but others are not. However,
Stages of economic growth is a concept developed some decades ago by economist W. W. Rostow who believed that the economic development of a nation went through various phases including subsistence, preconditions, industrialisation, take-off and drive to maturity.
FIGURE 8.9 Rostow’s stages of economic growth
c08DevelopmentEconomics.indd 320 12/09/14 7:13 AM
UN
CO
RR
EC
TED
PA
GE
PR
OO
FS

321chapter 8 Development economics
having pointed out some of the differences, it is possible to make a few generalisations about the factors that commonly restrict economic development and cause poverty in low-income countries.
Factors that may cause poverty in low-income countriesLet us now look at the factors that restrict economic development and cause poverty in some countries.
The problem of limited productive capacityPerhaps the most common cause of poverty in low-income economies is their lack of productive capacity. This restricts the level of output of goods and services, relative to the size of the population. It means that each person’s income and slice of the pro-duction pie is small. As a result, average consumption of goods (e.g. food, clothing, housing) and services (e.g. health, education, transport) per capita is low. This causes poverty and subsistence living standards. Mention has already been made as to why the country’s capacity or production possibility frontier may be limited (see p. 315 and figure 8.4). Basically, it comes down to two main things. 1. The volume of natural (e.g. agricultural land, climate, water), labour (e.g. the pro-
vision of skills and physical effort) and physical capital resources (i.e. plant and equip-ment used in production, such as tractors, railways, electricity system) per person in low-income countries is too small to allow for sufficient production or GDP. Perhaps the country is overpopulated given the quantity of resources available.
2. The level of productivity or efficiency per worker (i.e. perhaps measured by the average level of GDP per hour worked) is low in economically poor nations, thereby restricting productive capacity. That is, the output of goods and services produced per unit of input is very small. The problem with limited efficiency and production per hour is that incomes paid to workers are low. This causes poverty, malnutrition, poor health and limited opportunities. Clearly, poverty and lack of development will persist in these countries unless there is economic growth and the expansion of the nation’s production possibility frontier (PPF).
Low saving and investment create povertyAs we know, Third World nations have low subsistence levels of production and income and, hence, high levels of poverty. After purchasing basic necessities (e.g. food, housing), little or no household income remains for saving (i.e. saving is income not spent). However, without saving (by households, firms or governments), there is limited finance for investment in capital equipment that is needed to start and grow businesses or provide government services or infrastructure, unless there is a rise in overseas borrowing or debt.
Even if credit is available in low-income countries, it is very expensive as reflected in high interest rate repayments upto 40 per cent. These higher interest rates make starting private businesses almost impossible as the repayments will eat into any possible profit. Many households also lack the basic requirements for gaining a credit rating so that they are eli-gible for borrowing from banks or local money lenders. In addition, if governments borrow to provide community ser-vices (as happens in some low-income countries), there is the ongoing burden of interest repayments for future generations.
Whatever the cause, low levels of investment in equip-ment and new technology mean that labour output per hour worked (i.e. efficiency) is very small indeed. This causes hourly pay rates, incomes and purchasing power to be limited and hence living standards remain desperately low. One way to illustrate this problem is to use a diagram showing the vicious cycle of poverty. As shown in figure 8.10 (right), the poverty cycle can start with poor savings, inad-equate investment, weak efficiency and hence low incomes, which will persist unless the cycle is somehow broken. However, escaping this vicious cycle is not easy. As we shall see shortly, it may take considerable time and requires a combination of many strategies.
Overpopulated countries are those where there are too many people given the availability of productive resources. This problem can lead to lower living standards.
The Third World refers to a group of nations that have very low subsistence levels of production and income and, hence, high levels of poverty.
The poverty cycle is a concept used to explain why low-income countries struggle to escape poverty and raise their material living standards. Using a vicious cycle of poverty diagram, poor savings, inadequate investment and weak productivity result in low incomes, low savings, low investment and so on.
The vicious cycle of poverty in
low-income countries
1. Low levels of output per worker per hour causes average incomes per
head per year to be low, so there is poverty and only some basic items are
affordable.
2. Low levels of national saving
are due to subsistence
levels of income.
4. Low investment spending on new equipment and
technology makes labour ef�ciency
very low.
3. Inadequate savings make borrowing credit to set up and �nance business investment spending very expensive, so
investment levels are very low.
FIGURE 8.10 The vicious cycle of poverty and underdevelopment in low-income countries
c08DevelopmentEconomics.indd 321 12/09/14 7:13 AM
UN
CO
RR
EC
TED
PA
GE
PR
OO
FS

322 economics down under book 1
Problems involving population and the labour forceOn average, the population of low- income countries is growing more than three times as fast than those of high-income countries. For instance, for economically poor countries, the average rate of population growth is around 2.2 per cent a year, as against only 0.7 per cent in most richer countries.
Many factors contribute to rapid population growth such as the tradi-tion of having large families (to coun-teract high infant mortality rates), restricted access to birth control (due to cost or religious beliefs) and a lack of information about birth control and family planning (see fi gure 8.12
below). In addition, extra children are often seen by parents as an insurance against old age since they can earn extra income for the family (given that child labour is usually tolerated).
There are many infl uences on the rate of population growth. Figure 8.12 below sum-marises some of these causes of rapid population growth in low-income countries, and outlines some of the effects.
1. Farms are overcrowded, small and inef�cient2. Drift of people to cities in search of work3. Urban problems arise4. Social and economic infrastructure cannot cope and is inadequate, discouraging business and lowering living conditions5. Increasing unemployment rates and wasted productive capacity6. Environmental problems are more severe.
Effects of rapid population growth:
1. Lack of access, information and education about birth control and family planning2. Children are often seen as parent insurance against old age, given the absence of welfare3. There is a tradition of large families4. The infant death rate is high so more births help to compensate5. Use of child labour means more income.
Causes of rapid population growth:
High population growth in low-income developing countries
Rapid population growth places enor mous pressures on the resources of poor countries. It does this in several ways:• Farming problems. Given that most families live in rural rather than in urban areas,
the size of farms and the ability of rural populations to feed themselves and create
FIGURE 8.11 Rapid population growth of over two per cent a year in low-income countries causes material living standards or GDP per head to rise more slowly. There are many causes of high birth rates including a lack of education, limited access to contraceptives, high rates of infant mortality and economic insecurity.
FIGURE 8.12 The causes and effects of population growth in low-income countries
c08DevelopmentEconomics.indd 322 12/09/14 7:13 AM
UN
CO
RR
EC
TED
PA
GE
PR
OO
FS

323chapter 8 Development economics
jobs, is progressively reduced by population growth. Farmers are forced onto less fer-tile land, so efficiency and incomes decline. This problem is worsened by the fact that, often, the best land is owned by the rich minority, who either fail to cultivate the prop-erty or, alternatively, impose harsh rental conditions on farmers (i.e. 50–80 per cent of the crop is taken by the landlord as rent). This contributes to low productivity and higher unemployment. It also means that productive capacity is wasted and the nation’s output of food is lower than it could be. As a result, living standards are depressed to subsistence levels and poverty rates rise.
• Urban problems. In some developing countries, population growth has meant that there has been a massive shift of people in search of work from overcrowded rural areas into the city where there are some jobs available in manufacturing. This creates severe urban problems involving inadequate transport, housing, waste disposal, pol-lution, sanitation, education, water supply and health services.
• Infrastructure problems. Usually, governments in low-income countries are expected to provide infrastructure and services such as education, health, water supply, sani-tation, roads, railways, ports and electricity. However, government tax revenue is inad-equate to provide these, due to low incomes, unemployment, corruption and tax evasion. Rapid population growth puts pressure on infrastructure that is already insuf-ficient. It breaks down, is chaotic, congested, decaying and inefficient. Apart from causing people to live in miserable conditions, poor infrastructure also scares away new businesses. This means that production is depressed, there are fewer jobs, and incomes are lower than otherwise.
• Unemployment problems. In many low-income countries, rapid population growth increases unemployment (i.e. when those 15 years of age and over who want work cannot find jobs). Figure 8.13 (p. 324) shows the massive scale of this problem with rates in some countries upto 40 per cent of the labour force. In addition, there is the issue of underemployment (i.e. when those working are not employed to their capacity and, for example, could work more hours and produce more output per hour). Com-monly, those who are employed are only working at perhaps 50–60 per cent of their potential. Together, unemployment and underemployment mean that a very large part of the country’s labour resources are idle, and its economy is operating well below capacity and inside its PPF. As a result, production and income levels per head of popu-lation are low and poverty is rampant.
• Problems in education and skills. Potentially, people are one of the most valuable econ-omic resources for any nation. Although low-income countries often have large labour forces, unfortunately most are unskilled. Illiteracy and the lack of access to infor-mation, new ideas, technology and skills means that agriculture, manufacturing, ser-vices and administration all remain backward. Poor education standards slow economic development and contribute to poverty. Table 8.1 (p. 324) shows the sharp contrasts in educational indicators for low-income countries, as compared to high-in-come countries such as Australia.
There are many reasons for inadequate access to education. For example, given rapid population growth and limited finance, governments simply cannot provide sufficient schools and trained staff. In addition, a common expectation and necessity is that children work from an early age and contribute financially to the family.
• Environmental problems. Generally, more people means that there is greater pollution. This is because of the need to increase the production of goods and services. It often means that natural resources are overused and abused, resulting in environmental degradation. For example, to allow for the growth of agriculture to feed growing populations in Indonesia and Brazil, logging and the clearing of forests have occurred on a massive scale. This has led to the destruction of native habitat, extensive soil ero-sion, reduced water and river quality, and increased risk of mud slides that destroy villages and infrastructure. Again, poverty is increased and living conditions become more depressed.
The problem of inefficient government and other institutionsDemocracy involves giving people the freedom every few years to choose who will govern them. Often low-income countries have dictatorships and democracy fails to thrive. Ordinary people are usually powerless to judge or comment about poor govern-ment. The media is unable to expose rampant corruption and administrative failure, and vital economic and social change cannot occur. This slows development and
Infrastructure is a key to development and involves the provision (often by governments) of services to allow businesses to operate (e.g. power, water, transport, communications) and services for the community to enjoy reasonable living standards (e.g. water supply, hospitals, schools).
Underemployment exists when those working are not employed to their capacity and, for example, could work more hours and produce more output per hour.
Democracy is a transparent political system that allows ordinary people to have a free choice, every few years, of who represents them in parliament.
c08DevelopmentEconomics.indd 323 12/09/14 7:13 AM
UN
CO
RR
EC
TED
PA
GE
PR
OO
FS

324 economics down under book 1
incompetence by government goes on, unchecked. Too often, for example, offi cials look after themselves, protect their friends, hand out special privileges to interest groups and fail to use policies to redistribute income and equitably share the benefi ts of economic development. In addition, it is not uncommon in low-income countries with military dictatorships for scarce resources to be redirected, away from providing basic commu-nity services and infrastructure, into defence spending. Sometimes this is even fi nanced using foreign borrowing involving expensive debt repayments. This lowers economic development and adds to poverty.
Unemployment rates in low income and other countries and regions(% labour force), mostly 2010 to 2014
0
1.9
3.2
16
20
20
22.3
25.6
27
30
30
35
37.8
42
46
48
49.9
60
70
7078.2
90
10 20 30 40 50 60 70 80 90 100
Qatar
Singapore
Vietnam
Australia
China
Sudan
Iraq
Iran
Zambia
Libya
Cocos Islands
European Union
Indonesia
East Timor
Equatorial Guinea
Spain
Greece
World
Cameroon
Afghanistan
Gaza Strip
Kenya
Nepal
Unemployment rate (percentage of the labour force)
Cou
ntry
Senagal
Samoa
Mozambique
Turkmenistan
Zimbabwe
Vanuatu
Nauru
16
14
13
11.3
10.6
6.1
5.8
4.1
0.5
TABLE 8.1 Indicators of education standards in low- and high-income countries
Indicator of educational standards Low-income countries High-income countries
Adult literacy rate (percentage of those aged 15 years and over)
60 95
Combined enrolment ratio (total percentage in primary and secondary, and tertiary education)
56 92
Sources: Data derived from United Nations Development Report, 2007–08; UNESCO Institute of Statistics and other sources.
FIGURE 8.13 High rates of unemployment in low income countries restrict economic development and lower living standards.
Note: Data are mostly for 2010–14, or more recent.
Sources: Data derived from various sources including the
CIA, The World Factbook, Wikipedia, the free encyclopedia,
en.wikipedia.org/wiki/List_of_countries_by_unemployment_rate
and NationMaster.com; www.nationmaster.com/graph/lab_une_
rat-labour-unemployment-rate
c08DevelopmentEconomics.indd 324 12/09/14 7:13 AM
UN
CO
RR
EC
TED
PA
GE
PR
OO
FS

325chapter 8 Development economics
Problems of limited foreign trade and rising debtCountries need to export in order to help pay for necessary imports. They also have to meet the burden of paying interest on their foreign debt or overseas borrowing. Unfortunately, there are many obstacles preventing low-income countries from being able to pay their way in international financial transactions with the rest of the world. As a result, most low-income countries have large deficits on their balance of payments current account, and massive levels of foreign debt. Let us take a closer look.• Limited agricultural exports. It is common to find a large pro-
portion of the population in low-income countries involved with subsistence agriculture. This obviously produces no sur-plus output to boost export sales and incomes. However, often the other more modern part of the rural sector produces for local and, especially, export markets. It entails growing cash crops and other food items (e.g. cocoa, sugar, coffee, spices, maize, timber, palm oil and rice). Unfortunately, there is little value added in this line of industry (due to the lack of pro-cessing) and so many of their commodities command only low prices internationally. Furthermore, high-income countries including the United States, Switzerland, Japan and the Euro-pean Union, use tariffs and subsidies to protect their own rural industries. This all means that export incomes of poor countries are fairly low, and many nations face large CADs and rising foreign debts.
• Limited manufactured exports. There is a growing need in low-income countries to focus on basic manufactured exports (e.g. textiles and clothing, toys, simple electrical goods) produced in urban areas. This is often because opportunities and land for farming are limited, rural commodity prices are depressed, and incomes are low. As a result, unemployed or underemployed labour drifts to the cities in search of jobs in man-ufacturing. However, these countries’ exports of simple manufactured or processed goods are often reduced by the existence of substantial tariffs, import quotas, export subsidies and other protectionist tricks used by high-income countries.
• Increased reliance on imports. Often there is a reliance on imports of food, oil and more elaborately manufactured items (e.g. equipment) because of obstacles that restrict domestic production in these areas. This adds to a country’s current account deficit.
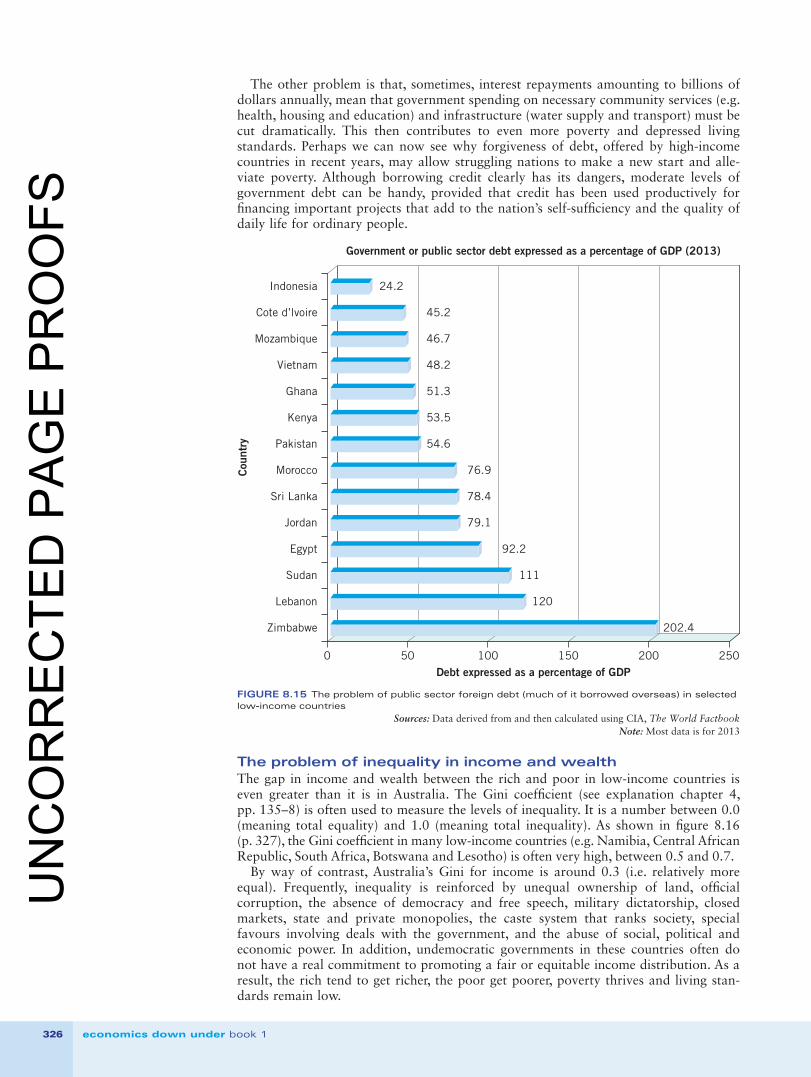
• The problem of overseas debt repayments. There are many reasons why many low-in-come nations have high levels of foreign debt and problems with debt repayment. For instance, savings levels are usually low. This scarcity of savings causes local interest rates to be high, making finance for investment spending on capital equipment very expen-sive. Third World debt is also worsened by the fact that interest rates abroad are often lower than those offered locally. In addition, generous credit was previously made avail-able at very seductive interest rates, sometimes by multilateral institutions like the Inter-national Monetary Fund (IMF) and World Bank. Governments in low-income countries often face serious financial problems, driving them into debt. On the one hand, the gov-ernment’s economic worries are caused by inadequate revenue. As noted previously, this is due to subsistence or low average incomes of the population and tax collection diffi-culties including corruption and institutional failings. On the other hand, with rapid population growth, the required level of government spending on providing basic social and economic infrastructure (e.g. services including health, education, transport, water supply, power generation) is massive. In addition, often the borrowed money has been misappropriated through corruption, wasted by incompetent officials on poorly selected projects, and misused for financing repression and military operations (i.e. around 20 per cent of Third World debt was spent on military equipment).A seemingly attractive solution to this problem is for the private and government
sectors to finance their spending by borrowing credit overseas. Unfortunately, this adds to the foreign debt of low-income countries. As shown in figure 8.15 (p. 326), public sector debt levels, much of it borrowed overseas, in many low-income countries like Lebanon or Zimbabwe are very high, when compared with the size of their economy or GDP. One would have to question the capacity of these countries to ever repay the loans, without causing much pain and suffering.
FIGURE 8.14 When low-income, Third World countries borrow credit from richer countries, this creates the burden of repaying debt abroad, along with regular interest payments. These repayments cause scarce resources to be reallocated away from other uses that would improve the wellbeing of people, such as government spending on water supply, and providing health and education.
Debt repayment is a burden and involves not only paying regular interest, but also returning the original amount of money or principal borrowed.
c08DevelopmentEconomics.indd 325 12/09/14 7:13 AM
UN
CO
RR
EC
TED
PA
GE
PR
OO
FS
326 economics down under book 1
The other problem is that, sometimes, interest repayments amounting to billions of dollars annually, mean that government spending on necessary community services (e.g. health, housing and education) and infrastructure (water supply and transport) must be cut dramatically. This then contributes to even more poverty and depressed living standards. Perhaps we can now see why forgiveness of debt, offered by high-income countries in recent years, may allow struggling nations to make a new start and alle-viate poverty. Although borrowing credit clearly has its dangers, moderate levels of government debt can be handy, provided that credit has been used productively for financing important projects that add to the nation’s self-sufficiency and the quality of daily life for ordinary people.
Government or public sector debt expressed as a percentage of GDP (2013)
0 50 100 150 200 250
202.4
120
111
92.2
79.1
78.4
76.9
54.6
53.5
51.3
48.2
46.7
45.2
24.2
Zimbabwe
Lebanon
Sudan
Egypt
Jordan
Sri Lanka
Morocco
Pakistan
Ghana
Kenya
Vietnam
Mozambique
Cote d’lvoire
Indonesia
Debt expressed as a percentage of GDP
Cou
ntry
FIGURE 8.15 The problem of public sector foreign debt (much of it borrowed overseas) in selected low-income countries
Sources: Data derived from and then calculated using CIA, The World Factbook Note: Most data is for 2013
The problem of inequality in income and wealthThe gap in income and wealth between the rich and poor in low-income countries is even greater than it is in Australia. The Gini coefficient (see explanation chapter 4, pp. 135–8) is often used to measure the levels of inequality. It is a number between 0.0 (meaning total equality) and 1.0 (meaning total inequality). As shown in figure 8.16 (p. 327), the Gini coefficient in many low-income countries (e.g. Namibia, Central African Republic, South Africa, Botswana and Lesotho) is often very high, between 0.5 and 0.7.
By way of contrast, Australia’s Gini for income is around 0.3 (i.e. relatively more equal). Frequently, inequality is reinforced by unequal ownership of land, official corruption, the absence of democracy and free speech, military dictatorship, closed markets, state and private monopolies, the caste system that ranks society, special favours involving deals with the government, and the abuse of social, political and economic power. In addition, undemocratic governments in these countries often do not have a real commitment to promoting a fair or equitable income distribution. As a result, the rich tend to get richer, the poor get poorer, poverty thrives and living stan-dards remain low.
c08DevelopmentEconomics.indd 326 12/09/14 7:13 AM
UN
CO
RR
EC
TED
PA
GE
PR
OO
FS

327chapter 8 Development economics
A R C T I C O C E A N
A T L A N T I C
O C E A N
I N D I A N
O C E A N
P A C I F I C
O C E A N
A T L A N T I C
O C E A N
N
<0.25
Key for Gini coefficients
0.25–0.29
0.30–0.34
0.35–0.39
0.40–0.44
0.45–0.49
0.50–0.54
0.55–0.59
>0.60
No information
Gin
i coe
f�ci
ent
(0 m
eans
tot
aleq
ualit
y, 1
mea
ns t
otal
ineq
ualit
y)
0
Aus
tral
ia
Ken
ya
Iran
Mad
agas
car
Zim
babw
e
Zam
bia
El S
alva
dor
Bol
ivia
Cen
tral
Afr
ican
Rep
ublic
Bot
swan
a
Leso
tho
Sou
th A
fric
a
Nam
ibia
0.6
Incomes are usually divided unevenly in low-income countries
0.7
0.8
0.33
0.44 0.450.48 0.5 0.51 0.52
0.59 0.61 0.63 0.63 0.65
0.71
0.5
0.4
0.3
0.2
0.1
FIGURE 8.16 Incomes are usually divided unevenly in low-income countries (Gini coefficient: 0.0 means total equality, 1.0 means total inequality)
Source: Data derived from CIA World Factbook. Map copied directly from http://en.wikipedia.org/wiki/File:Gini_Coefficient_World_CIA_Report_2009.png
Historical problemsOne thing that many low-income countries have in common (e.g. Africa, South America, Asia, Central Europe) is that during the 1700s, 1800s and early 1900s, they were colonies of European powers. Many of these nations were exploited for their cheap and obedient labour and for their natural resources. In the past, much wealth and income was sucked out, often leaving the local population worse off than before. It is hardly surprising, therefore, that most of these countries (e.g. India, South Africa, Indonesia, Vietnam and East Timor) pushed for independence through both peaceful
1 Outline how the existence of each of the following problems in many low-income countries might lead to poverty.a The problem of limited
productive capacityb Low saving and
investment levelsc Rapid growth in the
population and size of the labour force
d The problem of inefficient government and other institutions
e Problems of limited foreign trade and rising overseas debt
f The problem of inequality in the distribution of income and wealth
g Historical problems.
c08DevelopmentEconomics.indd 327 12/09/14 7:13 AM
UN
CO
RR
EC
TED
PA
GE
PR
OO
FS
328 economics down under book 1
and other means. In some cases, the end of European colonialism did not mean the end to poverty.
Try applied economic exercise 3, p. 340
Try analysis of visual evidence — a cartoon, p. 343
8.4 Strategies to promote economic growth and development
With so much suffering in low-income countries, there is a desperate need for effective government policies to help accelerate economic development. Policy that aims at accel-erating economic growth so output rises at a faster rate than population is important for poor nations (although not the only solution).
To accelerate economic development, one starting point is that there needs to be an increase in a nation’s productive capacity (i.e. size of the PPF) through access to more resources, or especially by using existing resources more efficiently. As we know, the problem here is that many poor countries have very limited resources and use them inefficiently. The task then is to find government policies and other strategies to help overcome these obstacles. Let us take a closer look at some possible solutions.
Policies to lift investment levelsAs mentioned, Third World nations have low subsistence incomes and high poverty rates. Savings (income or money not currently spent or consumed) are simply inade-quate to finance the necessary investment in government infrastructure, and in plant and equipment required to set up or grow private businesses. Countries need to escape the vicious cycle of poverty and low development. Breaking out of this circle is not easy, but the following strategies may help:• Governments must set up and supervise well run and secure banks and financial insti-
tutions to collect whatever household savings there are.• International capital inflow or foreign investment must be pursued, but with appro-
priate safeguards.• International aid and gifts (private and government) need to be encouraged, as long as
they do not have harsh conditions attached that hurt the local community.• A system of microcredit needs to be created where small sums of money, perhaps as
little as $100–200, are provided to those who want to start up a tiny business and who, otherwise, would not qualify for bank loans. This needs to be supplemented with some free basic business training.
• The government needs to ensure that the rich, in particular, pay the required taxes (on incomes and luxury goods) to help finance public investment and infrastructure projects.
• Government incentives (e.g. tax holidays) are needed to encourage private investment in projects that help promote national self-sufficiency in food and basic community services (i.e. social infrastructure).
• Measures (e.g. proper accounting and transparent record keeping, freedom of infor-mation and the press) are needed to help avoid wasting or misusing the government’s limited financial resources, adding to the burden of repaying debt.
• Exports (e.g. cash crops and basic manufactured items) from low-income countries need to be encouraged. This may be pursued through multilateral (perhaps through institutions like the World Trade Organization) or bilateral free trade agreements (between two countries) that are designed to reduce high levels of protection of pri-mary industry, especially in Europe, Japan and the US. This would help to boost national income, saving and investment.
Provision of basic infrastructureAs we now know, having adequate infrastructure including education, health, power, water supply, transport, and law and order is an important key to growing the nation’s pro-ductive capacity, alleviating poverty and improving the quality of daily life. However, problems here are difficult to fix because of the scarcity of savings and lack of government
Savings represent that part of personal income that is not currently spent. These funds become available to finance future investment spending on new plant and equipment.
Investment spending represents the purchase of physical capital equipment (e.g. machinery, infrastructure) needed by firms and governments to grow the economy’s productive capacity.
c08DevelopmentEconomics.indd 328 12/09/14 7:13 AM
UN
CO
RR
EC
TED
PA
GE
PR
OO
FS

329chapter 8 Development economics
revenue. Various strategies were previously mentioned (see p. 328) as to how countries might raise the necessary investment capital.
Managing debt levelsDebt levels in poor countries are often high and rep-resent well over 100 per cent of their GDP in some cases. This causes crippling interest repayments to rich nations. It often forces governments to reduce the level of government spending on community services and infrastructure. Debt needs to be cut to manage-able levels, wasteful ‘white elephant’ projects that add little to welfare terminated, substantial military expen-ditures cut and governments held accountable for all spending. Even so, some countries need a hand getting their debt under control. The International Monetary Fund (IMF) has provided full or partial debt relief to 36 countries to January 2012. This provides a breather, but is not a permanent solution. Addition-ally, borrowed money needs to be used efficiently for projects that bring widespread improvements in the capacity of the economy to produce goods and services that encourage national self-sufficiency and independence.
Reforming government and promoting democracyPoor countries badly need political democracy where the majority of voters in regular and free elections choose the government from a range of candidates representing different political parties. In addition, it is also vital that there is freedom of speech and freedom of the press (i.e. where the media can be critical of government policies). These things add to administrative transparency, help to hold governments accountable for their actions, and reduce incompetence, corruption and war.
A strong legal framework is also important in poorer countries to ensure that laws protect the rights of workers, make child labour illegal so children gain an education, guarantee civil rights including free speech, protect the environment and promote strong price competition in domestic markets. While change is desperately needed, making it happen peacefully is often difficult. This is because those with power usually want to hang on to it by using military force, repression and resisting reform.
Reducing trade protection by rich countriesMany rich nations protect their farmers, manufac-turing firms and miners from competition by poorer countries that are trying to export primary commod-ities (e.g. coffee, rice, soy beans, maize and sugar) and basic manufactured products. Here, we think of the heavy protection of farmers in the US, Japan and the European Union by means of tariffs, subsidies and import quotas that were operated in past decades. We also think of the attempts by Australia and some developing countries through numerous rounds of multilateral trade negotiations to convince these rich countries of the need to expand free trade. Progress here has been slow. However, as table 8.2 (p. 330) shows, tariff protection on products imported from the ‘least’ developed Third World countries has come down during the 2000s.
FIGURE 8.17 When good infrastructure is not present in developing countries, it is often difficult to accelerate economic growth.
FIGURE 8.18 Many developing nations export primary products. Rich countries have a role to play in helping developing nations lift their incomes through reducing protection and embracing free trade.
c08DevelopmentEconomics.indd 329 12/09/14 7:13 AM
UN
CO
RR
EC
TED
PA
GE
PR
OO
FS

330 economics down under book 1
TABLE 8.2 Changes in levels of tariff protection by selected developed countries on imports from the ‘least’ developed Third World countries.
Country
Percentage of imported goods from
least developed countries that are admitted free of
tariffs 2000/2007
Average tariff rate on agricultural
imports from least developed countries
2000/2007
Average tariff rate on textile imports
from least developed countries
2000/2007
Average tariff rate on clothing
imports from least developed countries
2000/2007
Australia 94.5/100.0 0.2/0.0 5.0/0.0 19.6/0.0
Canada 48.3/99.9 0.3/0.1 5.8/0.2 18.8/1.7
Japan 82.2/99.6 4.9/1.3 0.2/2.6 0.0/0.1
Switzerland 93.3/95.0 6.0/2.8 0.0/0.0 0.0/0.0
US 46.2/76.8 6.3/6.0 6.8/5.6 13.9/11.3
Source: Data derived from the World Bank, 2010 World Development Indicators, table 1.4, p. 44.
Indeed, if all rich countries reduced protection, it would further boost export incomes of poor countries, thereby reducing their need to borrow money and run up a large foreign debt. It would also make essential imports of equipment, medicines and technology by low-income countries more affordable and lead to higher living standards.
Reducing income inequalityIncome inequality is often much larger in poor countries (e.g. typically the Gini coefficient is between 0.5 and 0.7) than in rich nations (e.g. the Gini is less than 0.35). Frequently, inequality is reinforced by unequal ownership of land, official corruption, the absence of democracy, closed markets, state and private monopolies, special favours involving deals with the government, the caste system and the abuse of social, political and economic power. Democratically elected governments can best deal with economic inequality by introducing policies including:• fairly progressive income taxes where rates (percentage of income paid in tax) rise
with taxable income• provision of free or cheap basic community services• passing and enforcing trade practices acts to promote stronger competition in markets
and check personal greed• attacking corruption.
Reducing population pressuresPopulation in some low-income countries is growing quickly, at more than double the rate of high-income nations (some of which actually have declining populations). This places great strain on the government’s provision of infrastructure and services (e.g. transport, water, education, power, transport, law and health), and leads to unemploy-ment, underemployment and idle resources.
The great burden created by population pressures can however be eased. Historical experience tells us that birth rates slow and families get smaller if there are improve-ments in general health (e.g. clean water supply and control of HIV/AIDS, malaria, measles and tuberculosis) and education standards, and by lowering the child mortality (death) rate. This is because, apart from common ignorance about family planning and health matters, to some extent, large families also reflect the uncertainties of infant survival and old age in countries where there is no government welfare system (e.g. unemployment benefits or old age pensions). Clearly, government spending to improve health and education must be given very high priority.
Try applied economic exercise 4, pp. 340–1
Try class debate 2, 3, 4, 5, 6, p. 343
1 Explain in general terms how governments in low-income countries might attempt to accelerate economic development.
2 How might each of the following government policies help accelerate economic development and improve the daily lives of people in low-income countries?a Policies that lift
investment levelsb Improved provision of
basic infrastructurec Debt levels are controlledd Reforms of government
that promote democracy and greater openness
e Reductions in trade protection by rich countries
f Reductions in inequality in the distribution of income and wealth
g Reductions in the rate of population growth
c08DevelopmentEconomics.indd 330 12/09/14 7:13 AM
UN
CO
RR
EC
TED
PA
GE
PR
OO
FS
331chapter 8 Development economics
8.5 The role of government and private foreign aid to promote economic development
Foreign aid represents the transfer of funds and other types of assistance by govern-ments and private individuals from high-income to lower-income countries. If used properly, international aid can be an important way of helping poor countries to improve their living standards. Most importantly, this assistance can help to break the vicious cycle of poverty, raise per capita incomes and improve the quality of daily life. Often it does this by raising the funds available for investment in social and economic infrastructure, lifting efficiency and accelerating productive capacity.
The three main forms of foreign aidThere are three main types of foreign aid — loans, grants and technical assistance. These are summarised below.1. Loans. There are three kinds of loans — hard loans or credit offered at the normal
market rate of interest; soft loans offered at a special discounted interest rate; and tied loans, where special conditions are imposed such as requiring that the money be used to purchase exports from the donor country. Of these, soft loans are probably the most beneficial for the recipient country. Official loans are also made by govern-ments in donor countries like Australia. However, much is directed through multi-lateral institutions including the World Bank and the International Monetary Fund (see p. 298). Often the World Bank and IMF require that governments in countries receiving loans, make certain changes such as:• deregulating markets• strengthening efficiency• becoming more accountable in financial administration• ensuring that much of the money loaned is directed into social and economic infra-
structure programs that meet the UN’s millennium development goals designed to improve the daily lives of ordinary people.
2. Grants are straight-out donations of cash that do not need to be repaid. When used wisely, this is perhaps the best type of help that high-income countries can offer. Normally grants are allocated by private international aid agencies (e.g. World Vision), or given by individual governments in donor countries. Often this type of aid is critical to provide immediate help after disasters such as famines, floods, earthquakes, wars or tsunamis.
3. Technical and other assistance. Technical and other assistance involves the donor country or a United Nations agency providing scientific, economic, educational, tech-nical, industrial or agricultural personnel. These people advise on matters relating to economic development. On occasions, military-related assistance is given by indi-vidual donor countries.Figure 8.19 (p. 332) shows some of the countries that provide government foreign
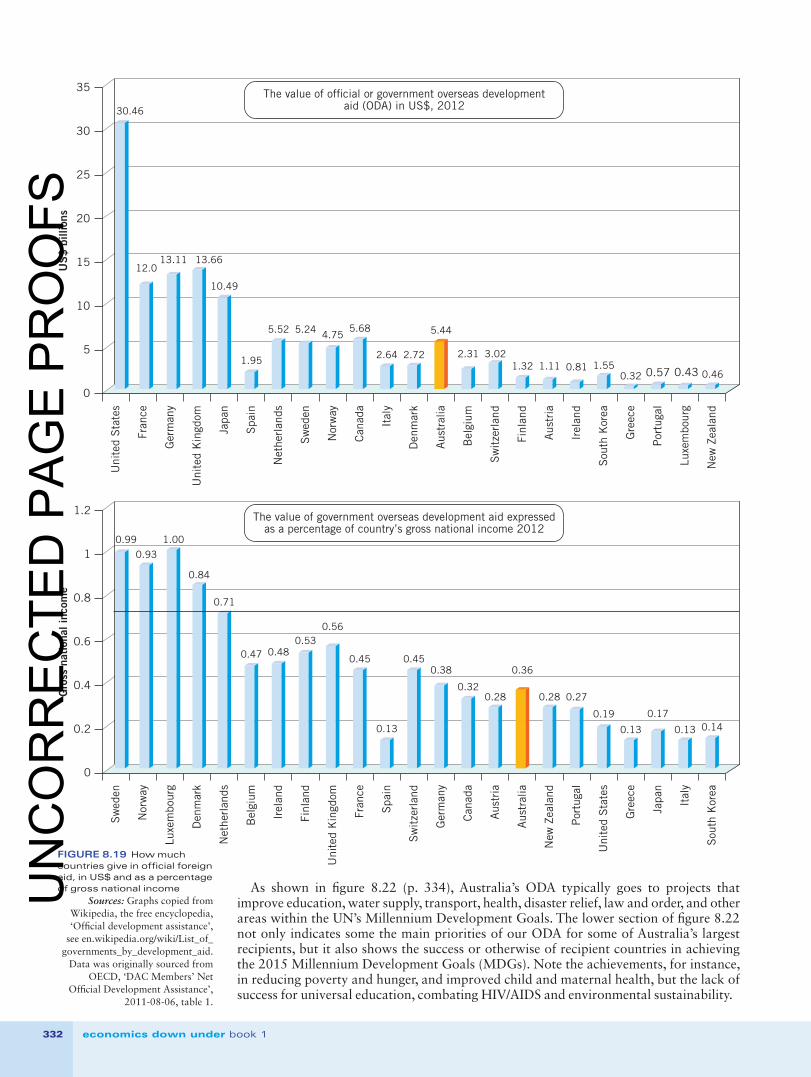
aid. The amount given is also expressed as a percentage of each country’s GDP. The latter measure gives a better idea as to a country’s generosity relative to the size of its economy. Although the US is easily the biggest donor, relative to GDP, Australia is nearly twice as generous. However, most donor nations, except Sweden and three others, fail to meet the 1970 agreed target of just 0.7 per cent of GDP. Table 8.3 (p. 333) looks at some of the main recipients of official or government foreign aid. While generally the level of overseas development aid reflects the neediness of the recipient country, some-times other considerations appear to have an impact such as strategic considerations and international political considerations.
The Australian government’s foreign aidThe Australian government’s foreign aid program (also called overseas development aid or ODA) seeks to reduce poverty in low-income countries and promote sustainable development that is in line with our national interests. It is distributed through AusAID. In 2013–14, our projected level of government aid is $5.7 billion or a projected 0.37 per cent of GDP.
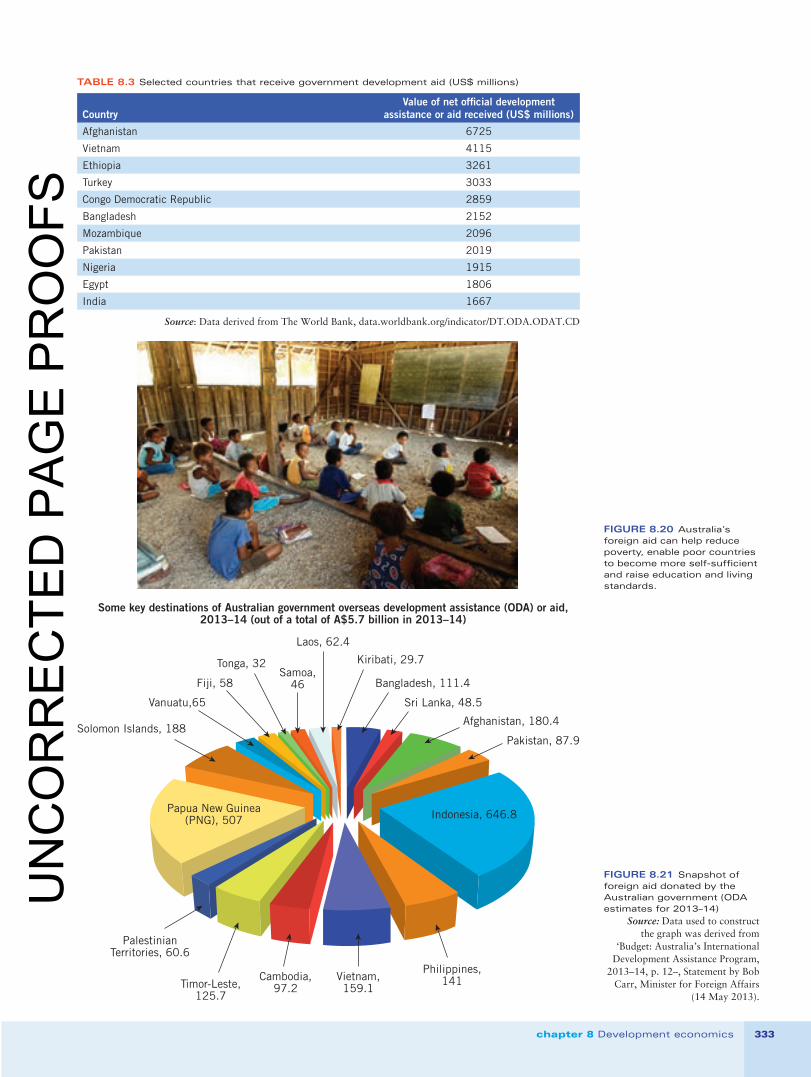
Figure 8.21 (p. 333) shows the countries which receive the largest share of our foreign aid include Indonesia, Papua New Guinea, the Solomon Islands, Vietnam, the Philippines, East Timor and Cambodia.
Foreign aid represents the transfer of funds and other types of assistance by governments and private individuals from high-income to lower-income countries.
Hard loans represent credit offered at the normal market rate of interest.
Soft loans are offered at a special discounted or favourable interest rate.
Tied loans involve special conditions that are imposed on borrowing countries such as requiring that the money be used to purchase exports from the donor country.
Grants are straight-out donations of cash that do not need to be repaid.
Technical and other assistance involves the donor country or a United Nations agency providing scientific, economic, educational, technical, industrial or agricultural personnel.
Australia’s foreign aid program involves providing financial and other assistance to low-income countries, designed to help reduce poverty, promote sustainable economic development and achieve the Millennium Development Goals.
c08DevelopmentEconomics.indd 331 12/09/14 7:13 AM
UN
CO
RR
EC
TED
PA
GE
PR
OO
FS
332 economics down under book 1
US
$ b
illio
ns
0
Uni
ted
Sta
tes
Ger
man
y
Fran
ce
Japa
n
Uni
ted
Kin
gdom
Net
herl
ands
Spa
in
Nor
way
Sw
eden
Can
ada
Ital
y
Den
mar
k
Bel
gium
Aus
tral
ia
Sw
itze
rlan
d
Finl
and
Aus
tria
Sou
th K
orea
Gre
ece
Irel
and
Por
tuga
l
Luxe
mbo
urg
New
Zea
land
30
35
30.46
12.013.11
10.49
1.95
25
20
15
10
5
5.52 5.24 4.755.68
2.64 2.72
5.44
2.31 3.021.32 1.11 0.81 1.55
0.32 0.57 0.43 0.46
The value of of�cial or government overseas developmentaid (ODA) in US$, 2012
13.66
Gro
ss n
atio
nal i
ncom
e
0
Sw
eden
Luxe
mbo
urg
Nor
way
Net
herl
ands
Den
mar
k
Irel
and
Bel
gium
Uni
ted
Kin
gdom
Finl
and
Fran
ce
Spa
in
Sw
itze
rlan
d
Can
ada
Ger
man
y
Aus
tria
Aus
tral
ia
New
Zea
land
Uni
ted
Sta
tes
Gre
ece
Por
tuga
l
Japa
n
Ital
y
Sou
th K
orea
1.2
0.99
0.93
1.00
0.84
0.71
0.47
1
0.8
0.6
0.4
0.2
0.480.53
0.56
0.45
0.13
0.450.38
0.320.28
0.36
0.28 0.27
0.19
0.13
0.170.140.13
The value of government overseas development aid expressedas a percentage of country’s gross national income 2012
As shown in figure 8.22 (p. 334), Australia’s ODA typically goes to projects that improve education, water supply, transport, health, disaster relief, law and order, and other areas within the UN’s Millennium Development Goals. The lower section of figure 8.22 not only indicates some the main priorities of our ODA for some of Australia’s largest recipients, but it also shows the success or otherwise of recipient countries in achieving the 2015 Millennium Development Goals (MDGs). Note the achievements, for instance, in reducing poverty and hunger, and improved child and maternal health, but the lack of success for universal education, combating HIV/AIDS and environmental sustainability.
FIGURE 8.19 How much countries give in official foreign aid, in US$ and as a percentage of gross national income
Sources: Graphs copied from Wikipedia, the free encyclopedia, ‘Official development assistance’,
see en.wikipedia.org/wiki/List_of_governments_by_development_aid.
Data was originally sourced from OECD, ‘DAC Members’ Net
Official Development Assistance’, 2011-08-06, table 1.
c08DevelopmentEconomics.indd 332 12/09/14 7:13 AM
UN
CO
RR
EC
TED
PA
GE
PR
OO
FS
333chapter 8 Development economics
TABLE 8.3 Selected countries that receive government development aid (US$ millions)
CountryValue of net official development
assistance or aid received (US$ millions)
Afghanistan 6725
Vietnam 4115
Ethiopia 3261
Turkey 3033
Congo Democratic Republic 2859
Bangladesh 2152
Mozambique 2096
Pakistan 2019
Nigeria 1915
Egypt 1806
India 1667
Source: Data derived from The World Bank, data.worldbank.org/indicator/DT.ODA.ODAT.CD
Some key destinations of Australian government overseas development assistance (ODA) or aid,2013–14 (out of a total of A$5.7 billion in 2013–14)
Indonesia, 646.8Papua New Guinea(PNG), 507
PalestinianTerritories, 60.6
Timor-Leste,125.7
Cambodia,97.2
Pakistan, 87.9
Afghanistan, 180.4
Vietnam,159.1
Philippines,141
Sri Lanka, 48.5
Bangladesh, 111.4
Kiribati, 29.7
Laos, 62.4
Solomon Islands, 188
Vanuatu,65
Fiji, 58
Tonga, 32Samoa,
46
FIGURE 8.20 Australia’s foreign aid can help reduce poverty, enable poor countries to become more self-sufficient and raise education and living standards.
FIGURE 8.21 Snapshot of foreign aid donated by the Australian government (ODA estimates for 2013–14)
Source: Data used to construct the graph was derived from
‘Budget: Australia’s International Development Assistance Program,
2013–14, p. 12–, Statement by Bob Carr, Minister for Foreign Affairs
(14 May 2013).
c08DevelopmentEconomics.indd 333 12/09/14 7:13 AM
UN
CO
RR
EC
TED
PA
GE
PR
OO
FS

334 economics down under book 1
Six strategic priorities of the Australian government’s overseasdevelopment aid (% of total aid)
Saving lives — improvingpublic health by access tosafe water and sanitation,
maternal and health services,disease prevention,
vaccination and treatment =19%
Effective governance —improving the capacity andef�ciency of governmentorganisations to deliverservices and to enhance
justice and human rights =16%
Humanitarian and disasterresponse — helping to
improve preparedness andresponese to disasters and
crises = 17%
Promoting opportunities forall — promoting education,empowering women in the
economy, business andleadership = 22%
Sustainable economicdevelopment — improving
employment, incomes,enterprise opportunities,food security, economic
development and climatechange = 19%
General developmentsupport of UN programs = 7%
Summary of aims for aid granted to the following countries:• Indonesia ($558.1m): to strengthen democratic mechanisms and systems of justice, promote sustainable GDP growth,
improve macroeconomic management, better delivery of community services, promote good governance and enhance peace and safety.
• Papua New Guinea ($482.3m): to accelerate progress towards basic education for all people, upgrade health outcomes, build up the public service, improve governance, and provide better access for firms to domestic and international markets.
• Solomon Islands ($261.6m): improve the efficiency of economic infrastructure, upgrade the delivery services to communities, strengthen economic security for people, address economic challenges to help raise living standards, and strengthen the func-tioning of government.
• East Timor ($123.7m): to undertake projects that improve health services and outcomes, improve support for the expansion of rural employment and jobs, strengthen public financial management and enhance internal security.
PROGRESS TOWARDS THE MDGS
MDG 11
End Poverty and Hunger
MDG 22
Universal Education
MDG 33
Gender Equality
MDG 44
Child Health
MDG 55
Maternal Health
MDG 66
Combat HIV/AIDS
MDG 77
Environmental Sustainability
✓ ✗ − ✓ ✓ ✗ ✗
Progress towards the 2015 MDG targets (see Diagram 1 for more detail) is indicated by a tick (already achieved or on-track), a cross (slow, regressing or no progress),
or a dash (insufficient data to assess).
FIGURE 8.22 Key priorities for Australian overseas development aid (ODA), 2013–14
Source: Data derived and quoted from various sources including ‘Budget, Australia’s International Development Assistence Program, 2013–14’, Statement by Bob Carr, Minister for Foreign Affairs (14 May 2013), pp. 5–13; and
‘Budget — Australia’s International Development Assistance Program, 2011–12’ , p. 79.
In addition to Australian government aid, there is also substantial private aid that is distributed through international agencies like the Red Cross, World Vision and Oxfam.
• Try applied economic exercise 5, p. 341
• Try analysis of written evidence — using an article about microcredit, pp. 345–6
• Try economic simulation activity — using a board game called Third World Debt, p. 343
• Try class debate 7, 8, 9, 10, p. 343
1 Define what is meant by foreign aid.
2 What are the three main forms of foreign aid?
3 The Australian government donates foreign aid to reduce poverty. Explain: a which countries are the
main recipients of this aid
b how much official development aid is provided.
c08DevelopmentEconomics.indd 334 12/09/14 7:13 AM
UN
CO
RR
EC
TED
PA
GE
PR
OO
FS
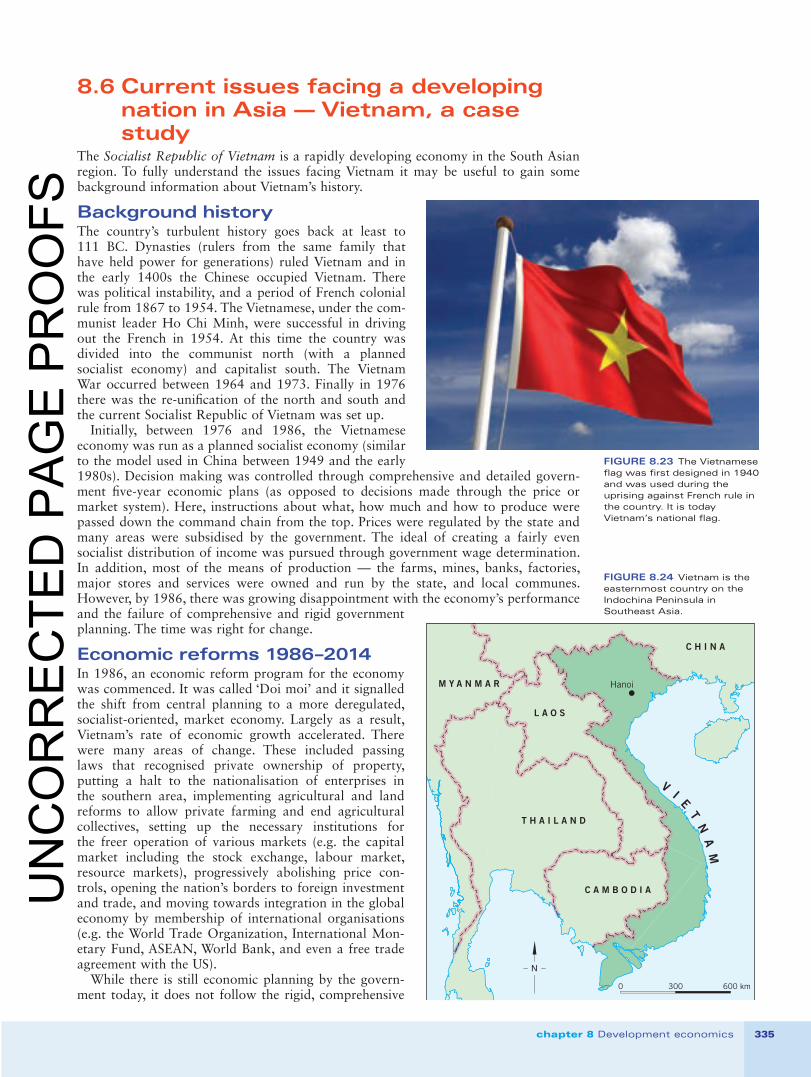
335chapter 8 Development economics
8.6 Current issues facing a developing nation in Asia — Vietnam, a case study
The Socialist Republic of Vietnam is a rapidly developing economy in the South Asian region. To fully understand the issues facing Vietnam it may be useful to gain some background information about Vietnam’s history.
Background historyThe country’s turbulent history goes back at least to 111 BC. Dynasties (rulers from the same family that have held power for generations) ruled Vietnam and in the early 1400s the Chinese occupied Vietnam. There was political instability, and a period of French colonial rule from 1867 to 1954. The Vietnamese, under the com-munist leader Ho Chi Minh, were successful in driving out the French in 1954. At this time the country was divided into the communist north (with a planned socialist economy) and capitalist south. The Vietnam War occurred between 1964 and 1973. Finally in 1976 there was the re-unifi cation of the north and south and the current Socialist Republic of Vietnam was set up.
Initially, between 1976 and 1986, the Vietnamese economy was run as a planned socialist economy (similar to the model used in China between 1949 and the early 1980s). Decision making was controlled through comprehensive and detailed govern-ment fi ve-year economic plans (as opposed to decisions made through the price or market system). Here, instructions about what, how much and how to produce were passed down the command chain from the top. Prices were regulated by the state and many areas were subsidised by the government. The ideal of creating a fairly even socialist distribution of income was pursued through government wage determination. In addition, most of the means of production — the farms, mines, banks, factories, major stores and services were owned and run by the state, and local communes. However, by 1986, there was growing disappointment with the economy’s performance and the failure of comprehensive and rigid government planning. The time was right for change.
Economic reforms 1986–2014In 1986, an economic reform program for the economy was commenced. It was called ‘Doi moi’ and it signalled the shift from central planning to a more deregulated, socialist-oriented, market economy. Largely as a result, Vietnam’s rate of economic growth accelerated. There were many areas of change. These included passing laws that recognised private ownership of property, putting a halt to the nationalisation of enterprises in the southern area, implementing agricultural and land reforms to allow private farming and end agricultural collectives, setting up the necessary institutions for the freer operation of various markets (e.g. the capital market including the stock exchange, labour market, resource markets), progressively abolishing price con-trols, opening the nation’s borders to foreign investment and trade, and moving towards integration in the global economy by membership of international organisations (e.g. the World Trade Organization, International Mon-etary Fund, ASEAN, World Bank, and even a free trade agreement with the US).
While there is still economic planning by the govern-ment today, it does not follow the rigid, comprehensive
FIGURE 8.23 The Vietnamese fl ag was fi rst designed in 1940 and was used during the uprising against French rule in the country. It is today Vietnam’s national fl ag.
0 300 600 km
Hanoi
T H A I L A N D
C H I N A
L A O S
M Y A N M A R
C A M B O D I A
VI
ET
NA
M
N
FIGURE 8.24 Vietnam is the easternmost country on the Indochina Peninsula in Southeast Asia.
c08DevelopmentEconomics.indd 335 12/09/14 7:13 AM
UN
CO
RR
EC
TED
PA
GE
PR
OO
FS

336 economics down under book 1
model of the past. Indeed, the last completed five-year indicative plan covers the period 2011–15. It set out broad guidelines for continued social and economic development, along the lines of a socialist-oriented, market economy. It emphasises ongoing struc-tural change from a rural economy to an industrialised modern system by 2020.
Some highlights of recent economic developmentDue to war and many other obstacles limiting economic development until recently, there were high poverty rates and fairly miserable daily living conditions. However, starting in 1986, there has been remarkable economic, social and political progress in Vietnam, affecting the lives of 91 million people.• Average annual level of per capita income or GDP (after allowing for inflation)
increased nearly sevenfold between 1990 and 2012, from US$200 to over US$1600. This represents an average rise of almost 6 per cent a year in purchasing power and is a major reason for the reduction in poverty and improved life expectancy.
• The growth rate in household consumption more than quadrupled between 1987 and 2012, dramatically lifting general living standards.
• With rising incomes and consumption, overall poverty rates have fallen to 17.2 per cent (with 22.1 per cent in rural areas and 5.4 per cent in urban areas). Average life expectancy at birth is now over 73 years and the adult literacy rate is around 94 per cent (with about 90 per cent of children attending primary school).
• Sustained and rapid economic growth was the main reason for improved living con-ditions (although there was a setback during the GFC in 2009). As partly reflected in figure 8.25 below, Vietnam’s GDP has risen by an average of around 6.5 per cent a year for the past 10 years. At this rate, production has far outstripped population growth (which has slowed to around 1 per cent due to reduced infant mortality, better edu-cation and improved health). Based on recent trends, many of the United Nation’s millennium development goals will be achieved in Vietnam by 2015.
01234
Populationgrowthrate(annual %)
GDPgrowthrate(annual %)
20
02
20
03
20
04
20
05
20
06
20
07
20
08
20
09
20
10
20
11
20
12
20
13
20
14
20
15
20
16
20
17
20
18
56
9
78
Comparison of Vietnam’s growth rate in GDP and population, 2002–2014
Year
Ann
uate
rat
e of
cha
nge
(per
cent
age)
• There has been a fast rate of growth in domestic (i.e. government, private) and foreign investment spending (averaging well over 10 per cent a year) on physical plant, equip-ment, and social and economic infrastructure (e.g. treated water supply, electricity, transport, health, schools and universities, legal institutions, sewerage). This has accel-erated the growth in output per hour worked, expanded the nation’s production poss-ibility frontier and, most importantly, improved people’s daily lives.
• Thanks to strong investment and economic growth in most recent years to 2013, unemployment rates have been very low, averaging less than 2.0 per cent of the labour force. This has meant that there is less unused productive capacity, higher incomes and reduced poverty.
• There has been massive structural change in the economy. Resources have shifted from a traditional rural subsistence economy, to one that is more modern, urbanised, indus-trialised and internationalised. For instance, in 1987, agriculture contributed nearly 41 per cent of GDP, but by 2013 this had fallen to around 19 per cent. On the other hand, during the same period, manufacturing industry rose from 28 to 42 per cent of GDP by value. There was also a substantial growth of services and exports, as is typical of more developed economies.
FIGURE 8.25 Comparison of Vietnam’s annual growth rate in GDP to its population
Sources: Data derived from various sources including the Federal
Ministry for Economic Cooperation and Development, CIA The
World Factbook, World Bank see data.worldbank.org/country/vietnam#cp_gep. Note: data for
2014 are only estimates.
c08DevelopmentEconomics.indd 336 12/09/14 7:13 AM
UN
CO
RR
EC
TED
PA
GE
PR
OO
FS
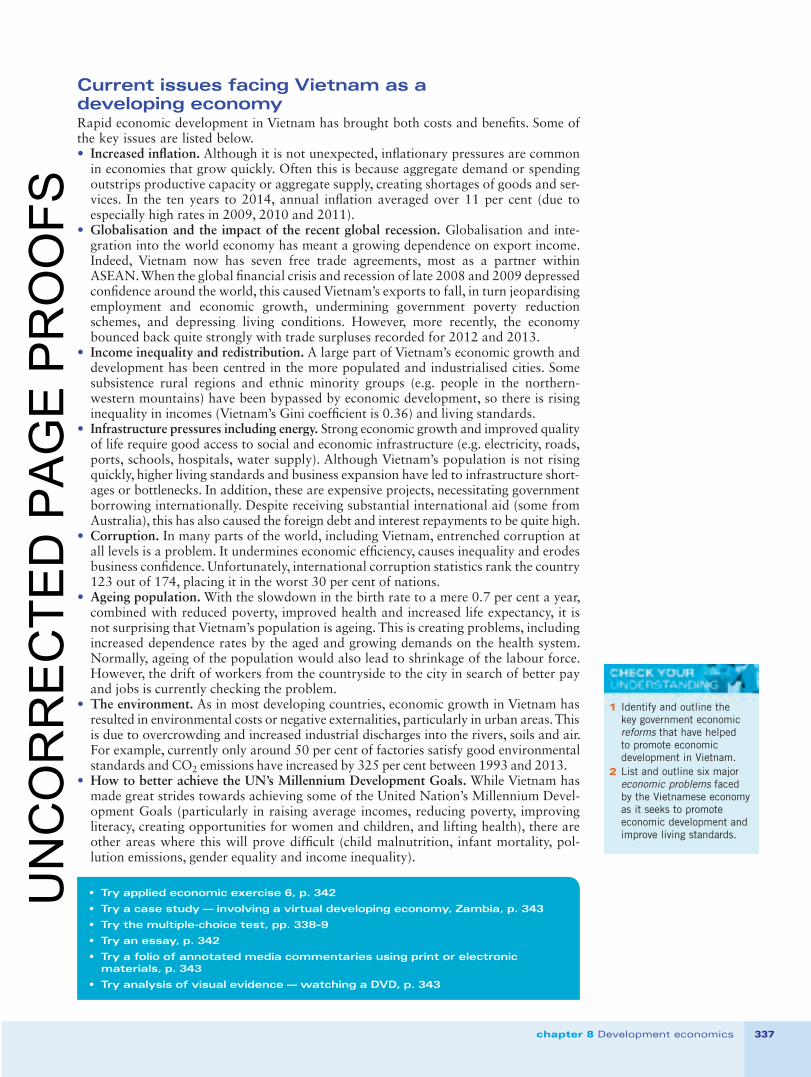
337chapter 8 Development economics
Current issues facing Vietnam as a developing economyRapid economic development in Vietnam has brought both costs and benefits. Some of the key issues are listed below.• Increased inflation. Although it is not unexpected, inflationary pressures are common
in economies that grow quickly. Often this is because aggregate demand or spending outstrips productive capacity or aggregate supply, creating shortages of goods and ser-vices. In the ten years to 2014, annual inflation averaged over 11 per cent (due to especially high rates in 2009, 2010 and 2011).
• Globalisation and the impact of the recent global recession. Globalisation and inte-gration into the world economy has meant a growing dependence on export income. Indeed, Vietnam now has seven free trade agreements, most as a partner within ASEAN. When the global financial crisis and recession of late 2008 and 2009 depressed confidence around the world, this caused Vietnam’s exports to fall, in turn jeopardising employment and economic growth, undermining government poverty reduction schemes, and depressing living conditions. However, more recently, the economy bounced back quite strongly with trade surpluses recorded for 2012 and 2013.
• Income inequality and redistribution. A large part of Vietnam’s economic growth and development has been centred in the more populated and industrialised cities. Some subsistence rural regions and ethnic minority groups (e.g. people in the northern- western mountains) have been bypassed by economic development, so there is rising inequality in incomes (Vietnam’s Gini coefficient is 0.36) and living standards.
• Infrastructure pressures including energy. Strong economic growth and improved quality of life require good access to social and economic infrastructure (e.g. electricity, roads, ports, schools, hospitals, water supply). Although Vietnam’s population is not rising quickly, higher living standards and business expansion have led to infrastructure short-ages or bottlenecks. In addition, these are expensive projects, necessitating government borrowing internationally. Despite receiving substantial international aid (some from Australia), this has also caused the foreign debt and interest repayments to be quite high.
• Corruption. In many parts of the world, including Vietnam, entrenched corruption at all levels is a problem. It undermines economic efficiency, causes inequality and erodes business confidence. Unfortunately, international corruption statistics rank the country 123 out of 174, placing it in the worst 30 per cent of nations.
• Ageing population. With the slowdown in the birth rate to a mere 0.7 per cent a year, combined with reduced poverty, improved health and increased life expectancy, it is not surprising that Vietnam’s population is ageing. This is creating problems, including increased dependence rates by the aged and growing demands on the health system. Normally, ageing of the population would also lead to shrinkage of the labour force. However, the drift of workers from the countryside to the city in search of better pay and jobs is currently checking the problem.
• The environment. As in most developing countries, economic growth in Vietnam has resulted in environmental costs or negative externalities, particularly in urban areas. This is due to overcrowding and increased industrial discharges into the rivers, soils and air. For example, currently only around 50 per cent of factories satisfy good environmental standards and CO2 emissions have increased by 325 per cent between 1993 and 2013.
• How to better achieve the UN’s Millennium Development Goals. While Vietnam has made great strides towards achieving some of the United Nation’s Millennium Devel-opment Goals (particularly in raising average incomes, reducing poverty, improving literacy, creating opportunities for women and children, and lifting health), there are other areas where this will prove difficult (child malnutrition, infant mortality, pol-lution emissions, gender equality and income inequality).
• Try applied economic exercise 6, p. 342
• Try a case study — involving a virtual developing economy, Zambia, p. 343
• Try the multiple-choice test, pp. 338–9
• Try an essay, p. 342
• Try a folio of annotated media commentaries using print or electronic materials, p. 343
• Try analysis of visual evidence — watching a DVD, p. 343
1 Identify and outline the key government economic reforms that have helped to promote economic development in Vietnam.
2 List and outline six major economic problems faced by the Vietnamese economy as it seeks to promote economic development and improve living standards.
c08DevelopmentEconomics.indd 337 12/09/14 7:13 AM
UN
CO
RR
EC
TED
PA
GE
PR
OO
FS

SCHOOL ASSESSMENT TASKS AND LEARNING ACTIVITIES
338 economics down under book 1
In order to satisfactorily complete VCE Economics Unit 2, Outcome 2, the teacher must decide whether the student has demonstrated the general achievement of the set of outcomes specifi ed for the unit, including key knowledge and key skills for Outcome 2. The teacher’s decision should refl ect results from a selection of school-based assessment tasks. Generally, this assessment should take place as part of the normal teaching and learning program. In addition, most assessment will be completed in class under a limited time frame. With this in mind, teachers may select from an appropriate range of tasks provided on the following pages.
Multiple-choice test questions
Using the multiple-choice answer grid, select the letter (A, B, C, D) that represents the most appropriate answer for each question, by marking it with a tick (✓).
Answer grid
Question A B C D
1
2
3
4
5
6
7
8
9
10
11
12
13
14
Question 1Which of the following measures best indicates the level of material living standards?A GDPB GDP per capitaC GDP per capita adjusted for purchasing power parity (PPP)D Total national income
Question 2Which of the following developing countries would currently have the lowest per capita income?A ChinaB FijiC VietnamD Brazil
Question 3All of the following would tend to cause a nation’s productive capacity to grow, except:A discovery of new mineral deposits.B increased household consumption spending and reduced rates of
national saving and investment.C use of genetically modifi ed crops in agriculture.D government provision of improved infrastructure, including water
and power supply.
Question 4The concept of labour effi ciency or productivity is best defi ned as:A the level of production or GDP per year.B the rate of economic growth between one year and the next.C the value of GDP divided by the total number of hours worked.D the value of GDP divided by the size of the population.
Question 5Agricultural productivity in low-income countries is usually very weak due to:A the lack of access to technology and fertiliser, and the use of
traditional methods of production.B overcrowding, the diminished size of farms and the shift onto
less fertile agricultural soils.C widespread underemployment of labour.D All of the above are common.
Question 6Most low-income countries are characterised by:A the vicious cycle of poverty.B the lack of savings and proper fi nancial institutions.C high interest rates, low investment and the absence of
widespread business expansion.D All of the above slow economic development.
Question 7Regarding economic growth and development in a low-income country, which of the following is incorrect?A Economic development concerns improvements in general living
standards and the quality of daily life.B Economic development is only concerned with rises in material
living standards.C Economic development may be helped by economic growth, if
output grows faster than the total population.D Economic development often used to be seen as the same thing
as economic growth, until the late 1970s and early 1980s when the concept was broadened.
Question 8Which of the following would be least likely to accelerate economic development in a low-income country?A Allowing free speech and democracyB Using foreign borrowing to fi nance consumption and military
spendingC Increased spending on lifting literacy and education standardsD Measures to improve health (including sanitation, vaccination
programs and water supply), reduce infant mortality rates, and improve welfare benefi ts for the aged
Question 9Most low-income countries have large balance of payments current account defi cits. Which of the following generally offers the weakest explanation of this problem?A Often rich countries in Europe, Japan and the United States
protect their farmers and fi rms, thus limiting export volumes from low-income countries.
B Widespread subsistence farming in many of these countries reduces export volumes.
C There are usually heavy interest repayments by low-income countries on their large foreign debts.
D Imports of defence equipment by dictatorships are easily the main reason for the defi cit.
Question 10Which statement about foreign debt in low-income countries is incorrect?A All foreign debt is bad and slows economic development through
income repayment abroad to rich nations.B Debt that is used for social and economic infrastructure can help
to improve the quality of daily life of ordinary people, partly by growing the nation’s productive capacity.
c08DevelopmentEconomics.indd 338 12/09/14 7:13 AM
UN
CO
RR
EC
TED
PA
GE
PR
OO
FS

SCHOOL ASSESSMENT TASKS AND LEARNING ACTIVITIES
339chapter 8 Development economics
C For some countries, the value of the foreign debt is equal to more than 100 per cent of the value of GDP.
D All of the above.
Question 11Rapid population growth is often a serious problem in low-income countries because:A overpopulation puts pressure on the nation’s limited natural
resources, depresses rural productivity and worsens environmental damage.
B it causes many problems associated with accelerated rates of urban growth.
C it diminishes the quality of social and economic infrastructure and worsens the government’s fi nancial problems.
D All of the above.
Question 12Which statement about economic development in Vietnam since the later 1980s is correct?A Being a socialist country, there has been a switch from a market
to a fully or comprehensively government planned economy, like that in China.
B Population growth is very rapid by comparison with Australia or high-income economies.
C There has been general acceptance of trade liberalisation and integration into the global economy.
D All of the above.
Question 13International and Australian foreign aid is mostly used to promote development in line with the United Nation’s Millennium Development Goals. Which statement about international aid is false?A Australia donates a higher percentage of its GDP in foreign aid,
than do the US or Japan.B Hard loans to low-income countries are those where the receiving
country is given a favourable, discounted or lower interest rate than that normally prevailing in the market.
C Debt repayments by low-income countries mean that governments often reduce outlays on education and health.
D The achievement of the UN’s Millennium Development Goals involve improving a broad range of aspects affecting the quality of daily life for people living in low-income countries by 2015, indicated by around 60 statistical measures.
Question 14Increasing investment levels is vital for economic development. Which statement about the role of investment in low-income countries is incorrect?A High levels of investment grow labour productivity and per capita
incomes.B High levels of investment in social infrastructure improve the
daily wellbeing of people, and grow productivity and per capita incomes.
C High levels of investment in the long term will cause even higher unemployment by replacing labour with physical capital, equipment and machines.
D High levels of investment help to break the vicious cycle of poverty and low income.
Terminology revision
Below is a list of some of the main economic terms used in chapter 8. Briefl y and accurately write out defi nitions for each
of these terms. Alternatively, an interesting way to revise terminology is to construct your own crossword. Use the Economics dictionary in your text to write the clues and refer to table 8.4 for the terminology.
WeblinksUse the crossword weblink to help you create your puzzle.
TABLE 8.4 Economics terms used in chapter 8
debt repayments/servicing
infrastructure (social and economic)
productive capacity of a nation
economic development
International Monetary Fund (IMF)
protection
economic growth low-income countries savings
foreign or international aid (gifts and loans)/ODA
microcredit subsidies
Gini coeffi cient for income distribution
Millennium Development Goals (MDG)
tariffs
globalisation overseas debt vicious cycle of poverty
high-income countries
per capita GDP World Bank
human development index (HDI)
poverty
investment production possibility frontier (PPF)
Applied economic exercises
Question 1A Defi ne what is meant by low-income countries. What are some of
the general consequences or indicators of being a low-income country?
B ‘Economic development is more than accelerating the rate of economic growth’. Explain what this statement means.
Question 2A Explain how each of the following can be used to measure the
level of economic development in low-income countries, noting the main weakness of each:
(i) annual average GDP per capita(ii) human development index (HDI)(iii) indicators for the Millennium Development Goals (MDG).
B Use the information in table 8.5 below to calculate GDP per capita for Australia and Vietnam.
TABLE 8.5
Data Australia Vietnam
Value of GDP (nominal US$ millions)
1 515 468 138 100
Population size (millions) 23.1 90.4
Average GDP per capita per year (US$)
$ .................. $ ...................
Sources: Data derived from International Monetary Fund and World Bank. Note: Data are for 2013.
C Carefully examine table 8.6 (p. 340), which contains seven possible indicators for the level of economic development in selected countries.(i) Your task is to try to calculate your own composite (i.e.
single) index measuring the level of economic development, using any four of these seven indicators. Show your calculations and justify your choice of measure. It is up to you whether you score or measure your index out of 400, 100, 10 or any other number of index points, and whether you weigh some items or indicators in this index more heavily than others because you feel they have a larger infl uence on the level of economic development.
(ii) Using your calculated index, rank the six countries from the highest to the lowest level of economic development.
c08DevelopmentEconomics.indd 339 12/09/14 7:13 AM
UN
CO
RR
EC
TED
PA
GE
PR
OO
FS

SCHOOL ASSESSMENT TASKS AND LEARNING ACTIVITIES
340 economics down under book 1
TABLE 8.6 Some possible indicators of economic development in selected countries
Country
1. Index of people above
the poverty line of $1.25/day (100 is best)
2. Life expectancy
index (100 is long life
expectancy)
3. Adult literacy
index (100 is top score)
4. Education index (100 is
top score)
5. Employment index (100 is no unemployment)
6. Index of corruption
perception (100 is least corrupt)
7. Index of national income
received (100 is best)
Australia 100 82 99 99.3 95 81 86
Indonesia 82 69 92 83 93 32 54
Zambia 32 49 71 67 86 38 38
Rwanda 37 55 71 60.2 70 53 35
Niger 56 54 28 26.7 59 34 27
Sierra Leone 47 48 42 38.1 61 30 29
Sources: Data derived from Human Development Report, see data.worldbank.org/indicator/NY.GDP.PCAP.CD. UNDP, Human development indicators, 2013, see hdr.undp.org/en/content/human-development-indicators-and-thematic-tables. Transparency International, see www.transparency.org/topic/detail/
politics_and_government. The CIA Factbook, OECD, NationMaster.com and other. Note: most data is for 2012 or 2013.
You might also like to check out a similar activity using the United Nation’s Human Development Reports to construct or build your own HDI — see hdr.undp.org/en/data/build
Question 3‘Low-income countries have limited productive capacity. One requirement for economic development is to grow this capacity.’A Accurately defi ne what is meant by an economy’s productive
capacity, explaining this using an appropriate diagram.B Why are high levels of investment spending important for
economic development? Use the vicious cycle of poverty diagram to show why investment is inadequate and poverty is high in low-income countries.
C What are economic and social infrastructure? Provide two examples of each. Explain how poor infrastructure restricts economic development.
D Identify and explain at least four important ways that rapid population growth tends to slow economic development in many low-income countries.
E Why is the growth of exports so important for low-income developing countries? Identify and explain two reasons why the
growth in their exports is limited, thereby slowing economic development.
F How might the development of democracy actually help to promote faster economic development in low-income countries?
Question 4Examine the data relating to the productive capacity or production possibilities for a hypothetical low-income country in northern Africa, called the Republic of Saradonia. This small country is primarily an agricultural economy, but it is starting to grow its manufacturing industry. Assume therefore, that the country can choose to produce either manufactured goods or agricultural goods. This and other information is shown in table 8.7 below. Notice that there are two parts to the table, one containing data for 2015 and the other containing data for 2020. Each table has numbered lines, 1–5.A Use lines 1 and 2 of the table of information for 2015 to accurately
complete and fully label a production possibility diagram, similar to that shown in fi gure 8.26 (p. 341). This should contain the production possibility frontier (PPF) for Saradonia in 2015. Next, accurately draw and clearly label a new PPF for Saradonia in 2020. This can be done using the 2020 data, lines 1 and 2.
TABLE 8.7 Production possibilities for the hypothetical country of Saradonia, a low-income developing economy
Information for Saradonia, 2015Production possibility A
Production possibility B
Production possibility C
Production possibility D
1. Annual production of manufactured goods in 2015 (US$ millions)
250 200 100 0
2. Annual production of agricultural goods in 2015 (US$ millions)
0 350 550 600
3. Calculate the potential total level of GDP in 2015 at different production possibilities (US$ millions) =
............. .............. .............. ...........
4. Population size (millions) in 2015 = 1.2 million 1.2 million 1.2 million 1.2 million
5. Calculate the annual average level of GDP per capita in 2015 at different production possibilities (US$) =
............ ............. ............ .............
Information for Saradonia, 2020
Production possibility
A
Production possibility
B
Production possibility
C
Production possibility
D1. Annual production of manufactured goods in 2020
(US$ millions)350 250 150 0
2. Annual production of agricultural goods in 2020 (US$ millions)
0 400 650 750
3. Calculate the potential total level of GDP in 2020 at different production possibilities (US$ millions) =
............ ............ ............ ............
4. Population size (millions) in 2020 = 1.3 million 1.3 million 1.3 million 1.3 million
5. Calculate the annual average level of GDP per capita in 2020 at different production possibilities (US$) =
............ ............... ............. ............
c08DevelopmentEconomics.indd 340 12/09/14 7:13 AM
UN
CO
RR
EC
TED
PA
GE
PR
OO
FS

SCHOOL ASSESSMENT TASKS AND LEARNING ACTIVITIES
341chapter 8 Development economics
A To what extent have world poverty rates (defi ned here at US$1 per day) been reduced between 1981 and 2005, leaving China in the statistics?
B By comparison, if China is removed from the data (see graph 2, fi gure 8.27 below), to what extent have global poverty rates been reduced?
C List and briefl y outline four important policies that would help reduce global poverty.
70
Graph 1 — Poverty levels over time — percentage of worldpopulation
60
50
40
30
20
10
01981
Wor
ld p
opul
atio
n (p
erce
ntag
e)
$1.00 a day $1.25 a day
$2.00 a day$1.45 a day
$2.50 a day
1984 1987 1990 1993 1996 1999 2002 2005
Graph 2 — Poverty levels over time excluding China — percentageof world population
Wor
ld p
opul
atio
n (p
erce
ntag
e)
70
60
50
40
30
20
10
01981
$1.00 a day $1.25 a day
$2.00 a day$1.45 a day
$2.50 a day
1984 1987 1990 1993 1996 1999 2002 2005
FIGURE 8.27 Trends in global poverty rates (percentage of total population using different poverty lines) by region
Source: Graphs reproduced from Global Issues website using data from the World Bank Development Report (2008).
700
800
600
500
400
300
200
100
00 200
Annual production of manufacturedgoods ($ millions)
Ann
ual pr
oduc
tion
of
agri
cult
ural
goo
ds (
$ m
illio
ns)
400
FIGURE 8.26 Production possibility diagram for Saradonia, a low-income developing economy
B In general, the size of any nation’s PPF is affected by two main sets of factors. Identify and outline these two factors, explaining how they might affect the size of the PPF.
C Assuming that the nation is fairly typical of low-income countries, identify and explain at least six specifi c developments that could account for the growth in the size of Saradonia’s PPF between 2015 and 2020. Complete the calculations in lines 3 and 5 of the tables for 2015 and 2020. Using your calculations for Saradonia in 2015 and 2020, attempt the following:(i) Explain what has happened to economic growth (measured
by changes in GDP, US$ millions) over the years 2015–2020.
(ii) Explain what has happened to general material living standards (measured by average GDP per capita) between 2015 and 2020. Giving reasons, would you draw the same conclusion had Saradonia’s population grown at a faster rate to reach 1.5 million (not 1.3 million) by 2020?
(iii) Which point on the PPF (i.e. A, B, C, D) results in the highest average level of material living standards in both 2015 and 2020? Describe the combination or types of goods produced at this point.
D The pressures of population growth create problems for many low-income countries. Imagine that you are a development economist advising Saradonia about its population policies. Without using force, list and explain four key measures (in descending order) that you would recommend to the government in order to halve the birth rate over the next ten years.
E In order to fi nance development projects including investment in social and economic infrastructure, the government of Saradonia negotiated to borrow US$2 billion as a hard loan through the World Bank. Assuming that this was spent on improving water supply, education and power generation, how might this affect economic development? What economic problems might result from this hard loan?
Question 5Examine fi gure 8.27 showing trends in global poverty rates, before answering the questions that follow.
c08DevelopmentEconomics.indd 341 12/09/14 7:13 AM
UN
CO
RR
EC
TED
PA
GE
PR
OO
FS

SCHOOL ASSESSMENT TASKS AND LEARNING ACTIVITIES
342 economics down under book 1
Question 6A What are the main types of foreign aid and what are its main aims?B Which type of aid is probably most benefi cial to a low-income
country? Explain.C ‘Australia is not as generous as the US when it comes to foreign
aid.’ Discuss this opinion using statistical evidence drawn from your text and elsewhere.
D Identify and explain two important problems associated with foreign aid in low-income countries.
E Examine table 8.8 below containing estimates for some non-essential spending by the world, as against the cost of overcoming problems that lead to poverty in low-income countries. Use the data in the table to calculate the percentage of the world’s annual military spending that would be required to overcome some of the key problems that lead to poverty in low-income countries.
TABLE 8.8 Estimates of spending on non-necessities and the outlays required to help alleviate global poverty
Areas of global spending on non-necessities US$ billions
1. Cosmetics purchased in the United States 8
2. Spending on ice-cream in Europe 11
3. Consumption of perfumes in Europe and the United States
12
4. Purchases of pet food in Europe and the United States
17
5. Business entertainment in Japan 35
6. Spending on cigarettes in Europe 50
7. Alcoholic drinks in Europe 105
8. Global consumption of narcotic drugs 400
9. Global military spending 780
TOTAL 1418
The cost of improving some aspects of daily life for those in low-income countries US$ billions
1. Primary education for all 6
2. Access to clean water and sanitation for all 9
3. Improve women’s health 12
4. Basic nutrition and health 13
TOTAL 40
Source: Data derived from Global Issues website. Estimates are based on World Bank fi gures from 1998.
Question 7Vietnam is a successful developing economy that has adopted a socialist-oriented, market type of economic system.A What is meant by a socialist system?B What role does the market play in this economy? What is the
alternative system?C What are three important developments that have helped to
accelerate the rate of economic growth in Vietnam?D Examine fi gure 8.28 below.
When the pace of Vietnam’s economic development accelerated (annual economic growth averaged nearly 7 percent) and the economy approached its PPF where unemployment was low, why is it not surprising that the infl ation rate also increased, as shown in 2007–08 (or indeed infl ation averaged a high 10.7 per cent between 2003–04 and 2013–14).E In Vietnam, there has been a drift away from agricultural
production towards manufacturing. Outline one cost and one benefi t of this structural change.
F How might the growth in the value of Vietnam’s exports help the country’s economic development?
G In Vietnam, there has been a rapid growth in the level of government, and especially private, investment spending. Foreign direct investment rose to average around US$10–11 billion per year between 2011 and 2014.(a) Explain why high levels of investment are vital for
accelerating the rate of economic development.(b) Identify and explain one possible economic problem
associated with the rise in foreign investment in Vietnam.
An essay
Write a 400-word essay that answers the following question.Identify and explain what you feel are the four main causes of
poverty and low living standards in most Third World nations. For each problem, explain two key policy changes that are needed to help overcome these obstacles to economic development. Where possible, illustrate your answer by reference to particular countries.
A class debate
After dividing into two teams (one for the affi rmative and one for the negative), work with others to prepare a debate about one of the following topics: 1. It is immoral that the richest 20 per cent of the world’s
population consumes 80 per cent of the world’s resources.
–5
0
54.1
2.9
7.9 8.2 7.8
7.8 7.1 7.1
11.1
10
15
20
–0.75
2525
30
20
00
–01
20
01
–02
20
02
–03
20
03
–04
20
04
–05
20
05
–06
20
06
–07
20
07
–08
20
08
–09
20
10
–11
20
11
–12
20
12
–13
20
14
–15
20
15
–16
20
09
–10
Ann
ual i
n�at
ion
rate
(pe
rcen
tage
)
Trends in Vietnam’s in�ation rate (annual percentage)
Year
11.8
17.3
6.9
FIGURE 8.28 Recent trends in Vietnam’s infl ation rate
Sources: Data derived from various sources including the World Bank Group, NationMaster, CIA World Factbook and other.
c08DevelopmentEconomics.indd 342 12/09/14 7:13 AM
UN
CO
RR
EC
TED
PA
GE
PR
OO
FS

SCHOOL ASSESSMENT TASKS AND LEARNING ACTIVITIES
343chapter 8 Development economics
2. The best way to improve living standards in low-income countries is to provide free contraceptives and enforce a policy involving a one-child family, as used in China.
3. A colonial past has caused many poor countries to be even poorer.
4. Economic development should seek to promote industrialisation.
5. The main thing for economic development is to maximise the country’s rate of economic growth.
6. Western nations need to spread democracy as a solution to poverty in Third World nations.
7. Rich countries keep low-income countries poor. 8. Rich nations need to show leadership and morality by
quadrupling the percentage of their GDP provided in foreign aid or assistance.
9. International aid creates more problems than it solves for low-income countries.
10. Debt cancellation by rich nations helps low-income countries to accelerate economic development.
Economic simulation activity — using a board game called Third World Debt
You may like to play a board game that simulates the problems faced by developing countries. It is called Third World Debt. It was designed by Dave Thorby, published in 2005 by JKLM Games, involves 2–6 players, and takes around 120 minutes to play. The product’s website states: ‘Do you take out that loan or do you build that factory? Can you afford to not build or do you have enough to give yourself an income that will eventually clear your debts? These are the questions you need to answer in order to give your country the chance to make it. Third World Debt is a game that pushes you to the limit. You have to make crucial decisions that will lead you to eventual stability. The question is how much debt can you sustain in order to achieve your goal quickest?
Case study — involving a virtual developing economy, Zambia
WeblinkUse the virtual tour of a developing economy weblink in your eBookPLUS to take you on a virtual tour of a developing economy, Zambia, located in Africa. The site will introduce you to concepts and issues associated with development economics in that country. You will go on virtual � eld trips, see photos, use maps, and be able to access relevant data, terminology and economic theory. There are even worksheets available for completion and a teacher’s guide.
Analysis of visual evidence — a cartoon
There are many cartoons in this text that can be used to extend a student’s understanding of economics. Why not examine the cartoons using the following questions as a guide?• What is the economic concept being presented in the cartoon?• What is the main message of the cartoon?• What is your reaction to the cartoon? Do you agree with what it is
saying?• Is the message of the cartoon politically biased or distorted in
some way? Explain your answer.
A folio of annotated media commentaries using print or electronic materials
Carefully select four newspaper articles for a media folio about development economics as a global issue. For instance, these media commentaries may report:• Economic conditions and developments in low-income or Third
World nations• Government policies that have affected economic development
in a low-income or Third World country• Issues related to international aid programs (government and
private sources) and disaster relief efforts to help low-income or Third World countries
• International discussions by the WTO and other organisations related to reducing agricultural tariffs and farm subsidies by high-income countries in Europe, as well as in Japan and the US
• The effect of global economic conditions on low-income or Third World countries
• Poverty reduction policies in low-income or Third World countries• Developments in the pursuit of the UN’s Millennium
Development Goals.Annotate these articles. Identify, explain and discuss the major ideas raised in the media article. These extracts could come from various sources including print (i.e. newspapers and magazines) or the internet. Be sure to clearly indicate or footnote the source of this information.
Analysis of visual evidence — watching a DVD
There are a number of interesting DVDs and programs covering the topic of development economics. Try viewing the following: 1. The web movie ‘If the Earth was 100 people’ 2. Foreign Correspondent ‘Ethiopia famine’ (ABC) by reporter,
Chris Clarke 3. ‘Population and World Resources’ (Classroom Video) 4. The cutting edge — empty oceans, empty nets (SBS,
10 June 2003) 5. Future of food (SBS 1, 8 February 2011) 6. Global food equity (VEA, 2012) 7. The growing anger of hunger (SBS, 28 April 2009) 8. Aftermath, population overload (National Geographic,
12 March 2011) 9. Amazon (various programs, SBS, 19 October 2011)10. Food for all (New Atlantis, 2007)11. Why poverty, stealing Africa (ABC 2, 28 November 2012)12. TED: Hans Rosling — global population statistics (You-tube
9 July 2010)13. Australia’s aid — rising hope (Channel 10, 28 July 2013)14. Kevin McLeod (several parts, ABC 1, 26 October 2010)15. Slum survivors (IRIN, 2008)16. The problem of Third World debt (Blip TV, 2009)17. Vietnam — impact of aid and development (Classroom
Video)18. Welcome to India (various programs, SBS 1, 2013)19. Welcome to Legos (various programs, SBS 1, 2010)20. Economic development and new insights into
poverty with Hans Rosling, www.ted.com/talks/hans_rosling_reveals_new_insights_on_poverty
21. The rise of Asia with Hans Rosling, www.ted.com/talks/hans_rosling_asia_s_rise_how_and_when22. Myths about the developing world with
Hans Rosling, www.ted.com/talks/hans_rosling_shows_the_best_stats_you_ve_ever_seen
c08DevelopmentEconomics.indd 343 12/09/14 7:13 AM
UN
CO
RR
EC
TED
PA
GE
PR
OO
FS

SCHOOL ASSESSMENT TASKS AND LEARNING ACTIVITIES
344 economics down under book 1
WeblinksUse the miniature Earth web movie weblink in your eBookPLUS and watch the movie. During the program, make brief notes on important issues for later analysis or class discussion.
Analysis of visual evidence — using written and statistical evidence about global social and economic conditions
Read the following extract ‘If the world were a village of 1000 people’. This condenses the population of the world down to 1000 people (not the over 7 billion we now have).A What is the most common nationality?B How would expenditure on defence compare with spending on
health or education?C What are the most serious causes of death?
D Of the village income of $3 million, what proportion would the top 200 (i.e. 20 per cent) income earners receive, relative to the lowest 200?
E What proportion of the population would be children and what proportion would be over 65 years of age? Suggest reasons for this situation.
F What percentage of married women has access to and uses modern contraceptives? In turn, what problems does this create for some low-income countries?
G The richest or best fed 270 people (i.e. 27 per cent) would eat food crops grown on 280 acres of the most fertile 700 acres of arable land available. How much land is left to feed the remaining 73 per cent of the people?
H What proportion of villagers has access to clean drinking water?I What proportion of villagers owns automobiles?J What proportion of villagers is illiterate? Explain how this might
affect production, income and living standards.K What percentage of children is immunised against preventable
diseases?L Looking at the total village budget (public and private) of
$3 million available for spending (i.e. an average of $3000 per person if it were divided evenly; which, as mentioned, it is not), what area is regarded as more important — education, health or defence?
If the world were a village of 1000 peopleBy DONELLA MEADOWSIf the world were a village of 1000 people, it would include:• 584 Asians• 124 Africans• 95 East and West Europeans• 84 Latin Americans• 55 Soviets (including for the moment
Lithuanians, Latvians, Estonians and other national groups)
• 52 North Americans• 6 Australians and New Zealanders.
The people of the village have con-siderable dif� culty in communicating• 165 people speak Mandarin• 86 English• 83 Hindi/Urdu• 64 Spanish• 58 Russian• 37 Arabic.That list accounts for the mother tongues of only half the villagers. The other half speak (in descending order of frequency) Bengali, Portuguese, Indonesian, Japa-nese, German, French and 200 other lan-guages.
In this village of 1000 there are• 329 Christians (among them 187 Catho-
lics, 84 Protestants, 31 Orthodox)• 178 Moslems• 167 ‘non-religious’• l32 Hindus• 60 Buddhists• 45 atheists• 3 Jews• 86 people of all other religions.
• One-third (330) of the 1000 people in the world village are children and only 60 are over the age of 65. Half the children are immunised against preventable infec-tious diseases such as measles and polio.
• Just under half of the married women in the village have access to and use modern contraceptives.
• This year, 28 babies will be born. Ten people will die, 3 of them for lack of food, 1 from cancer, 2 of the deaths are of babies born within the year. One person of the 1000 is infected with the HIV virus; that person most likely has not yet developed a fullblown case of AIDS.
• With the 28 births and 10 deaths, the population of the village next year will be 1018.
• In this 1000-person commu-nity, 200 people receive 75 per cent of the income; another 200 receive only 2 per cent of the income.
• Only 70 people of the 1000 own an automobile (although some of the 70 own more than one automobile).
• About one-third have access to clean, safe drinking water.
• Of the 670 adults in the village, half are illiterate.
The village has six acres of land per person, 6000 acres in all, of which• 700 acres are cropland• 1400 acres pasture• 1900 acres woodland• 2000 acres desert, tundra, pavement
and other wasteland• The woodland is declining rapidly; the
wasteland is increasing. The other land categories are roughly stable.
The village allocates 83 per cent of its fertiliser to 40 per cent of its cropland —
FIGURE 8.29 Thinking of the world as a village helps us come to grips with some of the real problems in the world.
• 124 Africans
c08DevelopmentEconomics.indd 344 12/09/14 7:13 AM
UN
CO
RR
EC
TED
PA
GE
PR
OO
FS

SCHOOL ASSESSMENT TASKS AND LEARNING ACTIVITIES
345chapter 8 Development economics
Analysis of written evidence — using an article about microcredit
There is much poverty around the world, and income inequality between countries is huge. Sometimes people in rich countries would like to help but do not know where to start. They often feel powerless. However, each of us could make a difference. It is not always a matter of giving large ‘handouts’ to those in poor countries, but rather, a matter of providing them with a ‘helping hand’ so that they can become economically self-suffi cient and permanently independent. Years ago an Australian, David Bussau, had the idea of using microcredit to make a difference. It involves providing individuals and groups (often women) with a small amount of money capital to start up a business (perhaps made possible by the purchase of a sewing machine to manufacture clothes, an oven to prepare food, or basic tools for farming). This could involve lending as little as $100–200. In addition, interest rates on these loans are low and repayment times are very fl exible to help improve the opportunities for business success. A strength of this scheme is that the original money can be used over and over again to help start up new income-generating activities. Normally, these people would not be able to borrow credit from banks, because they are considered a bad risk. Alternatively, those wanting to go into business were at the
mercy of ‘loan sharks’, who charged huge interest rates and were harsh on people who defaulted on repayments. Once started, a small business can earn income, grow household savings, create jobs for others and reduce poverty in local communities. Indeed, according to the World Bank, these projects may eradicate 10 per cent of the world’s poverty by 2020. As recognition of the importance of the idea, the United Nations declared 2005 as the International Year of Microcredit.
Armed with this background information, read the newspaper article ‘For aid, just help yourself’ before answering the questions that follow.A What types of international development aid were provided by
the Australian government in 2013–14? About how much money did this involve that year?
B How many people internationally benefi t each year from microcredit according to the article?
C The article says that microcredit involves ‘small, collateral-free loans and other fi nancial services . . .’? What do you think this means and how is the money used?
D Using Bangladesh as a case study, how successful has the use of microcredit been?
E Name some international organisations providing microcredit.F What is the main United Nations ‘Millennium Development
Goal’?G What changes are needed to Australia’s foreign aid program,
according to RESULTS Australia?
For aid, just help yourselfShunned by traditional lenders, people in the Third World can now get low collateral loans to help them improve their lives. The results are encouraging, as MATT WADE reports.
THE First World’s reaction to great natural disasters, such as the Boxing Day tsunami, the Niger famine and the Pakistan earthquake, and to Third World poverty generally, is usually monetary aid.
At the United Nations General Assembly in September, the Prime Minister, John Howard, vowed to double the overseas aid allocation to about $4 billion a year by 2010, as Australia joined other wealthy nations in pledging billions of dollars in additional aid and debt relief for poor countries.
But this year has also been the UN’s Inter-national Year of Microcredit — a scheme to promote the use of tiny loans to help impov-erished families increase their incomes. While it has received less attention than natural disasters and political rhetoric, this method of helping the poor is � ourishing.
Microcredit is the provision of small, col-lateral-free loans and other � nancial ser-vices, mostly to very poor women who would normally be excluded from main-stream � nancial institutions. Loans of about $150 to $200 are used to start or expand small income-generating activities.
The State of the Microcredit Summit Report says the number of very poor people receiving a small loan grew from 7.6 million
in 1997 to last year’s 66.6 million, an average annual growth of 36 per cent.
It is possible that 1100 million people will receive a microloan this year — that’s � ve times the population of Australia. The report estimates that more than 80 per cent of microloans for the poor are taken by women. ‘The increase represents an additional 45.3 million poorest women reported as receiving microloans in the last � ve years,’ it says.
Bangladesh, once synonymous with famine and natural disasters, has become the showpiece for the effectiveness of microcredit. Millions of microloans have been made in Bangladesh and research by the World Bank, an advocate of
(continued)
that owned by the richest and best fed 270 people. Excess fertiliser running off this land causes pollution in lakes and wells. The remaining 60 per cent of the land, with its 17 per cent of the fertiliser, produces 28 per cent of the food grains and feeds 73 per cent of the people. The average grain yield on that land is one-third the harvest achieved by the richer villagers.
In the village of 1000 people, there are• 5 soldiers• 7 teachers• 1 doctor
• 3 refugees driven from home by war or drought.
The village has a total budget each year, public and private, of over $3 million — $3000 per person if it is distributed evenly (which, as we have already seen, it isn’t).
Of the total $3 million• $181 000 goes to weapons and warfare• $159 000 for education• $132 000 for health care.The village has buried beneath it enough explosive power in nuclear weapons to blow itself to smithereens many times over.
These weapons are under the control of just 100 of the people. The other 900 people are watching them with deep anxiety, wondering whether they can learn to get along together; and, if they do, whether they might set off the weapons anyway through inattention or technical bungling; and, if they ever decide to dis-mantle the weapons, where in the world village they would dispose of the radio-active materials of which the weapons are made.
Source: Sustainability Institute, 31 May 1990. Note: Other versions of this ‘village’ are also available.
c08DevelopmentEconomics.indd 345 12/09/14 7:13 AM
UN
CO
RR
EC
TED
PA
GE
PR
OO
FS

SCHOOL ASSESSMENT TASKS AND LEARNING ACTIVITIES
346 economics down under book 1
FIGURE 8.30 A report released today by the poverty advocacy group RESULTS found that more than 92 million people in developing countries were granted microloans last year. Of those, 66.6 million were classifi ed as very poor — surviving on less than $US1 ($1.34) a day.
micro� nance, has concluded they have been crucial in reducing poverty in that country.
A World Bank researcher, Shahidur Khandker, studied three Bangladeshi groups that provide microcredit — the Bangladesh Rural Advancement Com-mittee, Grameen Bank and a government program called RD-12. Khandker con-cluded that 3 per cent of clients got out of poverty each year because of their micro-loans and that microcredit accounted for 40 per cent of the reduction of moderate poverty in rural Bangladesh.
The UN Development Program’s Human Development Report found that Bangladesh had overtaken its giant neighbour India in reducing child mortality, despite having lower average incomes and a lower econ-omic growth rate. It said Bangladesh had achieved rapid human development and the prevalence of microcredit had helped.
Microcredit had been especially important in expanding choice and empowering
women. ‘While disparities still exist, women have become increasingly powerful cata-lysts for development, demanding greater control over fertility and birth spacing, edu-cation for their daughters and access to ser-vices,’ the Human Development Report says.
Microcredit for the poor was � rst tried in the early 1970s and has become an inte-gral part of the drive to alleviate poverty. Initially, the idea of using loans to help the poor was treated with suspicion by many aid agencies. But the strategy’s success in generating income for poor families meant it could not be ignored.
Most big aid agencies now have micro-credit projects. Thousands of organisations specialising in microcredit have also emerged.
Opportunity International, which made more than a million microloans last year, says the average loan in developing coun-tries is about $180 over six months. It says 87 per cent of its loans go to women
and each loan affects more than seven people on average. It has a global repayment rate of 98 per cent — better than many com-mercial banks.
Many micro-credit organ-isations resemble traditional � nan-cial service � rms, carrying banking licences and offering a range of products for poor clients, such as insur-ance. There are also ratings companies that assess the cred-it-worthiness of the major micro-credit organ-isations. Some of
the world’s biggest � nancial � rms, such as Citigroup, Deutsche Bank, ABN Amro, HSBC and ING have recently become involved in microcredit.
RESULTS Australia says microcredit can help the world achieve one of the Millen-nium Development Goals — to halve the number of people living on less than US$1 a day by 2015.
‘Micro� nance, while not a panacea, is still the best tool we have to reduce poverty among the very poor,’ the RESULTS report says.
However, the Australian government devotes a surprisingly small amount to this form of poverty alleviation — $14 million of its $2.5 billion aid budget. Con-sidering the Howard Government’s philo-sophical commitment to small business, this is peculiar.
The national manager of RESULTS Australia, Maree Nutt, says more government money must be put into micro-credit. ‘The percentage of Australian aid funding allocated for micro� nance has reached a plateau in recent years. Our goal is to see an increase in spending to around $40 million per year within the next two years. This could bring its allocation to around 1.2 per cent — not unreasonable, given its effectiveness in helping to reduce poverty, particularly in the lives of very poor people.’
Bruce Billson, who, as the parliamentary secretary for Foreign Affairs and Trade is responsible for the aid program, says he is all for microcredit and has indicated there will be further spending on it. ‘Our commit-ment to microcredit is signi� cant and it is an important part of our overall aid pro-gram. I’m optimistic we are going to see more support going into this area.’
Nutt wants the government to concen-trate new spending on helping small-loan providers to get started or to expand their capacity. ‘Our aid funding can play an important role in this initial phase,’ she says. ‘Once a program begins to cover costs, more funds for future expansion can be accessed from commercial and private investors. The donor can make its exit but the service remains.’
Source: The Sydney Morning Herald, 7 December 2005.
c08DevelopmentEconomics.indd 346 12/09/14 7:13 AM
UN
CO
RR
EC
TED
PA
GE
PR
OO
FS

CHAPTER 8
347chapter 8 Development economics
SUMMARY
Defi ning economic development and development economics• Once, economic development was seen as the same thing as economic growth. In other
words, it was thought that growing the level of national production or GDP was all that was needed to make people better off.
• However, from the 1980s onwards, economic development was seen more broadly as the economic, social, political and institutional changes needed in low-income countries, to improve material aspects (increased per capita levels of income and con-sumption) and non-material aspects (e.g. increased literacy, life expectancy, health) affecting the quality of daily life for ordinary people.
Measurement of and trends in economic developmentEconomic development is a tricky thing to measure, especially using a composite or single measure. Several measures are commonly used:• Average GDP per capita represents the total annual value of goods and services pro-
duced by a nation divided by the population size. This single measure suffers from many weaknesses including unrecorded subsistence production, unevenness in the distribution of goods, services and incomes, the failure to take account of negative externalities or costs, and the failure to take account of the quality of people’s daily lives.
• The human development index (HDI) is a composite measure. It is based on both an economic indicator (i.e. GDP per capita, with the fi gure adjusted or standardised to remove variations in the actual purchasing power of money in different countries — called purchasing power parity or PPP expressed in US$) and social indicators (i.e. life expectancy at birth and education standards shown by adult literacy rates). Critics claim this index is inaccurate, subjective and narrow.
• Millennium Development Goals and their measurement. The UN measures progress in achieving its eight key Millennium Development Goals, through around 60 separate indicators. This is a much broader approach to measuring economic development, but having so many indicators makes overall comparisons or ranking of countries harder.
Causes of poverty in low-income countriesMany theories have been used to try to explain the causes of economic development. Some have seen development as going through stages of economic growth. However, despite great differences that exist between countries, low-income countries commonly face the following obstacles.• The problem of limited productive capacity or PPF due to a low effi ciency or volume
of resources• Low levels of saving and investment cause the vicious cycle of poverty• Rapid population growth creates pressure on farming land, infrastructure and govern-
ment fi nances, and adds to high labour force unemployment rates• The lack of democracy and freedom contribute to poor government, incompetence
and corruption• Exports and foreign trade are limited, due partly to the trade protection policies of rich
nations, along with high levels of foreign debt or interest repayments• The existence of great inequality in the distribution of income and wealth contributes
to poverty for some• Some low-income countries were former colonies and exploited for their resources by
European powers
Strategies to promote economic growth and developmentGovernment policy and international assistance can help to accelerate economic devel-opment. One focus is to try to grow the country’s productive capacity or PPF, perhaps involving the following:• Strategies to lift private and government investment levels, thereby breaking the vicious
cycle of poverty• Better provision of basic social and economic infrastructure to improve people’s living
standards and encourage business expansion• Keeping debt levels and the burden of interest repayments to sustainable levels
c08DevelopmentEconomics.indd 347 12/09/14 7:13 AM
UN
CO
RR
EC
TED
PA
GE
PR
OO
FS

348 economics down under book 1
• Reforming government, including the promotion of democracy and free speech, making it more accountable
• Trying to persuade rich countries to move towards free trade and the removal of tariff protection, so that low-income countries can grow their export incomes and pay for imports
• Reducing inequality in the distribution of income and wealth so that the rich help to provide government revenue to fund infrastructure
• Reducing population pressures through better welfare for the aged, health care to lower infant mortality, family planning and education.
The role of government and private foreign aid to promote economic development• Foreign aid refers to fi nancial help (i.e. hard and soft loans, and gifts) and other assis-
tance, usually given by richer countries to poorer countries. • Aid can be offi cial (government) or non-offi cial (private). Often aid is used for projects
that help to pursue the UN’s Millennium Development Goals. • Australia gives nearly $6 billion annually in government foreign aid, or 0.36 per cent
of our GDP. • Aid goes to countries (especially in the Asia–Pacifi c area) including Papua New Guinea,
Solomon Islands, Indonesia, Vietnam, the Philippines, East Timor and Fiji. • Aid helps make up for the defi ciency of saving and investment funds in poorer coun-
tries, and can help break the cycle of poverty by raising effi ciency and per capita income levels.
Current issues facing a developing nation in Asia — Vietnam, a case study• In the years since 1986 (the start of Vietnam’s economic reform program called ‘Doi
moi’) there has been a shift from central planning to a more deregulated socialist-oriented market economy.
• Reforms have included the recognition of private ownership, implementing agricul-tural and land reforms to allow private farming and end agricultural collectives, set-ting up the necessary institutions for the freer operation of various markets (e.g. the capital market including the stock exchange, labour market and resource markets), opening the nation’s borders to foreign investment and trade, integration into the global economy, and encouraging ongoing structural change (shifting from a rural economy to an industrialised modern system by 2020).
• As a result of reforms, the rate of economic growth and economic development has accelerated; the average annual level of per capita income has increased almost seven-fold from US$200 to over US$1596, purchasing power has grown, poverty has been cut, and life expectancy and living standards increased.
• Despite progress, Vietnam faces challenges including infl ation, the ongoing effects of the global fi nancial crisis and ensuing uncertainty and recession (2008–09–10–11–12), corruption, inequality in living standards, infrastructure bottlenecks, energy shortages and environmental issues.
c08DevelopmentEconomics.indd 348 12/09/14 7:13 AM
UN
CO
RR
EC
TED
PA
GE
PR
OO
FS
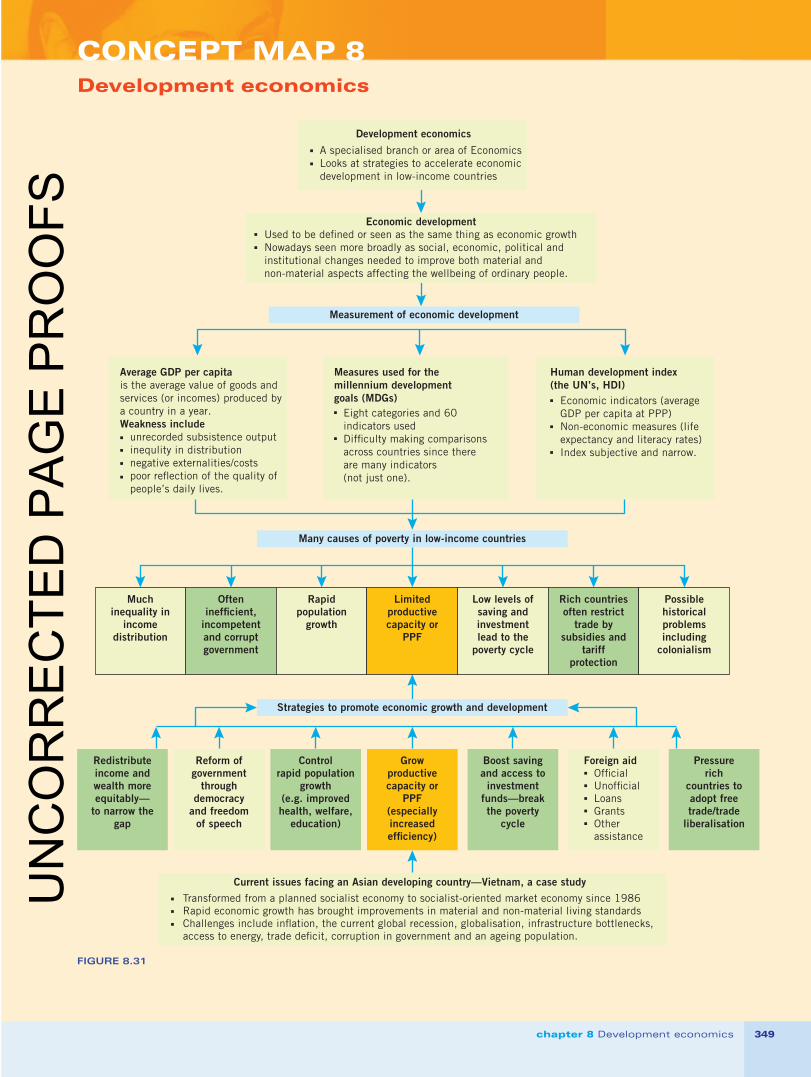
CONCEPT MAP 8
349chapter 8 Development economics
Development economics
Muchinequality in
incomedistribution
Ofteninef�cient,
incompetentand corruptgovernment
Rapidpopulation
growth
Limitedproductivecapacity or
PPF
Low levels ofsaving andinvestmentlead to the
poverty cycle
Rich countriesoften restrict
trade bysubsidies and
tariffprotection
Possiblehistoricalproblemsincluding
colonialism
Redistributeincome andwealth moreequitably—
to narrow thegap
Reform ofgovernment
throughdemocracy
and freedomof speech
Controlrapid population
growth(e.g. improvedhealth, welfare,
education)
Growproductivecapacity or
PPF(especiallyincreasedef�ciency)
Boost savingand access toinvestment
funds—breakthe poverty
cycle
Pressurerich
countries toadopt freetrade/trade
liberalisation
Measurement of economic development
Many causes of poverty in low-income countries
Strategies to promote economic growth and development
Used to be de�ned or seen as the same thing as economic growthNowadays seen more broadly as social, economic, political andinstitutional changes needed to improve both material andnon-material aspects affecting the wellbeing of ordinary people.
Economic development
Development economics
A specialised branch or area of EconomicsLooks at strategies to accelerate economicdevelopment in low-income countries
Average GDP per capitais the average value of goods andservices (or incomes) produced bya country in a year.Weakness include unrecorded subsistence output inequlity in distribution negative externalities/costs poor re�ection of the quality of people’s daily lives.
Measures used for themillennium developmentgoals (MDGs)
Eight categories and 60indicators usedDif�culty making comparisonsacross countries since thereare many indicators(not just one).
Human development index(the UN’s, HDI)
Economic indicators (averageGDP per capita at PPP)Non-economic measures (lifeexpectancy and literacy rates)Index subjective and narrow.
Foreign aid Of�cial Unof�cial Loans Grants Other assistance
Current issues facing an Asian developing country—Vietnam, a case study
Transformed from a planned socialist economy to socialist-oriented market economy since 1986Rapid economic growth has brought improvements in material and non-material living standardsChallenges include in�ation, the current global recession, globalisation, infrastructure bottlenecks,access to energy, trade de�cit, corruption in government and an ageing population.
FIGURE 8.31
c08DevelopmentEconomics.indd 349 12/09/14 7:13 AM
UN
CO
RR
EC
TED
PA
GE
PR
OO
FS

350 economics down under book 1
Elective for Unit 2, Outcome 2An international economic issue selected by the teacher or studentsYou may recall that Unit 2, Outcome 2 of the course requires a study of any two of the contemporary global economic issues. These electives may be drawn from the following list of four topics:• Australia’s international economic relationships• Economic globalisation• Development economics• An economic issue selected by the teacher or students.Already the fi rst three of these electives have been covered in chapters 6, 7 and 8 of this text.
Check the VCAA Economics Study Design, 2010–16 for those wanting the freedom to explore the fourth elective — a global economic issue selected by the teacher or students.
Multiple-choice answersChapter 1 — Introduction: Australia, a market economic system
1C, 2B, 3C, 4C, 5D, 6A, 7D, 8C, 9B, 10A, 11D, 12C, 13C, 14D, 15A, 16B, 17D, 18A, 19A, 20B, 21B, 22C, 23D, 24D, 25D, 26A, 27A, 28D, 29B, 30C, 31B, 32A, 33D, 34A, 35A, 36AChapter 2 — Economic growth and sustainable development
1B, 2D, 3C, 4C, 5B, 6C, 7C, 8D, 9C, 10A, 11D, 12D, 13A, 14B, 15B, 16B, 17D, 18D, 19A, 20B, 21B, 22B, 23D, 24B, 25C, 26C, 27D, 28D, 29B, 30D, 31B, 32D, 33A, 34A, 35BChapter 3 — Australia’s infl ation as a contemporary economic issue
1C, 2D, 3B, 4D, 5C, 6C, 7C, 8A, 9B, 10B, 11C, 12A, 13A, 14B, 15B, 16BChapter 4 — Creation and distribution of income and wealth as a contemporary economic issue
1B, 2A, 3D, 4C, 5A, 6D, 7A, 8C, 9B, 10B, 11D, 12A, 13C, 14A, 15B, 16D, 17B, 18D, 19A, 20AChapter 5 — Population, employment and change
1C, 2D, 3B, 4D, 5B, 6A, 7A, 8C, 9B, 10D, 11A, 12C, 13A, 14B, 15D, 16D, 17A, 18D, 19D, 20BChapter 6 — Australia’s international economic relationships as a global economic issue
1C, 2D, 3C, 4C, 5C, 6C, 7A, 8C, 9D, 10D, 11B, 12C, 13D, 14B, 15A, 16A, 17C, 18A, 19B, 20CChapter 7 — Economic globalisation
1D, 2A, 3A, 4A, 5A, 6C, 7A, 8C, 9B, 10D, 11D, 12B, 13B, 14AChapter 8 — Development economics
1C, 2C, 3B, 4C, 5D, 6D, 7B, 8B, 9D, 10A, 11D, 12C, 13B, 14C
c08DevelopmentEconomics.indd 350 12/09/14 7:13 AM
UN
CO
RR
EC
TED
PA
GE
PR
OO
FS